THE ISOTOPIC AND CHEMICAL CHARACTERISTICS OF GEOTHERMAL FLUIDS … · KENYA [email protected] ;...
38
GEOTHERMAL TRAINING PROGRAMME Reports 2007 Orkustofnun, Grensásvegur 9, Number 15 IS-108 Reykjavík, Iceland 333 THE ISOTOPIC AND CHEMICAL CHARACTERISTICS OF GEOTHERMAL FLUIDS IN HENGILL AREA, SW-ICELAND: HELLISHEIDI, HVERAGERDI AND NESJAVELLIR FIELDS Marietta W. Mutonga University of Nairobi School of Physical and Biological Sciences Department of Geology P.O. Box 30197-00100, Nairobi KENYA [email protected] ; [email protected] ABSTRACT Results of geochemical and isotopic investigations in the Hengill geothermal area are presented. The area can be regarded as typical of Icelandic high temperature areas. It is mainly composed of pillow lavas and hyaloclastites, which were piled up during sub-glacial eruptions. Part of the area is traversed by a very active NE- SW trending fracture zone about 5 km broad, within which there are several eruptive fissures of postglacial age. The volcanic rocks are basalts of various kinds, but minor occurrences of intermediate and rhyolitic rocks have also been recorded. The study was based on chemical and isotopic analyses of fluid samples from Nesjavellir prior to production, and data collected in the years 2000-2007 from the productive geothermal fields. In addition, fluid samples were collected from the Nesjavellir and Hellisheidi fields during this study. These samples were analysed for chemical constituents and stable isotopes at the Institute of Earth Sciences, University of Iceland. The results indicate that the Nesjavellir and Hellisheidi thermal fluids do not share the same origin. In Nesjavellir the water comes from a distant source, the glacier Langjökull, whereas in Hellisheidi the water is of a more local origin. The isotopic composition of the thermal waters in Hellisheidi and Hveragerdi is very similar. According to the deuterium isotope values, fluids from well HE-1 in Hellisheidi (Kolvidarhóll-1) are closer in origin to the Nesjavellir thermal fluid than the fluids circulating the Hellisheidi system. It is suggested that the Hellisheidi system is younger than the Nesjavellir system, both by stable isotope and chemical composition of the thermal fluids (Cl-SO 4 -HCO 3 plot). In Nesjavellir the fluid is richer in 18 O and chemically more mature than in Hellisheidi, due to more intense water-rock interaction. An increase is observed in chloride and enthalpy in both the Nesjavellir and Hellisheidi fields due to increased utilisation. There is a pressure drop in both fields which causes boiling of the liquid phase which results in cooling, and hence a positive temperature gradient is created between the aquifer rock and the flowing fluid. Evidence of boiling is supported in both Nesjavellir and Hellisheidi by high CO 2 values.
Transcript of THE ISOTOPIC AND CHEMICAL CHARACTERISTICS OF GEOTHERMAL FLUIDS … · KENYA [email protected] ;...

GEOTHERMAL TRAINING PROGRAMME Reports 2007 Orkustofnun, Grensásvegur 9, Number 15 IS-108 Reykjavík, Iceland
333
THE ISOTOPIC AND CHEMICAL CHARACTERISTICS OF GEOTHERMAL FLUIDS IN HENGILL AREA, SW-ICELAND:
HELLISHEIDI, HVERAGERDI AND NESJAVELLIR FIELDS
Marietta W. Mutonga University of Nairobi
School of Physical and Biological Sciences Department of Geology
P.O. Box 30197-00100, Nairobi KENYA
[email protected] ; [email protected]
ABSTRACT
Results of geochemical and isotopic investigations in the Hengill geothermal area are presented. The area can be regarded as typical of Icelandic high temperature areas. It is mainly composed of pillow lavas and hyaloclastites, which were piled up during sub-glacial eruptions. Part of the area is traversed by a very active NE-SW trending fracture zone about 5 km broad, within which there are several eruptive fissures of postglacial age. The volcanic rocks are basalts of various kinds, but minor occurrences of intermediate and rhyolitic rocks have also been recorded. The study was based on chemical and isotopic analyses of fluid samples from Nesjavellir prior to production, and data collected in the years 2000-2007 from the productive geothermal fields. In addition, fluid samples were collected from the Nesjavellir and Hellisheidi fields during this study. These samples were analysed for chemical constituents and stable isotopes at the Institute of Earth Sciences, University of Iceland. The results indicate that the Nesjavellir and Hellisheidi thermal fluids do not share the same origin. In Nesjavellir the water comes from a distant source, the glacier Langjökull, whereas in Hellisheidi the water is of a more local origin. The isotopic composition of the thermal waters in Hellisheidi and Hveragerdi is very similar. According to the deuterium isotope values, fluids from well HE-1 in Hellisheidi (Kolvidarhóll-1) are closer in origin to the Nesjavellir thermal fluid than the fluids circulating the Hellisheidi system. It is suggested that the Hellisheidi system is younger than the Nesjavellir system, both by stable isotope and chemical composition of the thermal fluids (Cl-SO4-HCO3 plot). In Nesjavellir the fluid is richer in 18O and chemically more mature than in Hellisheidi, due to more intense water-rock interaction. An increase is observed in chloride and enthalpy in both the Nesjavellir and Hellisheidi fields due to increased utilisation. There is a pressure drop in both fields which causes boiling of the liquid phase which results in cooling, and hence a positive temperature gradient is created between the aquifer rock and the flowing fluid. Evidence of boiling is supported in both Nesjavellir and Hellisheidi by high CO2 values.

Mutonga 334 Report 15
1. INTRODUCTION Iceland is located on the junction of the Mid-Atlantic Ridge and the Greenland-Iceland-Faeroe Ridge, the former being a part of the global mid-oceanic ridge system. Iceland is regarded as being a hot spot above a mantle plume, and has been piled up through emission of volcanic material, created by rifting and crustal accretion through volcanism along the NE-SW axial rift zone. This is sometimes referred to as the neovolcanic zone (Figure 1). Currently, the plume channel reaches the lithosphere below the northwest part of the glacier Vatnajökull. The buoyancy of the Icelandic plume leads to dynamic uplift of the Icelandic plateau, and the high volcanic productivity over the plume produces a thick crust. The western part of Iceland lies west of the volcanic zones and belongs to the North American plate whereas the eastern part of Iceland belongs to the Eurasian plate. As new crust is created along the rift zone, old bedrock moves further from the plate boundary. Therefore, the oldest rocks exposed on the surface in Iceland and formed about 16 million years ago, occur in the easternmost and westernmost parts of the country. The active periods of volcanic systems have been found to vary from 300,000 to over 1 million years. They are preserved as entities in the volcanic pile, indicating that they grew, drifted off towards the margin of the volcanic zone and then became extinct. New ones replaced them over the more or less stationary deep-seated zone of magma generation (Saemundsson, 1967). The volcanic zone is connected to the Atlantic ridge across transform faults in both North and South Iceland. In SW-Iceland, the volcanic rift zone is divided into two separate parallel zones characterized by many fissures and fault swarms. The two branches are connected by the E-W trending South Iceland Seismic Zone (Saemundson, 1978). The Hengill area is located just north of a ripple junction where an oblique spreading ridge, tensional spreading axes and a major seismic zone meet. Geothermal areas in Iceland have been grouped into high-temperature and low-temperature areas (Bödvarsson, 1960; 1961). The high-temperature areas are confined to the active volcanic zones whereas the low-temperature areas are mainly found in the Tertiary and Quaternary rocks. The low-temperature areas are characterised by temperatures below 150°C at 1 km depth, whereas the high-
FIGURE 1: The Hengill area in relation to the volcanic rift zone of Iceland and the main rock types (Jóhannesson, H., pers. comm..)

Report 15 335 Mutonga
temperature areas are characterised by temperatures above 200°C at1 km depth. According to this classification, the Hengill geothermal area is a high-temperature area. It is a part of the volcanic rift zone in SW-Iceland, about 40 km east of Reykjavík. The geology is characterized by the active Hengill central volcano, the Hrómundartindur volcanic system and the extinct Hveragerdi volcanic centre hosting geothermal resources. Geology, geophysics, and drilling indicate a total resource area of around 110 km2 (Gunnlaugsson and Gíslason, 2005). The bedrock in the Hengill area is composed of basaltic lava layers, thick sequences of hyaloclastites, and vertical intrusions. Reservoir fluids are 240-330°C dilute water, low in total dissolved solids (TDS) and gas. The geothermal reservoirs are liquid dominated and temperatures commonly correspond to the boiling-point-with-depth profile. The Hengill area contains three geothermal fields which are currently being economically exploited for heating water and power production. These are Hellisheidi, Hveragerdi and Nesjavellir (Figure 2). In the Nesjavellir field, northeast of Mt. Hengill, 26 wells have been drilled. The depth of these wells ranges from 1000 to 2200 m and temperatures of up to 380°C have been recorded. The average thermal power from these wells is 60 MWt and 9 MWe. The total power production of the Nesjavellir power plant is 120 MWe and 1640 l/s of water at 83°C (Gíslason et al., 2005). In Hellisheidi, which is to the south of Mt. Hengill, 28 wells have been drilled to date to depths of 2-3 km; 25 of these are deviated wells mainly targeting volcanic fractures and graben boundaries. A power plant has been operating from 2006 in this field producing 90 MWe, and was increased to 120 MWe in late 2007 (Gíslason, G., pers. comm.). Hveragerdi is located some 50 km from Reykjavík and is on the southeast margin of the Hengill geothermal area. Numerous drillholes have been sunk in the area, mainly for space heating and greenhouses. Measured temperatures in this field range from 170 to 240°C. The harnessing of geothermal heat from the Hengill area has been going on for some decades. Steam and water samples have been taken several times during discharge periods to establish the chemical characteristics of the wells and to monitor any changes (Gíslason, G., pers. comm.). The present study is based on the analysis of fluid samples and on the results of previous work in the exploited geothermal fields. Chemical and isotopic evaluation of geothermal fluids within the Hengill area will be carried out to study if mixing of thermal fluid is taking place, to evaluate chemical characteristics of the thermal fluid, to determine subsurface fluid flow paths, the origin of geothermal fluids and temperature in the Hengill geothermal area and, furthermore to distinguish between and classify the thermal fluids in the fields. In doing so, it is hoped that the data can be used to monitor any possible changes due to production/ exploitation or otherwise, now and in the future. The main emphasis will be on geochemical trends.
FIGURE 2: Location of the main geothermal fields and wells drilled in the Hengill area

Mutonga 336 Report 15
2. GEOLOGICAL SETTINGS 2.1 The Hengill volcano A great deal of research work has been carried out in the Hengill area by different scientists on its geology, geophysics, geothermal activity and geochemistry. Saemundsson (1967; 1995) mapped the Hengill mountain and produced a 1:25,000 scale geological map. The bedrock in the Hengill area is composed of basaltic lava layers, thick sequences of hyaloclastites, and vertical intrusions. The Hengill mountain which is also the main expression of the Hengill central volcano rises about 500 m above its surroundings. The fissure swarm is over 50 km long trending N30-35°W and has a structure of a nested graben. Besides the major fissure swarm there are some faults and eruptive fissures transecting the centre of Mt. Hengill in a NW-SE direction towards the Hveragerdi system, i.e. perpendicular to the main tectonic trend. Nearly all high-temperature areas in Iceland are situated within an active central volcano or associated fissure swarm and hence are located in the volcanic rift zone. This indicates that the main heat source must be magmatic intrusions in the upper crust. Two NNE-WSSW striking volcanic fissures, which erupted and intersected the Hengill volcano 2,000 and 5,500 years ago, act as primary conduits for sub-surface fluid flow in both Hellisheidi and Nesjavellir. Normal faulting is extensive and strikes NNE-SSW expressed in a fractured 3–4 km wide graben that has proven highly productive when drilled into. Other fault directions are evident, such as N-S. The Hengill mountain was mostly accumulated in one or two large sub-glacial eruptions during the last glacial period. Recent geological data suggest that the lower part of the mountain may have formed during the second last glacial period (Fridleifsson, G.Ó., pers. comm.). Hyaloclastite tuft, a typical formation in Iceland, is fine, glassy debris formed by the sudden contact of hot and coherent magma with either cold water or water-saturated sediments, usually associated with glaciers. Rapid heat loss from the magma to the ice sets up tensile thermal stress in the magma carapace as it cools, chills and contracts, causing the glassy, chilled magma to fragment and form quenched fragmented debris. If the deposit remains in contact with water after its formation, the glassy debris may hydrate further to form palagonite. According to Saemundsson (1995), the oldest rocks outcrop in the southeast near the village of Hveragerdi being mostly hyaloclastites overlain by basalt flows, probably pre-dating the last glaciations. Shield volcanoes of last interglacial age are located east and west of Lake Thingvallavatn. Hyalocalstites and pillow lavas forming ridge-shaped mountains, the product of subglacial fissure eruptions, occur to the west and north clearly overlying the oldest layers. These date back from the last glacial period, but may span a wide range within those limits. The Hengill area is one of the largest high-temperature areas in Iceland, extending over some 50 km2. The geothermal activity is believed to be connected to three volcanic systems (Figure 3) (Saemundsson, 1995):
1) The Grensdalur system is the oldest and gives heat to the Hveragerdi field; 2) North of this is a volcanic system named after Mt. Hrómundartindur, which last erupted about
10,000 years ago. The geothermal area in Ölkelduháls is connected to that system; and 3) West of these volcanic systems lies the presently active Hengill volcanic system, with intense
tectonic activity and NE-SW trending volcanic fractures and faults extending from Lake Thingvallavatn to Nesjavellir and further to the southwest through Innstidalur, Kolvidarhóll, Hveradalur and Hellisheidi (Saemundsson, 1979). The area is almost entirely built up of volcanic rocks of late Quaternary and postglacial age (Saemundsson, 1995). These are mostly basalt flows and hyaloclastites but small amounts of intermediate rocks and rhyolites occur as well.
A seismic study in the Hengill area between 1993 and 1997 registered nearly 24,000 earthquakes exceeding 0.5 on the Richter scale, 12,000 of these occurred in 1997 (Sigmundsson et al., 1997) . The largest earthquake in recent times registered 5.3 on the Richter scale and occurred in June 1998. The

Report 15 337 Mutonga
earthquakes seem to have reactivated the geothermal manifestations in the area causing the emergence of new geothermal ones in new areas or the rejuvenation of extinct ones (Natukunda, 2005). From Hengill, there is a lineation of surface manifestations extending southeast from Nesjavellir towards the village of Hveragerdi. It coincides with a low-resistivity anomaly connecting the Hengill area and the extinct Grensdalur central volcano. It shows an anomaly perpendicular to the main fissure swarm and parallel to the transverse lineament in the Hengill system (Björnsson et al., 1986). 2.2 Alteration of the rocks Within high-temperature geothermal areas the reaction of the original rocks with hot water or steam results in a complex series of devitrification, recrystallization, solution and deposition reactions which are referred to as hydrothermal rock alteration. The end products of hydrothermal alteration depend on many factors, such as: temperature, pressure, water composition, time of reaction, rate of water and steam flow, and permeability of the rocks, whether permeability is of fissure type or bulk porosity type. In most geothermal areas, hydrothermal alteration zones are observed with increasing depth, temperature, porosity, and changing chemical conditions. In the Icelandic geothermal systems, glass and olivine are the first minerals that alter, at temperatures about 50°C; and at temperatures above 200°C both of them are usually completely altered (Franzson, 1998) (Figure 4).
Rock temp . ( аC) Alteration zones Rock alteration
150
200
250
50
100
300
350
Relativelyunaltered
SmectiteZeolites
Mixed -layer clay mineralsChloriteChlorite Epidote
EpidoteActinolite
Amphibole
Glass Olivine
Alteration begins
Totalalteration
Oresphene
EpidoteSphene
Wairakite
Albite
Chlorite fractures
Plagioclase
FIGURE 4: Alteration in the Hengill geothermal system (Franzson, 1998)
FIGURE 3: Tectonic settings and volcanic systems within the Hengill area (Árnason et al., 1986)

Mutonga 338 Report 15
Rocks in the Hengill geothermal area have been affected by hydrothermal alteration. In Mt. Hengill, acid leaching is usually more or less restricted to steam fields, which are characteristically located on faults. The hyalocalstites in these areas show an extensive alteration of palagonite and clay minerals, mostly smectite. In the oldest rocks north of Hveragerdi, an area about 3 km in diameter shows a regional alteration to pale green colours due to chloritization. Calcite and pyrite are abundant secondary minerals in this zone. The boreholes near Hveragerdi show, according to Sigvaldason (1963), a distinctive secondary mineral zoning. Well HE-22 is an exploratory well drilled in the Ölkelduháls field, situated on the eastern flank of the Hengill volcanic and geothermal complex. The intercepted rock succession consists of hyaloclastite formations and lava flows of basaltic composition as well as minor intrusive rocks. The formations host a wide variety of secondary hydrothermal assemblages from low- to high-temperature minerals. Four main alteration zones have been identified. These are: the smectite-zeolite zone (<200°C) at <170 m; the mixed-layer clay zone (200-230°C) from 170 to 206 m; the chlorite zone (230-240°C) from 206 to 364 m; and the chlorite-epidote zone (>240°C) from 364 to 740 m. The relationship of time and mineral crystallisation indicates formation from low-temperature alteration at shallower levels to high-temperature alteration in the deeper part of the well (Pendon, 2006). HE-11 is a 1652 m deep well in the Hellisheidi high-temperature field to the south of Mt. Hengill. The lithology comprises predominantly volcanic rocks of basaltic composition that include lava flows and sub-glacial hyaloclastites formations. Several basaltic intrusions intrude the hyaloclastites. Hydrothermal alteration also indicates four alteration zones in this well: The uppermost part of the well is characterised by no alteration down to 486 m. The first zone is characterised by smectite and zeolites and is situated at 486-700 m with temperatures less than 200°C; the second alteration zone is a mixed-layer clay zone at a depth at 700-756 m with the alteration temperature range 200-230°C. The third is the chlorite zone (756-950 m) with the temperature range 230-250°C; and the fourth the chlorite-epidote zone (>950 m) with temperatures >250°C. The time related mineral deposition sequence shows a geothermal system undergoing a progressive temperature increase over time (Hartanto, 2005). In Nesjavellir well NJ-20 four alteration zones were found: the smectite-zeolite zone (from top to 360 m); the mixed-layer clay zone (360-820 m); the chlorite-epidote zone at 820-940 m and 1010-1180 m; with the epidote-actinolite zone in between at 940-1010 m (Nouraliee, 2000). In geothermal fields in Iceland, the same zoning sequence is observed; the only difference is the depth at which the alteration occurs (Kristmannsdóttir, 1979). 3. USE OF ISOTOPES AND CHEMISTRY IN GEOTHERMAL INVESTIGATION Geochemistry, including isotope geochemistry, has greatly contributed to the present understanding of geothermal systems. Ellis and Mahon (1977) suggested that the detection of even small changes in the chemical composition of a geothermal fluid enables a precise assessment of the long term stability of the field. The chemical and isotopic composition of geothermal fluid components provides information on their origin, their recharge area and flow patterns, and may allow an evaluation of subsurface temperatures. In addition, cooling processes of the fluid during the ascent to the surface, due to heat conduction, admixture with cold water, or steam losses, can be studied by means of the changes in the chemical and isotopic composition of the geothermal fluid. 3.1 Natural isotopes Isotope techniques are a valuable tool in geothermal prospecting as well as for studying the evolution of geothermal fields as a consequence of production. Among the various isotopes, the variations in

Report 15 339 Mutonga
stable isotopes of oxygen, hydrogen and carbon provide the most useful information. In this study both hydrogen and oxygen isotopes will be used. In the discussion of isotopic techniques for geothermal waters, the following terminology is used for geothermal water:
Meteoric water: Water of any age that originated as precipitation, such as rain, snow, polar ice, rivers, lakes and most groundwater, circulates in the uppermost 2-3 km of the earth. Magmatic water: Water that has equilibrated with magma, regardless of its origin. Juvenile water: Water from the earth´s mantle core that has never been involved with the hydrosphere.
In earlier times, the origin of water in high-temperature geothermal systems had puzzled geochemists. No geochemical tools were then available to identify it and the most generally accepted theory was that the water was, at least partially, of magmatic and or juvenile origin, i.e. water ascending to the crust through the mantle. After the development of isotopic methodology, Craig (1963) showed the probable meteoric origin of geothermal waters by measuring the hydrogen and oxygen isotopic composition of water and steam from geothermal fields. He assumed that juvenile water has uniform, albeit an unknown, D/H ratio. He pointed out that at any rate it can certainly be assumed that the isotopic composition of such water is completely independent of the isotopic composition of precipitation on the earth´s surface. No one has been able to prove that juvenile water exists. An important aspect of geothermal investigation is to determine the recharge to geothermal systems. Craig (1963) established the isotopic characteristics (δ2H and δ18O) of precipitation in relation to latitude and elevation as well as to continental effects. Samples from higher latitudes and elevation or those collected further inland were progressively lighter (more negative values of δ). δ denotes the relative difference in the ratio of the heavy isotope to the more abundant light isotopes of the sample with respect to a reference standard. This is defined as follows:
δsample = (Rsample–Rstd /Rstd) 1000‰ (1) where the R´s are the 18O/16O or 2H/H1 concentration ratios of the sample and a standard (std). Positive values show the samples to be enriched in the heavy-isotope species with respect to the reference standard; negative values correspond to samples depleted in the heavy isotope species compared to the standard. As the difference between samples and reference standard are usually quite small, it is convenient to express the δ-values in “per mille”. The instrument used to measure isotopes is the mass spectrometer. It can detect the tiniest differences in the mass of atoms and molecules (a speck of a difference in mass). A mass spectrometer consists of a tube in which high vacuum is maintained, with an ion source placed at one end of the tube and ion collectors at the other end. Figure 5 shows how a mass spectrometer works. Ions (atoms or molecules without their normal number of electrons) are shot past a strong magnet and their paths are bent by its magnetic field. The smaller the mass of the ion, the more its course is bent, and the greater the mass the less it is deflected from its path. The two isotopes are separated and counted. The illustration in Figure 5
Beam of ions
Powerful magnet
Detector
The isotopes are seperated by a difference
in mass
Ligh
t
Hea
vy
FIGURE 5: The basic layout of a mass spectrometer

Mutonga 340 Report 15
explains how the different molecules are separated and counted. A sample of water would have millions of light ions for each heavy ion. One of the most serious problems in stable isotope studies is the comparison of results obtained by different laboratories. Results are usually reported in δ (‰) with respect to a common international reference standard. Thus, a correct calibration of reference samples is used by different laboratories in routine measurements with respect to international standards, necessary for inter-comparison of results. The standard almost universally adopted as a reference for oxygen and hydrogen stable-isotope variations in natural waters is the VSMOW – Vienna Standard Mean Ocean Water (Gionfantini, 1978). In any geothermal area, areal variations in the isotopic composition of the discharged fluid (water and/or steam) are generally observed. Rain water infiltrates the permeable outcrops, and springs and wells, fed by this water before any appreciable exchange between water and rocks takes place, will reflect its meteoric origin. In low-temperature geothermal systems the rate of the oxygen isotope exchange reaction between water and minerals is very low. As a consequence, a long contact time is needed to change the water isotopic composition to a detectable extent. Equilibrium will generally not be reached during long residence times in the reservoir. At higher temperatures the 18O/16O ratio can change considerably, as a consequence of isotopic exchange with the rocks constituting the geothermal reservoir. For oxygen isotopes, the extent of exchange depends on the relative proportions of oxygen in the water and in the rocks, on the initial 18O contents and on specific water mineral fractionation factors (which are temperature dependent), and on time and extent of surface contact. The exchange process, which is commonly referred to as an oxygen shift, is usually negligible at low temperatures owing to its very slow rates and is greatly accelerated at the high temperature of geothermal fields, with the result that the 18O content of water increases while that of rock decreases (Panichi et al., 1974). As basaltic rocks contain very little hydrogen, there is hardly any hydrogen isotope exchange between rock and water and, therefore, the deuterium value for thermal water still characterizes that of the original fluid. During the rise of a high-temperature (>100°C) geothermal water, its vapour pressure will at some stage exceed hydrostatic pressure and it will start to boil. These vapour separation processes are accompanied by isotopic fractionation with the heavier isotopes, deuterium and Oxygen-18, portioning into the liquid phase; the separated vapour phase becomes depleted. For deuterium this is true only to about 220°C; at higher temperatures it partitions preferentially into the vapour phase. Because of the rapid rate of isotopic equilibration between water and steam underground liquid-dominated systems were found to correspond effectively to the single step process (Giggenbach, 1988). In this case, the composition of separated vapour, δv and liquid δl, is related to the total discharge composition through the mass balance:
δd = (1-y) δl +ydv (2)
where y is the fraction of steam formed, which may be obtained from:
y = (Hd-Hl) /(Hv-Hl) (3) where Hd, Hv and Hl are the enthalpies of total discharge, separated vapour and separated liquid at the separation temperature, respectively. The world meteoric water line, also known as GMWL (Global Meteoric Water Line), δD =8(δ18O)+10 (Craig, 1961) gives approximate composition of precipitation on earth (Figure 6). The arrow to the right shows the effects of extensive water rock interaction at high temperatures (i.e. oxygen shift). This happens because the water exchanges oxygen with the host rock which has relatively heavy isotopic ratios compared to the water. Hydrogen is less affected by this process because there is so

Report 15 341 Mutonga
much more hydrogen in water than in the rocks. In Iceland the δ18O - δD relationship of the cold groundwater has been defined as (Sveinbjörnsdóttir et al., 1995):
δD = 6.5 δ18O – 3.5 for δ18O ≥ -10.5‰; δD = 8 δ18O + 11 for lighter precipitation.
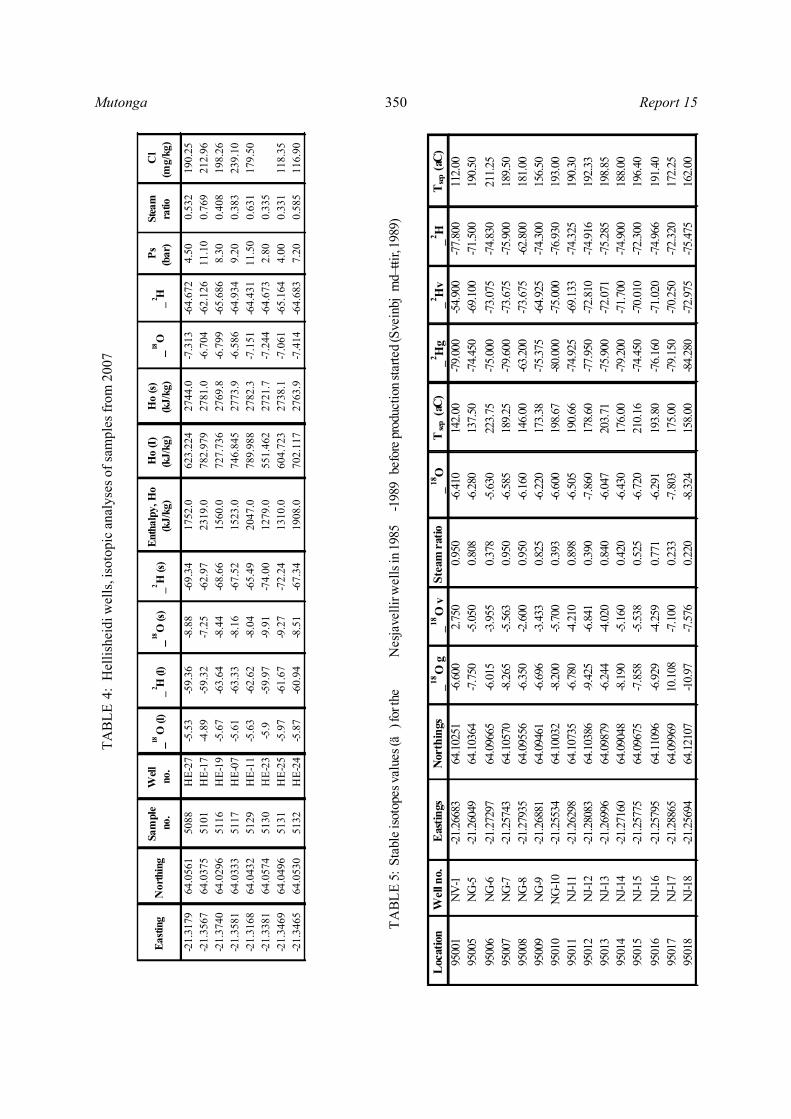
The correlation coefficient is 0.97 for both lines. Árnason (1976) showed how the deuterium values in precipitation in Iceland generally decreased from the coastal areas inland. The highest values were found in the coastal areas: -50‰ on the south coast and -66‰ on the north coast. The lowest values were found in north central Iceland -106‰ in the northern part of the Vatnajökull ice cap (Figure 1). By his measurements he showed that all ground waters in Iceland are meteoric. However, the deuterium content of cold and hot spring water is often different from the deuterium content of the local precipitation. By comparing the results obtained and Árnason’s deuterium map of present precipitation in Iceland (Árnason, 1976) it is often possible to deduce where the spring water might have fallen as precipitation and therefore determine its flow path from recharge to discharge areas. 3.2 Cl-SO4-HCO3 diagram Giggenbach (1991) proposed a SO4-Cl-HCO3 ternary diagram for the initial classification of geothermal solutions to identify whether the geothermometers are applicable for the given water sample, as most solute geothermometers work only for neutral waters. According to Giggenbach (1991), solute geothermometers can only be applied to what is referred to as “mature waters”, characterized by high Cl and low SO4. This diagram is also helpful in providing an initial indication of mixing relationships or geographic groupings. The position of a data point in such a triangular diagram is obtained by first obtaining the sum S of the concentrations of all three constituents involved. In the present case:
S = CCl + CSO4 + CCHO3 (4) The next step consists of the evaluation of % Cl, %SO4 and %HCO3 according to the following:
%Cl = 100 CCL/S; %SO4 = 100 CSO4/S; %HCO3 =100 CHCO3/S (5)
-15 -10 -5
δ18O
-100
-80
-60δ2
H
Global meteoric waterline
FIGURE 6: The global meteoric waterline
Mutonga 342 Report 15
The degree of separation between data points for high chloride and bicarbonate waters gives an idea of the relative degree of interaction of CO2 charged fluids at lower temperatures, and the HCO3 contents increasing with time and distance travelled. 3.3 Geothermometry Temperature sensitive equilibria between minerals, geothermal solutions and, in some cases, a vapour phase can affect the chemical composition of a geothermal fluid, providing the basis for chemical geothermometry. Chemical geothermometers are normally applied to thermal springs, steam vents, and geothermal wells for inferring reservoir temperatures in geothermal exploration and exploitation. The most widely used geothermometers are based on silica concentrations, cation ratios (mainly Na/K). Selected geothermometers of these types are described below. 3.3.1 Silica geothermometers Temperature-sensitive quartz solubility controls the silica concentration in geothermal fluids in high-temperature geothermal systems. Considerable efforts have been made to measure the quartz solubility and interpret the silica concentrations in thermal springs and geothermal wells. Morey et al. (1962) and Fournier and Rowe (1962) plotted the logarithm of the concentration of dissolved silica versus the reciprocal temperature for quartz and various phases of silica, respectively. They discovered that the data fell along a straight line over the temperature range 20-250°C. Fournier presented the first geothermometer in equation form (Fournier, 1977) and later with his co-workers (Fournier and Potter, 1982) derived a polynomial equation for the quartz geothermometer that estimates temperature up to 330°C. The Fournier and Potter (1982) quartz geothermometer is based on several assumptions, including that the fluid is in equilibrium with quartz in the reservoir, the vapour pressure of pure water fixes the pore fluid pressure in the reservoir, there is no mixing of hot and cold water during upflow, and lastly there is either conductive cooling of the ascending water or adiabatic cooling with steam separation at 100°C (Fournier, 1991). The quartz geothermometer of Fournier and Potter (1982) has been widely used. Later, various silica geothermometers have been developed to assess reservoir temperatures from the silica content of natural water in equilibrium with either quartz or chalcedony. Temperatures predicted by these geothermometers are referred to as quartz- and chalcedony temperatures, respectively (Arnórsson, 2000). Generally speaking, the quartz geothermometer is applied in high-temperature reservoirs, and the chalcedony geothermometer in low-temperature reservoirs. The SiO2 geothermometer is normally based on a polynomial function describing experimentally determined silica solubility as a function of temperature (Fournier and Potter, 1982). The basic principle reaction describing silica solubility is: where SiO2-solid is either quartz or chalcedony and SiO2-aq refers to aqueous silica. At pH levels below ~9, nearly all dissolved silica is present in solution as undissociated silicic acid, H4SiO2. At higher pH levels, the silicic acid dissociates to form H3SiO4-, thus effectively increasing the solubility of silica in water in equilibrium with quartz. Therefore, very high pH levels can lead to over estimation of the reservoir temperature if aqueous speciation of silica is not considered. Several geothermometers have been developed as more experimental data has become available (e.g. Gunnarsson and Arnórsson, 2000). Verma and Santayo (1997) have recently developed a new silica geothermometer based on statistical treatment of earlier experimental data. Their new geothermometer is proposed through detecting an outlier and rejecting one sample from the data set of Fournier and Potter (1982). The quartz geothermometer was tested experimentally over the temperature range from 100 to 500°C and pressure of 1000 bars, performed well up to 400°C without any effect of fluid composition (Pope et al., 1987). However, Verma (2000) criticized the use of the quartz geothermometer, especially its discrepancy at high temperatures arising from the incoherence between the theoretical and experimental solubility data. The silica geothermometers equations used to calculate the temperature of a reservoir are as follows:

Report 15 343 Mutonga
Quartz, no steam loss, temperatures between 25 and 250°C (Fournier, 1977):
° .
273.15 (6) Quartz, maximum steam loss at 100°C, temperatures between 25 and 250°C (Fournier 1977):
° . L S
273 . 15 (7) Quartz, 25-900°C (Fournier and Potter, 1982):
T(°C) = - 42.2 + 0.28831 S – 3.6686 ×10⁻⁴ S2 + 3.1665×10⁻⁷ S3 + 77.034 log S (8) Quartz, after adiabatic boiling to 100°C (Fournier and Potter, 1982):
T(°C) = - 53.5 + 0. 11236 S – 0.5559×10⁻⁴ S2 + 0.1772×10⁻⁷ S3 + 88.390 log S (9) Quartz, 0-350°C (Arnórsson, 2000):
T(°C) = - 55.3 + 0.36590 S – 5.3954×10⁻⁴ S2 + 5.5132×10⁻⁷ S3 + 74.360 log S (10) Quartz, after adiabatic boiling to 100°C (Arnórsson, 2000):
T(°C) = - 66.9 + 0.13780 S – 4.9727×10⁻⁵ S2 + 1.0468×10⁻⁸ S3 + 87.841 log S (11) Quartz, for the temperature range 20-210°C (Verma and Santayo, 1997):
T(°C) = - 44.119 + 0.24469 S – 1.7414×10⁻⁴ S2 + 79.305 log S (12) Quartz, for the temperature range 210-310°C (Verma and Santayo, 1997):
T(°C) = 140.82 + 0.23517 S (13)
Chalcedony, 0-250°C (Fournier, 1977): °
. 273.15 (14)
Chalcedony (Arnórsson et al., 1983):
° .
273.1 (15)
where S refers to the concentration of SiO2 in ppm and T is the temperature. 3.3.2 Cation geothermometers Cation geothermometers are commonly used to estimate reservoir temperatures. Of the cation geothermometers, the Na-K geothermometer is most widely used. The Na-K ratio was initially used to identify the upflow zone of a geothermal system, where the lowest values are observed at the centre of the upflow zone (Ellis and Wilson, 1960). Since then, this method has evolved to an increasingly more precise calibration of the temperature dependence of the Na/K ratio, resulting in the calibration of the Na/K geothermometer. The partitioning of sodium and potassium between aluminosilicates and aqueous solutions is strongly temperature dependent. This is generally interpreted as a result of equilibrium between Na- and K-feldspars and the aqueous solution, described by the reaction:

Mutonga 344 Report 15
K + Na-feldspar = K-feldspar + Na+ The Na-K geothermometer generally gives consistent results for near neutral pH of geothermal waters that have low calcium content, (√Ca/Na) < 1. The Na/K geothermometers are generally in agreement with quartz geothermometers but sometimes they yield rather high results. Solute geothermometers, including those based upon silica solubility and Na/K and K2/Mg ratios (Giggenbach, 1988) are ideally applied to chloride springs but are considered less reliable when applied to low-chloride springs. Based on this principle, various Na/K cation geothermometers have been developed and applied to geothermal exploration (e.g. Fournier and Truesdell, 1973). Nieva and Nieva (1987) presented a geothermometer based on cation exchange and argued that the geothermometer is able to predict the reservoir temperature, based on the composition of relatively dilute hot-spring waters. Recently, a new Na/K geothermometer was developed purely on an empirical basis and calibrated from field data (Can, 2002). The cation geothermometers considered in this study are listed below. Na, K, and Ca refer to the concentrations of these cations in solution in ppm: Truesdell (1976) for 100-275°C:
°
. 273 . 15 (16)
Tonani (1980):
°.
273. 15 (17)
Arnórsson et al. (1983) for 25-250°C :
°.
273.15 (18)
Arnórsson et al. (1983) for 250-350°C:
°.
273.15 (19)
Fournier (1979):
° .
273.15 (20)
Nivea and Nieva (1987):
°
.273.15 (21)
Giggenbach et al. (1983):
°
. 273.15 (22)
Can (2002):

Report 15 345 Mutonga
°. .
76 (23)
Fournier and Truesdell (1973):
° √ . .
(24)
where β = 4/3 for T<100°C; and β =1/3 for T > 100°C. The Na, K, Ca, and Mg total contents, as well as the Na2/Mg and Na2/Ca ratios, are mainly controlled by ionic salinity and are, therefore, hardly suitable for geoindicators (Chiodini et al., 1991). The experimental work of Pope et al. (1987) showed that the Na-K-Ca geothermometer performed well in 0.1 M NaCl solution, but did not work well for experiments using 0.01 M NaHCO3. They concluded that the Na-K-Ca ratio is controlled by alteration reactions, i.e. by base exchange involving clays and mica rather than feldspar equilibria. 3.4 The Na-K-Mg ternary diagram The Na-K-Mg ternary diagram (Giggenbach,1988) can be used to classify waters into full equilibrium, partial equilibrium and immature waters (dissolution of rock with little or no chemical equilibrium). The full equilibrium curve is for reservoir water composition corrected for loss of steam owing to decompressional boiling. Uncorrected boiled waters will generally plot slightly above the full equilibrium line. The diagram can be used to better clarify the origin of the waters, and then determine whether the fluid has equilibrated with hydrothermal minerals and to predict the equilibrium temperatures, TNa-K and TK-Mg. The diagram is based on the temperature dependence of the three reactions:
K-feldspar + Na+ = Na-feldspar + K+
2 albite + 0.8 K-feldspar + 1.6 H2O + Mg2+ = 0.8 mica + 0.2 chlorite + 5.4 silica + 2 Na+
2.8 K-feldspar + 1.6 H2O + Mg2+ = 0.8 mica + 0.2 chlorite - 5.4 silica + 2 K2+
A large number of samples can be plotted simultaneously on this diagram, and mixing trends and grouping predicted. The sum is calculated as:
1000 100
Then the %Na”, %K” and %Mg”, can be calculated as:
%Na ; %K and %Mg where C is in mg/l. The geothermometer equations used for evaluation of the temperatures in the Na-K-Mg system are Equation 22 for Giggenbach’s (1988) data, or Equations 18 and 19 for Arnórsson et al.’s (1983) data with
TK-Mg (°C) = 4410 / (14.0 – log (K2/Mg) - 273.15 (25)

Mutonga 346 Report 15
where Na, K and Mg refer to the concentrations of the respective cations. Evaluation of analytical data for Na, K and Mg using the ternary diagram allows a clear distinction to be made between waters suitable or unsuitable for the application of ionic solute geothermometers. 3.5 Mineral saturation Evaluation of chemical equilibria between minerals and aqueous solutions in natural systems requires determination of the activities of aqueous species and knowledge of the solubilities of the minerals present in the bedrock. Assumption of specific mineral-solution equilibria is necessary to use in applying geochemistry to obtain an understanding of various physical features of a geothermal system. In this study, the WATCH chemical speciation program (Arnórsson et al., 1982), version 2.1A (Bjarnason, 1994), was used to calculate aquifer water compositions from the analytical data for some water and steam samples collected at the wellhead. The saturation index of several minerals is computed as a function of temperature and if the saturation indices of the minerals converge to zero (saturation) at a specific temperature, that temperature is taken to represent the reservoir temperature. However, it is to be noted that care should be taken in interpreting the results of multi-mineral/solute equilibria, as the results depend on both the thermodynamic data base used for mineral solubilities and the activities of end-member minerals in solid solutions (Tole et al., 1993). Using the results of the aqueous speciation calculations, the saturation indices (SI) of minerals in aqueous solutions at different temperatures were computed as:
SI = log Q − log K = log Q/K where Q is the calculated ion activity product (IAP) and K is the equilibrium constant. The SI value for each mineral is a measure of the saturation state of the water phase with respect to the mineral phase. Values of SI greater than, equal to, and less than zero represent supersaturation, equilibrium and undersaturation, respectively, for the mineral phase with respect to the aqueous solution. Equilibrium constants for mineral dissolution often vary strongly with temperature. Therefore, if the SIs with respect to several minerals converge to zero at a particular temperature, that temperature is taken to be the reservoir temperature. For the WATCH calculations of aquifer water compositions, it was assumed that the cause of the excess enthalpy was phase segregation in the producing aquifer (Arnórsson, 2000; Gudmundsson and Arnórsson, 2005). 4. SAMPLING AND ANALYTICAL METHODS Sample collection, chemical analysis and data interpretation are the three main steps involved in geochemical studies of geothermal fluids. A brief description of the sampling techniques, sample treatment and analytical techniques adopted here is given in this section. For detailed sampling and analytical techniques, see Paces (1991), Arnórsson (1991), Ármannsson and Ólafsson (2006) and Pang and Ármannsson (2006). 4.1 Sampling The types of samples used in this study are water samples from hot water wells and water samples from wet-steam water wells. The collection of representative gas samples from a discharging well involves the collection of dry gas (non-condensable gases), condensate, steam (in NaOH solution) and hot water. It should be conducted with the aid of a Webre separator and a cooling device. Great care should be taken to separate steam completely from liquid.

Report 15 347 Mutonga
Sample treatment is specific for particular analytical methods. Usually, the water samples were collected in several fractions:
Ru samples are raw and untreated for CO2 and H2S analysis; Rd samples are raw and diluted on site with de-ionised water to bring SiO2 <100 ppm for analysis; Fu samples are filtered and untreated for anion analysis; Fp samples are filtered and precipitated for SO4 analysis; Fa samples are filtered for cation analysis.
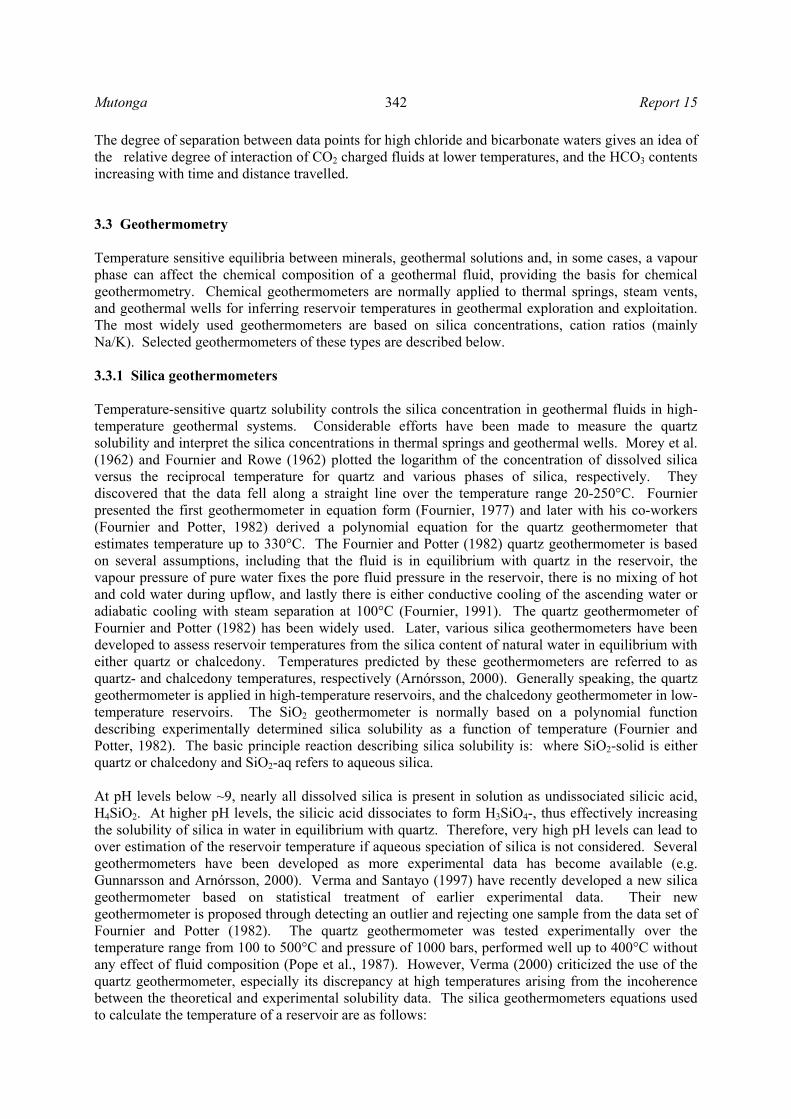
Samples for isotope analysis were collected in 60 ml bottles; they were also raw and untreated. 4.2 Analytical methods The analytical methods used to obtain the data for the report are presented in Table 1. All chemical data are reported in the relevant sections. 5. CHEMICAL AND ISOTOPIC CHARACTERISTICS OF THE THERMAL FLUIDS The results presented here are based on several analyses of fluid samples and on the results of previous work. Table 2 shows the data from 2000-2007 from the Nesjavellir geothermal field, while Table 3 shows similar data from the Hellisheidi geothermal field. The fluid samples, collected between July-August 2007, were also analysed for stable isotopes at the University of Iceland using the “Delta-V-Advantage thermo” mass spectrometer. The results are shown in Table 4. Chemical data on the thermal fluids from Hveragerdi and Nesjavellir collected and analysed in the years 1980-1990 is from the ÍSOR database. Chemical and isotopic data have been compiled and contoured on maps in order to study the chemical and thermodynamic properties of the field. 5.1 The Nesjavellir geothermal field 5.1.1 Stable isotopes before production started In the years 1985-1989 stable isotope measurements were performed on hydrothermal fluids from 15 wells in the Nesjavellir area (Sveinbjörnsdóttir, 1989). The measurements were carried out using the Finnegan MAT 251 mass spectrometer at the Science Institute, University of Iceland. The results are shown in Table 5. Production from the Nesjavellir field had not started at that time. Figure 7 shows a graph for δ2H vs. δ18O for the thermal fluid at Nesjavellir using only data from the 1980s. The figure demonstrates a considerably larger oxygen shift for wells located east of the youngest eruption fissure with a mean δ18O value of -6.5‰ than for wells situated west of the fissure where the mean δ18O value is -8.0‰. No difference was observed in the δ2H values in wells east and west of the fissure with the mean value of -75‰, indicating the same fluid to be present within the whole production area. This value for the deep circulating fluid in the Nesjavellir area is considerably lighter than that of the local precipitation, estimated of about -60‰ (Sveinbjörnsdóttir and Johnsen, 1992), indicating a
TABLE 1: Analytical methods for geothermal fluids
Composition Sample fraction Methods of analysis
CO2 Ru Alkalinity-titration H2S Ru Titration SiO2 Rd Spectrophotometry Na Fa Atomic absorption spectrometry K Fa Atomic absorption spectrometry Ca Fa Atomic absorption spectrometry F Ru Ion selective electrode Cl Ru Ion chromatography SO4 Fp Ion chromatography Al Fa Atomic absorption spectrometry Fe Fa Atomic absorption spectrometry δ18O, δD Ru Mass spectrometry pH Ru Ion selective electrode

Mutonga 348 Report 15
W
ell
no.
Dat
e Sa
mpl
e no
.Ps
(b
ar)
Av.
Ps
(bar
)T
s (аC
)H
opH
/аCC
O2
H2S
SiO
2N
aK
Ca
Mg
SO4
Cl
F
NG
-516
.3.2
000
5048
15.8
15.8
1900
.08.
5924
.056
.785
.369
4.8
152.
227
.80.
260.
0118
.911
4.7
1.0
NG
-64.
10.2
000
5095
16.2
16.0
195.
222
35.0
8.36
22.0
66.9
773.
014
3.3
27.5
0.18
0.00
198.
0N
G-6
27.8
.200
450
9215
.821
93.0
8.75
21.8
17.8
51.1
636.
915
4.5
29.3
0.28
0.01
167.
50.
7N
G-7
25.2
.200
050
4415
.515
.010
50.0
9.18
20.2
56.2
96.4
662.
016
5.2
27.4
0.38
0.00
44.1
113.
01.
3N
G-7
7.6.
2006
5085
13.7
1343
.09.
0223
.670
.991
.767
2.9
173.
230
.60.
560.
0215
.611
3.7
NG
-10
25.2
.200
050
4515
.515
.511
40.0
9.36
21.3
32.0
75.3
715.
016
3.3
29.1
0.35
0.01
2112
1.6
1.7
NJ-1
116
.3.2
000
5049
15.8
15.5
1900
.08.
7624
.120
.812
1.0
764.
713
3.4
23.8
0.39
0.00
54.2
75.5
1.1
NJ-1
128
.9.2
000
5094
15.5
192.
822
47.0
9.08
22.0
14.6
111.
080
4.0
145.
524
.60.
410.
0267
.5N
J-13
4.10
.200
450
9316
.616
.619
6.6
1936
.08.
7122
.116
.162
.270
0.6
141.
228
.10.
140.
0215
2.6
0.9
NJ-1
44.
2.20
0050
1815
.515
.014
00.0
9.27
23.0
26.0
43.6
716.
016
2.8
30.2
0.27
0.00
22.7
206.
71.
3N
J-14
22.7
.200
351
1714
.019
0.7
1195
.09.
322
.721
.932
.570
7.1
163.
730
.20.
30.
003
232.
1N
J-16
16.3
.200
050
5016
.214
.116
50.0
8.86
24.2
27.4
138.
072
0.0
148.
226
.70.
350.
0088
.511
5.0
1.2
NJ-1
69.
11.2
000
5097
4.3
153.
415
20.0
17.6
112.
079
1.0
154.
727
.20.
340.
0194
.0N
J-16
12.6
.200
650
8614
.117
84.0
8.82
23.1
44.5
124.
069
7.6
160.
329
0.5
0.02
33.7
88.6
NJ-1
94.
5.20
0050
7016
.220
00.0
8.05
22.0
11.0
67.6
815.
311
9.1
25.1
0.09
0.00
58.8
116.
31.
1N
J-19
8.2.
2002
5034
17.4
199.
819
93.0
8.41
21.4
0.0
74.3
908.
013
1.2
26.9
0.09
0.00
25.6
144.
41.
3N
J-19
4.10
.200
450
9417
.418
7.8
73.0
8.61
22.2
19.1
62.7
692.
414
2.4
280.
090.
0015
9.4
1.0
NJ-1
914
.8.2
006
5094
13.6
1954
.08.
4322
.613
.765
.982
5.8
144.
732
0.3
0.03
6.3
152.
7N
J-20
4.2.
2000
5017
9.0
9.0
1386
.09.
0223
.132
.354
.672
5.0
173
31.7
0.42
0.00
27.3
173.
50.
1N
J-21
27.3
.200
150
6014
.022
65.0
9.19
22.7
109.
510
8.8
878.
719
5.4
33.4
0.81
0.02
2916
6.4
0.7
NJ-2
12.
5.20
0150
683.
714
.015
1.1
2627
.09.
4722
.021
7.6
11.3
1069
.020
7.5
37.9
0.87
0.05
52.2
221.
41.
0N
J-21
7.2.
2002
5033
151.
123
48.0
6.18
22.0
402.
816
6.4
759.
016
0.9
28.1
0.36
0.01
35.9
113.
21.
4N
J-21
27.6
.200
650
9014
.025
28.0
8.67
22.7
77.6
99.8
747.
315
1.7
29.5
0.48
0.02
11.4
114.
4N
J-22
27.3
.200
150
5814
.017
81.0
8.61
21.5
24.1
86.7
771.
113
9.9
28.8
0.74
0.02
18.8
203.
20.
7N
J-22
2.5.
2001
5067
13.2
14.0
194.
319
67.0
8.71
22.0
76.5
8.8
771.
913
3.4
28.4
0.26
0.01
12.5
200.
70.
7N
J-22
7.2.
2002
5032
194.
821
02.0
7.87
22.4
42.2
47.9
875.
013
8.7
29.4
0.23
0.07
25.1
167.
41.
2N
J-22
19.4
.200
250
6720
018
81.0
8.85
24.3
16.9
39.4
770.
013
8.5
27.9
0.16
0.01
15.1
163.
21.
2N
J-22
29.6
.200
650
9114
.216
46.0
8.98
22.8
14.6
48.0
852.
215
8.2
35.3
0.18
0.02
6.6
170.
4N
J-23
17.3
.200
450
706.
06.
016
3.9
7.1
22.7
106.
425
5.0
763.
415
930
.60.
620.
0998
.31.
4
TA
BLE
2:
Nes
jave
llir w
ells
, ana
lys
es o
f flu
id sa
mpl
es (m
g/kg
) in
200
0-20
07

Report 15 349 Mutonga
Wel
l no
.D
ate
Sam
ple
no.
Ps
(bar
)A
v. P
s (b
ar)
Ts (аC
)H
opH
/аCC
O2
H2S
SiO
2N
aK
Ca
Mg
SO4
Cl
F
HE-
316
.4.2
002
5062
4.3
153.
511
999.
1424
18.3
14.1
736.
321
8.6
32.3
4.67
028
9.8
HE-
314
.6.2
002
5086
5.2
515
7.8
1330
9.32
24.6
16.4
19.3
599.
423
7.7
35.1
1.81
044
.631
6.5
0.93
HE-
310
.9.2
002
5092
5.5
159.
613
969.
3722
.615
.219
.665
8.4
240.
139
.60.
990
22.5
333
0.93
HE-
416
.4.2
002
5063
616
3.5
1234
9.46
24.3
19.4
30.5
759.
217
5.9
241.
090
244.
3H
E-4
14.6
.200
250
877
7.5
168.
912
269.
5824
.914
.631
.459
5.8
194.
726
.30.
770
37.8
228.
10.
9H
E-4
10.9
.200
250
937.
517
1.5
1358
9.49
22.7
18.4
35.6
609.
418
8.1
27.1
0.6
019
.220
6.3
0.9
HE-
41.
4.20
0350
788.
717
212
889.
4423
.213
.939
.664
8.3
187.
925
.70.
570
24.3
257.
11
HE-
531
.10.
2002
5107
6.3
161.
210
179.
621
.783
.718
.756
118
5.8
26.8
0.61
039
.111
52.
01H
E-5
26.1
1.20
0251
085.
916
3.5
1127
9.56
21.4
77.3
26.7
582
150.
124
.50.
790
22.6
125.
92.
12H
E-5
28.3
.200
750
448.
48.
411
9469
5.9
1717
.930
0.36
020
.278
.3H
E-6
11.3
.200
350
645
158.
813
189.
2924
181.
726
.21.
380
60.4
167.
81.
09H
E-6
19.5
.200
351
017.
27.
216
4.9
1354
9.38
20.7
85.6
32.4
587
175.
225
.60.
580
27.4
200.
40.
97H
E-6
15.7
.200
351
066.
816
5.3
1397
9.28
22.9
51.7
38.6
625.
217
1.3
26.5
0.6
0.01
23.2
193.
9H
E-6
12.4
.200
750
4711
1522
806.
618
0.1
29.2
0.28
0.01
24.6
119.
3H
E-7
18.1
2.20
0251
0910
.417
7.9
1414
9.6
21.8
072
.762
918
228
.50.
750.
0120
.617
2.5
0.97
HE-
711
.3.2
003
5065
12.5
187.
114
299.
1124
.119
6.6
21.1
0.48
025
.221
6.4
1.06
HE-
719
.5.2
003
5102
11.5
187.
614
599.
1921
.336
.856
.354
018
9.6
28.9
0.46
0.01
22.3
298.
91.
15H
E-7
15.7
.200
351
0510
.510
182.
512
399.
2222
.932
.856
685.
319
4.9
310.
40.
0920
3.9
HE-
730
.8.2
006
5097
6.5
1255
45.6
748.
320
3.1
35.7
0.48
0.02
9.5
227.
9H
E-7
26.4
.200
750
6110
.118
1.9
1423
712.
221
5.8
35.8
0.37
095
209.
2H
E-7
17.7
.200
751
179.
318
0.5
1523
728
217.
336
.70.
360.
0110
.321
9.8
HE-
823
.6.2
004
5072
2.4
2.4
1213
9.54
22.7
108.
315
.764
9.6
161.
825
.72.
70.
111
0.5
1.28
HE-
917
.11.
2003
5125
7.2
166.
926
338.
7422
.279
3.6
175.
830
1.08
0.01
202.
5H
E-9
18.4
.200
750
509
927
5710
1.2
87.9
130.
320.
0132
.556
.8H
E-11
21.1
0.20
0451
0014
.719
1.8
1295
8.66
2241
.248
.672
8.6
175
31.4
0.55
0.01
186.
60.
69H
E-11
6.12
.200
651
339.
811
.56
180.
118
3646
.759
786.
217
9.1
35.2
0.41
016
.317
3.1
HE-
1112
.4.2
007
5048
11.2
1839
715.
518
7.8
36.2
0.27
049
.217
9.5
HE-
129.
3.20
0550
5611
.811
.818
9.5
1292
9.24
21.8
2856
.168
6.2
176.
632
.90.
610.
0126
7.3
0.93
HE-
1312
.5.2
005
5078
55
965
9.67
23.2
32.4
33.2
603.
415
123
.61.
450.
0112
5.5
HE-
1512
.5.2
005
5077
8.8
8.8
1174
9.35
22.8
20.7
21.5
640.
518
6.1
31.7
0.62
0.01
191.
7H
E-15
15.6
.200
550
818.
812
419.
3924
.617
.247
.865
1.1
189.
332
.30.
640.
0119
5.9
HE-
169.
5.20
0650
804.
24.
211
249.
3224
.433
.645
622.
220
1.7
31.9
1.91
0.01
23.6
193.
5H
E-17
15.1
2.20
0551
0712
1326
9.1
23.3
2942
.681
9.2
182.
936
.20.
390.
0119
9.8
HE-
177.
2.20
0650
5810
.815
798.
8823
45.9
796.
817
6.8
37.8
0.33
0.05
205.
5H
E-17
7.12
.200
651
3411
.312
187.
825
337.
9522
39.5
7279
7.5
164.
232
.90.
690
15.8
170.
6H
E-17
3.7.
2007
5101
12.5
187.
323
1984
8.7
195.
938
0.01
8.3
203.
8H
E-18
19.4
.200
650
777.
821
1236
9.55
22.7
35.6
3773
7.7
189.
433
.61.
370.
19.
723
8H
E-18
18.4
.200
750
4921
1433
119.
119
0.5
32.3
0.37
0.01
10.6
157.
6H
E-19
29.3
.200
750
458.
615
8464
2.3
219.
433
.70.
570
10.5
207.
8H
E-19
17.7
.200
751
168.
88.
817
8.7
1560
640.
621
7.1
33.6
0.56
0.01
12.4
208.
8H
E-20
30.5
.200
650
835
510
598.
5323
.510
2.8
44.1
550.
323
5.8
32.7
5.29
0.02
37.1
228.
7H
E-20
29.8
.200
650
954.
75
1053
8.43
23.7
99.5
44.9
579.
123
6.2
32.7
3.38
0.03
50.8
230.
2H
E-20
30.1
0.20
0651
038
1069
8.82
23.3
103
52.3
570
232.
132
.53.
140.
0241
.522
3.8
HE-
2130
.5.2
006
5084
66
1885
823
.839
.38.
397
5.8
262.
559
.30.
670.
015.
240
0.2
HE-
2130
.8.2
006
5096
5.1
1815
7.87
23.7
346.
610
35.5
276.
565
.40.
60.
026.
543
8.5
HE-
221.
12.2
006
5132
3.2
3.2
140
902
9.23
23.2
24.1
47.4
442
221.
424
.73.
160
73.1
217
HE-
2319
.6.2
007
5083
2.8
2.8
1279
508.
617
1.7
0.93
37.7
111.
4H
E-24
19.6
.200
750
848
817
1.1
1918
600.
117
1.7
25.6
1.22
0.01
46.2
119
HE-
2520
.6.2
007
5085
3.9
3.9
142.
713
1065
2.5
202.
128
.91.
10.
0147
.314
4.6
HE-
2726
.6.2
007
5088
55
154.
917
5259
8.4
227
29.4
5.7
0.01
9520
2.8
TA
BLE
3:
Hel
lishe
idi
wel
ls, a
naly
ses o
f flu
id sa
mpl
es (m
g/kg
) in
200
0-20
07
faraway origin for the thermal water. The difference in δ18O can be explained if the geothermal activity within the area west of the fissure is considerably older than the activity east of it (Sveinbjörnsdóttir, 1989). Figure 8 shows the spatial distribution of δ18O in Nesjavellir in the 1980s before production from the field started. The highest values are observed along an axis, trending NE-SW, through the field, with the highest values δ18O -5.9 ‰ and -6.5 ‰. Low values are observed in the north-western part of the field.
Mutonga 350 Report 15
Easti
ngN
orth
ing
Sam
ple
no.
Well
no
._18
O (l
)_2 H
(l)
_18O
(s)
_2 H (s
)En
thal
py, H
o (k
J/kg
)H
o (I)
(k
J/kg
)H
o (s)
(k
J/kg
)_18
O_2 H
Ps
(bar
)St
eam
ra
tioC
l (m
g/kg
)
-21.
3179
64.0
561
5088
HE-
27-5
.53
-59.
36-8
.88
-69.
3417
52.0
623.
224
2744
.0-7
.313
-64.
672
4.50
0.53
219
0.25
-21.
3567
64.0
375
5101
HE-
17-4
.89
-59.
32-7
.25
-62.
9723
19.0
782.
979
2781
.0-6
.704
-62.
126
11.1
00.
769
212.
96-2
1.37
4064
.029
651
16H
E-19
-5.6
7-6
3.64
-8.4
4-6
8.66
1560
.072
7.73
627
69.8
-6.7
99-6
5.68
68.
300.
408
198.
26-2
1.35
8164
.033
351
17H
E-07
-5.6
1-6
3.33
-8.1
6-6
7.52
1523
.074
6.84
527
73.9
-6.5
86-6
4.93
49.
200.
383
239.
10-2
1.31
6864
.043
251
29H
E-11
-5.6
3-6
2.62
-8.0
4-6
5.49
2047
.078
9.98
827
82.3
-7.1
51-6
4.43
111
.50
0.63
117
9.50
-21.
3381
64.0
574
5130
HE-
23-5
.9-5
9.97
-9.9
1-7
4.00
1279
.055
1.46
227
21.7
-7.2
44-6
4.67
32.
800.
335
-21.
3469
64.0
496
5131
HE-
25-5
.97
-61.
67-9
.27
-72.
2413
10.0
604.
723
2738
.1-7
.061
-65.
164
4.00
0.33
111
8.35
-21.
3465
64.0
530
5132
HE-
24-5
.87
-60.
94-8
.51
-67.
3419
08.0
702.
117
2763
.9-7
.414
-64.
683
7.20
0.58
511
6.90
TA
BLE
4:
Hel
lishe
idi w
ells
, iso
topi
c an
alys
es o
f sam
ples
from
200
7
Loc
atio
nW
ell n
o.E
astin
gsN
orth
ings
_18
O g
_18
O v
Stea
m r
atio
_
18O
T se
p (а
C)
_2 Hg
_2 Hv
_2 HT
sep (а
C)
9500
1N
V-1
-21.
2668
364
.102
51-6
.600
2.75
00.
950
-6.4
1014
2.00
-79.
000
-54.
900
-77.
800
112.
0095
005
NG
-5-2
1.26
049
64.1
0364
-7.7
50-5
.050
0.80
8-6
.280
137.
50-7
4.45
0-6
9.10
0-7
1.50
019
0.50
9500
6N
G-6
-21.
2729
764
.096
65-6
.015
-3.9
550.
378
-5.6
3022
3.75
-75.
000
-73.
075
-74.
830
211.
2595
007
NG
-7-2
1.25
743
64.1
0570
-8.2
65-5
.563
0.95
0-6
.585
189.
25-7
9.60
0-7
3.67
5-7
5.90
018
9.50
9500
8N
G-8
-21.
2793
564
.095
56-6
.350
-2.6
000.
950
-6.1
6014
6.00
-63.
200
-73.
675
-62.
800
181.
0095
009
NG
-9-2
1.26
881
64.0
9461
-6.6
96-3
.433
0.82
5-6
.220
173.
38-7
5.37
5-6
4.92
5-7
4.30
015
6.50
9501
0N
G-1
0-2
1.25
534
64.1
0032
-8.2
00-5
.700
0.39
3-6
.600
198.
67-8
0.00
0-7
5.00
0-7
6.93
019
3.00
9501
1N
J-11
-21.
2629
864
.107
35-6
.780
-4.2
100.
898
-6.5
0519
0.66
-74.
925
-69.
133
-74.
325
190.
3095
012
NJ-1
2-2
1.28
083
64.1
0386
-9.4
25-6
.841
0.39
0-7
.860
178.
60-7
7.95
0-7
2.81
0-7
4.91
619
2.33
9501
3N
J-13
-21.
2699
664
.098
79-6
.244
-4.0
200.
840
-6.0
4720
3.71
-75.
900
-72.
071
-75.
285
198.
8595
014
NJ-1
4-2
1.27
160
64.0
9048
-8.1
90-5
.160
0.42
0-6
.430
176.
00-7
9.20
0-7
1.70
0-7
4.90
018
8.00
9501
5N
J-15
-21.
2577
564
.096
75-7
.858
-5.5
380.
525
-6.7
2021
0.16
-74.
450
-70.
010
-72.
300
196.
4095
016
NJ-1
6-2
1.25
795
64.1
1096
-6.9
29-4
.259
0.77
1-6
.291
193.
80-7
6.16
0-7
1.02
0-7
4.96
619
1.40
9501
7N
J-17
-21.
2886
564
.099
6910
.108
-7.1
000.
233
-7.8
0317
5.00
-79.
150
-70.
250
-72.
320
172.
2595
018
NJ-1
8-2
1.25
694
64.1
2107
-10.
97-7
.576
0.22
0-8
.324
158.
00-8
4.28
0-7
2.97
5-7
5.47
516
2.00
TA
BLE
5: S
tabl
e iso
tope
s val
ues (
ä) f
or th
e N
esja
velli
r wel
ls in
1985
-198
9 b
efor
e pro
duct
ion s
tarte
d (Sv
einb
j rn
d—tti
r, 198
9)

Report 15 351 Mutonga
-21.285 -21.28 -21.275 -21.27 -21.265 -21.26
Eastings
64.095
64.1
64.105
64.11
64.115
64.12
Nor
thin
gs
1
5
6
7
89
10
11
12
13
14
15
16
17
18
FIGURE 8: The distribution δ18O in the Nesjavellir field in the 1980s
5.1.2 Chloride Chloride is a conservative (non-reactive) constituent in a geothermal system. Once added to the fluid phase it remains there. Conservative components have not equilibrated in a thermodynamic sense. They are externally fixed by their sources of supply for the geothermal fluid (may dissolve from rock, but are not taken up by rock, i.e. external source). Their contents along the flow path are changed only by mixing and steam loss. The chloride distribution during the pre-production years in the 1980s (Figure 9a) shows a distinct distribution with the highest values on the southeast side of the production field and the lowest values on the northern and western sides of the field. after production started the chloride concentration seems to have increased, as seen in Figure 9b which is based on data from 2000-2007, with high values being observed in the southern part of the field. The Nesjavellir reservoir shows important change from the initial Cl concentration as a consequence of the utilization. Initially, the Cl concentration in the wells closest to the young eruptive fissure was low, in some cases below 10 ppm, which is unusually low, but higher concentrations were found in the lower-enthalpy wells in the eastern part of the field. The recent increase in the Cl concentration may be due to an increase in the mineralisation of the fluids due to mixing or boiling, or perhaps mixing with waters from a different source with high chloride concentrations.
-12 -10 -8 -6 δ18O ‰
-90
-80
-70
-60
-50
δ2H
ä
NV17
NJ12NJ18
FIGURE 7: A graph showing δ2H vs. δ18O for the Nesjavellir wells, based on data from the 1980s

Mutonga 352 Report 15
5.1.3 Enthalpy In Figure 10 comparison is made between the enthalpy distribution based on the data from the 1980s (Figure 10a) and data from 2000-2007 (Figure 10b). The old data prior to exploitation shows the enthalpy distribution to be regular with the highest values of around 2100-2700 kJ/kg being observed along an axis in the central part of the field trending NE-SW. The same pattern is observed for the δ18O distribution shown in Figure 8. This is the same direction as that of the fissure swarm which traverses Mt. Hengill into Lake Thingvalla-vatn. The data from 2000-2007 suggests a change in the distribution of the enthalpy (Figure 10b) where the enthalpy seems to be increasing outwards from the centre with a notable increase being observed to the northwest. This is a clear indication of an increase in temperature from the centre of the field outwards. As is to be expected when production is forced, the enthalpy rises with time. There is also a strong relationship between the enthalpy and the δ18O isotopes distribution as indicated in Figure 11.
-21.285 -21.28 -21.275 -21.27 -21.265 -21.26Eastings
64.095
64.1
64.105
64.11
64.115
64.12
Nor
thin
gs
15
6
7
89
10
11
12
13
14
15
16
17
18
A
-21.28 -21.275 -21.27 -21.265 -21.26Eastings
64.095
64.1
64.105
64.11
Nor
thin
gs
NG-5
NG-6
NG-7
NG-10
NJ-11
NJ-13
NJ-14
NJ-16
NJ-19
NJ-20
NJ-21NJ-22
B
FIGURE 9: Distribution of Cl in the Nesjavellir field, based on data from a) 1980s; b) 2000-2007

Report 15 353 Mutonga
5.1.4 CO2 distribution Figure 12 shows the distribution of CO2 in the Nesjavellir field in the 1980s, before production started, and from 2000-2007. Before production, there is a CO2 high in the southwestern part of the field. After some years of production, high CO2 values are now observed in the northwest part. High gas concentrations are mainly due to flashing in the reservoir fluid (Björnsson, G., pers. comm.). This means that the response to production is increased flashing in the northwest part of the field.
-21.285 -21.28 -21.275 -21.27 -21.265 -21.26Eastings
64.095
64.1
64.105
64.11
64.115
64.12
Nor
thin
gs
1
5
6
7
89
10
11
12
13
14
15
16
17
18
-21.28 -21.275 -21.27 -21.265 -21.26Eastings
64.095
64.1
64.105
64.11
Nor
thin
gs
NG-5
NG-6
NG-7
NG-10
NJ-11
NJ-13
NJ-14
NJ-16
NJ-19
NJ-20
NJ-21NJ-22
B
A
FIGURE 10: Distribution of enthalpy, H (kJ/kg), in the Nesjavellir field, based on data from
a) 1980s and b) 2000-2007
-9 -8 -7 -6 -5δ18O ‰
800
1200
1600
2000
2400
2800
Ent
halp
y kJ
/kg
FIGURE 11: δ18O vs. enthalpy for the Nesjavellir field for
the data from the 1980s

Mutonga 354 Report 15
5.1.5 Classification of the thermal fluid The thermal waters in Nesjavellir field can be classified as partially equilibrated and mixed waters (Figure 13). There is not much change from the 1980s period, prior to production, to the period 2000-2007 when the field was in full production. Most samples fall in the temperature range of 240-300°C except for a few that fall above the fully equilibrated line, probably because of the removal of Mg from the waters. The chemical composition of the fluids from the Nesjavellir wells in the period 2000-2007 shows that they can be classified as Cl-rich geothermal water (Figure 14), in contrast to the period in the 1980s where there is a scatter with most samples falling in the Cl-rich section but some within the HCO3 rich section. The pH of most of the samples was in the range 8-9.
-21.285 -21.28 -21.275 -21.27 -21.265 -21.26Eastings
64.095
64.1
64.105
64.11
64.115
64.12
Nor
thin
gs
-21.28 -21.275 -21.27 -21.265 -21.26Eastings
64.095
64.1
64.105
64.11
Nor
thin
gs
FIGURE 12: Distribution of CO2 in the Nesjavellir field, based on data from a) 1980s and b) 2000-2007
A
B
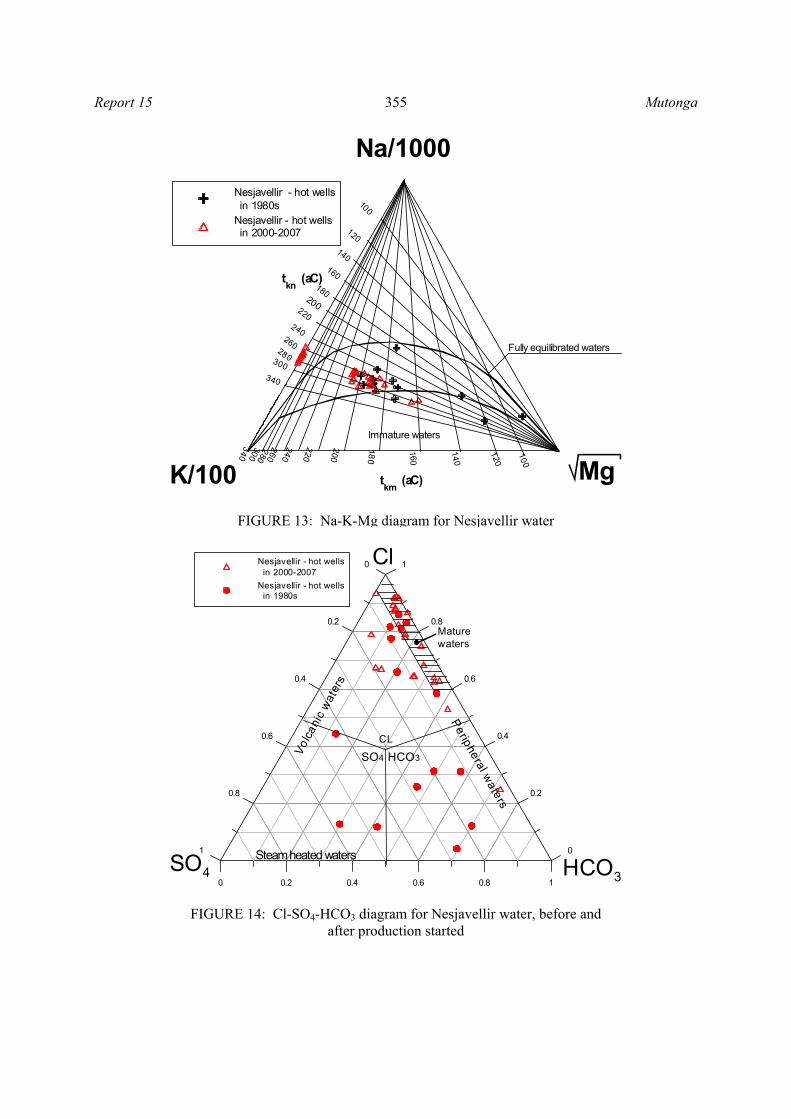
Report 15 355 Mutonga
Na/1000
K/100 Mg
Nesjavellir - hot wells in 1980sNesjavellir - hot wells in 2000-2007
tkn (аC)
tkm (аC)
100
1 20
14 0
1 60
180
200
240
220
260300340
Fully equilibrated waters
Immature waters
100
120140
160180
200220240
260280300340
280FIGURE 13: Na-K-Mg diagram for Nesjavellir water
FIGURE 14: Cl-SO4-HCO3 diagram for Nesjavellir water, before and after production started
0 0.2 0.4 0.6 0.8 1HCO3
1
0.8
0.6
0.4
0.2
0
Cl
1
0.8
0.6
0.4
0.2
0
SO4
Nesjavellir - hot wells in 2000-2007Nesjavellir - hot wells in 1980s
Steam heated waters
Maturewaters
CL
HCO3SO4Volca
nic
wat
ers
Peripheral waters

Mutonga 356 Report 15
5.2 The Hellisheidi field 5.2.1 Stable isotopes The samples for isotopes in the Hellisheidi field were collected in August 2007 comprising both condensate and steam. The results indicate that the isotope ratios for the deep circulating fluid range from -7.3‰ to -6.5‰ and -62‰ to -65‰ for δ18O and δ2H, respectively. Figure 15 shows the distribution of δ18O isotopes in samples collected in August 2007 from the wells in Hellisheidi. High values of δ18O with a maximum value -6.5‰ are observed in the southwestern part of the study area and a minimum of -7.3‰ in the north. Wells HE-24 and HE-25 were producing from a steam cap, which means that their steam is much lighter in isotopes than steam from wells HE-7 and HE-17 which are two-phase.
Figure 16 shows that water from cold water wells in Hellisheidi (Ólafsson, M., pers. comm.) plots directly on the global meteoric water line and range in δ2H from about -53‰ to -61‰. The geothermal waters show oxygen shift of about 2-3‰ and range in δ2H between -2.0 and -65.0‰. A linear relationship between δ18O and Cl concentration, but not for δ2H and Cl concentration, is observed for fluid from wells HE-7, 17, 19 and 24 (Figure 17a and b). The δ18O ratios and the Cl concentrations in fluid from HE-7, 17 and 19 are relatively high, probably due to a long residence time resulting in significant water-rock interaction.
-21.37 -21.36 -21.35 -21.34 -21.33 -21.32Eastings
64.03
64.035
64.04
64.045
64.05
64.055
Nor
thin
gs
HE-27
HE-17
HE-19
HE-7
HE-11
HE-23
HE-25
HE-24
FIGURE 15: The δ18O isotope distribution for the Hellisheidi field in 2007
-11 -10 -9 -8 -7 -6δ18O ‰
-80
-70
-60
-50
-40
δ2H
ä
Hellisheidi - hot wellsHellisheidi - cold wells
World meteoric line
FIGURE 16: A graph showing δ2H vs. δ18O for Hellisheidi well waters

Report 15 357 Mutonga
5.2.2 Chloride Quite high chloride concentrations are observed in the Hellisheidi water with the highest values coinciding with the highest enthalpy and isotope values (Figure 18), due to boiling in the wells. 5.2.3 Enthalpy High enthalpy values are generally observed in the Hellisheidi field with the highest values in the southwest and eastern parts (Figure 19). Figure 20 indicates that high enthalpy well fluids may have lower δ18O values and vice versa.
80 120 160 200 240Cl mg/kg
-7.6
-7.4
-7.2
-7
-6.8
-6.6
-6.4
-7.313
-6.704
-6.799
-6.586
-7.151
-7.061
-7.414
δ18O
ä
HE-7
HE-17
HE-19
HE-25
HE-24
HE-23
HE-27
80 120 160 200 240Cl mg/kg
-66
-65
-64
-63
-62
δ2H
ä
-64.67
-62.13
-65.69
-64.93
-64.43
-65.16
-64.68
HE -7
HE -27
HE -19
HE -25
HE -24
HE -11
HE -17
FIGURE 17: Graphs showing a) δ2H vs. Cl and b) δ18O vs. Cl, for the Hellisheidi geothermal wells
A B
-21.37 -21.36 -21.35 -21.34 -21.33 -21.32Eastings
64.03
64.035
64.04
64.045
64.05
64.055
Nor
thin
gs
HE-27
HE-17
HE-19
HE-07
HE-11
HE-23
HE-25
HE-24
FIGURE 18: Distribution of Cl in the Hellisheidi field in 2000-2007
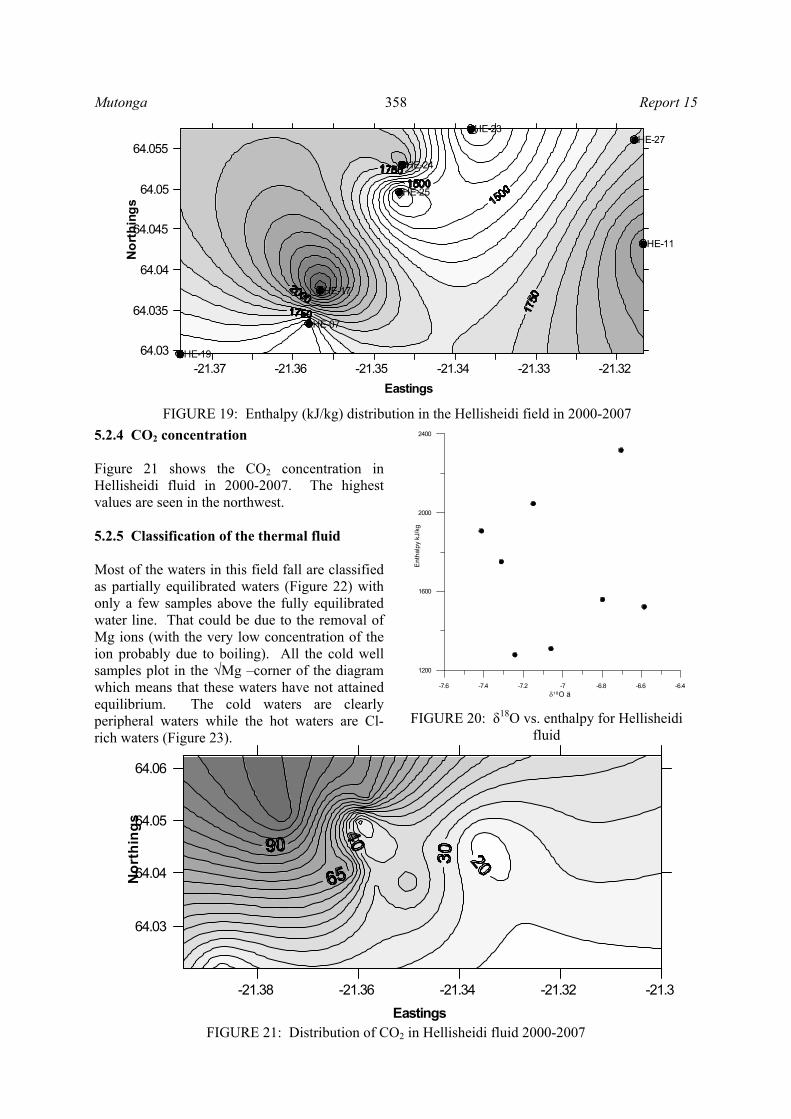
Mutonga 358 Report 15
5.2.4 CO2 concentration Figure 21 shows the CO2 concentration in Hellisheidi fluid in 2000-2007. The highest values are seen in the northwest. 5.2.5 Classification of the thermal fluid Most of the waters in this field fall are classified as partially equilibrated waters (Figure 22) with only a few samples above the fully equilibrated water line. That could be due to the removal of Mg ions (with the very low concentration of the ion probably due to boiling). All the cold well samples plot in the √Mg –corner of the diagram which means that these waters have not attained equilibrium. The cold waters are clearly peripheral waters while the hot waters are Cl-rich waters (Figure 23).
-7.6 -7.4 -7.2 -7 -6.8 -6.6 -6.4δ18O ä
1200
1600
2000
2400
Ent
halp
y kJ
/kg
FIGURE 20: δ18O vs. enthalpy for Hellisheidi fluid
-21.37 -21.36 -21.35 -21.34 -21.33 -21.32Eastings
64.03
64.035
64.04
64.045
64.05
64.055N
orth
ings
HE-27
HE-17
HE-19
HE-07
HE-11
HE-23
HE-25
HE-24
FIGURE 19: Enthalpy (kJ/kg) distribution in the Hellisheidi field in 2000-2007
FIGURE 21: Distribution of CO2 in Hellisheidi fluid 2000-2007
-21.38 -21.36 -21.34 -21.32 -21.3Eastings
64.03
64.04
64.05
64.06
Nor
thin
gs

Report 15 359 Mutonga
5.2.6 Mineral saturation Figure 24 shows a plot of the saturation index, SI = log Q/K for samples collected in December 2006 from well HE-17. The fluid is supersaturated with report to albite and adularia. Chalcedony and quartz seem to be in equilibrium at temperatures around 250°C. The enthalpy of this well is very high, 2533 kJ/kg, which means that more than 80% of the discharge is steam. Nevertheless, no best equilibrium temperatures can be found, probably owing to degassing or boiling, or some other processes such as precipitation of some minerals.
0 0.2 0.4 0.6 0.8 1HCO3
1
0.8
0.6
0.4
0.2
0
CL
1
0.8
0.6
0.4
0.2
0
SO4
Hellishe idi - hot wells in 2000-2007Hellishe idi - co ld wells
Steam heated waters
M aturew aters
ClHCO3SO4
FIGURE 23: Cl-SO4-HCO3 diagram for Hellisheidi waters
Na/1000
K/100 Mg
Hellisheidi - cold wellsHellisheidi - hot wells in 2000-2007
tkn (аC)
tkm (аC)
10 0
1 20
14 0
1 60
180
200
240
220
260300340
Fully equilibrated waters
Immature waters
100120
140160
180200220240260280300
340
280
FIGURE 22: Na-K-Mg diagram for Hellisheidi waters

Mutonga 360 Report 15
5.3 The Hveragerdi field – classification of the thermal fluids Chemical data from the ÍSOR database for the Hveragerdi field has been plotted on a Na-K-Mg ternary diagram (Figure 25) and on a Cl-SO4-HCO3 diagram (Figure 26). Some fluids in the Hveragerdi wells can be classified as partially equilibrated waters and as mixed waters, but most samples plot above the fully equilibrated water line derived from Arnórsson et al. (1983), but are close to that of Giggenbach (1988). These data would fit Giggen-bach’s (1988) Na-K-Mg equilibrium curve for older and more acid rocks nicely, confirming the older age of the Hveragerdi system, also evident from the Cl-SO4-HCO3 diagram. The waters seem to have low temperatures with most of the samples in the range 100-140°C, with a few samples suggesting temperatures above 200°C (Figure 25). The temperature range 100-140°C implies an old system that is cooling down. The waters in Hveragerdi are probably mature Cl-type water, as indicated in Figure 26.
120 160 200 240 280 320Temperature аC
-2
0
2
4
6
log
Q /
log
K
Well HE 17AdulariaAlbite lowChalcedonyQuartzAmorphous silica
FIGURE 24: Graph showing a log Q/K vs. temperature for the Hellisheidi waters
Na/1000
K/100 Mg
Hveragerdi - ho t wells
tkn (аC)
tkm (аC)
10 0
1 20
14 0
1 60
180
200
240
220
260300340
Fully equilibrated waters
Immature waters
100120
140160
180200220240260280300
340
280
FIGURE 25: Na-K-Mg diagram for waters from Hveragerdi hot wells

Report 15 361 Mutonga
6. DISCUSSION Figure 27 shows δ2H plotted as a function of δ18O for all the water samples from the three fields studied. The δ2H of the thermal waters is in the range -62‰ to -78‰ and δ18O ranges between -5.5‰ and -7.8‰. The figure shows that the thermal water deviates from the world meteoric water line in an agreement with the results of Sveinbjörnsdóttir and Johnsen (1992), who observed that the deviation of the Nesjavellir fluid from the meteoric line was due to an oxygen isotope exchange with the bedrock. This exchange is slow when T ≤200°C but at higher temperatures it is sharply accelerated. As basaltic rocks contain very little hydrogen, there is hardly any hydrogen isotope exchange between rock and water and, therefore, the deuterium value for thermal water still characterizes that of the original fluid. The δ2H of the thermal waters in the Nesjavellir field is about 15-18‰ lighter than the local precipitation, but similar to precipitation that falls on the glacier Langjökull some 100 km to north of the Nesjavellir thermal area. This has been suggested to indicate that the geothermal water circulating the Nesjavellir field originates from the glacier Langjökull where the water percolates into the bedrock and flows
0 0.2 0.4 0.6 0.8 1HCO3
1
0.8
0.6
0.4
0.2
0
Cl
1
0.8
0.6
0.4
0.2
0
SO4
Hveragerdi - hot wells
Steam heated waters
Maturewaters
CL
HCO3SO4Volca
nic w
aters
Peripheral waters
FIGURE 26: Cl-SO4-HCO3 diagram for waters from Hveragerdi hot wells
-10 -8 -6δ18O ‰
-80
-70
-60
-50
δ2H
ä
Nesjavellir - hot wells in the 1980sHellisheidi - cold wellsHveragerdi - hot wellsHellisheidi - hot wellsNesjavellir - hot wells in 2000-2007
World meteoric line
FIGURE 27: A graph showing δ2H vs. δ18O for all the available Hengill data
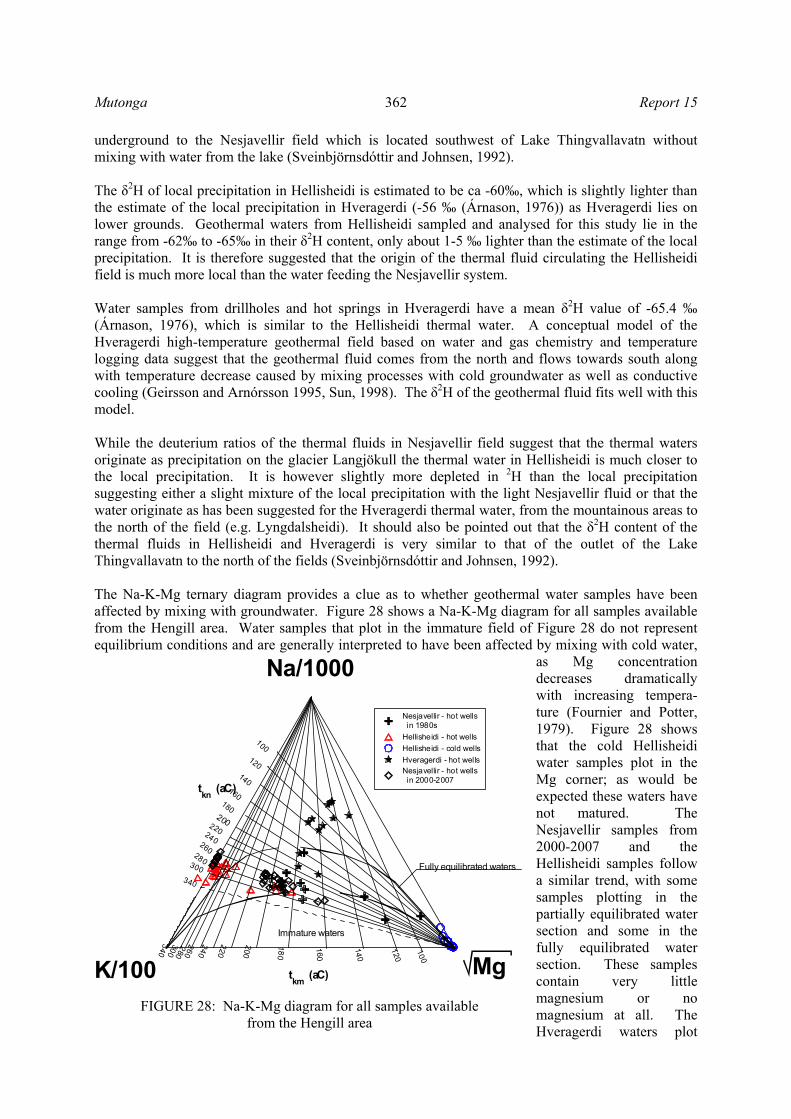
Mutonga 362 Report 15
underground to the Nesjavellir field which is located southwest of Lake Thingvallavatn without mixing with water from the lake (Sveinbjörnsdóttir and Johnsen, 1992). The δ2H of local precipitation in Hellisheidi is estimated to be ca -60‰, which is slightly lighter than the estimate of the local precipitation in Hveragerdi (-56 ‰ (Árnason, 1976)) as Hveragerdi lies on lower grounds. Geothermal waters from Hellisheidi sampled and analysed for this study lie in the range from -62‰ to -65‰ in their δ2H content, only about 1-5 ‰ lighter than the estimate of the local precipitation. It is therefore suggested that the origin of the thermal fluid circulating the Hellisheidi field is much more local than the water feeding the Nesjavellir system. Water samples from drillholes and hot springs in Hveragerdi have a mean δ2H value of -65.4 ‰ (Árnason, 1976), which is similar to the Hellisheidi thermal water. A conceptual model of the Hveragerdi high-temperature geothermal field based on water and gas chemistry and temperature logging data suggest that the geothermal fluid comes from the north and flows towards south along with temperature decrease caused by mixing processes with cold groundwater as well as conductive cooling (Geirsson and Arnórsson 1995, Sun, 1998). The δ2H of the geothermal fluid fits well with this model. While the deuterium ratios of the thermal fluids in Nesjavellir field suggest that the thermal waters originate as precipitation on the glacier Langjökull the thermal water in Hellisheidi is much closer to the local precipitation. It is however slightly more depleted in 2H than the local precipitation suggesting either a slight mixture of the local precipitation with the light Nesjavellir fluid or that the water originate as has been suggested for the Hveragerdi thermal water, from the mountainous areas to the north of the field (e.g. Lyngdalsheidi). It should also be pointed out that the δ2H content of the thermal fluids in Hellisheidi and Hveragerdi is very similar to that of the outlet of the Lake Thingvallavatn to the north of the fields (Sveinbjörnsdóttir and Johnsen, 1992). The Na-K-Mg ternary diagram provides a clue as to whether geothermal water samples have been affected by mixing with groundwater. Figure 28 shows a Na-K-Mg diagram for all samples available from the Hengill area. Water samples that plot in the immature field of Figure 28 do not represent equilibrium conditions and are generally interpreted to have been affected by mixing with cold water,
as Mg concentration decreases dramatically with increasing tempera-ture (Fournier and Potter, 1979). Figure 28 shows that the cold Hellisheidi water samples plot in the Mg corner; as would be expected these waters have not matured. The Nesjavellir samples from 2000-2007 and the Hellisheidi samples follow a similar trend, with some samples plotting in the partially equilibrated water section and some in the fully equilibrated water section. These samples contain very little magnesium or no magnesium at all. The Hveragerdi waters plot
Na/1000
K/100 Mg
Nesjavellir - hot wells in 1980sHellisheidi - hot wellsHellisheidi - cold wellsHveragerdi - hot wellsNesjavellir - hot wells in 2000-2007
tkn (аC)
tkm (аC)
10 0
1 20
14 0
1 60
180
200
240
220
260300340
Fully equilibrated waters
Immature waters
100120
140160
180200220240260280300
340
280
FIGURE 28: Na-K-Mg diagram for all samples available from the Hengill area

Report 15 363 Mutonga
above the fully equilibrated waters line and most of the samples range in temperature from 100 to 140°C (Figure 28). The thermal fluids here are also Cl type fluids (Figures 26 and 29). This can be interpreted as a mature system that is cooling. Some evidence indicates that the ascending hot water has mixed with cold water, such as:
• On the Na-K-Mg diagram (Figure 28) many samples from Nesjavellir, Hellis-heidi and Hveragerdi plot in the area of mixed waters.
• A linear relationship can be inferred between Cl and B (boron) for samples from the Hellisheidi and Nesjavellir fields (Figure 30). Quite high Cl concentrations have been observed in both fields.
High CO2 gas is due to reservoir flashing. The in-situ fluid has a small concentration of dissolved CO2. When flashed, all these CO2 molecules will boil into the steam phase and flow rapidly to the wells downstream. This explains the rise in CO2. On the other hand, CO2 levels decline again when the pressure stabilizes. This explains the change in CO2 with time in the Nesjavellir. Aquifer fluid compositions were calculated with the aid of the WATCH speciation program (Arnórsson et al., 1982; Bjarnason, 1994). Most of the wells in the Nesjavellir and Hellisheidi geothermal fields have excess enthalpy, i.e. the enthalpy of the discharged fluid is higher than that of steam saturated water at the respective aquifer temperature. This causes uncertainty as to how to obtain aquifer water composition from analysis of water and steam samples collected at the wellhead. Excess enthalpy may be a consequence of several processes (Arnórsson, 1991):
FIGURE 30: A graph showing boron vs. chloride for recent samples from the Nesjavellir and Hellisheidi fields
0.001 0.01 0.1 1 10Boron mg/kg
1
10
100
1000
Chl
orid
e m
g/kg
Nesjavellir and Hellisheidi fields in 2005Nesjavellir and Hellisheidi fields in January 2006Nesjavellir and Hellisheidi fields in April 2006
0 0.2 0.4 0.6 0.8 1HCO3
1
0.8
0.6
0.4
0.2
0
CL
1
0.8
0.6
0.4
0.2
0
SO4
Hellisheid i - hot wells in 2000-2007Hveragerd i - ho ts w ellsNesjavel lir - hot w el ls
Steam heated waters
M aturew aters
ClHCO3SO4Vo
lcan
ic w
ater
s
Peripheral waters
FIGURE 29: Cl-SO4-HCO3 diagram for all samples available from the Hengill area

Mutonga 364 Report 15
1) Partial segregation of the water and steam phases in the depressurization zone around the wells so that the water fraction is partially retained in the aquifer, while the steam flows into the wells.
2) Processes involving heat flow from the aquifer rock in the depressurization zone to the fluid flowing into the wells. The pressure drop causes boiling of the liquid phase which results in cooling and, hence, a positive temperature gradient is created between the aquifer rock and the flowing fluid.
3) Excess enthalpy could also be a reflection of a high steam fraction of the initial aquifer fluid. Difficulties in evaluating the relative contribution of these boiling processes to the excess enthalpy of well discharges lead to uncertainties in how to calculate the chemical composition of the aquifer fluid from analytical data on water and steam samples collected at the wellhead, as illustrated in Figure 24. The calculated quartz and chalcedony geothermometer values for the geothermal well waters indicate reservoir temperatures of 189-255°C. These values are lower than values calculated for cation geothermometers, probably due to the fast reaction rate of silica at high-temperatures. The Na-K-Ca and Na-K geothermometers give higher values for the wells, or 210-290°C. The gas geothermometers applied indicate temperatures of 232-295°C. However, the calculation of mineral saturation indices for the geothermal waters shows fluids from all the wells to be close to equilibrium at 245°C, and some degree of supersaturation with respect to amorphous silica, chalcedony and quartz. Ívarsson (1998) used fumarole gas chemistry to estimate subsurface temperatures in this area. The highest temperatures were consistently found in the Nesjavellir field after production had started, while progressively lower temperatures were found in the Ölkelduháls and Hveragerdi fields. The gas chemistry suggests that the Nesjavellir and Ölkelduháls fields are not connected at depth. Hellisheidi and Nesjavellir are sub-fields of the large Hengill geothermal system. Figure 31 shows
reservoir temperature distribution in the Hengill area at 650 m b.s.l. based on the wells, and the conceptual reservoir model is shown in Figure 32 (Björnsson et al., 2006). An upflow zone of hot fluid resides beneath the summit of the Hengill volcano. A gradual rise in temperature is observed with depth in Nesjavellir, whereas temperatures are reversed at Hellisheidi; the reversal is explained by a lateral, cooler fluid recharge from the south. The ascending fluid then flows diagonally or laterally into both the Nesjavellir and the Hellisheidi fields (Björnsson et al., 2006). The isotopes, however, suggest a different origin for the thermal fluids in the two systems. The fluid circulating the Nesjavellir system comes from a distant source with δ2H ranging from -72‰ to -78‰, being very similar to the local precipitation at the glacier Langjökull, some 100 km north of Nesjavellir. The δ2H content of the Hellisheidi thermal
FIGURE 31: Reservoir temperature (°C) distribution in the Hengill area at 650 m b.s.l. based on chemical
analyses from wells (Björnsson et al., 2006)
Nesjavellir
Ölkelduháls
Hellisheidi
Hveragerdi

Report 15 365 Mutonga
fluid range between -62‰ and -66‰, only 1-5‰ more 2H depleted than the local precipitation. Its origin is therefore more local; either it could be of local origin slightly mixed with the depleted Nesjavellir fluid or the fluid could originate from the mountainous areas to the north of the field as has been suggested for the Hveragerdi thermal fluid. 7. CONCLUSIONS The main conclusions and recommendations can be summarized as follows:
• The Nesjavellir and Hellisheidi waters do not share the same origin. In Nesjavellir, the water originates from a distant source (the glacier Langjökull) whereas in Hellisheidi the water is more of a local origin. Either it could be of local origin slightly mixed with the 2H depleted Nesjavellir fluid or the fluid could originate from the mountainous areas to the north of the field as has been suggested for the Hveragerdi thermal fluid.
• According to the deuterium isotope values, well HE-1 in Hellisheidi is closer in origin to the Nesjavellir thermal fluid than the fluid circulating in the rest of the Hellisheidi system.
• The Hellisheidi system is younger than the Nesjavellir system as is suggested by both the stable isotope ratios and by the chemistry of the thermal fluids (Cl-SO4-HCO3 diagram). At Nesjavellir, the fluid is richer in 18O and chemically more mature than at Hellisheidi, due to more intense water-rock interaction
• There is an invasion of a different fluid with a high concentration of Cl in the Nesjavellir field. There is also increased boiling in the field, probably in general response to production.
• There is a pressure drop in both fields which causes boiling of the liquid phase, resulting in cooling. Thus, a positive temperature gradient is created between the aquifer rock and the
FIGURE 32: A SW-NE cross-section through the Hengill area including Hellisheidi and Nesjavellir, showing the expected temperature distribution (°C) and a conceptual reservoir
model of the fluid flow (Björnsson et al., 2006)
FIGURE 32: A SW-NE cross-section through the Hengill area including Hellisheidi and Nesjavellir, showing the expected temperature distribution (°C) and a conceptual reservoir
model of the fluid flow (Björnsson et al., 2006)

Mutonga 366 Report 15
flowing fluid. Evidence of boiling can be seen in both the Nesjavellir and Hellisheidi fields by high CO2 values. However, boiling is more pronounced in the Hellisheidi field as indicated by the Na-K-Mg diagram.
• The calculated quartz geothermometer for both fields indicate a conservative temperature range, between 189 and 255°C, but the Na-K geothermometers indicate higher temperatures beween 210 and 290°C.
• More samples should be collected for chemical and isotope analysis on a regular basis to better understand the Hengill geothermal systems/reservoirs.
ACKNOWLEDGEMENTS My grateful thanks are due to many people without whose help this report would not have been produced. I would like to express my utmost appreciation to those who played a role and made possible my attendance at the Geothermal Training Programme, especially Dr. Simiyu of KenGen for nominating me for this course, to Dr. Ingvar B. Fridleifsson, Director, and Mr. Lúdvík S. Georgsson, Deputy Director, of the UNU Geothermal Training Programme, for recommending me for the UNU Fellowship and thus giving me the opportunity to participate in this special course, and also for their moral and technical support. I cannot forget Mrs. Dorthe H. Holm, Ms. Thórhildur Ísberg and Ms. Margrét T. Jónsdóttir for all the assistance during the course. I would like to thank my supervisor, Prof. Árný Sveinbjörnsdóttir, for her support and guidance during my work on this project. Her critical review of the work as well as her encouragement, and enthusiasm are most appreciated. I would also like to express my deep gratitude to Dr. Halldór Ármannsson, whose helpful suggestions contributed significantly. My most sincere gratitude also goes to Mr. Gestur Gíslason of Reykjavik Energy for providing data as well as assisting in sample collection, and to Mr. Magnus Ólafsson for assisting with old data which was also very useful. The same can be said about all my lecturers in the UNU and ÍSOR who were always ready to assist, and to my new friends, the UNU-GTP 2007 Fellows. I thank all of you for your friendship and support. The University of Nairobi is acknowledged for granting me academic leave to pursue this course. Finally, I would like give a very special thanks to my parents, siblings and friends who have been very supportive throughout my six months away from home.
REFERENCES
Ármannsson, H. and Ólafsson, M. 2000: Collection of geothermal fluids for chemical analysis. Iceland GeoSurvey, Reykjavík, report ISOR-2006/101, 17 pp. Árnason, B., 1976: Groundwater systems in Iceland traced by deuterium. Soc. Sci. Islandica, 42, Reykjavík, 236 pp. Árnason, K., Haraldsson, G.I., Johnsen, G.V., Thorbergsson, G., Hersir, G.P., Saemundsson, K., Georgsson, L.S., and Snorrason, S.P., 1986: Nesjavellir, geological and geophysical surface exploration 1985. Orkustofnun, Reykjavík, report OS-86014/JHD-02 (in Icelandic), 125 pp + maps. Arnórsson, S., 1991: Geochemistry and geothermal resources in Iceland, In: D´Amore, F. (co-ordinator), Applications of geochemistry in geothermal reservoir development. UNITAR/UNDP publication, Rome, 145-196.

Report 15 367 Mutonga
Arnórsson, S., (ed.), 2000: Isotopic and chemical techniques in geothermal exploration, development and use. Sampling methods, data handling and interpretation. International Atomic Energy Agency, Vienna, 351 pp. Arnórsson, S., Gunnlaugsson, E., and Svavarsson, H., 1983: The chemistry of geothermal waters in Iceland. III. Chemical geothermometry in geothermal investigations. Geochim. Cosmochim. Acta, 47, 567-577. Arnórsson, S., Sigurdsson, S., and Svavarsson, H., 1982: The chemistry of geothermal waters in Iceland I. Calculation of aqueous speciation from 0°C to 370°C. Geochim. Cosmochim. Acta, 46, 1513-1532. Bjarnason, J.Ö., 1994: The speciation program WATCH, version 2.1. Orkustofnun, Reykjavík, 7 pp. Björnsson, A., Hersir, G.P., and Björnsson, G., 1986: The Hengill high-temperature area SW-Iceland: Regional geophysical survey. Geoth. Res. Council, Transactions, 10, 205-210. Björnsson, G., Gunnlaugsson, E., and Hjartarson, A., 2006: Applying the Hengill geothermal reservoir model in power plant decision making and environmental impact studies. Proceedings of the TOUGH symposium 2006, San Francisco, Ca, 11 pp. Bödvarsson, G., 1960: Exploration and exploitation of natural heat in Iceland. Bull. Volcanol., 23, 241-250. Bödvarsson, G., 1961: Physical characteristics of natural heat resources in Iceland. Jökull, 11, 29-38. Can, I., 2002: A new improved Na/K geothermometer by artificial neural networks. Geothermics, 31, 751-760. Chiodini, G., Cioni, R., Guidi, M., and Marini, L., 1991: Chemical geothermometry and geobarometry in hydrothermal aqueous solutions: A theoretical investigation based on a mineral-solution equilibrium model. Geochim. Cosmochim. Acta, 55, 2709-2727. Craig, H., 1961: Isotopic variations in meteoric waters. Science, 133, 1702-1703. Craig, H., 1963: The isotopic geochemistry of water and carbon in geothermal areas. In: Tongiorgi, E. (ed.), Nuclear geology on geothermal areas. Consiglio Nazionale delle Ricerche, Laboratorio di Geologia Nucleare, Pisa, 17-53. Ellis, A.J., and Mahon, W.A.J., 1977: Chemistry and geothermal systems. Academic Press, New York, 392 pp. Ellis, A.J., and Wilson, S.H., 1960: The geochemistry of alkali metals ions in the Wairakei hydrothermal system. N.Z.J. Geol.& Geophys., 3, 593-617. Fournier, R.O., 1977: Chemical geothermometers and mixing model for geothermal systems. Geothermics, 5, 41-50. Fournier, R.O., 1979: A revised equation for Na-K geothermometer. Geoth. Res. Council, Trans., 3, 221-224. Fournier, R.O, 1991: Water geothermometers applied to geothermal energy, In: D´Amore, F., (coordinator), Application of geochemistry in geothermal reservoir development. UNITAR-UNDP Publication, Rome, 37-69.

Mutonga 368 Report 15
Fournier, R.O., and Potter, R.W. II, 1979: Magnesium correction to the Na-K-Ca geothermometer. Geochim. Cosmochim. Acta, 43, 1543-1550. Fournier, R.O., and Potter, R.W., 1982: An equation correlating the solubility of quartz in water from 25° to 900°C at pressures up to 10,000 bars. Geochim. Cosmochim. Acta, 46, 1969-1973. Fournier, R.O., and Rowe, J.J., 1962: The solubility of cristobalite along the three-phase curve, gas plus liquid plus cristobalite. Am.Mineralogist 47, 897–902. Fournier, R.O., and Truesdell, A.H., 1973: An empirical Na-K-Ca geothermometer for natural waters. Geochim. Cosmochim. Acta, 37, 1255-1275. Franzson, H., 1998: Reservoir geology of Nesjavellir high-temperature field in SW-Iceland Proceedings of the 19th annual PNOC-EDC Geothermal Conference, Manila, 13-20. Geirsson K.,and Arnórssom, S., 1995: Conceptual model of the Hveragerdi geothermal reservoir based on chemical data. Proceedings of the World Geothermal Congress 1995, Florence, Italy, 2, 1251-1256. Giggenbach, W.F., 1988: Geothermal solute equilibria Derivation of Na–K–Mg-Ca geoindicators. Geochim. Cosmochim. Acta, 52, 2749–2765. Giggenbach, W.F., 1991: Chemical techniques in geothermal exploration. In: D’Amore, F. (Coordinator), Application of geochemistry in geothermal reservoir development. UNITAR/UNDP publication, Rome, 119-142. Giggenbach, W.F., Gonfiantini, R., Jangi, B.L., and Truesdell, A.H., 1983: Isotopic and chemical composition of Parbati Valley geothermal discharges, NW Himalaya, India. Geothermics, 12, 199-222. Gíslason, G., Ívarsson, G., Gunnlaugsson, E., Hjartarson, A., Björnsson, G., and Steingrímsson, B., 2005: Production monitoring as a tool for field development; A case history from the Nesjavellir field, Iceland. Proceedings of the World Geothermal Congress 2005, Antalya, Turkey, CD, 9 pp. Gonfiantini, R., 1978: Standards for isotope measurements in manual compounds. Nature, 271, 534-536. Gudmundsson, B.T., and Arnórsson, S., 2005: Secondary mineral-fluid equilibria in the Krafla and Námafjall geothermal systems, Iceland. Applied Geochemistry, 20, 1607-1625. Gunnarsson, I. and Arnórsson S., 2000: Amorphous silica solubility and the thermodynamic properties of H4SiO4° in the range of 0° to 350°C at Psat. Geochim. Cosmochim. Acta, 64, 2295-2307. Gunnlaugsson, E., and Gíslason, G., 2005: Preparation for a new power plant in the Hengill geothermal area, Iceland. Proceedings of the World Geothermal Congress 2005, Antalya, Turkey, CD 10 pp. Hartanto, D.B., 2005: Borehole geology and alteration mineralogy of well HE-11, Hellisheidi geothermal field, SW-Iceland. Report 8 in: Geothermal Training in Iceland 2005. UNU-GTP, Iceland, 251-264. Ívarsson, G., 1998: Fumaroles gas geochemistry in estimating subsurface temperatures at Hengill in south-western Iceland. Proceedings, of the 9th Symposium on Water-Rock Interaction, Balkema, Rotterdam, 459-462.

Report 15 369 Mutonga
Kristmannsdóttir, H., 1979: Alteration of basaltic rocks by hydrothermal activity at 100-300°C. In: Mortland, M.M., and Farmer, V.C. (editors), International Clay Conference 1978. Elsevier Scientific Publishing Co., Amsterdam, 359-367. Morey, G.W., Fournier, R.O., and Rowe, J.J., 1962: The solubility of quartz in water in the temperature interval from 29 to 300°C. Geochim. Cosmochim. Acta 26, 1029-1043. Natukunda, J.F., 2005: Geothermal exploration in eastern Ölkelduháls field, Hengill area, SW-Iceland. Report 14 in: Geothermal Training in Iceland 2005. UNU-GTP, Iceland, 247-264. Nieva, D., and Nieva, R., 1987: Developments in geothermal energy in Mexico, part 12-A: Cationic composition geothermometer for prospection of geothermal resources. Heat Recovery Systems and CHP, 7, 243-258. Nouraliee, J., 2000: Borehole geology and hydrothermal alteration of well NJ-20, Nesjavellir high-temperature area, SW-Iceland. Report 15 in: Geothermal training in Iceland 2000. UNU-GTP, Iceland, 303-330. Pang, Z., and Ármannsson, H. (editors), 2006: Analytical procedures and quality assurance for geothermal water chemistry. UNU-GTP, Iceland, Report 1, 172 pp. Paces, T. (editor), 1991: Fluid sampling for geothermal prospecting. UNITAR/UNDP publication, Rome, 94 pp. Panichi, C., Celati, R., Noto, P., Squarci, P., Taffi, L., and Tongiorgi, E., 1974: Oxygen and hydrogen isotope studies of Larderello (Italy) geothermal system. Isotope Techniques in Ground Water Hydrology, IAEA, 2, 3-28. Pendon, R.R., 2006. Borehole geology and hydrothermal alteration of well HE-22, Ölkelduháls field, Hengill area, SW-Iceland. Report 18 in: Geothermal training in Iceland 2006. UNU-GTP, Iceland, 357-390. Pope, L.A., Hajash, A., and Popp, R.K., 1987: An experimental investigation of the quartz, Na-K, Na-K-Ca geothermometers and the effect of fluid composition. J. Volcanol. Geotherm. Res., 31, 151-161. Saemundsson, K., 1967: Vulkanismus und Tektonik des Hengill-Gebietes in Sudwest-Island. Acta Nat. Isl., II-7 (in German), 195 pp. Saemundsson, K., 1978: Fissure swarms and central volcanoes of the neovolcanic zones of Iceland. Geol. J., Sp. Issue, 10, 415-432. Saemundsson, K., 1979: Outline of the geology of Iceland. Jökull, 29, 7-28. Saemundson, K., 1995: Geological map of the Hengill area, 1:25,000. Orkustofnun, Reykjavík. Sigmundsson, F., Einarsson, P., Rögnvaldsson, S.T., Foulger G.R., Hodgkinsson, K.M., and Thorbergsson, G., 1997: The 1994-1995 seismicity and deformation at the Hengill triple junction, Iceland: triggering of earthquakes by minor magma injection in a zone of horizontal shear stress. J. Geophys. Res., 102 – B7, 15151-15161. Sigvaldason, G.E., 1963: Epidote and related minerals in two deep geothermal drill holes. Reykjavik and Hveragerdi, Iceland. U.S. Geol. Surv. Prof. paper 450-E, 77-79.

Mutonga 370 Report 15
Sun Zhanxue, 1998: Geothermometry and chemical equilibria of geothermal fluds from Hveragerdi, SW-Iceland, and selected hot springs Jiangxi provice, SE-China. Report 14 in: Geothermal training in Iceland 1998. UNU-GTP, Iceland, 373-402. Sveinbjörnsdóttir, Á.E., 1989: Stable isotope measurements on the thermal water at Nesjavellir and Mosfellssveit geothermal fields, Iceland. Proceedings of the 6th Water Rock Interaction Symposium. Balkema, Rotterdam, 137-149. Sveinbjörnsdóttir, Á.E., and Johnsen, S.J., 1992: Stable isotope study of the Thingvallavatn area. Groundwater origin, age and evaporation models. Oikos,64,136-150. Sveinbjörnsdóttir, Á.E., Johnsen, S., and Arnórsson, S., 1995: The use of stable isotopes of oxygen and hydrogen in geothermal studies in Iceland. Proceedings of the World Geothermal Congress, 1995, Florence, Italy, 2, 1043-1048. Tole, M.P., Ármannsson, H., Pang Z., and Arnórsson, S., 1993: Fluid/mineral equilibrium calculations for geothermal fluids and chemical geothermometry. Geothermics, 22, 17–37. Tonani, F., 1980: Some remarks on the application of geochemical techniques in geothermal exploration. Proceedings of the Adv. Eur. Geoth. Res. 2nd Symposium, Strasbourg, 428-443. Truesdell, A.H., 1976: Summary of section III - geochemical techniques in exploration. Proceedings of the 2nd U.N. Symposium on the Development and Use of Geothermal Resources, San Francisco, 1, liii-lxxix. Verma, M.P., 2000: Chemical thermodynamics of silica: a critique on its geothermometer, Geothermics, 29, 323-346. Verma, S.P., and Santayo, E., 1997: New improved equations for Na/K, Na/Li and SiO2
geothermometers by outlier detection and rejection. J. Volcanol. Geotherm. Res., 79, 9-23.