
The Isolation Approach to Elliott Wave Analysisadd.mtpredictor.net/EWAnalysis.pdf · The isolation...
6
WWW.TRADERSWORLD.COM April/May/June 2018 65 The aim of this article has not been to criticize Elliot Wave theory as traditionally taught, as there are many sources available now that are very good and can give good results. This Article is a description of my own personal journey of Elliott Wave analysis and the way I found to use parts of the Elliott Wave theory, in isolation, to uncover potential trade setups. I started following the markets in 1987, that is over 30 years ago now! In the early days I was looking for an analysis approach that would project where markets would be at some point in the future, and the Elliott Wave Theory seemed to fit this bill. Therefore, I started to look into this, following it in more detail. Over time, I began to become disappointed and frustrated that so often the markets did not unfold as anticipated, and how standard Elliott Wave teachings used alternative counts and ever more complex corrective patterns to try and make the patterns fit in when markets did not unfold as anticipated. I found this very frustrating, but I did like some of the things that the Elliott Wave theory promised, so I did not give up. As I worked with it I realised that much of the time Markets appeared to be random, with no discernible pattern. This observation seemed to be backed up with a number of books being written at the time on how markets were random. But how could the Markets be random if we had Technical Analysis, which used patterns (not just Elliott Wave) with the aim of projecting future Market movement? It then struck me, what if both theories were correct? Where Markets were both random and predictable, but the Markets went through phases where part of the time they were random and part of the time they were predictable. In other words, they went through cycles. With this in mind, I then came back to look at Elliott Wave theory again, and in particular the parts of the theory that were the simplest and easiest patterns to find. The easiest of all was the simple ABC correct. To my joy, the most common place this was found was in the Wave (2) correction. Why was this important? After a Wave (2) correction the Market then very often made a Wave (3) swing, and the Wave (3) swing is usually the strongest and longest in a completed 5 Wave sequence. If you could find the end of the Wave (2) swing to then try and enter a trade as this Wave (2) swing was ending to trade the Wave (3), this would represent a trade setup that had a large potential profit for the smallest initial risk. In other words, when the trade went as anticipated the profit would be much larger than the losses, conversely, when the The Isolation Approach to Elliott Wave Analysis by Steve Griffiths
Transcript of The Isolation Approach to Elliott Wave Analysisadd.mtpredictor.net/EWAnalysis.pdf · The isolation...
WWW.TRADERSWORLD.COM April/May/June 2018 65 PB WWW.TRADERSWORLD.COM July/August/September 2016
The aim of this article has not been to criticize Elliot Wave theory as traditionally taught, as there are many sources available now that are very good and can give good results. This Article is a description of my own personal journey of Elliott Wave analysis and the way I found to use parts of the Elliott Wave theory, in isolation, to uncover potential trade setups.
I started following the markets in 1987, that is over 30 years ago now! In the early days I was looking for an analysis approach that would project where markets would be at some point in the future, and the Elliott Wave Theory seemed to fit this bill. Therefore, I started to look into this, following it in more detail.
Over time, I began to become disappointed and frustrated that so often the markets did not unfold as anticipated, and how standard Elliott Wave teachings used alternative counts and ever more complex corrective patterns to try and make the patterns fit in when markets did not unfold as anticipated. I found this very frustrating, but I did like some of the things that the Elliott Wave theory promised, so I did not give up.
As I worked with it I realised that much of the time Markets appeared to be random, with no discernible pattern. This observation seemed to be backed up with a number of books being written at the time on how markets were random. But how could the Markets be random if we had Technical Analysis, which used patterns (not just Elliott Wave) with the aim of projecting future Market movement?
It then struck me, what if both theories were correct? Where Markets were both random and predictable, but the Markets went through phases where part of the time they were random and part of the time they were predictable. In other words, they went through cycles. With this in mind, I then came back to look at Elliott Wave theory again, and in particular the parts of the theory that were the simplest and easiest patterns to find. The easiest of all was the simple ABC correct. To my joy, the most common place this was found was in the Wave (2) correction. Why was this important? After a Wave (2) correction the Market then very often made a Wave (3) swing, and the Wave (3) swing is usually the strongest and longest in a completed 5 Wave sequence. If you could find the end of the Wave (2) swing to then try and enter a trade as this Wave (2) swing was ending to trade the Wave (3), this would represent a trade setup that had a large potential profit for the smallest initial risk. In other words, when the trade went as anticipated the profit would be much larger than the losses, conversely, when the
The Isolation Approach to Elliott Wave Analysis
by Steve Griffiths
WWW.TRADERSWORLD.COM April/May/June 2018 66 PB WWW.TRADERSWORLD.COM July/August/September 2016
markets did not go as anticipated the losses were kept small. As a Trader, this is all you should be after, a trade setup that has the potential for a large profit, but not just large in Dollars, but large in relation to the inevitable losses. This is where Position Sizing then came in as a way to keep the losses small and the profits large (this is a topic for another article).
So far so good, I now understood why the Elliott Wave Theory, as traditionally taught, seemed to break down so often, because Markets go through cycles swapping between randomness and predictability. The question then became how to make use of this?
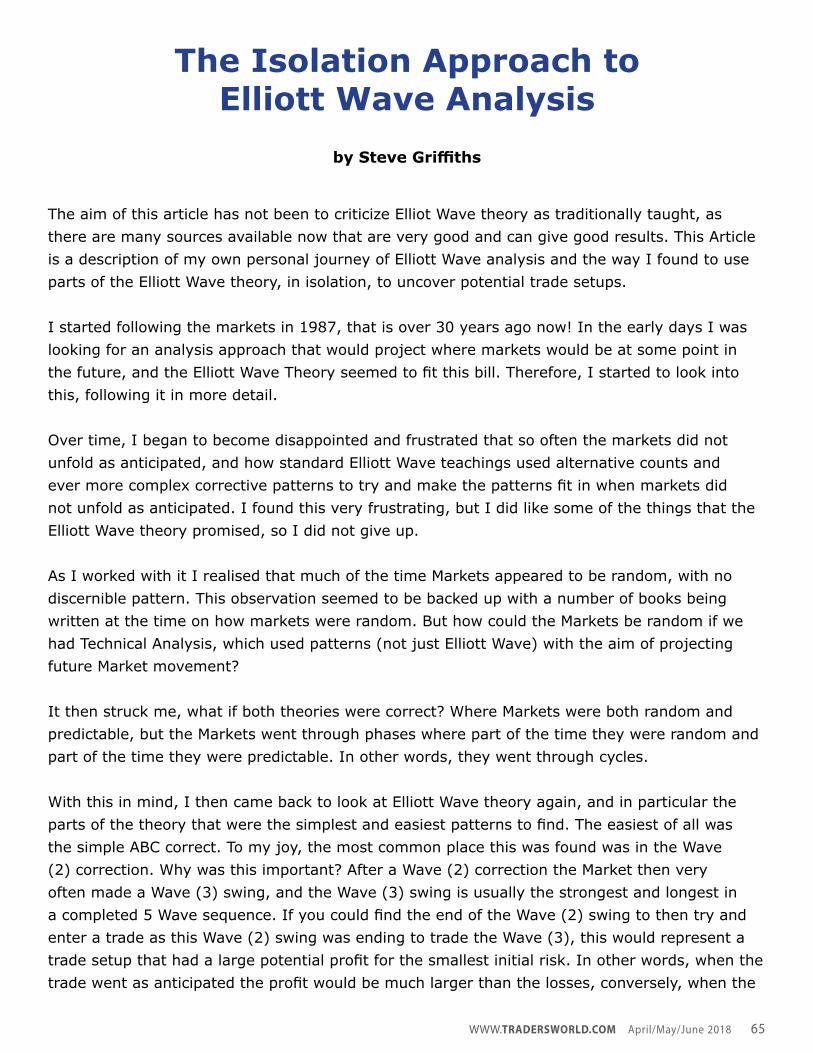
For this I had to look at multi-time frame analysis. Where, I started to look at the higher time frame charts and see when markets entered support or resistance zones on these higher time frame charts. When this started to happen, the assumption was made that markets were starting to leave their random phase and enter a more predictable phase. With the market becoming more predictable on the higher time frame, we could then start to look for trade setups on the lower time frame. In other words, we were only starting to look for Elliott Wave Patterns “in isolation”, once the larger degree position started to become clear. The Isolation Approach to Elliott Wave Analysis was then born!A recent example of this is on the EURCAD Chart, where we first look at the higher time frame to see when the Market started to make meaningful support at one of our MTPredictor DP Support zones:
As you can see in the Chart above, on the 4hr Chart the market was starting to rally (find support) off the DP support zone, which was taken from the last swing low.So now we could assume that this market was starting to come out of its random phase and as
WWW.TRADERSWORLD.COM April/May/June 2018 67 PB WWW.TRADERSWORLD.COM July/August/September 2016
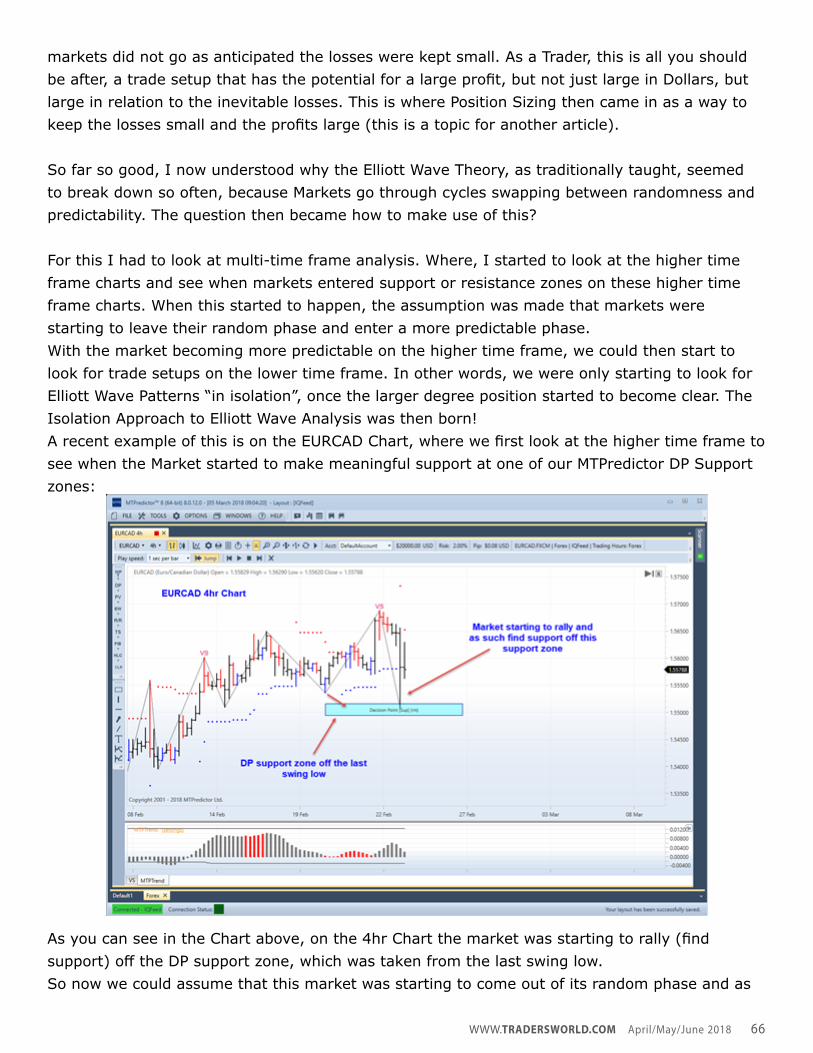
such enter a more predictable phase. Now was the time to start to look for possible trade setups on the shorter time frame (1hr) Chart. Using the Elliott Wave theory “in isolation”, were we used the rally off the higher time frame support zone as our starting point.As I outlined earlier, the best Elliott Wave trade setup would be as the Wave (2) correction was ending to look for the start of a strong Wave (3) Swing:In the Chart below, you can see how the EURCAD made an initial rally off the low (which unfolded at higher time frame support), in Elliott Wave terms this would be considered a Wave (1):
This was then followed by a correction, but not just any correction, one that sub-divided into a minor ABC pattern. In Elliott Wave terms this is a potential Wave (2). We then use Fibonacci clusters to determine a potential support zone for the end of the minor Wave C swing.
If the market then made a low at this point and reversed, then the resulting rally was likely to be a Wave (3), and as outlined earlier, because a Wave (3) is normally the strongest and longest swing in a completed 5 wave sequence, this represented the potential for a large profitable swing in the Market.
Let’s see how this looks on the Chart:
WWW.TRADERSWORLD.COM April/May/June 2018 68 PB WWW.TRADERSWORLD.COM July/August/September 2016
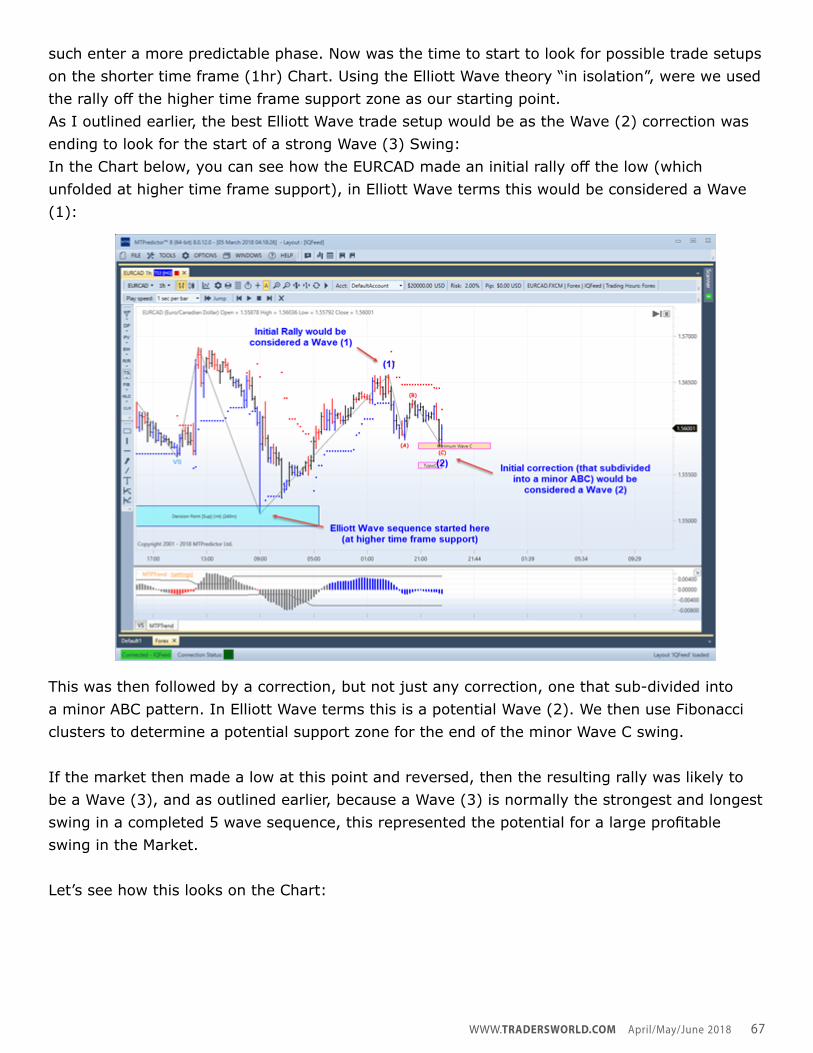
In the chart above, the Analysis projected that if the EURCAD rallied into the Typical Wave 3 WPT (Fibonacci price cluster for a Wave 3), then this would represent a potential profit of just over 6 times the initial risk required to take the trade.
Remember, professional traders are not looking to project or forecast the future, they are just looking for potential trade setups, that over time, produce profits that are larger than the losses.Let’s now move forward in time and see what unfolded:
WWW.TRADERSWORLD.COM April/May/June 2018 69 PB WWW.TRADERSWORLD.COM July/August/September 2016
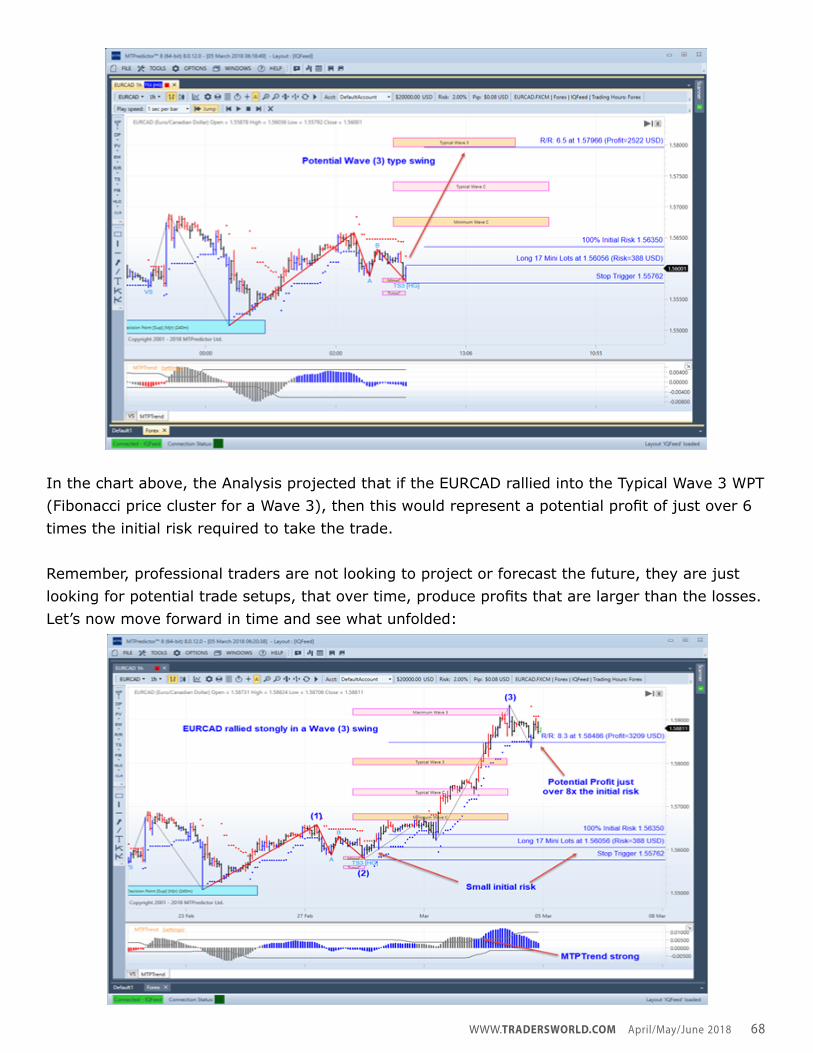
As you can see, the EURCAD rallied strongly to initially reach the projected Typical Wave (3) WPT profit zone. In fact, the EURCAD exceeded this level, which was anticipated by the MTPTrend Indicator breaking above its strength band. Trade Management would then swap to using the ATRStop to follow the market.
The end result was a potential Profit of just over 8 times the initial risk required to take the trade.
Where is the market anticipated (or projected) to go from here? A professional Trader does not care, and this is the whole point, in that after the market has been in a clear pattern, then it is likely to return into the random part of the cycle. As a professional Trader, the market has given a good profitable trade. So, it does not matter what happens next. Professional Trading is all about what goes into and then leaves the Bank account, i.e. Profits and losses, not projecting future Market moves.
Please remember that not all trades work out as well as this example, there will always be losses. The aim, over time, is to have profits that (on average) are larger than the losses. This is why MTPredictor uses Position Sizing to keep the losses small, but not just small in Dollar terms, small in relation to the potential Profits.
The isolation Approach to Elliott Wave Analysis has been able to capture a lovely trade setup, but only as part of a snap shot when the market was in a clear and predictable part of its cycle. Before this, and probably after this, the market will then return to become more random.
The isolation Approach to Elliot Wave Analysis then become a tool where you can start to look for trade setups but only in isolation, after the individual Market has shown (by its own actions) that it is making meaningful support or resistance on the higher time frame.
A similar approach can be used when working with other Elliott Wave patterns, for example the end of a Wave (5) swing.
A Wave (5) is the end of the current swing. This would be considered a trend termination pattern, so more care must be taken. In particular, the Trader must look for other reasons why the current swing may be coming to an end. This is where we again look to the higher time frame chart for potential areas of support or resistance. The Wave (5) pattern is again applied in isolation, but the important point is, that the Wave 5 swing appears to be coming to an end in the same area as higher time frame support or resistance.
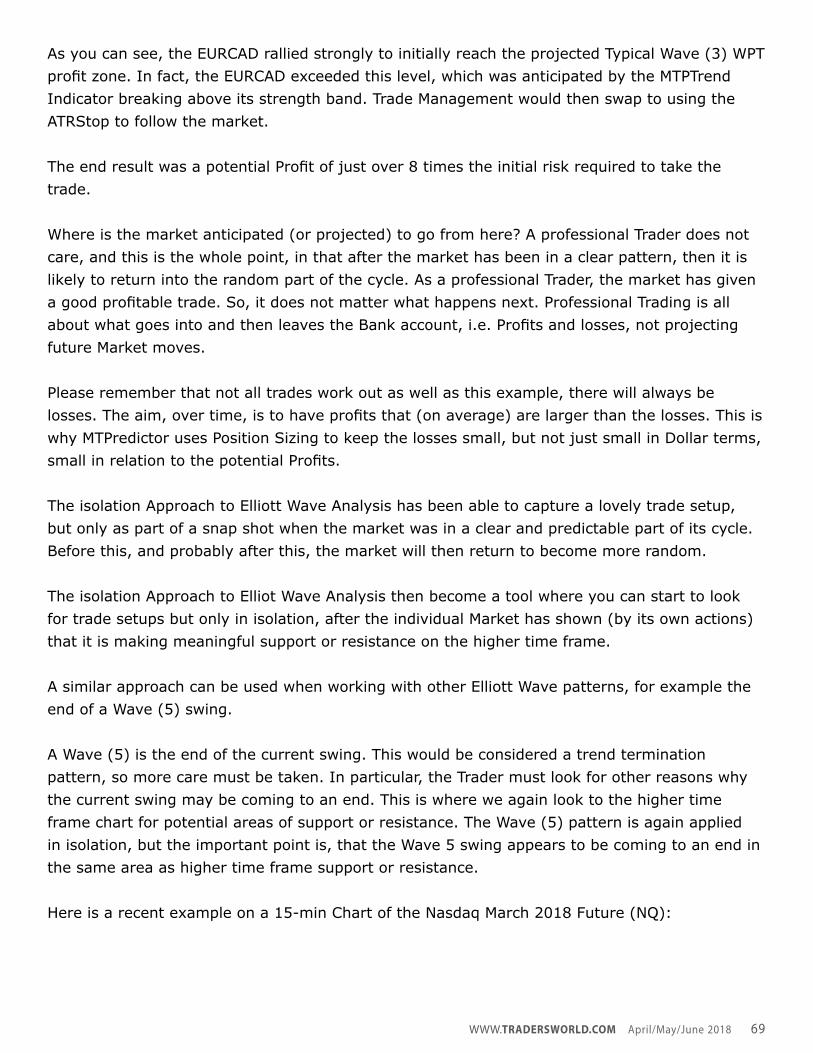
Here is a recent example on a 15-min Chart of the Nasdaq March 2018 Future (NQ):
WWW.TRADERSWORLD.COM April/May/June 2018 70 PB WWW.TRADERSWORLD.COM July/August/September 2016
We can see that a Wave (5) swing started to find support, both at the minimum Wave 5 WPT (Fibonacci price cluster) as well as the DP support zone from the higher time frame (1hr) Chart. The Profit target for this type of setup is the DP taken from the prior Wave (4) Swing.
The NQ rallied up into the Profit target for a potential Profit of approximately 2.9 times the initial risk (ignoring slippage and commission). Again, Position Sizing was used to keep the initial risk small in relation to the potential profit.
Although this setup is higher risk than the previous one (off the end of a Wave 2) it uses the same basic idea of applying the Elliot Wave patterns in isolation. The aim is not to try and fit this pattern in with any pattern coming before it, nor to use it to predict any pattern moving forward, beyond the initial Profit target.
Although, the end of a Wave (5) setup has the potential to catch the very end of a trend, my personal favourite setup is the previous one, mainly because it has the added confirmation of looking for a correction after a major turn has already unfolded at higher time frame support or resistance. Also, because the Wave (3) tends to be the longest and strongest swing in a completed 5 Wave sequence, as such this setup usually has the largest potential profit in relation to the initial risk. This setup is one of the automatic setups that is found in the MTPredictor software program.
Steve Griffiths is the developer of the MTPredictor software program (www.MTPredictor.com) that uses as it basis Steve’s Isolation Approach to Elliott Wave. MTPredictor was launched in 2001, and Steve first started following the Markets in 1987. During that time Steve has presented many training seminars, written many articles and even presented on CNBC Europe.Steve Griffiths