The ISO Survey of ISO 9000 and ISO 14001 Certificates ...
19
The ISO Survey : twelfth cycle (2002) highlights . . . . . . . . . . . . . . . . . . . . . . . . . . . . . . . . . . . . . . . . . . . . . . . . . . . . . . . . . . . . . . . . . . . . . . 3 ISO 9000 . . . . . . . . . . . . . . . . . . . . . . . . . . . . . . . . . . . . . . . . . . . . . . . . . . . . . . . . . . . . . . . . . . . . . . . . . . . . . . . . . . . . . . . . . . . . . . . . . . . . . . . . . . . . . . . . . . . . . . . . . . . . . . . . . . . . . . . . . . . . . . . . . . . . 3 ISO 9001:2000 . . . . . . . . . . . . . . . . . . . . . . . . . . . . . . . . . . . . . . . . . . . . . . . . . . . . . . . . . . . . . . . . . . . . . . . . . . . . . . . . . . . . . . . . . . . . . . . . . . . . . . . . . . . . . . . . . . . . . . . . . . . . . 4 Top ten countries for ISO 9001:2000 certificates . . . . . . . . . . . . . . . . . . . . . . . . . . . . . . . . . . . . . . . . . . . . . . . . . . . . . . . 4 ISO 14001 . . . . . . . . . . . . . . . . . . . . . . . . . . . . . . . . . . . . . . . . . . . . . . . . . . . . . . . . . . . . . . . . . . . . . . . . . . . . . . . . . . . . . . . . . . . . . . . . . . . . . . . . . . . . . . . . . . . . . . . 5 The ISO 9000 and ISO 14000 families . . . . . . . . . . . . . . . . . . . . . . . . . . . . . . . . . . . . . . . . . . . . . . . . 6 Certification . . . . . . . . . . . . . . . . . . . . . . . . . . . . . . . . . . . . . . . . . . . . . . . . . . . . . . . . . . . . . . . . . . . . . . . . . . . . . . . . . . . . . . . . . . . . . . . . . . . . . . . . . . . 7 The certification standards . . . . . . . . . . . . . . . . . . . . . . . . . . . . . . . . . . . . . . . . . . . . . . . . . . . . . . . . . . . . . . . . . . . . . . . . . 7 Background to The ISO Survey . . . . . . . . . . . . . . . . . . . . . . . . . . . . . . . . . . . . . . . . . . . . . . . . . . . 8 The twelfth cycle (2002) . . . . . . . . . . . . . . . . . . . . . . . . . . . . . . . . . . . . . . . . . . . . . . . . . . . . . . . . . . . . 10 ISO 9000 . . . . . . . . . . . . . . . . . . . . . . . . . . . . . . . . . . . . . . . . . . . . . . . . . . . . . . . . . . . . . . . . . . . . . . . . . . . . . . . . . . . . . . . . . . . 12 ISO 9000 – certifications worldwide . . . . . . . . . . . . . . . . . . . . . . . . . . . . 12 ISO 9001:2000 certificates . . . . . . . . . . . . . . . . . . . . . . . . . . . . . . . . . . . . . . . . . . . . . . . . 19 Regional share . . . . . . . . . . . . . . . . . . . . . . . . . . . . . . . . . . . . . . . . . . . . . . . . . . . . . . . . . . . . . . . . . . . . . . . . . 20 ISO 9000 – country highlights . . . . . . . . . . . . . . . . . . . . . . . . . . . . . . . . . . . . . . 21 Top ten countries for ISO 9000 growth . . . . . . . . . . . . . . . . . . . . . . . . . . . . . . . 21 Certification milestones . . . . . . . . . . . . . . . . . . . . . . . . . . . . . . . . . . . . . . . . . . . . . . . . . . . . . . . . . . . . 21 Newcomers . . . . . . . . . . . . . . . . . . . . . . . . . . . . . . . . . . . . . . . . . . . . . . . . . . . . . . . . . . . . . . . . . . . . . . . . . . . . . . . . . . . . 21 ISO 9000 by industrial sector . . . . . . . . . . . . . . . . . . . . . . . . . . . . . . . . . . . . . . . . 22 Highest number of certificates by industrial sector . . . . . . . . . . . . . . . . . . . . . . . . . . . . . . . . . . . . . . . . . . . . . . . . . . . . . . . . . . . . . . . . . 23 Withdrawn ISO 9000 certificates . . . . . . . . . . . . . . . . . . . . . . . . . . . . . . . . . . . . 24 ISO 14001 . . . . . . . . . . . . . . . . . . . . . . . . . . . . . . . . . . . . . . . . . . . . . . . . . . . . . . . . . . . . . . . . . . . . . . . . . . . . . . . . . . . . . . . . . . 27 ISO 14001 – certifications worldwide . . . . . . . . . . . . . . . . . . . . . . . . . . . . . . . . 27 Regional share . . . . . . . . . . . . . . . . . . . . . . . . . . . . . . . . . . . . . . . . . . . . . . . . . . . . . . . . . . . . . . . . . . . . . . . . . . . . . . . . . . . . . . . 33 ISO 14001 – country highlights . . . . . . . . . . . . . . . . . . . . . . . . . . . . . . . . . . . . . . . . . . . . . . . . . . . . . . 34 Top ten countries for ISO 14001 growth . . . . . . . . . . . . . . . . . . . . . . . . . . . . . . . . . . . . . . . . . . . . . . . . . . . 34 Certification milestones . . . . . . . . . . . . . . . . . . . . . . . . . . . . . . . . . . . . . . . . . . . . . . . . . . . . . . . . . . . . . . . . . . . . . . . . . . . . . . . . . . . . . . . . 34 Newcomers . . . . . . . . . . . . . . . . . . . . . . . . . . . . . . . . . . . . . . . . . . . . . . . . . . . . . . . . . . . . . . . . . . . . . . . . . . . . . . . . . . . . . . . . . . . . . . . . . . . . . . . . . . . . . . . . . . . . . . 35 ISO 14001 by industrial sector . . . . . . . . . . . . . . . . . . . . . . . . . . . . . . . . . . . . . . . . . . . . . . . . . . . . . . . . . . . . . . . . . . . . . . . . . . . . . . 36 Highest number of certificates by industrial sector . . . . . . . . . . . . . . . . . . . . . . . . . . . . . . . . . . . . . . . 37 Withdrawn ISO 14001 certificates . . . . . . . . . . . . . . . . . . . . . . . . . . . . . . . . . . . . . . . . . . . . . . . . . . . . . . . . . . . . . . . . . . . . . . . . . . . . . . . . . . . . . . . . 38 ISO updates guidelines for publicizing ISO 9001 and ISO 14001 certification . . . . 40 Twelfth cycle : up to and including 31 December 2002 Page Ta b l e of co nte nt s The ISO Survey of ISO 9000 and ISO 14001 Certificates
Transcript of The ISO Survey of ISO 9000 and ISO 14001 Certificates ...
The ISO Survey : twelfth cycle (2002) highlights . . . . . . . . . . . . . . . . . . . . . . . . . . . . . . . . . . . . . . . . . . . . . . . . . . . . . . . . . . . . . . . . . . . . . . 3
ISO 9000 . . . . . . . . . . . . . . . . . . . . . . . . . . . . . . . . . . . . . . . . . . . . . . . . . . . . . . . . . . . . . . . . . . . . . . . . . . . . . . . . . . . . . . . . . . . . . . . . . . . . . . . . . . . . . . . . . . . . . . . . . . . . . . . . . . . . . . . . . . . . . . . . . . . . 3
ISO 9001:2000 . . . . . . . . . . . . . . . . . . . . . . . . . . . . . . . . . . . . . . . . . . . . . . . . . . . . . . . . . . . . . . . . . . . . . . . . . . . . . . . . . . . . . . . . . . . . . . . . . . . . . . . . . . . . . . . . . . . . . . . . . . . . . 4
Top ten countries for ISO 9001:2000 certificates . . . . . . . . . . . . . . . . . . . . . . . . . . . . . . . . . . . . . . . . . . . . . . . . . . . . . . . 4
ISO 14001 . . . . . . . . . . . . . . . . . . . . . . . . . . . . . . . . . . . . . . . . . . . . . . . . . . . . . . . . . . . . . . . . . . . . . . . . . . . . . . . . . . . . . . . . . . . . . . . . . . . . . . . . . . . . . . . . . . . . . . . 5
The ISO 9000 and ISO 14000 families . . . . . . . . . . . . . . . . . . . . . . . . . . . . . . . . . . . . . . . . . . . . . . . . 6
Certification . . . . . . . . . . . . . . . . . . . . . . . . . . . . . . . . . . . . . . . . . . . . . . . . . . . . . . . . . . . . . . . . . . . . . . . . . . . . . . . . . . . . . . . . . . . . . . . . . . . . . . . . . . . 7
The certification standards . . . . . . . . . . . . . . . . . . . . . . . . . . . . . . . . . . . . . . . . . . . . . . . . . . . . . . . . . . . . . . . . . . . . . . . . . 7
Background to The ISO Survey . . . . . . . . . . . . . . . . . . . . . . . . . . . . . . . . . . . . . . . . . . . . . . . . . . . 8
The twelfth cycle (2002) . . . . . . . . . . . . . . . . . . . . . . . . . . . . . . . . . . . . . . . . . . . . . . . . . . . . . . . . . . . . 10
ISO 9000 . . . . . . . . . . . . . . . . . . . . . . . . . . . . . . . . . . . . . . . . . . . . . . . . . . . . . . . . . . . . . . . . . . . . . . . . . . . . . . . . . . . . . . . . . . . 12
ISO 9000 – certifications worldwide . . . . . . . . . . . . . . . . . . . . . . . . . . . . 12
ISO 9001:2000 certificates . . . . . . . . . . . . . . . . . . . . . . . . . . . . . . . . . . . . . . . . . . . . . . . . 19
Regional share . . . . . . . . . . . . . . . . . . . . . . . . . . . . . . . . . . . . . . . . . . . . . . . . . . . . . . . . . . . . . . . . . . . . . . . . . 20
ISO 9000 – country highlights . . . . . . . . . . . . . . . . . . . . . . . . . . . . . . . . . . . . . . 21
Top ten countries for ISO 9000 growth . . . . . . . . . . . . . . . . . . . . . . . . . . . . . . . 21
Certification milestones . . . . . . . . . . . . . . . . . . . . . . . . . . . . . . . . . . . . . . . . . . . . . . . . . . . . . . . . . . . . 21
Newcomers . . . . . . . . . . . . . . . . . . . . . . . . . . . . . . . . . . . . . . . . . . . . . . . . . . . . . . . . . . . . . . . . . . . . . . . . . . . . . . . . . . . . 21
ISO 9000 by industrial sector . . . . . . . . . . . . . . . . . . . . . . . . . . . . . . . . . . . . . . . . 22
Highest number of certificates by industrial sector . . . . . . . . . . . . . . . . . . . . . . . . . . . . . . . . . . . . . . . . . . . . . . . . . . . . . . . . . . . . . . . . . 23
Withdrawn ISO 9000 certificates . . . . . . . . . . . . . . . . . . . . . . . . . . . . . . . . . . . . 24
ISO 14001 . . . . . . . . . . . . . . . . . . . . . . . . . . . . . . . . . . . . . . . . . . . . . . . . . . . . . . . . . . . . . . . . . . . . . . . . . . . . . . . . . . . . . . . . . . 27
ISO 14001 – certifications worldwide . . . . . . . . . . . . . . . . . . . . . . . . . . . . . . . . 27
Regional share . . . . . . . . . . . . . . . . . . . . . . . . . . . . . . . . . . . . . . . . . . . . . . . . . . . . . . . . . . . . . . . . . . . . . . . . . . . . . . . . . . . . . . . 33
ISO 14001 – country highlights . . . . . . . . . . . . . . . . . . . . . . . . . . . . . . . . . . . . . . . . . . . . . . . . . . . . . . 34
Top ten countries for ISO 14001 growth . . . . . . . . . . . . . . . . . . . . . . . . . . . . . . . . . . . . . . . . . . . . . . . . . . . 34
Certification milestones . . . . . . . . . . . . . . . . . . . . . . . . . . . . . . . . . . . . . . . . . . . . . . . . . . . . . . . . . . . . . . . . . . . . . . . . . . . . . . . . . . . . . . . . 34
Newcomers . . . . . . . . . . . . . . . . . . . . . . . . . . . . . . . . . . . . . . . . . . . . . . . . . . . . . . . . . . . . . . . . . . . . . . . . . . . . . . . . . . . . . . . . . . . . . . . . . . . . . . . . . . . . . . . . . . . . . . 35
ISO 14001 by industrial sector . . . . . . . . . . . . . . . . . . . . . . . . . . . . . . . . . . . . . . . . . . . . . . . . . . . . . . . . . . . . . . . . . . . . . . . . . . . . . . 36
Highest number of certificates by industrial sector . . . . . . . . . . . . . . . . . . . . . . . . . . . . . . . . . . . . . . . 37
Withdrawn ISO 14001 certificates . . . . . . . . . . . . . . . . . . . . . . . . . . . . . . . . . . . . . . . . . . . . . . . . . . . . . . . . . . . . . . . . . . . . . . . . . . . . . . . . . . . . . . . . 38
ISO updates guidelines for publicizing ISO 9001 and ISO 14001 certification . . . . 40
Twelfth cycle :up to and including 31 December 2002
Page
T a b l e o f c o n t e n t s
The ISO Survey of ISO 9000 and ISO 14001 Certificates
The ISO Survey of ISO 9000 and ISO 14001 Certificates2
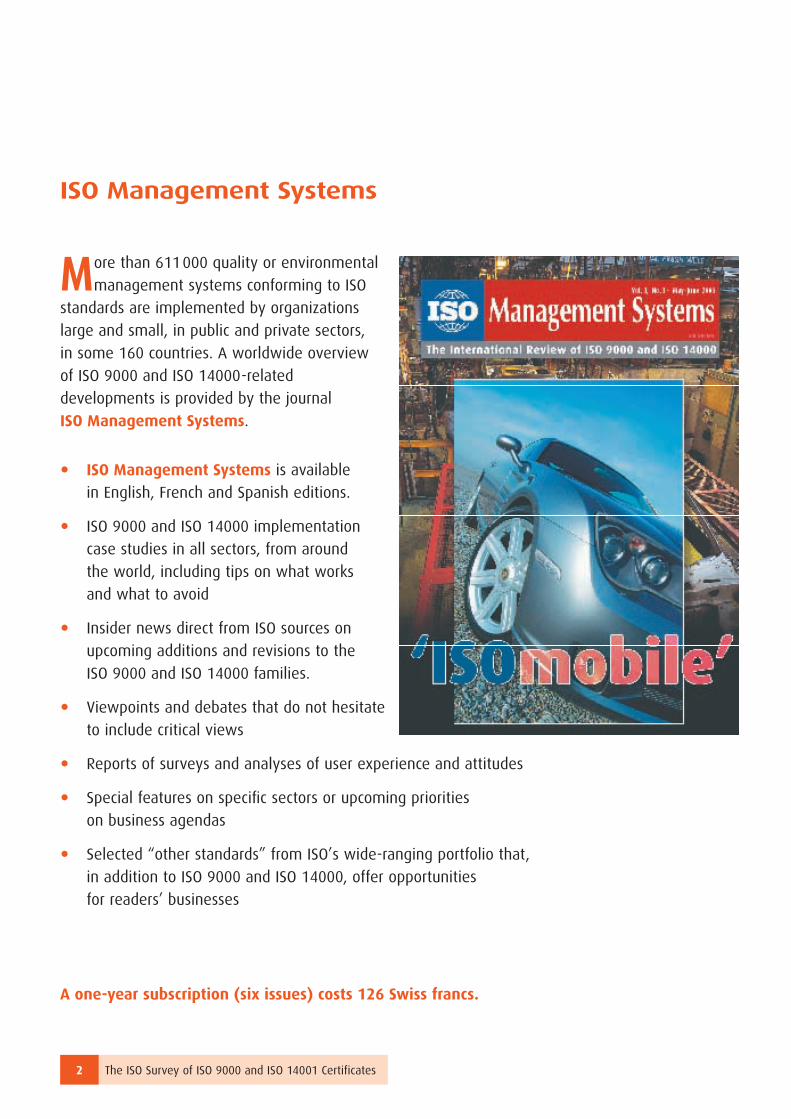
ISO Management Systems
More than 611 000 quality or environmental
management systems conforming to ISO
standards are implemented by organizations
large and small, in public and private sectors,
in some 160 countries. A worldwide overview
of ISO 9000 and ISO 14000-related
developments is provided by the journal
ISO Management Systems.
! ISO Management Systems is available
in English, French and Spanish editions.
! ISO 9000 and ISO 14000 implementation
case studies in all sectors, from around
the world, including tips on what works
and what to avoid
! Insider news direct from ISO sources on
upcoming additions and revisions to the
ISO 9000 and ISO 14000 families.
! Viewpoints and debates that do not hesitate
to include critical views
! Reports of surveys and analyses of user experience and attitudes
! Special features on specifi c sectors or upcoming priorities
on business agendas
! Selected “other standards” from ISO’s wide-ranging portfolio that,
in addition to ISO 9000 and ISO 14000, offer opportunities
for readers’ businesses
A one-year subscription (six issues) costs 126 Swiss francs.

The ISO Survey of ISO 9000 and ISO 14001 Certificates 3
ISO 9000Up to the end of December 2002, at least 561 747 ISO 9000 certificates had been issued in 159 countries and economies, an increase of 51 131 certificates (+ 10,02 %) over the end of December 2001, when the total stood at 510 616 in 161 countries.
The ISO Survey : twelfth cycle (2002) highlights
Worldwide total of ISO 9000 certificates January 1993 to December 2002
Annual growth of ISO 9000 certificates January 1993 to December 2002
World results
World total
World growth
Number of countries/economies
Dec. 2002
Total 561 747 51 131 159of
which
9001:
2000
167 210 134
Dec. 2001
Total 510 616 101 198 161of
which
9001:
2000
44 388 98
Dec. 2000
408 631 64 988 157
Dec. 1999
343 643 71 796 150
Dec. 1998
271 847 48 548 141
Dec. 1997
223 299 60 698 126
Dec. 1996
162 701 35 352 113
Dec. 1995
127 349 32 232 96
Mar. 1995
95 117 24 753 88
Jun. 1994
70 364 23 793 75
Sep. 1993
46 571 18 755 60
Jan. 1993
27 816 48
Jan. 93 Sep. 93 Jun. 94 Mar 95 Dec. 95 Dec. 96 Dec. 97 Dec. 98 Dec. 99 Dec. 00 Dec. 01 Dec. 02
110 000
100 000
90 000
80 000
70 000
60 000
50 000
40 000
30 000
20 000
10 000
0
Jan. 93 Sep. 93 Jun. 94 Mar 95 Dec. 95 Dec. 96 Dec. 97 Dec. 98 Dec. 99 Dec. 00 Dec. 01 Dec. 02
600 000
550 000
500 000
450 000
400 000
350 000
300 000
250 000
200 000
150 000
100 000
50 000
0

The ISO Survey of ISO 9000 and ISO 14001 Certificates4
Top ten countries for ISO 9001:2000 certificates
Of the ISO 9000 total, 167 210 were certificates of conformity to ISO 9001:2000. The number of certificates issued to the revised standard, which replaces the 1994 versions of ISO 9001, ISO 9002
herefore more than n 2002 in comparisone 2001 total of 44 388 d represented 29,77 %f the overall total of61 747 at the end
of 2002.
ISO 9001:2000
150 000
100 000
50 000
2001 2002
44 388
167 210
ISO 9001:2000
167 210
ISO 9000(1994 + 2000 versions)
561 747
2002
40 997
16 81314 733
10 8119 301 8 872
7 024 6 5295 060 4 587
The ISO Survey of ISO 9000 and ISO 14001 Certificates 5
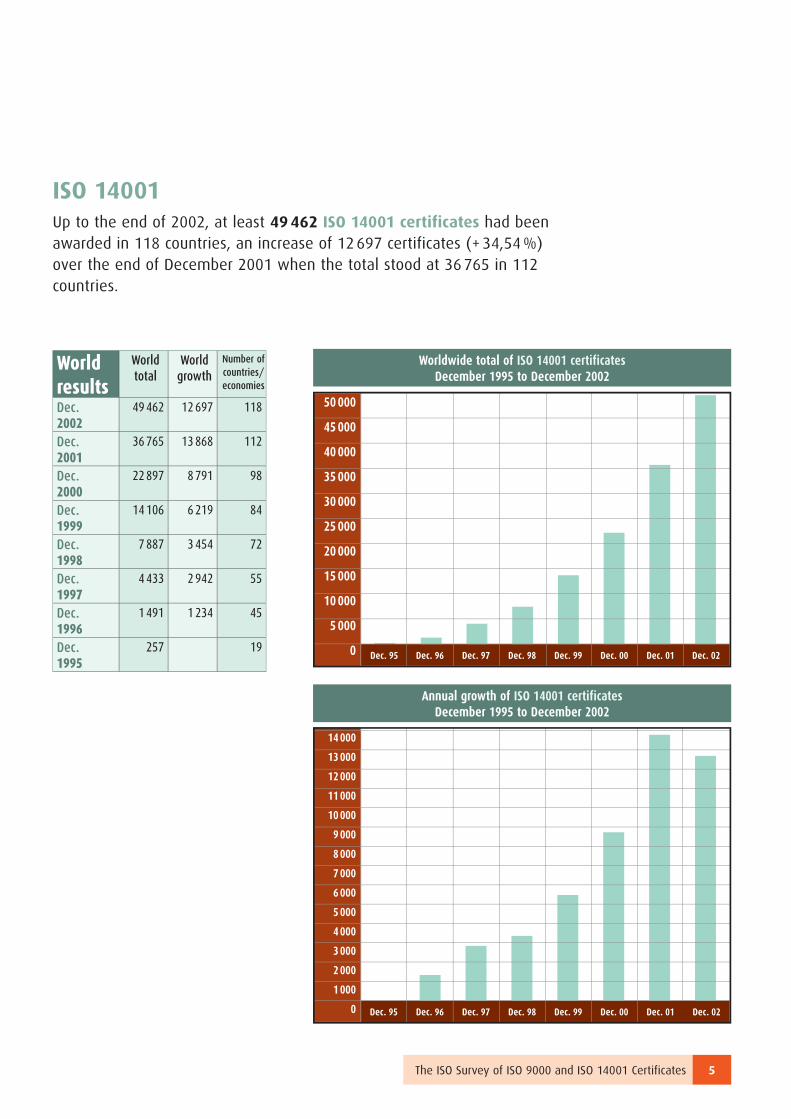
ISO 14001Up to the end of 2002, at least 49 462 ISO 14001 certificates had been awarded in 118 countries, an increase of 12 697 certificates (+ 34,54 %) over the end of December 2001 when the total stood at 36 765 in 112 countries.
Worldwide total of ISO 14001 certificates December 1995 to December 2002
Annual growth of ISO 14001 certificates December 1995 to December 2002
Dec. 95 Dec. 96 Dec. 97 Dec. 98 Dec. 99 Dec. 00 Dec. 01 Dec. 02
50 000
45 000
40 000
35 000
30 000
25 000
20 000
15 000
10 000
5 000
0
World results
World total
World growth
Number of countries/economies
Dec. 2002
49 462 12 697 118
Dec. 2001
36 765 13 868 112
Dec. 2000
22 897 8 791 98
Dec. 1999
14 106 6 219 84
Dec. 1998
7 887 3 454 72
Dec. 1997
4 433 2 942 55
Dec. 1996
1 491 1 234 45
Dec. 1995
257 19
14 000
13 000
12 000
11 000
10 000
9 000
8 000
7 000
6 000
5 000
4 000
3 000
2 000
1 000
0 Dec. 95 Dec. 96 Dec. 97 Dec. 98 Dec. 99 Dec. 00 Dec. 01 Dec. 02

The ISO Survey of ISO 9000 and ISO 14001 Certificates12
Africa/West Asia Dec. 1997
Dec. 1998
Dec. 1999
Dec. 2000
Dec. 2001 Dec. 2002
Total of which9001:2000
Total of which9001:2000
Afghanistan 1 1 1 3 5 1 1Algeria 2 4 9 12 6 39 16
Angola 5 5
Bahrain 30 31 31 33 59 3 55 2
Bangladesh 1 4 25 25 38 43 6
Benin 2
Botswana 4 4 4 6 5 6 2
Cameroon 5 5 5 8 8 7
Central African Rep. 2
Chad 2 2 2
Congo, Dem. Rep. of 1 1 1 1 1
Congo, Republic of 2 2 2 2 2
Côte d’Ivoire 4 8 8 10 10 25 4
Egypt 344 385 649 468 546 18 642 222
Ethiopia 1
Gabon 2 3 5 6 5 1
Ghana 2 2 3 3 6 5
Guinea 1 2 2 3
India 2 865 3 344 5 200 5 682 5 554 544 8 110 2 247
Iran 131 224 259 433 618 37 607 16
Israel 2 303 3 700 4 600 6 140 6 447 33 6 040 408
Jordan 35 169 257 336 402 438 34
Kenya 28 416 419 173 112 8 46 11
Kuwait 28 62 67 74 78 11 40 7
Lebanon 15 37 66 86 129 14 104 27
Libyan Arab Jamihiriya 1 1 1 1 4 1 7 2
Madagascar 1 1 1
Malawi 1 1 1 1 2 2
Maldives 1 1 1 1 3
Mali 5 5 5 5 5
Mauritius 72 92 92 131 175 3 210 32
Morocco 60 71 77 86 158 14 164 46
Mozambique 1 3 3 4 7 2Namibia 2 14 19 24 24 17
ISO 9000 certifications worldwide : growth from 1997 to end of 2002
(continued)

The ISO Survey of ISO 9000 and ISO 14001 Certificates 13
T O T A L
Niger 3Nigeria 3 20 20 20 22 85 3
Oman 53 70 82 66 67 25 109 32
Pakistan 56 145 194 611 539 96 795 186
Palestine 5 14 23 78 91 13
Qatar 20 20 20 55 52 13 45 11
Saudi Arabia 211 280 324 610 705 6 558 131
Senegal 1 1 4 8 8 15 9
Seychelles 2 2 5 5 6 9 2
Sierra Leone 1 1 1 1 1
Somalia 1
South Africa 1 915 2 166 3 316 3 454 2 263 87 2 625 401
Sri Lanka 38 59 82 82 155 1 322 34
Sudan 1 1 1 1 3 2 10 9
Swaziland 2 6 7 8 11 29 8
Syrian Arab Rep. 7 13 93 128 158 4 201 38
Tanzania 1 2 4 4 5
Tunisia 51 70 163 196 302 10 376 30
Uganda 32 60 7 72 31
United Arab Emirates 314 632 1 045 1 007 747 112 1 424 407
Yemen 2 8 12 12 10 12 4
Zambia 3 4 4 4 10 21 1Zimbabwe 49 60 112 103 134 2 91 2
Africa/West Asia 8 668 12 150 17 307 20 185 19 751 23 534
Share in percent 3,88 4,47 5,04 4,94 3,87 4,19
No. of countries/
economies40 48 49 52 51 51
Total 9001:2000 1 058 4 444
Share in percent 2,39 2,66
No. of countries/
economies25 39
Africa/West Asia(continued)
Dec. 1997
Dec. 1998
Dec. 1999
Dec. 2000
Dec. 2001 Dec. 2002
Total of which9001:2000
Total of which9001:2000

The ISO Survey of ISO 9000 and ISO 14001 Certificates14
Argentina 397 807 1 388 2 056 2 324 203 2 260 710Antigua & Barbuda 1 1 1 1 1
Bahamas 1 1 2 2 1 1
Barbados 7 7 7 14 11 20 6
Belize 4 2 2 2
Bermuda 3 4 4 5 6 6
Bolivia 2 4 20 42 31 10
Brazil 2 068 3 712 6 257 6 719 9 489 182 7 900 1 582
Cayman Islands (UK) 1 1
Chile 34 61 135 235 229 15 327 92
Colombia 170 213 388 614 1 117 87 1 838 728
Costa Rica 7 12 33 79 60 5 89 23
Cuba 11 13 21 26 25 34 3
Dominica 1 1 3 1
Dominican Rep. 5 7 7 8 25 10
Ecuador 13 16 37 89 33 2 34 8
El Salvador 3 3 6 19 17 1 12 3
Grenada 1 1 1 2 2 1
Guatemala 1 3 3 8 18 3 22 7
Guyana 3 3 3 4 5 7 1
Honduras 2 3 4 11 16 5
Jamaica 10 12 12 20 15 1 20 1
Netherlands Antilles (NL) 1 2 1
Nicaragua 1 1 3 5 11 6
Panama 9 17 19 19 33 4 49 13
Paraguay 3 6 9 30 46 4 65 21
Peru 13 46 74 141 200 16 270 82
Puerto Rico 31 36 37 37 51 39 2
Saint Lucia 4 4 4 3 3
Surinam 1 1 1
Trinidad/Tobago 10 19 25 25 29 33 6
Uruguay 32 49 154 251 241 41 231 116Venezuela 157 163 336 368 373 14 342 47
Central and South America
Dec. 1997
Dec. 1998
Dec. 1999
Dec. 2000
Dec. 2001 Dec. 2002
Total of which9001:2000
Total of which9001:2000

The ISO Survey of ISO 9000 and ISO 14001 Certificates 15
Canada 5 852 7 585 10 556 11 435 11 635 704 12 371 2 125Mexico 711 978 1 556 1 843 2 233 79 2 508 265USA 18 581 24 987 33 054 35 018 37 026 1 104 38 927 4 587
North America Dec. 1997
Dec. 1998
Dec. 1999
Dec. 2000
Dec. 2001 Dec. 2002
Total of which9001:2000
Total of which9001:2000
*Data received from Quality Systems Update and WorldPreferred
T O T A L
T O T A L
Central and South America 2 989 5 221 8 972 10 805 14 423 13 660
Share in percent 1,34 1,92 2,61 2,64 2,83 2,44
No. of countries/economies 23 28 29 30 33 33
Total 9001:2000 580 3 475
Share in percent 1,31 2,08
No. of countries/economies 15 24
North America* 25 144 33 550 45 166 48 296 50 894 53 806
Share in percent 11,25 12,34 13,14 11,82 9,97 9,58
No. of countries/economies 3 3 3 3 3 3
Total 9001:2000 1 887 6 977
No. of countries/economies 4,26 4,18
No. of countries 3 3

The ISO Survey of ISO 9000 and ISO 14001 Certificates16
(continued)
Albania 1 1 2 1Andorra 1 7 5 3 3
Armenia 4 4 3 12 1
Austria 2 627 3 245 3 421 3 826 4 000 700 4 094 1 879
Azerbaijan 1 1 1 1
Belarus 6 14 26 58 78 115 16
Belgium 3 042 3 176 3 495 3 760 4 670 119 4 725 1 285
Bosnia and Herzegovina 2 10 34 33 57 1 62 8
Bulgaria 42 96 199 259 469 38 629 246
Croatia 96 121 203 302 415 30 590 194
Cyprus 42 62 184 289 334 10 352 160
Czech Rep. 746 1 443 1 500 3 855 5 627 320 8 489 1 125
Denmark 1 902 2 200 1 962 2 258 2 163 36 1 900 447
Estonia 1 26 77 175 202 66 281 167
Finland 1 445 1 450 1 514 1 651 1 870 282 1 872 643
France 11 920 14 194 16 028 17 170 20 919 2 194 19 870 6 529
Georgia 2 7 7 8 3
Germany 20 656 24 055 30 150 32 500 41 629 2 338 35 802 10 811
Gibraltar (UK) 1 25 1
Greece 682 764 1 050 2 173 2 325 31 3 180 540
Hungary 1 341 1 660 3 282 4 672 6 362 1 349 9 254 4 446
Iceland 59 62 28 28 30 27 6
Ireland 2 534 2 854 3 100 3 330 3 700 248 2 845 494
Italy 12 134 18 095 21 069 30 367 48 109 1 974 61 212 14 733
Kazakhstan 1 2 41 21 83 16
Kyrgyzstan 2 3 6 4
Latvia 1 14 39 94 67 15 93 33
Liechtenstein 3 85 111 111 73 14 73 38
Lithuania 29 40 91 173 202 29 280 158
Luxembourg 89 106 113 136 108 5 148 41
Macedonia 8 21 46 49 69 1 59 7
Malta 45 49 56 176 207 25 222 122
Moldova 6 10 14 15 7 15 6
Monaco 20 20 20 26 26 27 5
Netherlands 10 380 10 570 10 620 11 036 12 745 750 13 198 2 803
Norway 1 273 1 503 1 509 1 600 1 703 75 1 344 405
Poland 669 768 1 012 2 075 2 622 232 3 091 914
Portugal 819 944 1 131 1 696 2 474 188 3 061 965
Europe Dec. 1997
Dec. 1998
Dec. 1999
Dec. 2000
Dec. 2001 Dec. 2002
Total of which9001:2000
Total of which9001:2000

The ISO Survey of ISO 9000 and ISO 14001 Certificates 17
T O T A L
Europe 143 674 166 255 190 248 220 127 269 950 292 970
Share in percent 64,31 61,13 55,36 53,87 52,87 52,16
No. of countries/economies 42 42 47 50 51 50
Total 9001:2000 22 888 76 678
Share in percent 51,57 45,86
No. of countries/economies 38 48
Romania 214 269 466 1 032 1 670 87 2 463 767Russian Federation 95 132 541 1 134 1 517 35 1 710 314
San Marino, Rep of 19 19 25 30 30
Slovakia 404 575 560 522 827 144 1 544 768
Slovenia 467 502 521 843 1 026 34 973 330
Spain 4 268 6 412 8 699 12 576 17 749 808 28 690 8 872
Sweden 2 789 3 489 3 786 4 358 4 652 145 4 039 833
Switzerland 4 653 6 426 7 124 8 660 8 605 1 931 10 299 5 060
Turkey 1 284 1 607 1 672 2 287 2 949 72 3 941 911
Ukraine 30 56 82 151 269 26 893 181
United Kingdom 56 696 58 963 63 700 63 725 66 760 8 501 60 960 9 301
Uzbekistan 4 5 1Yugoslavia 136 148 255 339 314 14 405 86
Europe(continued)
Dec. 1997
Dec. 1998
Dec. 1999
Dec. 2000
Dec. 2001 Dec. 2002
Total of which9001:2000
Total of which9001:2000

The ISO Survey of ISO 9000 and ISO 14001 Certificates18
T O T A L
Far East 29 878 37 920 56 648 81 919 126 779 148 573
Share in percent 13,42 13,99 16,48 20,05 24,83 26,45
No. of countries/economies 16 18 20 21 21 20
Total 9001:2000 14 434 68 513
Share in percent 32,52 40,98
No. of countries/economies 15 18
Brunei Darussalam 84 108 115 113 123 4 79 13Cambodia 1 1 1 1 8 5
China 5 698 8 245 15 109 25 657 57 783 7 413 75 755 40 997
Hong Kong, China 1 637 1 940 2 150 2 570 3 814 547 3 868 1 338
Macau, China 9 18 30 39 6 43 10
Chinese Taipei 2 608 3 173 3 807 4 319 5 405 634 3 182 1 316
Fiji 8 8 8 8 8 2 8 2
Indonesia 1 273 1 442 1 525 1 860 1 395 161 1 947 308
Japan 6 487 8 613 14 564 21 329 27 385 3 650 33 964 16 813Korea, Democratic
People’s330 495 1 279 106 131 130
Korea, Republic of 5 806 7 729 11 533 15 424 17 676 1 156 14 520 2 942
Malaysia 1 610 1 707 1 921 2 355 3 195 257 3 733 1 119
Mongolia 1 1 1 1 2 1 1
Myanmar 4 4 4 4 5 5
Nepal 1 1 10 4
Papua New Guinea 7 7 7 7 6 6
Philippines 629 668 723 1 027 961 43 766 270
Samoa 1 1 1
Singapore 2 909 3 000 3 140 3 900 3 513 333 5 379 1 953
Thailand 1 104 1 236 1 527 2 553 3 870 89 4 556 938Vietnam 13 29 164 184 245 33 612 354
Far East Dec. 1997
Dec. 1998
Dec. 1999
Dec. 2000
Dec. 2001 Dec. 2002
Total of which9001:2000
Total of which9001:2000

The ISO Survey of ISO 9000 and ISO 14001 Certificates 19
T O T A L
Australia 10 547 14 170 22 833 24 772 26 750 3 442 27 135 7 024New Zealand 2 399 2 581 2 469 2 527 2 069 99 2 069 99
AustraliaNew Zealand
Dec. 1997
Dec. 1998
Dec. 1999
Dec. 2000
Dec. 2001 Dec. 2002
Total of which9001:2000
Total of which9001:2000
Australia/New Zealand 12 946 16 751 25 302 27 299 28 819 29 204
Share in percent 5,79 6,16 7,36 6,68 5,65 5,20
No. of countries/economies 2 2 2 2 2 2
Total 9001:2000 3 541 7 123
Share in percent 7,98 4,26
No. of countries/economies 2 2
World total 223 299 271 847 343 643 408 631 510 616 44 388 561 747 167 210World growth 60 698 48 548 71 796 64 988 101 195 51 131Number of countries/economies 126 141 150 157 161 98 159 134
World results Dec. 1997
Dec. 1998
Dec. 1999
Dec. 2000
Dec. 2001 Dec. 2002
Total of which9001:2000
Total of which9001:2000

The ISO Survey of ISO 9000 and ISO 14001 Certificates 27
Afghanistan 1 4 4Bahrain 2 2 2 2
Bangladesh 2 3
Botswana 2 2
Cameroon 2 1
Egypt 7 13 35 78 100 101
India 28 40 111 257 400 605
Iran 2 8 12 12 34 54
Israel 6 25 25 60 75 112
Jordan 2 8 16 10 14
Kenya 2 3 1
Kuwait 3 3
Lebanon 1 4 5 5 5
Malawi 3
Mauritius 1 2 3 4 5 5
Morocco 1 4 6 11
Namibia 1 4 4 4
Niger 1
Nigeria 1 5 4
Oman 1 1 1 2 3 6
Pakistan 2 2 2 4 10 21
Palestine 1 1 1
Qatar 1 1 1 1 1
Saudi Arabia 1 1 3 6 6 5
Senegal 2South Africa 21 30 82 126 169 264
The first of the ISO 14000 family of standards for environmental manage-ment were published in September 1996, although some organizations
were being certified to draft versions prior to this date. ISO 14001 certificates have therefore been included in The ISO Survey since 1995.
ISO 14001 certifications worldwide : growth from 1997 to end of 2002
(continued)
Africa/West AsiaDec.
1997Dec.
1998Dec.
1999Dec.
2000Dec.
2001Dec.
2002

The ISO Survey of ISO 9000 and ISO 14001 Certificates28
Argentina 28 37 84 114 175 249Barbados 3 3 3 3 3 3
Belize 2 2
Bolivia 1 3 4
Brazil 63 88 165 330 350 900
Chile 1 5 11 17 55
Colombia 3 3 13 21 41 69
Costa Rica 1 7 20 14 38
Dominican Republic 1 1
Ecuador 1 1 1 2 1
Guatemala 1 1 2 2 1
Guyana 3 3
Honduras 2 2 2
Jamaica 4 1
Panama 1 1
Paraguay 1 1 4
Puerto Rico 1 4 4 4 3
Peru 4 7 13 15 25
Saint Lucia 1 2 2 1
Trinidad & Tobago 1 1 1 7
Uruguay 1 3 10 22 29 32Venezuela 1 7 7 9 17
T O T A L
Sri Lanka 2 2 5Sudan 1
Syrian Arab Republic 2 3 5 8
Tunisia 1 1 3 7 13
United Arab Emirates 4 9 36 48 49 92
Zambia 2 2 2 2Zimbabwe 4 4 6 5
Africa/West Asia (continued)
Dec.
1997Dec.
1998Dec.
1999Dec.
2000Dec.
2001Dec.
2002
Central and South America
Dec.
1997Dec.
1998Dec.
1999Dec.
2000Dec.
2001Dec.
2002
Africa/West Asia 73 138 337 651 923 1 355
Share in percent 1,65 1,75 2,39 2,84 2,51 2,74
No. of countries/economies 10 15 21 25 29 31
The ISO Survey of ISO 9000 and ISO 14001 Certificates 29
T O T A L
T O T A L
*Data received from Quality Systems Update and WorldPreferred
(continued)
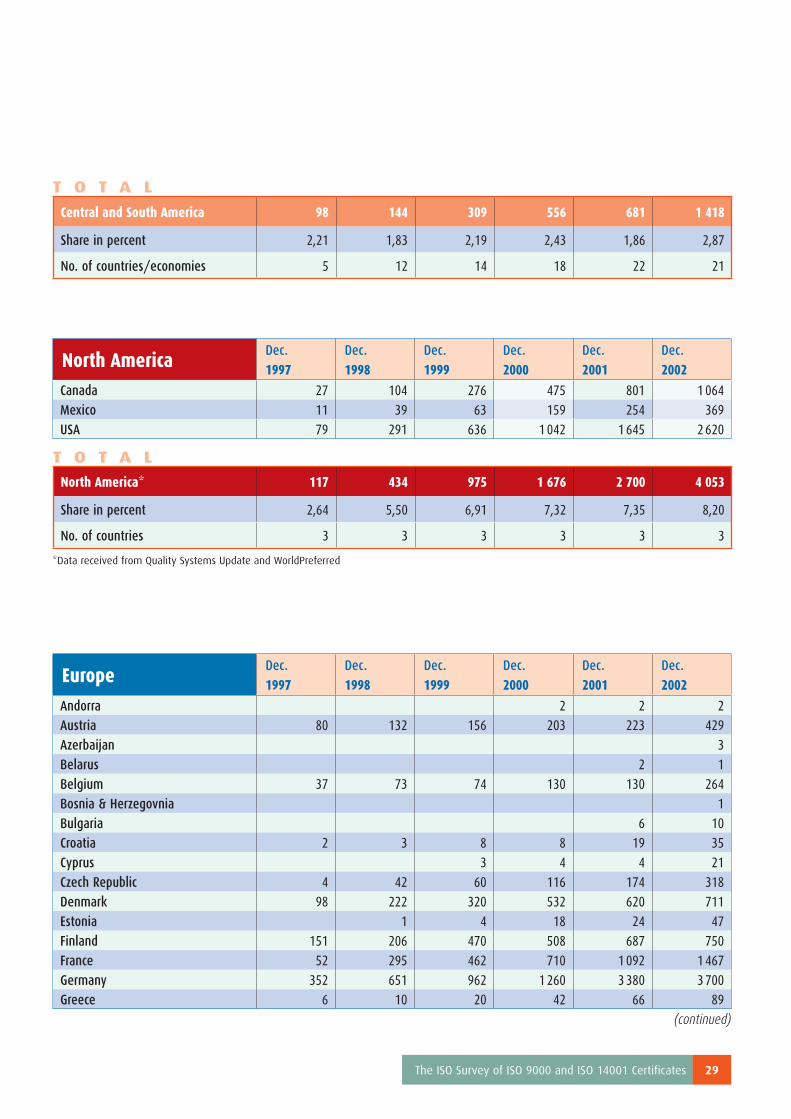
Central and South America 98 144 309 556 681 1 418
Share in percent 2,21 1,83 2,19 2,43 1,86 2,87
No. of countries/economies 5 12 14 18 22 21
Andorra 2 2 2Austria 80 132 156 203 223 429
Azerbaijan 3
Belarus 2 1
Belgium 37 73 74 130 130 264
Bosnia & Herzegovnia 1
Bulgaria 6 10
Croatia 2 3 8 8 19 35
Cyprus 3 4 4 21
Czech Republic 4 42 60 116 174 318
Denmark 98 222 320 532 620 711
Estonia 1 4 18 24 47
Finland 151 206 470 508 687 750
France 52 295 462 710 1 092 1 467
Germany 352 651 962 1 260 3 380 3 700Greece 6 10 20 42 66 89
EuropeDec.
1997Dec.
1998Dec.
1999Dec.
2000Dec.
2001Dec.
2002
Canada 27 104 276 475 801 1 064
Mexico 11 39 63 159 254 369
USA 79 291 636 1 042 1 645 2 620
North AmericaDec.
1997Dec.
1998Dec.
1999Dec.
2000Dec.
2001Dec.
2002
North America* 117 434 975 1 676 2 700 4 053
Share in percent 2,64 5,50 6,91 7,32 7,35 8,20
No. of countries 3 3 3 3 3 3
The ISO Survey of ISO 9000 and ISO 14001 Certificates30
T O T A L
Hungary 12 28 121 164 340 640Iceland 1 1 2 2 2 3
Ireland 82 96 115 163 247 289
Italy 103 123 243 521 1 295 2 153
Kazakhstan 1 1
Latvia 4 4 20
Liechtenstein 13 19 19 20 20
Lithuania 1 1 10 21 33
Luxembourg 6 6 6 9 9 17
Macedonia 1 1
Malta 2 2 3
Monaco 2 3 3 3
Netherlands 263 341 403 784 942 1 073
Norway 35 61 133 227 298 278
Poland 8 15 72 66 294 434
Portugal 7 15 28 47 88 137
Romania 1 1 5 15 45
Russian Federation 3 12 23
Slovakia 6 15 24 36 73 70
Slovenia 5 12 19 88 136 149
Spain 92 164 573 600 2 064 3 228
Sweden 194 304 851 1 370 2 070 2 730
Switzerland 170 360 543 690 762 1 052
Turkey 44 50 66 91 91 135
Turkmenistan 1
Ukraine 1 4
United Kingdom 644 921 1 492 2 534 2 722 2 917Yugoslavia 2 2 2 9
Europe(continued)
Dec.
1997Dec.
1998Dec.
1999Dec.
2000Dec.
2001Dec.
2002
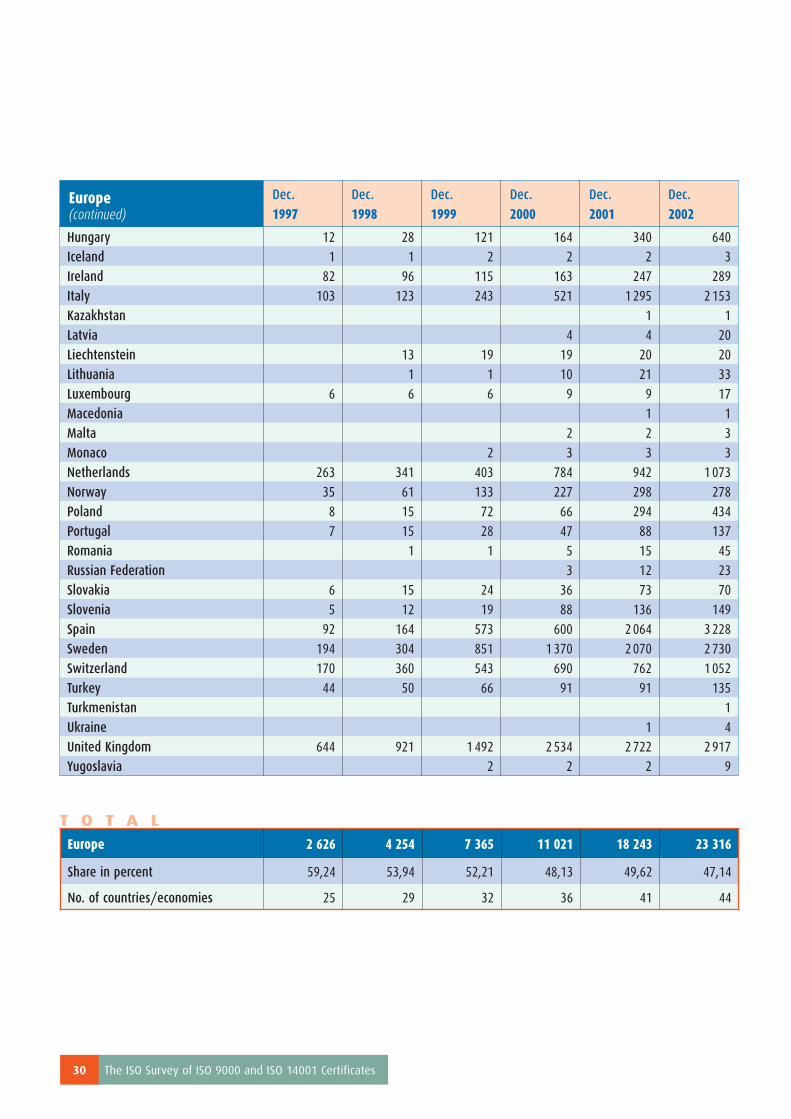
Europe 2 626 4 254 7 365 11 021 18 243 23 316
Share in percent 59,24 53,94 52,21 48,13 49,62 47,14
No. of countries/economies 25 29 32 36 41 44

The ISO Survey of ISO 9000 and ISO 14001 Certificates 31
Brunei Darussalam 2 4 3China 22 94 222 510 1 085 2 803
Hong Kong, China 46 56 51 105 165 208
Macau, China 1 1 1 70
Chinese Taipei 183 203 216 421 999 1 024
Fiji 1
Indonesia 45 55 55 77 199 229
Japan 713 1 542 3 015 5 556 8 123 10 620Korea, Democratic People’s Republic
of26 38 84
Korea, Republic of 174 263 309 544 880 1 065
Malaysia 36 86 117 174 367 367
Myanmar 1 1
Philippines 11 27 39 46 120 124
Singapore 65 78 87 100 298 441
Sri Lanka 2 13
Thailand 61 126 229 310 483 671Vietnam 2 9 9 33 33
T O T A L
Far EastDec.
1997Dec.
1998Dec.
1999Dec.
2000Dec.
2001Dec.
2002
Far East 1 356 2 532 4 350 7 881 12 796 17 757
Share in percent 30,59 32,10 30,84 34,42 34,81 35,90
No. of countries/economies 10 11 12 14 16 17
The ISO Survey of ISO 9000 and ISO 14001 Certificates32
Australia 137 352 708 1 049 1 370 1 485New Zealand 26 33 62 63 52 78
T O T A L
AustraliaNew Zealand
Dec.
1997Dec.
1998Dec.
1999Dec.
2000Dec.
2001Dec.
2002
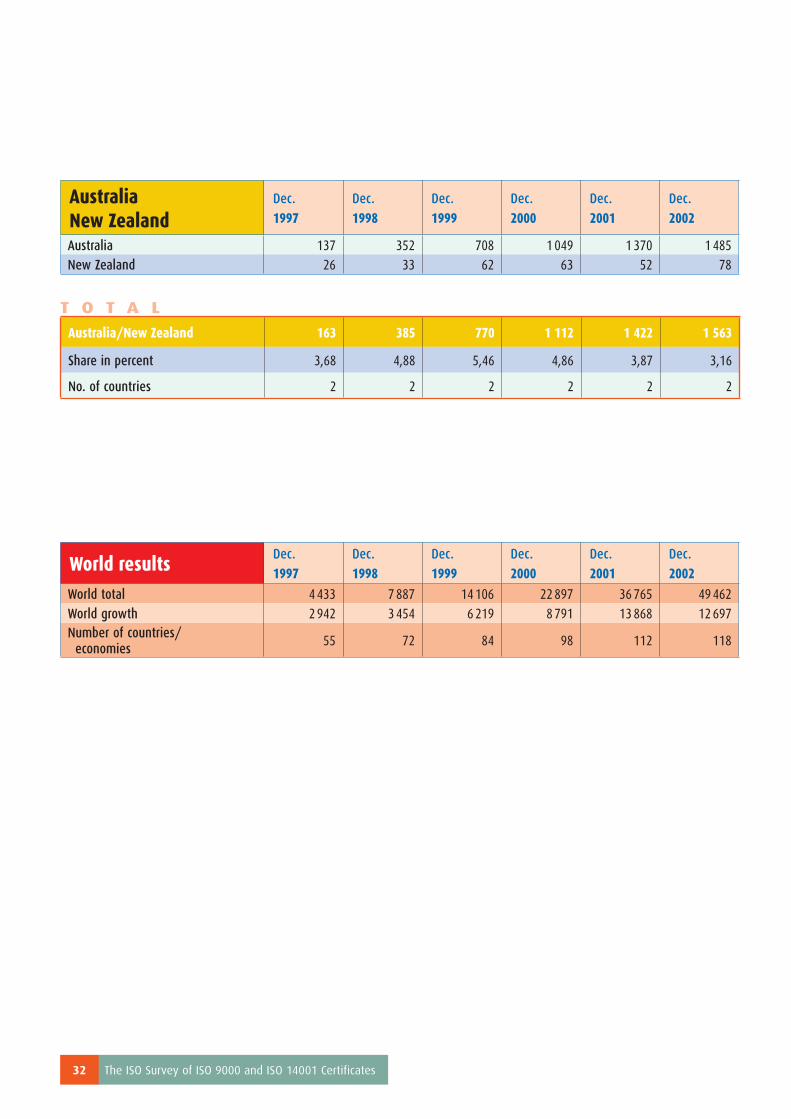
Australia/New Zealand 163 385 770 1 112 1 422 1 563
Share in percent 3,68 4,88 5,46 4,86 3,87 3,16
No. of countries 2 2 2 2 2 2
World total 4 433 7 887 14 106 22 897 36 765 49 462World growth 2 942 3 454 6 219 8 791 13 868 12 697Number of countries/
economies55 72 84 98 112 118
World resultsDec.
1997Dec.
1998Dec.
1999Dec.
2000Dec.
2001Dec.
2002