The Irish Health Behaviour in School-Aged Children (HBSC ... · The Irish Health Behaviour in...
62
The Irish Health Behaviour in School-aged Children (HBSC) Study 2006
Transcript of The Irish Health Behaviour in School-Aged Children (HBSC ... · The Irish Health Behaviour in...

The Irish Health Behaviour in School-aged Children (HBSC) Study 2006


The Irish Health Behaviour in School-Aged Children (HBSC) Study 2006
1
The Irish Health Behaviour in School-aged Children (HBSC) Study 2006
August 2007
Saoirse Nic Gabhainn, Colette Kelly and Michal Molcho.
Health Promotion Research CentreNational University of Ireland, Galwaywww.nuigalway.ie/hbsc
General Health
2
© Copyright 2007Health Promotion Research Centre, National University of Ireland, GalwayDepartment of Health and Children, Government of Ireland, Dublin
Published by Department of Health and Children.

General Health
The Irish Health Behaviour in School-Aged Children (HBSC) Study 2006
3
Contents
The Irish Health Behaviour in School-Aged Children (HBSC) Study 2006
Foreword ................................................................................................ 5
Introduction .......................................................................................... 7
Executive Summary ..............................................................................8
Methodology .........................................................................................11
Results ..................................................................................................13
General Health ...................................................................15
Smoking ............................................................................. 21
Alcohol ................................................................................ 23
Drug Use ............................................................................27
Food & Dietary Behaviour................................................ 29
Exercise & Physical Activity .............................................. 41
Self Care .............................................................................47
Injuries ................................................................................51
Bullying ...............................................................................53
Appendix 1 .......................................................................................... 57
Project Team ...................................................................................... 60

44

General Health
The Irish Health Behaviour in School-Aged Children (HBSC) Study 2006
5
The Irish Health Behaviour in School-Aged Children (HBSC) Study 2006
5
Foreword
I welcome the publication of the national results of the 2006 study on the Health Behaviours of School-aged Children (HBSC). Our children are our most important resource and this research is essential in identifying lifestyle trends and will inform future health promotion policies for our children. This is the first time that HBSC is published separately; previously it was included as part of the National Health and Lifestyle Survey (SLAN).
The HBSC is a World Health Organisation (WHO) European collaborative study with over 40 participating countries and regions. The study aims to get new insights into, and increase our understanding of health behaviours, well-being and lifestyles in young people in different countries. This is the third time that my Department has funded the Irish phase of this important study. Ireland’s continued participation will ensure the comparability of the data with previous Irish surveys as well as with our European neighbours. This is essential in identifying and monitoring health behaviour trends among both the national population and in an international context. In previous HBSC surveys, Ireland has collected data from children aged 10-18 years and this year for the first time, at the request of the Office of the Minister for Children, data were also collected from children in middle childhood i.e. 9 year old children in third and fourth class.
I am heartened at some of the main findings outlined in the report. Irish children are reporting high rates of self-reported health and happiness, and these have increased since 2002. There is a continuing decrease in smoking, as well as a sharp increase in the number of children who report that they always use a seat-belt in a car. There are also increases indicated in vegetable consumption, and decreases in frequent consumption of sweets and soft drinks. However, the finding that half of our 15-17 year olds consumed alcohol in the preceding month continues to be a cause for concern.
I wish to acknowledge the work of the Centre for Health Promotion Studies at the National University of Ireland, Galway in compiling this study. Finally I would like to thank all those students who took time to complete the questionnaires and the staff from the participating schools for their support.
Pat the Cope Gallagher, T.D.Minister for Health Promotion & Food Safety

66

General Health
The Irish Health Behaviour in School-Aged Children (HBSC) Study 2006
7
This report presents data from the HBSC Ireland 2006, the Irish Health Behaviour in School-aged Children survey. The 2006 HBSC survey is the third time that data of this kind has been collected from young people across the Republic of Ireland; previous surveys were conducted in 2002 and 1998 (www.nuigalway.ie/hbsc).
HBSC is a cross-national research study conducted in collaboration with the World Health Organisation (WHO) Regional Office for Europe. The HBSC international survey runs on an academic 4-year cycle and in 2005/6 there were 41 participating countries and regions (www.hbsc.org). The overall study aims are to gain new insight into, and increase our understanding of young people’s health and well-being, health behaviours and their social context. As well as serving a monitoring and a knowledge-generating function, one of the key objectives of HBSC has been to inform policy and practice.
Cross-nationally, HBSC collects information on the key indicators of health, health attitudes and health behaviour, as well as the context of health for young people. HBSC is a school-based survey with data collected through self-completion questionnaires administered by teachers in the classroom. The HBSC survey instrument is a standard questionnaire developed by the international research network. The areas of interest are chosen in collaboration with the WHO and are designed to help assist developments at a national and international level in relation to youth health.
The issues identified for inclusion in this first report from the 2006 Irish survey are those identified in the National Health Promotion Strategy1 and the Health Strategy: Quality and Fairness2, and mirror the two previous National HBSC reports3,4. These include general health, smoking, use of alcohol and other substances, food and dietary behaviour, exercise and physical activity, self-care, injuries and bullying. Variations by gender, age group and social class are presented in this report. The HBSC also provides further research data on health and lifestyle behaviours across a range of socio-demographic and economic parameters.
In previous HBSC surveys, the Republic of Ireland collected data from children aged 10-18 years. This year, for the first time, data were collected from children in middle childhood i.e. 9 year old children in 3rd and 4th class. The data on health and lifestyle in the middle childhood period presented in this report include general health, food and dietary behaviour, physical activity, self-care and bullying. Since comparison with previous survey years is not possible for the middle childhood study, data for these children are presented separately in this report.
The HBSC study was funded by the Department of Health and Children and the Office of the Minister for Children. The survey and analyses were carried out at the Health Promotion Research Centre, National University of Ireland, Galway.
1 Department of Health and Children (2000). The National Health Promotion Strategy 2000-2005. http://www.healthpromotion.ie/health_promotion_strategy/.
2 Department of Health and Children (2001). Quality and Fairness: a health system for you. http://www.dohc.ie/publications/quality_and_fairness.html.
3 Kelleher, C., Nic Gabhainn, S., Friel, S., Corrigan, H., Nolan, G., Sixsmith, J., Walsh, O. & Cooke, M. (2003). National Health
and Lifestyle Surveys: Survey of Lifestyle, Attitudes and Nutrition (SLÁN) and the Irish Health Behaviour in School-Aged children
survey (HBSC). Department of Health and Children: Dublin.
4 Friel, S., Nic Gabhainn, S. & Kelleher, C. (1999). The National Lifestyle Surveys: Survey of Lifestyle, Attitudes and Nutrition
(SLÁN) and the Irish Health Behaviour in School-Aged children survey (HBSC). Department of Health and Children: Dublin.
The Irish Health Behaviour in School-Aged Children (HBSC) Study 2006
Introduction
8
Executive Summary
A summary of the main findings from HBSC Ireland 2006 is provided below:
General healthSince 2002, rates of excellent or good self-reported health remain the same in boys (89% in 2006 compared with 87% in 2002) and in girls (86% in 2006 compared with 84% in 2002). In terms of children’s reported happiness, 92% of boys and 89% of girls feel very or quite happy with their lives at present; again a slight increase since 2002 across age groups and gender. Fewer girls than boys report excellent health and feeling very happy in 2006. Patterns continue to be inversely related to age for both self-reported health and happiness, and are inversely related to social class for good or excellent self-reported health. There is no evidence of a class gradient effect in children from middle childhood for self-reports of health (95% report excellent or good health) or happiness (95% report feeling very or quite happy).
SmokingThere continues to be a fall in reported smoking status since the first HBSC Ireland survey in 1998. Overall, 15% report they are current smokers, down from 21% in 1998 and 19% in 2002. Rates have dropped most for boys in the 15-17 year age group. As in previous years, a higher number of girls aged 15-17 years report that they are smokers (28%) compared to boys of the same age group (23%). Similar to the fall in current smoking status there has been a decline in reports of ‘ever smoking’ between 2002 and 2006. In particular, a sharp drop in ‘ever smoking’ is evident among the younger children and among 15-17 year old boys between 2002 and 2006. Less than 1% of children in middle childhood report that they are current smokers.
Alcohol Overall, 47% of the children surveyed report that they have never had an alcoholic drink, up from 40% in 2002 and 31% in 1998. This effect is evident across all age categories between 2002 and 2006. Rates of girls (52%) reporting that they never had an alcoholic drink are higher than boys (43%). Marked changes between 2002 and 2006 are not evident for the other alcohol-related variables presented in this report. For example, the proportion of children reporting having had an alcoholic drink in the past month (defined as current drinkers) has remained stable between 2002 and 2006, with the exception of 15-17 year old boys, where a small decrease is evident. Similarly, rates of children who report having been ‘really drunk’ remained stable between 2002 and 2006. Nevertheless, although the figures have not increased over time, about half the children aged 15-17 years old report they are current drinkers and just over a third report they have been ‘really drunk’ in the last 30 days. There appears to be little evidence of a social class effect for the alcohol-related variables presented. Similarly, there are no gender differences, with the exception of never having had an alcoholic drink.
Drug useCannabis use remains relatively stable across most age groups, although there has been a decrease between 2002 and 2006 in reported use of cannabis in the last 12 months among 15-17 year old boys. Overall, 12% report using cannabis in the last 12 months in 2006 compared to 11% in 2002 with little evidence of a social class effect. However, a social class effect is clearly evident among 15-17 year old boys who report more recent cannabis consumption (last 30 days), with slightly more boys (8%) than girls (5%) report using cannabis in this time frame.

9
The Irish Health Behaviour in School-Aged Children (HBSC) Study 2006
9
Food and dietary behaviourIn total, 19% of children report that they consume fruits more than once a day. Across all age groups, rates of fruit consumption in girls (23%) continue to be higher than for boys (16%), with a slight increase among girls only, between 2002 and 2006. A greater proportion of younger girls (10-11 years old) report that they consume fruit more frequently than daily, compared to older girls; this is not observed among boys. There are some similarities in reported vegetable consumption, with an increase observed from 2002, particularly among girls. Moreover the proportion of girls (20%) reporting vegetable consumption more frequently than daily is greater than the proportion of boys (16%), and this is the case across each age category. There is some evidence of a social class effect especially among girls, with those from higher social classes being more likely to report frequent vegetable consumption.
The percentage of children who report eating sweets (39%) and drinking soft drinks (26%) daily or more has decreased since 2002, in all age categories. There is some evidence of class and gender effects in soft drinks consumption. In middle childhood, 28% and 18% report eating sweets and drinking soft drinks daily or more, respectively, with a clear social class gradient in soft drinks consumption. Children from the higher social classes are less likely to report frequent consumption of soft drinks.
Overall, 14% of children report that they never have breakfast during weekdays and this remains unchanged from 2002 (15%). Similar to 2002, the rates increase with age and a greater proportion of girls than boys report not having breakfast on school days. In middle childhood, only 2% report not having breakfast on any day of the week. The proportion of children who report they ever go to school or to bed hungry because there is no food at home remains stable; 16% in 2002 versus 17% in 2006. There is no clear evidence of a social class effect.
Overall, 12% (8% of boys and 15% of girls) report being on a weight reducing diet and an additional 20% (15% of boys and 26% of girls) report that they needed to lose weight. The figures in 2002 were 13% and 22% respectively. There is an increase across age groups in this dieting behaviour among girls but among boys the figures remain rather stable. Gender differences are not apparent in the youngest age group but are clear in the older age groups; e.g. in the 15-17 year old age category, 20% of girls report being on a diet (9% of boys), while a further 32% of girls report the need to lose weight (14% of boys). There is no consistent pattern across the social classes.

10
Exercise and physical activityThere has been little change in reported frequency of participation in physical activity, with 53% of children exercising four or more times a week (48% in 2002). Gender differences are evident with 63% of boys and 43% of girls exercising four or more times per week. Exercise participation decreases with age and this is particularly noticeable among girls (dropping from 58% of 10-11 year olds to 28% of 15-17 year olds). Reported inactivity rates are low generally with the exception of girls aged 15-17 years. These age and gender patterns are unchanged from 2002. In middle childhood there is a high percentage of children reporting participation in vigorous exercise four or more times a week (74% of boys and 69% of girls), and reported levels of inactivity are also low (6%).
In terms of moderate and vigourous physical activity, the percentages of boys and younger children reporting being physically active at recommended levels, is higher than that of girls and older children. The figures demonstrate an increase in levels of activity between 2002 and 2006 for both boys and girls and across each age category. Once again, a high percentage of children (79%) from middle childhood report being physically active most days of the week, with little gender and no social class effect.
Self-care Rates of self-reported tooth-brushing remain unchanged from 2002. In 2006, 63% of children (64% in middle childhood) report brushing their teeth more than once a day, with 72% of girls and 54% of boys reporting tooth brushing at this frequency. There appears to be no change across age groups but there is some evidence of a social class effect with more children from higher social classes reporting that they brush their teeth more than once a day.
There has been an increase in reported seatbelt usage in 2006 (76% of boys and 83% of girls) compared to 2002 (57% of boys and 65% of girls). The gender differences described are not evident in middle childhood, with 88% reporting that they always wear a seatbelt in a car.
InjuriesOverall, 43% of children (51% of boys and 34% of girls) report being injured and needing treatment once or more in the last 12 months, a decrease from 2002. Fifteen percent of children report that they have missed three or more days of activity due to injury (19% of boys and 11% of girls). Injuries were most likely to occur in a sports facility followed by the home or yard and school. Children were most likely to sustain an injury during a sports activity. Comparable data for 2002 is not available.
Bullying In general, reports of ever being bullied in school remain unchanged and bullying continues to be more frequent among 10-11 year old children than older children. In middle childhood, 37% report ever having been bullied. There is no consistent evidence of a social class effect. In terms of bullying others, the percentage of boys (29%) reporting that they have taken part in bullying others is substantially higher than girls (14%). A greater proportion of boys from the older age groups (12-17 years) report bullying others compared to the 10-11 year old age group. This pattern is not evident among girls. There is no consistent evidence of a social class effect.
Executive Summary

11
HBSC 2006 surveyThe HBSC is a WHO (European) collaborative study. Principal investigators from all countries/regions co-operate in relation to survey content, methodology and timing, and an international protocol is developed. Strict adherence to the protocol is required for inclusion in the international database and this has been achieved with the current study.
In the Republic of Ireland, sampling was conducted in order to be representative of the proportion of children in each of 8 geographical regions. The objective was to achieve a nationally representative sample of school-aged children, and the procedures employed were the same as those for the 1998 and 2002 HBSC Ireland surveys. Data from the 2002 census were employed to provide a picture of the population distribution across geographical regions. The sampling frame consisted of primary and post-primary schools, lists of which were provided by the Department of Education and Science. A two-stage process identified study participants. Individual schools within regions were first randomly selected and subsequently, class groups within schools were randomly selected for participation. In primary schools both 5th and 6th class groups were included, while in post-primary schools all classes, with the exception of Leaving Certificate groups (i.e. final year examination classes) were sampled.
School principals were first approached by post and when positive responses were received, HBSC questionnaires in Irish or English were offered, along with blank envelopes to facilitate anonymity, parental consent forms, information sheets for teachers and classroom feedback forms. All returns were facilitated through the provision of FREEPOST envelopes. In order to maximise response rates, postal reminders were sent to schools, followed by telephone calls from research staff at the Health Promotion Research Centre, NUI Galway. Data entry was conducted according to the International HBSC protocol. A summary of the methodology employed can be found in Table 1.
Middle Childhood SurveyIn previous HBSC surveys, the Republic of Ireland has collected data from children aged 10-18 years. This year, for the first time, data were collected from children in 3rd and 4th class, using an abbreviated version of the main HBSC questionnaire. The sampling procedure for the middle childhood study was exactly the same as that used for the Primary sample of the HBSC survey, as described above.
The Irish Health Behaviour in School-Aged Children (HBSC) Study 2006
11
Methodology

12
Methodology
Table 1: Summary of methodology for the HBSC and Middle Childhood Surveys
Population School going children aged 9-18 years
Sampling frame Department of Education and Science school lists
Sample Cluster sample of students in a given classroom
Stratification Proportionate to the distribution of pupils across geographical regions
Survey instrument Self-completion questionnaire
Delivery/Reminders Postal delivery via principals and teachers, letter and telephone reminders
Return Freepost addressed envelopes provided
Response rate HBSC: 63% of invited schools / 83% of students Middle Childhood: 73% of invited schools / 83% of students
Obtained sample HBSC: 215 schools / 10,334 pupils Middle Childhood: 122 schools / 3,404 pupils
Data quality Data were entered according to the HBSC international protocol
Ethics Full ethical approval was granted by the National University of Ireland, Galway Research Ethics Committee
Details of the demographic representativeness of the sample for both studies can be found in Appendix 1.
The results section outlines children’s perceptions and behaviours relating to health. Data are presented for HBSC and middle childhood surveys separately. Data are illustrated by gender, age group and social class (SC). Social class is represented by SC1-2, SC3-4 and SC5-6 corresponding to high, medium and low social classes, respectively. The categories used for social class are standard and were determined by parental occupation. Social class 1 represent professional occupations (i.e. solicitor, doctor), social class 2 represent managerial occupations (i.e. nurse, teacher), social class 3 represent non-manual occupations (i.e. salesperson, office clerk), social class 4 represent skilled-manual occupations (i.e. hairdresser, carpenter), social class 5 represent semi-skilled occupations (i.e. postman, driver), social class 6 represent unskilled occupations (i.e. cleaner, labourer).

General Health
The Irish Health Behaviour in School-Aged Children (HBSC) Study 2006
13
The Irish Health Behaviour in School-Aged Children (HBSC) Study 2006
Results
13

14

The Irish Health Behaviour in School-Aged Children (HBSC) Study 2006
General Health
Children were asked a number of general questions concerning their lives and perceived health.
Excellent health The first of these asks how they would rate their health. Overall, 33% report that they would say their health is excellent and a further 54% would say their health is good, however these figures mask age and gender differences. The figures presented below are for those who report that they would say their health is excellent, by gender, age group and social class, in both 2002 and 2006.
Figure 1: Percentages of boys who report their health is excellent
Figure 2: Percentages of girls who report their health is excellent
Overall, fewer girls than boys report excellent health and a larger proportion of younger children of both genders report that their health is excellent compared to older children (40% of 10-11 year olds; 36% of 12-14 year olds; 28% of 15-17 year olds). Data suggest the existence of a class gradient with more children from social classes 1-2 reporting excellent health in 2006. Generally, there is a slight increase in children reporting excellent health in 2006 compared to 2002.
60
SC1-2 2002SC3-4 2002SC5-6 2002
SC1-2 2006SC3-4 2006SC5-6 2006
50
40
(%) 30
20
10
010-11 12-14 15-17
Age Group (Years)
4440
49
40
28
36
46
3539
3533
29
40
34 333531 30
60
50
40
(%) 30
20
10
010-11 12-14 15-17
Age Group (Years)
4239 37
29
3742
39
31 302926 24 25
19 1821
1813
SC1-2 2002SC3-4 2002SC5-6 2002
SC1-2 2006SC3-4 2006SC5-6 2006
15

Excellent health: Middle Childhood StudyAmong 3rd and 4th class children 47% report that their health is excellent and a further 48% that their health is good, with no consistent evidence of a social class effect.
Figure 3: Percentages of 9 year old boys and girls who report their health is excellent
60
50
40
(%) 30
20
10
0
SC1-2 2006SC3-4 2006SC5-6 2006
Boys GirlsGender
4650
4045 47 46
General Health
16

Life at present (happiness)Another aspect of general health to be reported here concerns how children feel about their lives at present. Overall, 50% report that they are very happy and a further 41% that they are quite happy with their lives. The remaining 9% report that they are not very or not at all happy with their lives at present. Here again, these figures mask age and gender differences.
Figure 4: Percentages of boys who report feeling very happy about their lives at present
Figure 5: Percentages of girls who report feeling very happy about their lives at present
Boys are slightly more likely than girls to report feeling very happy, and a higher percentage of younger children of both genders report feeling very happy compared to children from older age groups (67% of 10-11 year olds; 54% of 12-14 year olds; 39% of 15-17 year olds). There is no evidence of a social class effect, but there has been an increase in self-reported happiness for most groups since 2002.
80SC1-2 2002SC3-4 2002SC5-6 2002
SC1-2 2006SC3-4 2006SC5-6 2006
(%) 40
010-11 12-14 15-17
Age Group (Years)
70
60
50
30
20
10
68 67 66
51
64 65
5255 53
50
43 4136
32
39
30 2932
80SC1-2 2002SC3-4 2002SC5-6 2002
SC1-2 2006SC3-4 2006SC5-6 2006
(%) 40
010-11 12-14 15-17
Age Group (Years)
70
60
50
30
20
10
6467 68
64
55 56 55 55 57
4752
4944 46
4042 40
33
The Irish Health Behaviour in School-Aged Children (HBSC) Study 2006
17

Life at present (happiness): Middle Childhood StudyFollowing the same pattern, 72% of 3rd and 4th class students reported feeling very happy and a further 32% report that they are quite happy with their lives, with slight gender differences and no evidence of a social class effect.
Figure 6: Percentages of 9 year old boys and girls who report feeling very happy about their lives at present
80
(%) 40
0
70
60
50
30
20
10
SC1-2 2006SC3-4 2006SC5-6 2006
Boys GirlsGender
6871 69 67
77 76
General Health
18

General Health
The Irish Health Behaviour in School-Aged Children (HBSC) Study 2006
19
High life satisfactionChildren were also asked to report where they feel they stand at the moment on a scale from 0 to 10. Overall, 77% ranked themselves 7 or higher, with 1% reporting they have the worst possible life; a ranking of 0. A slightly higher percentage of boys (79%) reported high life satisfaction compared to girls (74%).
Figure 7: Percentages of boys who report high life satisfaction
Figure 8: Percentages of girls who report high life satisfaction
100SC1-2 2002SC3-4 2002SC5-6 2002
SC1-2 2006SC3-4 2006SC5-6 2006
(%) 50
010-11 12-14 15-17
Age Group (Years)
90
80
70
60
40
30
20
10
86 879188
84 81 84 81 8281 80 81 78 7570
75 74 72
100SC1-2 2002SC3-4 2002SC5-6 2002
SC1-2 2006SC3-4 2006SC5-6 2006
(%) 50
010-11 12-14 15-17
Age Group (Years)
90
80
70
60
40
30
20
10
89 8691
87 89 88
79 79 7878 77 7769
626767
63 60
The Irish Health Behaviour in School-Aged Children (HBSC) Study 2006
19

20

Children were asked about two aspects of smoking tobacco; having ever smoked and current smoking behaviour, which was defined as reporting smoking tobacco monthly or more frequently. Data are presented below by age group, gender, social class and survey year.
Ever smoked tobaccoOverall, 36% report that they have ever smoked tobacco, with substantial differences between age groups. These data illustrate a drop in ever smoking between 2002 and 2006.
Figure 9: Percentages of boys who report ever smoking tobacco
Figure 10: Percentages of girls who report ever smoking tobacco
Gender differences are evident with a higher proportion of 15-17 year old girls reporting initiation of smoking compared to boys of the same age group. Such gender differences are not as evident among the younger age groups.
70SC1-2 2002SC3-4 2002SC5-6 2002
SC1-2 2006SC3-4 2006SC5-6 2006
(%)
010-11 12-14 15-17
Age Group (Years)
60
50
40
30
20
1013
9 912
16 16
2730 30
3732 31
5248 48
6265 65
70SC1-2 2002SC3-4 2002SC5-6 2002
SC1-2 2006SC3-4 2006SC5-6 2006
(%)
010-11 12-14 15-17
Age Group (Years)
60
50
40
30
20
10 5 7 9710 9
2428 2930
3633
5459 57
6065 65
Smoking
The Irish Health Behaviour in School-Aged Children (HBSC) Study 2006
21

Ever smoked tobacco: Middle Childhood StudyAmong the 3rd and 4th class children, 4% of boys and 3% of girls report having ever smoked tobacco.
Current smoking statusChildren were also asked to report on their current smoking behaviour. Overall, 15% of the children report that they are current smokers although large age differences exist. The percentage of children reporting that they are current smokers is lower in 2006 compared to 2002. In particular, there is a drop in the percentages of current smokers aged 15-17 years. Once again, a higher number of girls aged 15-17 years report current smoking compared to boys of the same age group. The clear social class gradient that was evident in 2002 is not as clear in 2006.
Figure 11: Percentages of boys who report that they are current smokers
Figure 12: Percentages of girls who report that they are current smokers
Current smoking status: Middle Childhood StudyAmong the 3rd and 4th class students less than 1% report that they are current smokers.
40SC1-2 2002SC3-4 2002SC5-6 2002
SC1-2 2006SC3-4 2006SC5-6 2006
(%) 20
010-11 12-14 15-17
Age Group (Years)
30
10
1
53
6 7 7 810 10
12 13
9
18
22 2323
31
37
40SC1-2 2002SC3-4 2002SC5-6 2002
SC1-2 2006SC3-4 2006SC5-6 2006
(%) 20
010-11 12-14 15-17
Age Group (Years)
30
10
1 2 11
5
1
10 1113
8
16
12
24
3028
26
32
36
22
Smoking

Alcohol
The Irish Health Behaviour in School-Aged Children (HBSC) Study 2006
23
Ever drinking Overall, 47% of children report that they have never had an alcoholic drink but there are substantial difference by age and gender. The rates are higher in 2006 than in 2002 in all age categories. Rates of girls (52%) reporting that they have never had an alcoholic drink are higher than those for boys (43%) and there is little evidence of a social class effect.
Figure 13: Percentages of boys who report never having had an alcoholic drink
Figure 14: Percentages of girls who report never having had an alcoholic drink
100SC1-2 2002SC3-4 2002SC5-6 2002
SC1-2 2006SC3-4 2006SC5-6 2006
(%) 50
010-11 12-14 15-17
Age Group (Years)
90
80
70
60
40
30
20
10
67 67 70
59 58 6053 52 54
4942 43
28 25 2319
13 16
100SC1-2 2002SC3-4 2002SC5-6 2002
SC1-2 2006SC3-4 2006SC5-6 2006
(%) 50
010-11 12-14 15-17
Age Group (Years)
90
80
70
60
40
30
20
10
89 8884
7873 76
65 62 615851 53
2820
2620 18 17

Had an alcoholic drink in the past monthCurrent drinkers are defined as those who report having had an alcoholic drink in the past month. Overall, 26% of children report having had an alcoholic drink in the last month with a clear age gradient. The data suggest that the rates of children reporting having had an alcoholic drink in the last month were stable between 2002 and 2006, with the exception of 15-17 year old boys, where a small decrease is evident.
Figure 15: Percentages of boys who report having had an alcoholic drink in the last month
Figure 16: Percentages of girls who report having had an alcoholic drink in the last month
60SC1-2 2002SC3-4 2002SC5-6 2002
SC1-2 2006SC3-4 2006SC5-6 2006
50
40
(%) 30
20
10
010-11 12-14 15-17
Age Group (Years)
3 52
5 58
16 15 1416
1310
46 48 4952 52
57
60SC1-2 2002SC3-4 2002SC5-6 2002
SC1-2 2006SC3-4 2006SC5-6 2006
50
40
(%) 30
20
10
010-11 12-14 15-17
Age Group (Years)
1 2 15
2 0
12 13 118
11 10
44
51
4549 49 48
24
Alcohol
The Irish Health Behaviour in School-Aged Children (HBSC) Study 2006
25
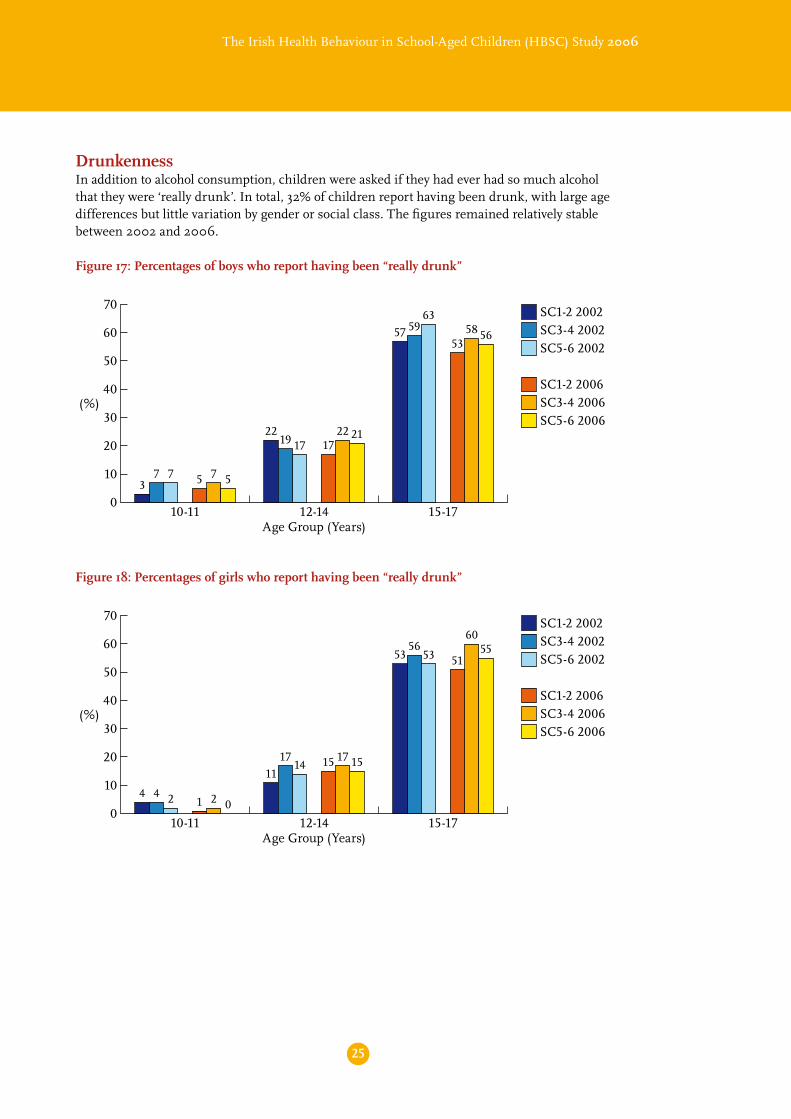
DrunkennessIn addition to alcohol consumption, children were asked if they had ever had so much alcohol that they were ‘really drunk’. In total, 32% of children report having been drunk, with large age differences but little variation by gender or social class. The figures remained relatively stable between 2002 and 2006.
Figure 17: Percentages of boys who report having been “really drunk”
Figure 18: Percentages of girls who report having been “really drunk”
70SC1-2 2002SC3-4 2002SC5-6 2002
SC1-2 2006SC3-4 2006SC5-6 2006
(%)
010-11 12-14 15-17
Age Group (Years)
60
50
40
30
20
10 5 7 537 7
1722 2122
19 17
5358 5657 59
63
70SC1-2 2002SC3-4 2002SC5-6 2002
SC1-2 2006SC3-4 2006SC5-6 2006
(%)
010-11 12-14 15-17
Age Group (Years)
60
50
40
30
20
101 2 0
4 4 2
15 17 1511
1714
51
605553
5653

Been drunk in the last 30 daysChildren were also asked if they have been drunk in the last 30 days. Overall, 20% of children reported that they have been drunk in the last 30 days, but with large differences between age groups. About a third of boys and girls aged 15-17 years report such behaviour.
Figure 19: Percentages of boys who report having been drunk in the last 30 days
Figure 20: Percentages of girls who report having been drunk in the last 30 days
With the exception of children reporting they have never had an alcoholic drink, no marked changes are evident between 2002 and 2006 for the remaining alcohol-related variables reported here, with few gender and class differences observed.
50
(%)
0
40
30
20
10
SC1-2 2006SC3-4 2006SC5-6 2006
10-11 12-14 15-17Age Group (Years)
13 2
810 11
36 37 37
50
(%)
0
40
30
20
10
SC1-2 2006SC3-4 2006SC5-6 2006
10-11 12-14 15-17Age Group (Years)
1 1 0
710
12
34
41
36
Alcohol
26

Drug Use
The Irish Health Behaviour in School-Aged Children (HBSC) Study 2006
27
Cannabis use in the last 12 monthsAs with alcohol and smoking, there are substantial differences in reported cannabis use by age group. Overall, 16% of children report using cannabis during their lifetime (12% in 2002), with 12% reporting using cannabis in the last 12 months (11% in 2002), but rates are highest for those aged 15-17 years. The rates of reported cannabis use are similar to the 2002 HBSC study, with the exception of 15-17 year old boys where a decrease is evident.
Figure 21: Percentages of boys reporting cannabis use in the last 12 months
Figure 22: Percentages of girls reporting cannabis use in the last 12 months
40SC1-2 2002SC3-4 2002SC5-6 2002
SC1-2 2006SC3-4 2006SC5-6 2006
(%) 20
010-11 12-14 15-17
Age Group (Years)
30
10
1 200
20
68 76 5 5
2224 24
28
33 34
40SC1-2 2002SC3-4 2002SC5-6 2002
SC1-2 2006SC3-4 2006SC5-6 2006
(%) 20
010-11 12-14 15-17
Age Group (Years)
30
10
1 0 00 0 0
46 5
24 3
17
2220
15
21
15

Cannabis use in the last 30 daysChildren were also asked to report on taking cannabis in the last 30 days. Overall, 7% report using cannabis in this time frame and this is slightly higher for boys (8%) than girls (5%). Higher percentages of those aged 15-17 years report recent cannabis use than younger children.
Figure 23: Percentages of boys reporting cannabis use in the last 30 days
Figure 24: Percentages of girls reporting cannabis use in the last 30 days
30SC1-2 2006SC3-4 2006SC5-6 2006
20
(%)
10
010-11 12-14 15-17
Age Group (Years)
1 20
3 4 5
10
1315
30SC1-2 2006SC3-4 2006SC5-6 2006
20
(%)
10
010-11 12-14 15-17
Age Group (Years)
1 0 0
3 3 2
8
11 10
28
Drug Use

Food & Dietary Behaviour
The Irish Health Behaviour in School-Aged Children (HBSC) Study 2006
29
Fruit Children were asked about the frequency of their consumption of a variety of foodstuffs. In total, 19% report that they consume fruit more than once a day. Across all age groups, the rates in girls (23%) continue to be higher than for boys (16%). No changes were found between 2002 and 2006 in boys, however a slight increase in reported fruit consumption is evident among girls. No age trend is evident in boys, although a greater proportion of younger girls (10-11 years old) report consuming fruit more frequently than daily, compared to older girls. The social class gradient observed is clearest among girls.
Figure 25: Percentages of boys who report eating fruit more than once a day
Figure 26: Percentages of girls who report eating fruit more than once a day
40SC1-2 2002SC3-4 2002SC5-6 2002
SC1-2 2006SC3-4 2006SC5-6 2006
(%) 20
010-11 12-14 15-17
Age Group (Years)
30
10
17
21
1717 17 1618
16 1615 14
19 19
121514
10 11
40SC1-2 2002SC3-4 2002SC5-6 2002
SC1-2 2006SC3-4 2006SC5-6 2006
(%) 20
010-11 12-14 15-17
Age Group (Years)
30
10
38
23
2927
21
17
25
18
222119
15
2523
1921
16 15

Fruit: Middle Childhood Study Among 3rd and 4th class children, 30% report that they consume fruit more than once a day.
Figure 27: Percentages of 9 year old boys and girls who report eating fruit more that once a day
40
(%) 20
0
30
10
SC1-2 2006SC3-4 2006SC5-6 2006
Boys GirlsGender
2730
24
32 3133
30
Food & Dietary Behaviour
The Irish Health Behaviour in School-Aged Children (HBSC) Study 2006
31
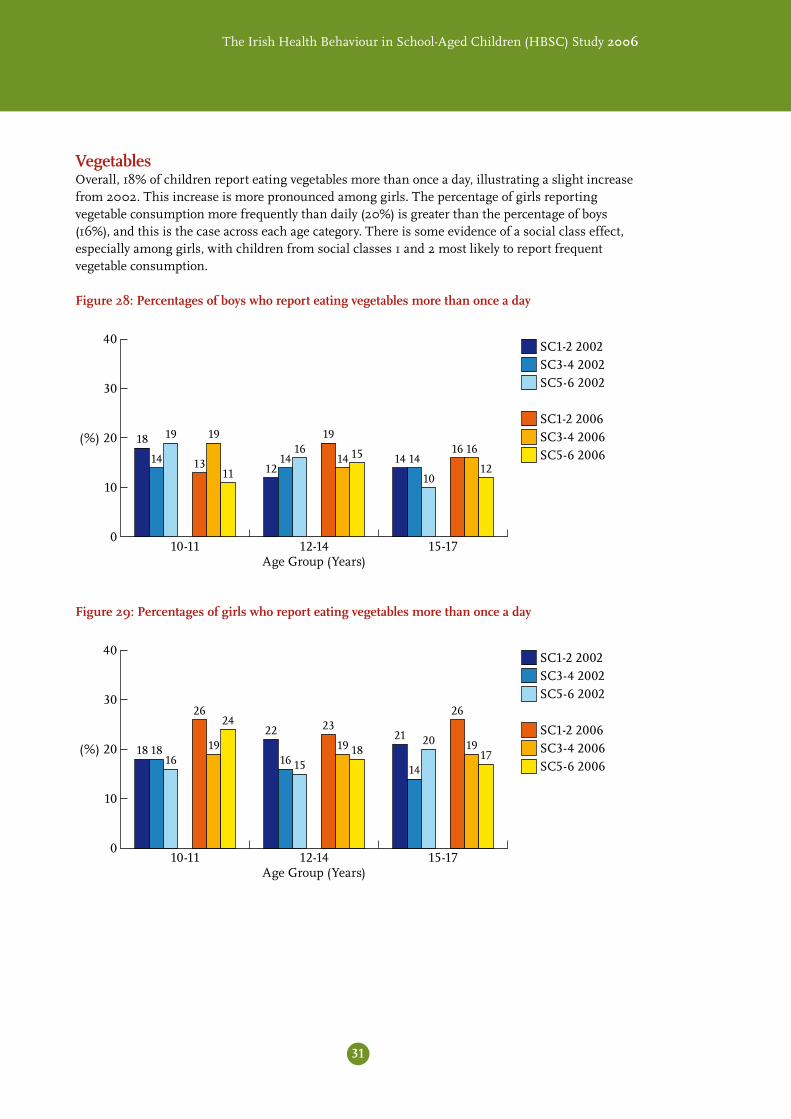
VegetablesOverall, 18% of children report eating vegetables more than once a day, illustrating a slight increase from 2002. This increase is more pronounced among girls. The percentage of girls reporting vegetable consumption more frequently than daily (20%) is greater than the percentage of boys (16%), and this is the case across each age category. There is some evidence of a social class effect, especially among girls, with children from social classes 1 and 2 most likely to report frequent vegetable consumption.
Figure 28: Percentages of boys who report eating vegetables more than once a day
Figure 29: Percentages of girls who report eating vegetables more than once a day
40SC1-2 2002SC3-4 2002SC5-6 2002
SC1-2 2006SC3-4 2006SC5-6 2006
(%) 20
010-11 12-14 15-17
Age Group (Years)
30
10
26
19
24
18 1816
23
19 18
22
16 15
26
1917
21
14
20
40SC1-2 2002SC3-4 2002SC5-6 2002
SC1-2 2006SC3-4 2006SC5-6 2006
(%) 20
010-11 12-14 15-17
Age Group (Years)
30
10
13
19
11
18
14
19 19
14 1512
1416 16 16
1214 14
10

32
Vegetables: Middle Childhood Study Among 3rd and 4th class students the same gender pattern is visible, with a slightly higher proportion of girls than boys reporting vegetable consumption more than once a day.
Figure 30: Percentages of 9 year old boys and girls who report eating vegetables more than once a day
40
(%) 20
0
30
10
SC1-2 2006SC3-4 2006SC5-6 2006
Boys GirlsGender
2123
19
24 2523
Food & Dietary Behaviour

SweetsChildren were asked to report on frequency of consuming sweets. Overall, 39% report eating sweets daily or more frequently. There are no clear gender or social class effects. The proportion of children reporting eating sweets daily or more frequently has decreased since 2002, particularly in the 10-11 year old age group.
Figure 31: Percentages of boys who report eating sweets daily or more
Figure 32: Percentages of girls who report eating sweets daily or more
The Irish Health Behaviour in School-Aged Children (HBSC) Study 2006
33
70SC1-2 2002SC3-4 2002SC5-6 2002
SC1-2 2006SC3-4 2006SC5-6 2006
(%)
010-11 12-14 15-17
Age Group (Years)
60
50
40
30
20
10
2528
25
44
50
61
3337
34
46 45 4439
43 45
55
47
55
70SC1-2 2002SC3-4 2002SC5-6 2002
SC1-2 2006SC3-4 2006SC5-6 2006
(%)
010-11 12-14 15-17
Age Group (Years)
60
50
40
30
20
10
25
34 35
48
4144
38
44 4550 52
49
39
45 44
61 60 60

34
Sweet consumption: Middle Childhood StudyOverall, 28% of 3rd and 4th class students report eating sweets once a day or more frequently.
Figure 33: Percentages of 9 year old boys and girls who report eating sweets daily or more
70
(%)
0
60
50
40
30
20
10
SC1-2 2006SC3-4 2006SC5-6 2006
Boys GirlsGender
23
3127
22
30 28
Food & Dietary Behaviour

The Irish Health Behaviour in School-Aged Children (HBSC) Study 2006
35
Soft drinksOverall 26% of children report drinking soft drinks daily or more, and the rates are highest among boys and the older age groups. The data presented illustrate a drop in soft drink consumption in all age categories between 2002 and 2006. There is some evidence of social class effects, with children from the highest social classes less likely to report frequent soft drink consumption.
Figure 34: Percentages of boys who report drinking soft drinks daily or more
Figure 35: Percentages of girls who report drinking soft drinks daily or more
60SC1-2 2002SC3-4 2002SC5-6 2002
SC1-2 2006SC3-4 2006SC5-6 2006
50
40
(%) 30
20
10
010-11 12-14 15-17
Age Group (Years)
1520
13
21
36 38
2328
3034
41 43
29
37 3842
4650
60SC1-2 2002SC3-4 2002SC5-6 2002
SC1-2 2006SC3-4 2006SC5-6 2006
50
40
(%) 30
20
10
010-11 12-14 15-17
Age Group (Years)
11
17
2321
28 30
16
2326
2934 33
15
29 2729
4045

Soft drinks: Middle Childhood Study Among 3rd and 4th class children 18% report drinking soft drinks once a day or more with a clear class gradient as illustrated below. Children from the social classes 1 and 2 are less likely to report frequent consumption of soft drinks.
Figure 36: Percentages of 9 year old boys and girls who report drinking soft drinks daily or more
60
50
40
(%) 30
20
10
0
SC1-2 2006SC3-4 2006SC5-6 2006
Boys GirlsGender
12
19 21
9
1722
36
Food & Dietary Behaviour

The Irish Health Behaviour in School-Aged Children (HBSC) Study 2006
37
Not having breakfastOverall, 14% of children report that they never have breakfast during weekdays, with clear age and gender differences. Similar to 2002, the rates increase with age and a greater proportion of girls than boys report not having breakfast on school days. Children from the highest social classes are least likely to report never having breakfast on weekdays.
Figure 37: Percentages of boys who report not having breakfast on weekdays
Figure 38: Percentages of girls who report not having breakfast on weekdays
Not having breakfast: Middle Childhood Study Overall, only 2% of 3rd and 4th class student report not having breakfast on any day of the week.
40SC1-2 2002SC3-4 2002SC5-6 2002
SC1-2 2006SC3-4 2006SC5-6 2006
(%) 20
010-11 12-14 15-17
Age Group (Years)
30
10
46
36 5
2
8 9 108
107
11
1618
1417
20
40SC1-2 2002SC3-4 2002SC5-6 2002
SC1-2 2006SC3-4 2006SC5-6 2006
(%) 20
010-11 12-14 15-17
Age Group (Years)
30
10
47 7
58
16
1215 14
12
17 16 15
24 25
16
2825

Food povertyChildren were asked to report how often they go to school or to bed hungry because there was not enough food at home. Children reporting that they always, often or sometimes go to school or to bed hungry were identified as experiencing food poverty. Overall, 17% of children report ever experiencing food poverty. There is no clear evidence of gender, age or social class effects, except for some elevated rates amongst the youngest boys.
Figure 39: Percentages of boys who report ever experiencing food poverty
Figure 40: Percentages of girls who report ever experiencing food poverty
30SC1-2 2002SC3-4 2002SC5-6 2002
SC1-2 2006SC3-4 2006SC5-6 2006
20
(%)
10
010-11 12-14 15-17
Age Group (Years)
23 23
16
10
24
21
13
191717
1917
15
1816
18
15 15
30SC1-2 2002SC3-4 2002SC5-6 2002
SC1-2 2006SC3-4 2006SC5-6 2006
20
(%)
10
010-11 12-14 15-17
Age Group (Years)
14 13
19
1416
8
12
15 141412 13
1517 18
11
1517
38
Food & Dietary Behaviour
The Irish Health Behaviour in School-Aged Children (HBSC) Study 2006
39
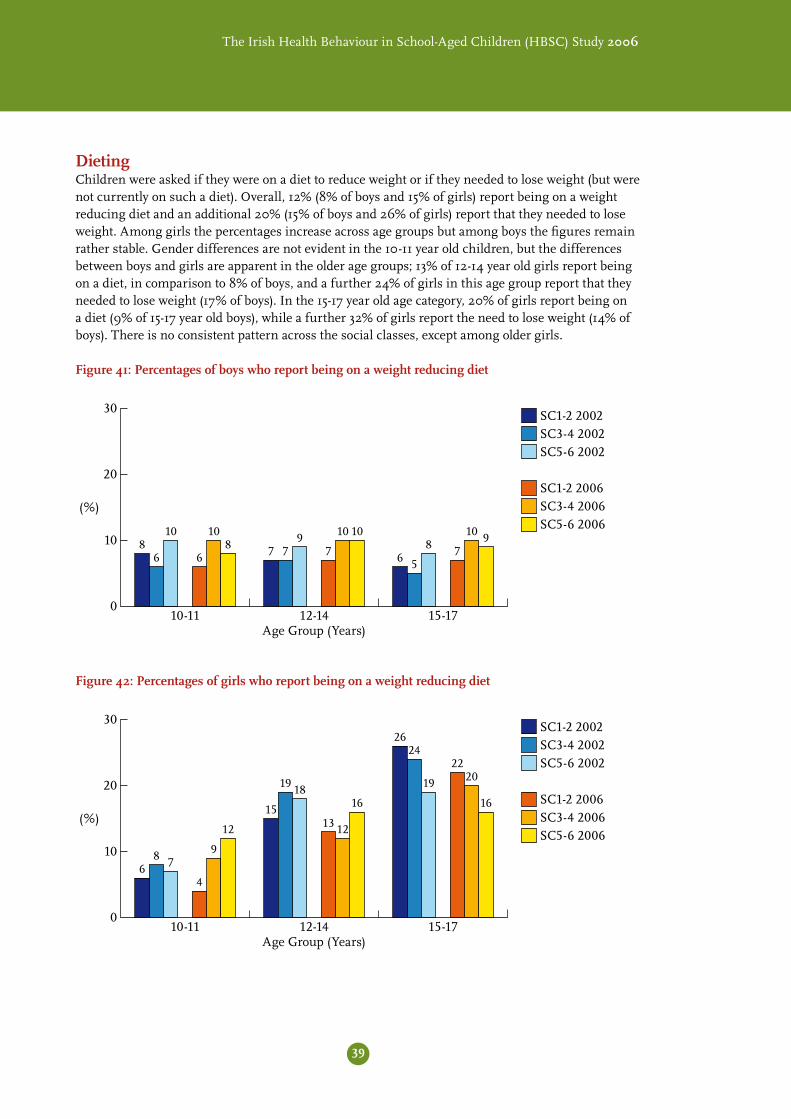
DietingChildren were asked if they were on a diet to reduce weight or if they needed to lose weight (but were not currently on such a diet). Overall, 12% (8% of boys and 15% of girls) report being on a weight reducing diet and an additional 20% (15% of boys and 26% of girls) report that they needed to lose weight. Among girls the percentages increase across age groups but among boys the figures remain rather stable. Gender differences are not evident in the 10-11 year old children, but the differences between boys and girls are apparent in the older age groups; 13% of 12-14 year old girls report being on a diet, in comparison to 8% of boys, and a further 24% of girls in this age group report that they needed to lose weight (17% of boys). In the 15-17 year old age category, 20% of girls report being on a diet (9% of 15-17 year old boys), while a further 32% of girls report the need to lose weight (14% of boys). There is no consistent pattern across the social classes, except among older girls.
Figure 41: Percentages of boys who report being on a weight reducing diet
Figure 42: Percentages of girls who report being on a weight reducing diet
30SC1-2 2002SC3-4 2002SC5-6 2002
SC1-2 2006SC3-4 2006SC5-6 2006
20
(%)
10
010-11 12-14 15-17
Age Group (Years)
6
1088
6
10
7
10 10
7 79
7
10 9
6 5
8
30SC1-2 2002SC3-4 2002SC5-6 2002
SC1-2 2006SC3-4 2006SC5-6 2006
20
(%)
10
010-11 12-14 15-17
Age Group (Years)
4
9
12
68 7
13 12
1615
19 18
2220
16
2624
19

40

Exercise & Physical Activity
The Irish Health Behaviour in School-Aged Children (HBSC) Study 2006
41
Children were asked about their participation in exercise in their free time. They were asked the frequency with which they exercised so much that they get out of breath or sweat. Presented here are data illustrating the percentages reporting that they exercise in such a way four or more times a week and those reporting that they exercise less than weekly. Overall, 53% of children (48% in 2002) report exercising four or more times a week while 11% exercise less than weekly (12% in 2002). However, this masks some substantial age and gender differences. Overall 7% of boys and 14% of girls are exercising less than weekly while 63% of boys and 43% of girls are exercising four or more times per week. Exercise participation decreases with age: exercising four or more times per week decreases from 64% of 10-11 year olds and 59% of 12-14 year olds to 42% of 15-17 year olds. This decrease is apparent among both genders but is particularly noticeable among girls (dropping from 58% of 10-11 year olds, through 51% of 12-14 year olds to 28% of 15-17 year olds).
Vigorous exercise ≥ 4 times/week
Figure 43: Percentages of boys who report participating in vigorous exercise four or more times per week
Figure 44: Percentages of girls who report participating in vigorous exercise four or more times per week
80SC1-2 2002SC3-4 2002SC5-6 2002
SC1-2 2006SC3-4 2006SC5-6 2006
(%) 40
010-11 12-14 15-17
Age Group (Years)
70
60
50
30
20
10
6874 73
67 66
58
7165
6964 66 65
55 55 5652
46 48
80SC1-2 2002SC3-4 2002SC5-6 2002
SC1-2 2006SC3-4 2006SC5-6 2006
(%) 40
010-11 12-14 15-17
Age Group (Years)
70
60
50
30
20
10
6156 5755 54
60
50 51 53
44 4541
29 27 2727 2722

Vigorous exercise ≥4 times/week: Middle Childhood StudyThe percentages of 3rd and 4th class students who report participating in vigorous exercise four or more times a week are high, with an overall of 72% (74% of boys and 69% of girls).
Figure 45: Percentages of 9 year old boys and girls who report participating in vigorous exercise four or more times per week
80
(%) 40
0
70
60
50
30
20
10
SC1-2 2006SC3-4 2006SC5-6 2006
Boys GirlsGender
76 74 7469 70 71
42
Exercise & Physical Activity

Vigorous exercise less than weeklyThe rates of children who report participating in vigorous exercise less than weekly are relatively low, with the exception of 15-17 year old girls. The social class pattern is not consistent, but inactivity is positively related to social class in the older age groups.
Figure 46: Percentages of boys who report participating in vigorous exercise less than weekly
Figure 47: Percentages of girls who report participating in vigorous exercise less than weekly
The Irish Health Behaviour in School-Aged Children (HBSC) Study 2006
43
30SC1-2 2002SC3-4 2002SC5-6 2002
SC1-2 2006SC3-4 2006SC5-6 2006
20
(%)
10
010-11 12-14 15-17
Age Group (Years)
9
6 6
10
7 8
5 4 4
86 6 7
911
6
108
30SC1-2 2002SC3-4 2002SC5-6 2002
SC1-2 2006SC3-4 2006SC5-6 2006
20
(%)
10
010-11 12-14 15-17
Age Group (Years)
7 8 9810
7 8 97
9 9
6
19
22
26
18
22 23
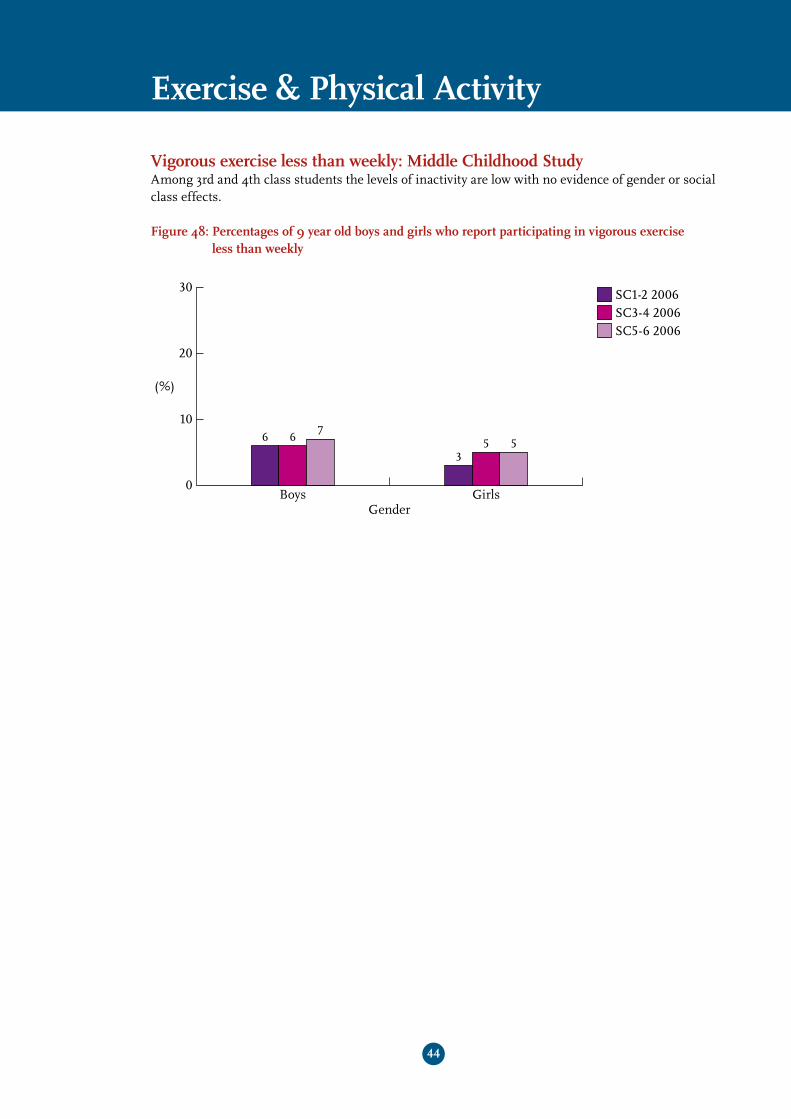
Vigorous exercise less than weekly: Middle Childhood Study Among 3rd and 4th class students the levels of inactivity are low with no evidence of gender or social class effects.
Figure 48: Percentages of 9 year old boys and girls who report participating in vigorous exercise less than weekly
30SC1-2 2006SC3-4 2006SC5-6 2006
20
(%)
10
0Boys Girls
Gender
6 6 7
35 5
44
Exercise & Physical Activity

100SC1-2 2002SC3-4 2002SC5-6 2002
SC1-2 2006SC3-4 2006SC5-6 2006
(%) 50
010-11 12-14 15-17
Age Group (Years)
90
80
70
60
40
30
20
10
75
84 84
6671
61
72 69 6966 6459
52 52 535144 43
Physical activity ≥ 5 daysChildren were further asked to report on how many days, over the past week, they were physically active for a total of at least 60 minutes per day. Overall, 55% of children report being physically active on five or more days in the last week, but here too substantial age and gender differences emerge. The percentages of boys and younger children reporting being physically active is higher than that of girls and older children. These figures demonstrate a small increase in levels of activity between 2002 and 2006 in most age groups.
Figure 49: Percentages of boys who report being physically active on five or more days in the last week
Figure 50: Percentages of girls who report being physically active on five or more days in the last week
The Irish Health Behaviour in School-Aged Children (HBSC) Study 2006
45
100SC1-2 2002SC3-4 2002SC5-6 2002
SC1-2 2006SC3-4 2006SC5-6 2006
(%) 50
010-11 12-14 15-17
Age Group (Years)
90
80
70
60
40
30
20
10
7769 71
59 60 59 5651 52
4844
38
2823
3025 27 28

Physical Activity: Middle Childhood StudyAmong the 3rd and 4th class children 79% report being physically active for at least 60 minutes on most days of the week, with little gender and no social class effect.
Figure 51: Percentages of 9 year old boys and girls who report being physically active on five or more days in the last year
100
(%) 50
0
90
80
70
60
40
30
20
10
SC1-2 2006SC3-4 2006SC5-6 2006
Boys GirlsGender
83 81 78 77 79 77
46
Exercise & Physical Activity

Self Care
The Irish Health Behaviour in School-Aged Children (HBSC) Study 2006
47
Tooth-brushingChildren were asked to report how often they brush their teeth. Overall, 63% of children report brushing their teeth more than once a day with a further 30% brushing their teeth once a day, but these figures mask substantial gender differences. The percentages of children who report brushing their teeth more than once a day remain stable over time and across age groups. More girls (72%) than boys (54%) report brushing their teeth more than once a day. There is some evidence of a social class effect in a number of groups, with children from higher social classes more likely to report brushing their teeth more than daily.
Figure 52: Percentages of boys who report brushing their teeth more than once a day
Figure 53: Percentages of girls who report brushing their teeth more than once a day
100SC1-2 2002SC3-4 2002SC5-6 2002
SC1-2 2006SC3-4 2006SC5-6 2006
(%) 50
010-11 12-14 15-17
Age Group (Years)
90
80
70
60
40
30
20
10
6356
525551
40
5550
5447
52 5257 55 53
58
46 45
100SC1-2 2002SC3-4 2002SC5-6 2002
SC1-2 2006SC3-4 2006SC5-6 2006
(%) 50
010-11 12-14 15-17
Age Group (Years)
90
80
70
60
40
30
20
10
75
66 6457
70 71 7368
727365 65
78 7974
7972 69
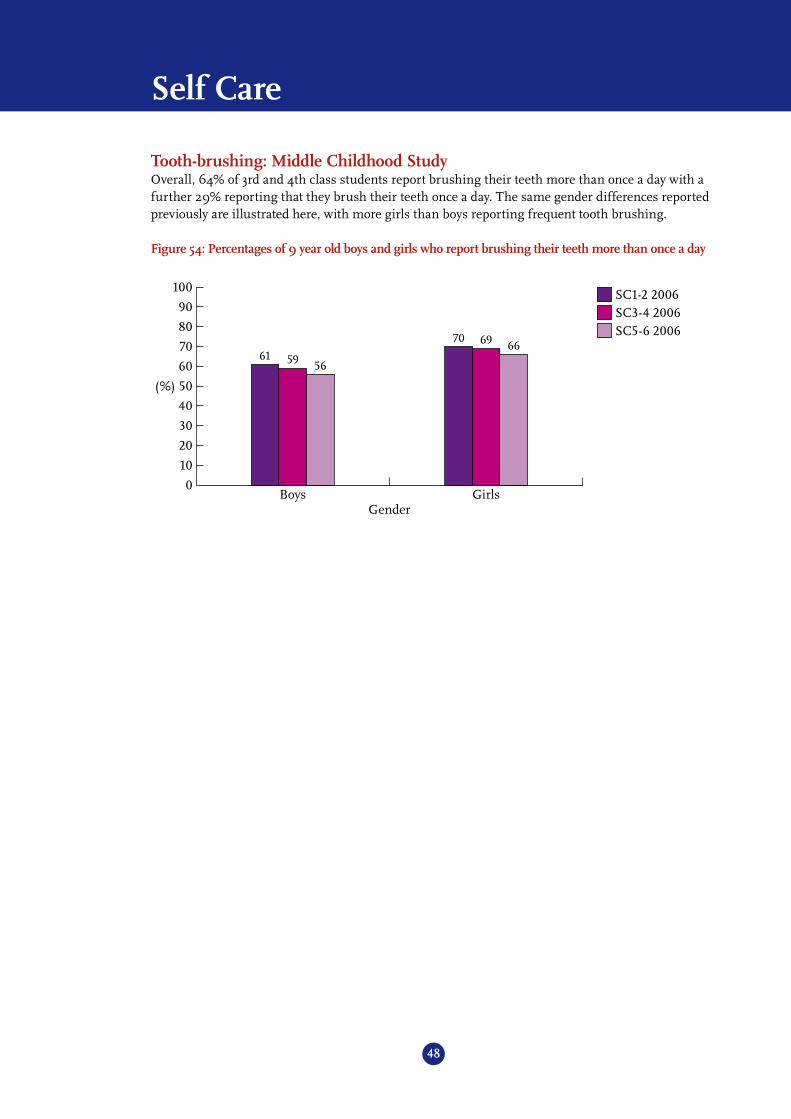
Tooth-brushing: Middle Childhood StudyOverall, 64% of 3rd and 4th class students report brushing their teeth more than once a day with a further 29% reporting that they brush their teeth once a day. The same gender differences reported previously are illustrated here, with more girls than boys reporting frequent tooth brushing.
Figure 54: Percentages of 9 year old boys and girls who report brushing their teeth more than once a day
100
(%) 50
0
90
80
70
60
40
30
20
10
SC1-2 2006SC3-4 2006SC5-6 2006
Boys GirlsGender
61 59 56
70 69 66
Self Care
48

100SC1-2 2002SC3-4 2002SC5-6 2002
SC1-2 2006SC3-4 2006SC5-6 2006
(%) 50
010-11 12-14 15-17
Age Group (Years)
90
80
70
60
40
30
20
10
76
88 90
64 62 61
76 78 75
5258 55
76 76 74
57 54 51
The Irish Health Behaviour in School-Aged Children (HBSC) Study 2006
49
Seatbelt UseChildren were asked to report how often they use a seatbelt when in a car. Overall, 79% of children report always wearing a seatbelt when they sit in a car. The percentage of girls (83%) who report always wearing a seatbelt is higher than boys (76%). These data illustrate an increase in seatbelt use between 2002 (57% of boys and 65% of girls) and 2006.
Figure 55: Percentages of boys who report always wearing a seatbelt
Figure 56: Percentages of girls who report always wearing a seatbelt
100SC1-2 2002SC3-4 2002SC5-6 2002
SC1-2 2006SC3-4 2006SC5-6 2006
(%) 50
010-11 12-14 15-17
Age Group (Years)
90
80
70
60
40
30
20
10
89 88 90
64
7672
81 82 84
6964
70
81 83 83
63 63 65

Seatbelt use: Middle Childhood StudyAmong 3rd and 4th class children 88% report always wearing a seatbelt in a car. In this group, the gender differences noted above are not apparent.
Figure 57: Percentages of 9 year old boys and girls who report always wearing a seatbelt
100
(%) 50
0
90
80
70
60
40
30
20
10
SC1-2 2006SC3-4 2006SC5-6 2006
Boys GirlsGender
86 87 8589 91 89
50
Self Care
Injuries
The Irish Health Behaviour in School-Aged Children (HBSC) Study 2006
51
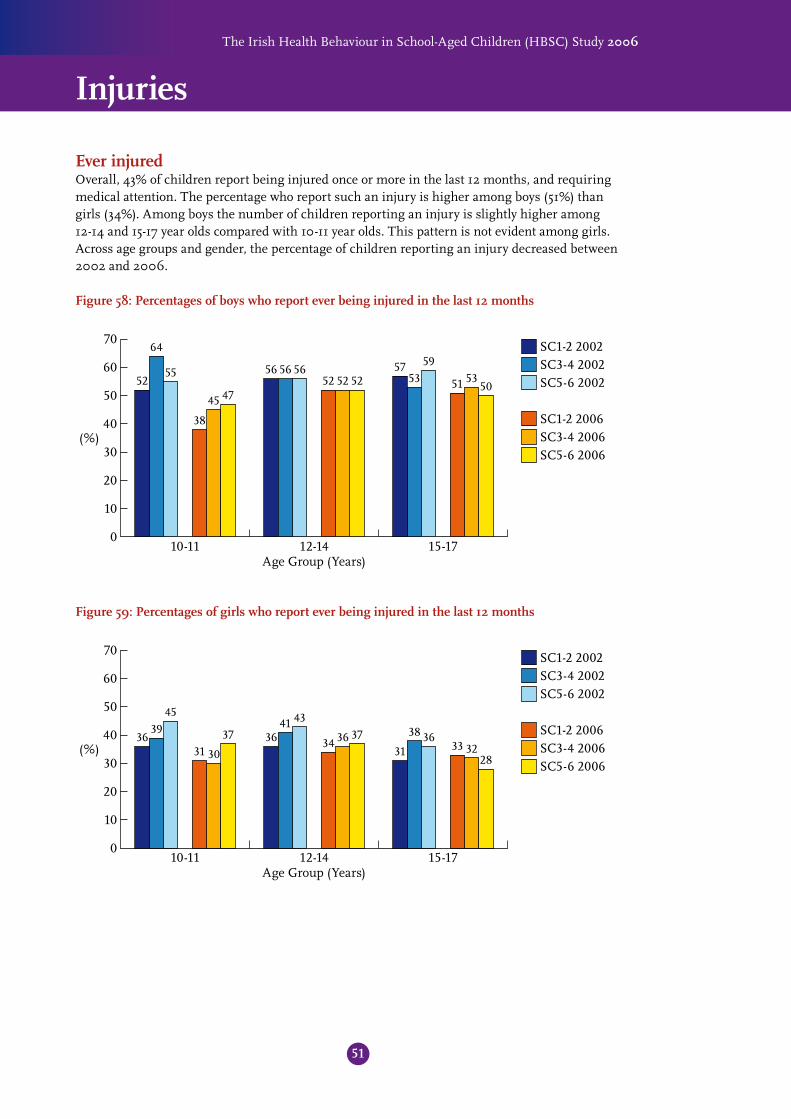
Ever injuredOverall, 43% of children report being injured once or more in the last 12 months, and requiring medical attention. The percentage who report such an injury is higher among boys (51%) than girls (34%). Among boys the number of children reporting an injury is slightly higher among 12-14 and 15-17 year olds compared with 10-11 year olds. This pattern is not evident among girls. Across age groups and gender, the percentage of children reporting an injury decreased between 2002 and 2006.
Figure 58: Percentages of boys who report ever being injured in the last 12 months
Figure 59: Percentages of girls who report ever being injured in the last 12 months
70SC1-2 2002SC3-4 2002SC5-6 2002
SC1-2 2006SC3-4 2006SC5-6 2006
(%)
010-11 12-14 15-17
Age Group (Years)
60
50
40
30
20
10
38
45 4752
64
5552 52 52
56 56 5651 53
50
5753
59
70SC1-2 2002SC3-4 2002SC5-6 2002
SC1-2 2006SC3-4 2006SC5-6 2006
(%)
010-11 12-14 15-17
Age Group (Years)
60
50
40
30
20
10
31 30
373639
45
34 36 373641 43
33 3228
31
38 36

Loss of activity due to injuryChildren were further asked to report on how many days of activity they lost, as a consequence of their most severe injury, in the past year. Overall, 15% of children report that they have missed 3 or more days of usual activity due to injury, with a higher percentage of boys (19%) than girls (11%) reporting such loss of activity. Among boys, the percentage of children who have missed days of activity is higher in 12-14 and 15-17 year olds compared to 10-11 year old children. This pattern is not evident among girls.
Figure 60: Percentages of boys who report that they have missed 3 or more days of usual activities due to injury in the last year
Figure 61: Percentages of girls who report that they have missed 3 or more days of usual activities due to injury in the last year
Among the children reporting an injury, a sports facility was the leading location for injuries (43% of boys and 34% of girls) followed by the home or yard (19% of boys and 23% of girls) and school (15% of boys and 18% of girls). The leading activity during which an injury occurred was a sports’ activity (55% of boys and 44% of girls) followed by biking (7% of boys and 5% of girls).
40
(%) 20
0
30
10
SC1-2 2006SC3-4 2006SC5-6 2006
10-11 12-14 15-17Age Group (Years)
10
1517
1921 20 19
23 23
40
(%) 20
0
30
10
SC1-2 2006SC3-4 2006SC5-6 2006
10-11 12-14 15-17Age Group (Years)
6 6
11 11 11 11 11 129
52
Injuries
Bullying
The Irish Health Behaviour in School-Aged Children (HBSC) Study 2006
53
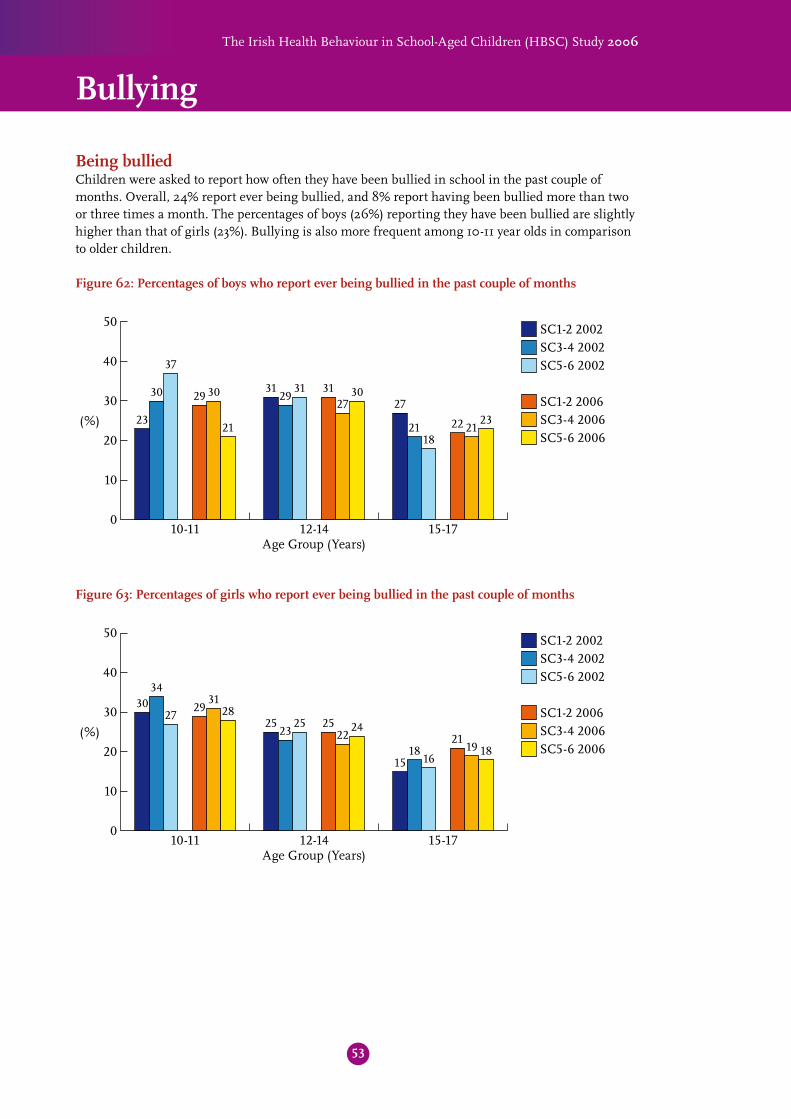
Being bulliedChildren were asked to report how often they have been bullied in school in the past couple of months. Overall, 24% report ever being bullied, and 8% report having been bullied more than two or three times a month. The percentages of boys (26%) reporting they have been bullied are slightly higher than that of girls (23%). Bullying is also more frequent among 10-11 year olds in comparison to older children.
Figure 62: Percentages of boys who report ever being bullied in the past couple of months
Figure 63: Percentages of girls who report ever being bullied in the past couple of months
50SC1-2 2002SC3-4 2002SC5-6 2002
SC1-2 2006SC3-4 2006SC5-6 2006
(%)
010-11 12-14 15-17
Age Group (Years)
29 30
2123
30
3740
30
20
10
3127
303129
31
22 2123
27
2118
50SC1-2 2002SC3-4 2002SC5-6 2002
SC1-2 2006SC3-4 2006SC5-6 2006
(%)
010-11 12-14 15-17
Age Group (Years)
2931
2830
34
27
40
30
20
10
2522
242523
2521
19 1815
1816
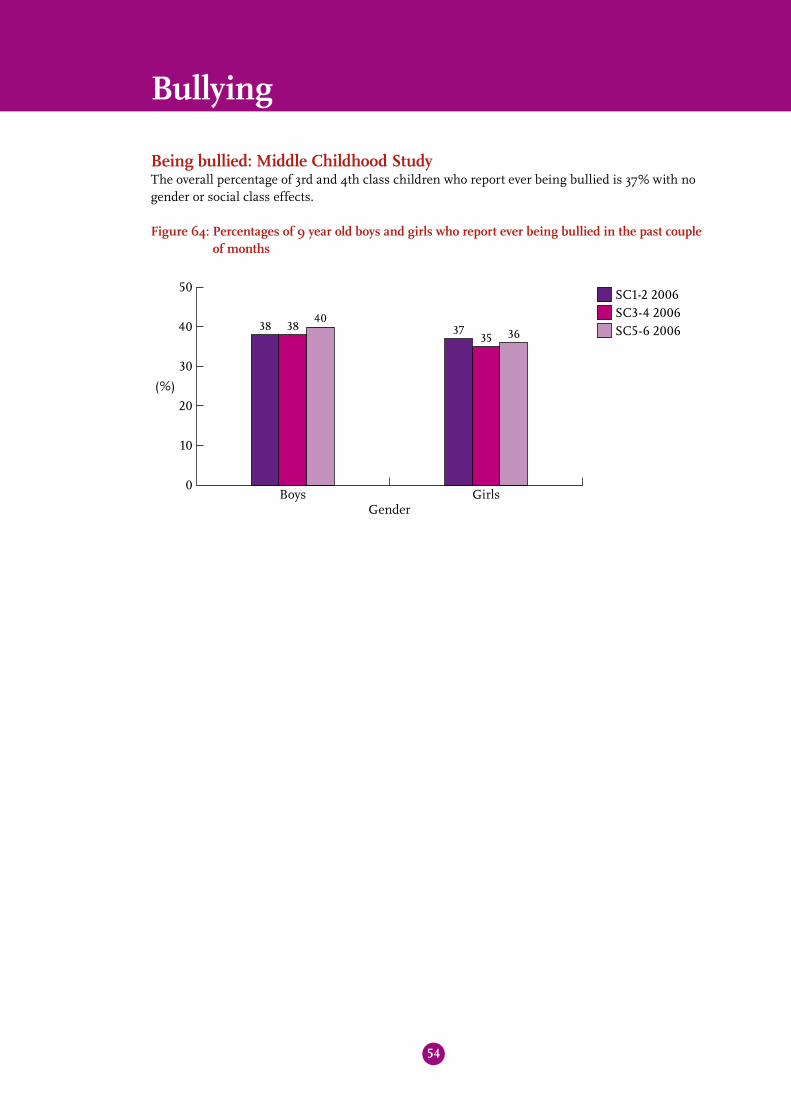
Being bullied: Middle Childhood Study The overall percentage of 3rd and 4th class children who report ever being bullied is 37% with no gender or social class effects.
Figure 64: Percentages of 9 year old boys and girls who report ever being bullied in the past couple of months
50
(%)
0
40
30
20
10
SC1-2 2006SC3-4 2006SC5-6 2006
Boys GirlsGender
38 3840
3735 36
54
Bullying

SC1-2 2002SC3-4 2002SC5-6 2002
SC1-2 2006SC3-4 2006SC5-6 2006
(%)
010-11 12-14 15-17
Age Group (Years)
1115
1211
16
5
40
30
20
1012
16 151620 19
1214
1113
17
11
Bullying others Children were also asked to report how often they took part in bullying another student at school in the past couple of months. Overall, 22% report ever bullying others, and 5% report bullying others more than two or three times a month. The percentage of boys (29%) taking part in bullying others is substantially higher than girls (14%). Higher percentages of boys in the 12-14 and 15-17 year old age groups report ever bullying others compared to the 10-11 year old boys. This pattern was not evident among girls.
Figure 65: Percentages of boys who report ever bullying others in the past couple of months
Figure 66: Percentages of girls who report ever bullying others in the past couple of months
50SC1-2 2002SC3-4 2002SC5-6 2002
SC1-2 2006SC3-4 2006SC5-6 2006
(%)
010-11 12-14 15-17
Age Group (Years)
27
21
15
2225
22
40
30
20
10
29 29 2931 31
39
3032
3532 33
29
The Irish Health Behaviour in School-Aged Children (HBSC) Study 2006
55
50
56

57
Demographic Representativeness Of Respondents HBSC 2006 survey
The gender breakdown of the HBSC 2006 participants revealed that 51% were male and 49% were female. Those who participated were compared to data from the 2002 census for region and social class. Table 2 presents the final numbers from each geographical region and the percentage of the total sample that this represents. The sixth column presents the percentages of 7-11 years olds recorded in the regions during the 2002 census. The data are representative of the population distribution across regions with slight variations from the 2002 census.
Table 2: Comparison of the location of 2002 and 2006 HBSC respondents to the 2002 census
N % %
Health Board HBSC 2002 HBSC 2006 HBSC 2002 HBSC 2006 Census 2002
East 1765 3055 31 30 33
North East 377 633 7 6 10
South East 565 1646 10 16 11
North West 586 704 10 7 6
South 826 1450 15 14 15
Mid West 573 914 10 9 9
West 544 1427 10 14 10
Midlands 412 395 7 4 6
In addition, social class was compared with those presented in the 2002 census, as shown in Table 3. It should be noted that slight variations would be expected here because the census reports all persons by social class, not all of whom would be parents or guardians of children in these age groups.
Table 3: Comparison of the social class of 2002 and 2006 HBSC respondents to the 2002 census
Social Class HBSC 2002 (%) HBSC 2006 (%) Census 2002 (%) *
Professional 4 4 6
Managerial 25 23 26
Non-manual 11 8 16
Skilled manual 28 29 17
Semi-skilled 10 11 11
Unskilled 4 5 6
Unknown 17 20 18
* All persons classified by social class
Appendix 1
The Irish Health Behaviour in School-Aged Children (HBSC) Study 2006
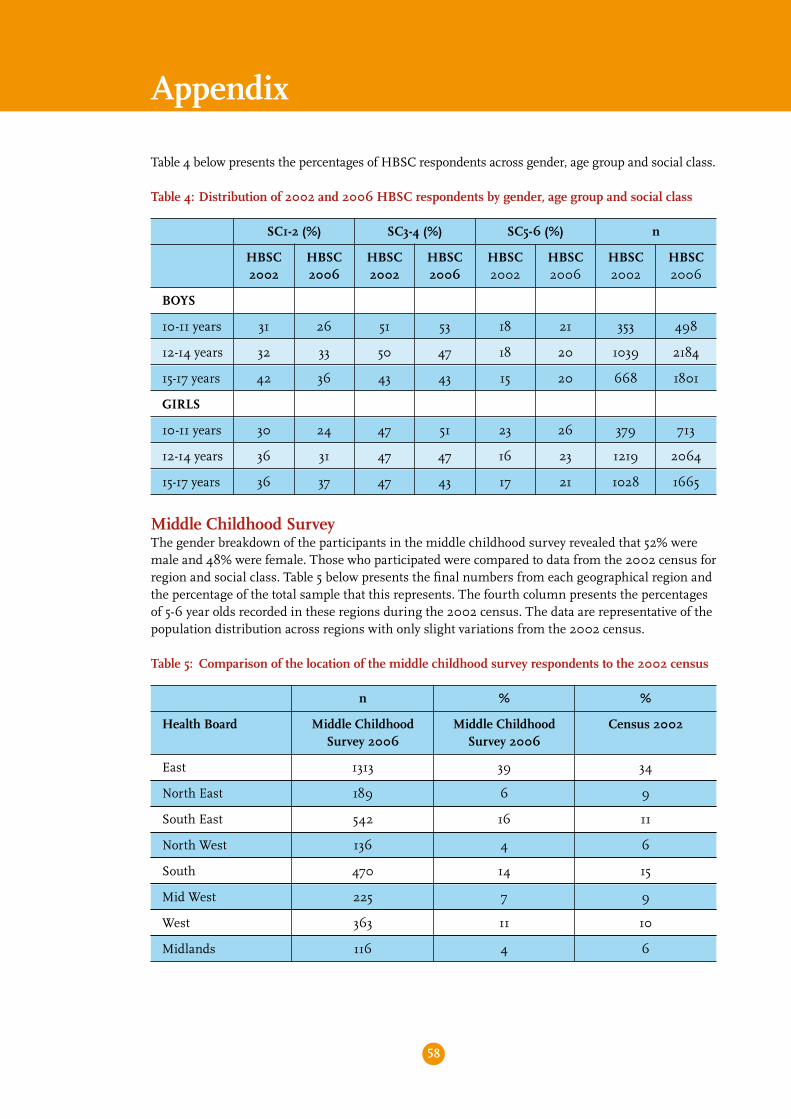
Table 4 below presents the percentages of HBSC respondents across gender, age group and social class.
Table 4: Distribution of 2002 and 2006 HBSC respondents by gender, age group and social class
SC1-2 (%) SC3-4 (%) SC5-6 (%) n
HBSC HBSC HBSC HBSC HBSC HBSC HBSC HBSC 2002 2006 2002 2006 2002 2006 2002 2006
BOYS
10-11 years 31 26 51 53 18 21 353 498
12-14 years 32 33 50 47 18 20 1039 2184
15-17 years 42 36 43 43 15 20 668 1801
GIRLS
10-11 years 30 24 47 51 23 26 379 713
12-14 years 36 31 47 47 16 23 1219 2064
15-17 years 36 37 47 43 17 21 1028 1665
Middle Childhood SurveyThe gender breakdown of the participants in the middle childhood survey revealed that 52% were male and 48% were female. Those who participated were compared to data from the 2002 census for region and social class. Table 5 below presents the final numbers from each geographical region and the percentage of the total sample that this represents. The fourth column presents the percentages of 5-6 year olds recorded in these regions during the 2002 census. The data are representative of the population distribution across regions with only slight variations from the 2002 census.
Table 5: Comparison of the location of the middle childhood survey respondents to the 2002 census
n % %
Health Board Middle Childhood Middle Childhood Census 2002 Survey 2006 Survey 2006
East 1313 39 34
North East 189 6 9
South East 542 16 11
North West 136 4 6
South 470 14 15
Mid West 225 7 9
West 363 11 10
Midlands 116 4 6
58
Appendix

The Irish Health Behaviour in School-Aged Children (HBSC) Study 2006
59
In addition, the social class distribution was compared with those presented in the 2002 census. As noted earlier slight variations would be expected because the census reports all persons by social class, not all of whom would be parents/guardians of children in these age groups.
Table 6: Comparison of the social class of middle childhood survey respondents to the 2002 census
Social Class 3rd and 4th class 2006 (%) Census 2002 (%)
Professional 6 6
Managerial 20 26
Non-manual 14 16
Skilled manual 21 17
Semi-skilled 21 11
Unskilled 4 6
Unknown 14 18
Table 7: Distribution of the middle childhood survey respondents by class group, gender and social class
SC1-2 SC3-4 SC5-6 Total sample
n (%) n (%) n (%) n
BOYS
3rd class 216 (30) 282 (39) 228 (31) 726
4th class 257 (34) 294 (38) 213 (28) 764
GIRLS
3rd class 189 (28) 294 (43) 195 (29) 678
4th class 207 (27) 319 (42) 231 (30) 757

Health Promotion Research Centre, National University of Ireland, Galway
Dr Saoirse Nic Gabhainn Principal Investigator HBSC (Republic of Ireland) Dr Michal Molcho Deputy Principal Investigator HBSC IrelandDr Colette Kelly HBSC Project Manager/Senior ResearcherDr Kieran Walsh Senior ResearcherMs Pauline Clerkin ResearcherMs Marie Galvin ResearcherMs Geraldine Nolan ResearcherMs Siobhan O’Higgins ResearcherMs Christina Costello Administrative supportMs Mary Cooke Administrative support
Advisory Committee
Ms Marian Beakey Department of Health and Children Mr Robbie Breen Department of Health and Children Dr Seán Denyer Director of Public Health, Health Services ExecutiveDr John Devlin Deputy Chief Medical Officer, Department of Health and ChildrenDr Sinéad Hanafin Head of Research, Office of the Minister for ChildrenMr Hugh Magee Senior Statistician, Department of Health and ChildrenMs Deirdre Mahony Department of Health and Children Mr Shay McGovern Department of Health and Children Mr Brian Mullen Department of Health and ChildrenMr Brian Neeson Functional Manager, Health Promotion Research & Development, Health Services ExeuctiveMs Biddy O’Neill Health Promotion Manager, Health Services Executive
Acknowledgements
The Parents and Children who consented and participatedThe Management Authorities, Principals and Teachers in all schools who participated International Co-ordinator: Prof Candace Currie, University of EdinburghInternational Databank Manager: Dr Oddrun Samdal, University of BergenAn Oifig Aistriúcháin, Acadamh na hOllscolaíochta Gaeilge, OÉ GaillimhDepartment of Health and ChildrenOffice of the Minister for ChildrenThe Department of Education and Science
We would also like to thank Mr Greg Conlon, Ms Gabrielle Ferris, Ms Tatziana Fries, Mr Gerard Maloney, Mr Trevor Moylan, Ms Elaine Shannon, Ms Lorraine Walker, Ms Catriona Boyle, Ms Patricia Brien, Ms Aoife Gavin, Ms Sonja-Mareike Freiling for their help on the various stages of the work.
Data Entry: Research Data, Co. Armagh and Lorraine Walker
Project Team
60