The Investor's Guide to the New Zealand Seafood Industry 2017 · Coriolis report “New Zealand...
82
THE INVESTOR’S GUIDE TO THE NEW ZEALAND SEAFOOD INDUSTRY 2017 Part of the New Zealand Food & Beverage Information Project FINAL REPORT; v1.05; June 2017
Transcript of The Investor's Guide to the New Zealand Seafood Industry 2017 · Coriolis report “New Zealand...

THE INVESTOR’S GUIDE TO THE NEW ZEALAND SEAFOOD INDUSTRY 2017 Part of the New Zealand Food & Beverage Information Project
FINAL REPORT; v1.05; June 2017

STEERING & GUIDANCE
This project would not have been possible without the strong guidance of ourSteering Committee. In particular, we would like to thank Andrew McCallumof MBIE for his tireless energy in keeping this project on track, while at thesame time pushing us forward.
Draft versions of parts of this document were distributed to key firms forcomment, addition or correction. This was done in the form of emails andphone calls. We thank those who helped us in this process for their time andeffort. We also thank those who provided their photos.
We are grateful for all of the input we have received, but the report is oursand any errors are our own.
Finally, we acknowledge the support of the Ministry of Business, Innovationand Employment (MBIE), New Zealand Trade and Enterprise (NZTE) and theMinistry of Primary Industries (MPI). It is their funding that has made thisreport possible.
CONSTRAINTS & INHERENT LIMITATIONS
This work was commissioned by the Ministry of Business, Innovation andEmployment (MBIE) and prepared by Coriolis. This work is based onsecondary market research, analysis of information available or provided toCoriolis by our client, and a range of interviews with industry participants andindustry experts. Coriolis have not independently verified this informationand make no representation or warranty, express or implied, that suchinformation is accurate or complete.
The report is dated June 2017 and Coriolis accepts no liability for, and has notundertaken work in respect of, any event subsequent to that date, which mayaffect the report.
Key global trade data analysed in all sections of the F&B Information projectare calculated and displayed in US$. This is done for a range of reasons:
- It is the currency most used in international trade- It allows for cross country comparisons (e.g. vs. Denmark)- It removes the impact of NZD exchange rate variability- It is more comprehensible to non-NZ audiences (e.g. foreign investors)- It is the currency in which the United Nations collects and tabulates
global trade data
Anyone should feel free to call the authors if any of the material cannot beunderstood or accessed. We always welcome opportunities to discuss ourresearch with our readers and users.
Projected market information, analyses and conclusions contained herein arebased (unless sourced otherwise) on the information described above and onCoriolis’ judgment, and should not be construed as definitive forecasts orguarantees of future performance or results. Neither Coriolis nor its officers,directors, shareholders, employees or agents accept any responsibility orliability with respect to this document.
Coriolis wishes to draw your attention to the following limitations of theCoriolis report “New Zealand Seafood Industry 2017“ (the Coriolis Report)including any accompanying presentation, appendices and commentary (theCoriolis Commentary):
a. Coriolis has not been asked to independently verify or audit theinformation or material provided to it by, or on behalf of the Client, or any ofthe parties involved in the project;
b. the information contained in the Coriolis Report and any CoriolisCommentary has been compiled from information and material supplied bythird party sources and publicly available information which may (in part) beinaccurate or incomplete;
c. Coriolis makes no representation, warranty or guarantee, whether expressor implied, as to the quality, accuracy, reliability, currency or completeness ofthe information provided in the Coriolis Report and any Coriolis Commentary,or that reasonable care has been taken in compiling or preparing them;
d. the analysis contained in the Coriolis Report and any Coriolis Commentaryare subject to the key assumptions, further qualifications and limitationsincluded in the Coriolis Report and Coriolis Commentary, and are subject tosignificant uncertainties and contingencies, some of which, if not all, areoutside the control of Coriolis; and
e. any Coriolis Commentary accompanying the Coriolis Report is an integralpart of interpreting the Coriolis Report. Consideration of the Coriolis Reportwill be incomplete if it is reviewed in the absence of the Coriolis Commentaryand Coriolis conclusions may be misinterpreted if the Coriolis Report isreviewed in absence of the Coriolis Commentary.
Coriolis is not responsible or liable in any way for any loss or damageincurred by any person or entity relying on the information in, and theRecipient unconditionally and irrevocably releases Coriolis from liability forloss or damage of any kind whatsoever arising from, the Coriolis Report orCoriolis Commentary including without limitation judgments, opinions,hypothesis, views, forecasts or any other outputs therein and anyinterpretation, opinion or conclusion that the Recipient may form as a resultof examining the Coriolis Report or Coriolis Commentary.
The Coriolis Report and any Coriolis Commentary may not be relied upon bythe Recipient, and any use of, or reliance on that material is entirely at theirown risk. Coriolis shall have no liability for any loss or damage arising out ofany such use.
Unless otherwise noted, all photos used in this discussion document wereprovided by the New Zealand Story resource (www.nzstory.govt.nz),purchased by Coriolis from a range of stock photography providers asdocumented, or are low resolution, complete product/brand for illustrativepurposes used under fair dealing/fair use for both “research and study” and“review and criticism”. Our usage of them complies with New Zealand law ortheir various license agreements.
Cover image: New Zealand Story
Where appropriate, this document is Copyright © 2017 Coriolis and MBIE.However, please feel welcome to use, refer to and cite this research.

+ Purpose
+ Situation summary
+ Drivers of success
+ Investment opportunities
+ SWOT
+ Supply chain
+ Global situation
+ Consumption
+ Production
+ Import demand
+ Key markets
+ Market growth
+ Number of firms
+ Employment
+ Yield/productivity
+ Production
+ Regional activity
+ Growth upside
+ Segmentation
+ Key products
+ Exports by product
+ Horizons for growth
+ Emerging export stars
+ New viable options
+ Mega-trends driving change
+ Innovation & new products
Market Overview
Context & Conclusions
Production Categories Growth & Innovation
01 02 03 04INTRO
TABLE OF CONTENTS
+ Enterprises
+ Employment
+ Turnover
+ Ownership
+ Foreign investors
+ Acquisitions
+ Investments
+ Firm Profiles
Firms Performance
05
Pages 3-10 Pages 11-26 Pages 27-31 Pages 32-40 Pages 41-54 Pages 55+

PURPOSE Why did the New Zealand government undertake this project?
4
The project presents a comprehensive, business-focused overview of the total New Zealand food & beverage industry.
The project pulls together the available information on the food and beverage industry into one place, in a form which is familiar and useful to business. The reports contain analysis and interpretation of trends and opportunities to materially assist with business strategy and government policy.
The information will be of vital use to businesses, investors, government, and research institutions as the industry expands and diversifies. This industry view will be very useful to government, enabling better dialogue and the opportunity to address issues collectively.
– As support for raising capital
– As a base of market intelligence to enable business to be much more targeted in their own market research
– Reviewing and informing offshore market development (including export and investment) strategies
– Assisting in identifying areas of innovation and R&D for the future
– Identifying strategic partners and collaborators
– Enabling a company to benchmark performance with that of its competitors
– Monitoring industry activity
– Gaining a better understanding of their own industry sector
– Identifying internal capability needs or external inputs
While the government collects large amounts of industry data, little of this has an investor or industry-driven perspective.
This information will provide much greater insight into the industry, which is useful for a range of policy developments, from regulatory frameworks to investment in science and skills and facilitating access to international markets.
In particular, a single source of factual information will enable government agencies to better coordinate their efforts across the system and be more responsive to addressing industry issues.
All project resources are available online at:
www.foodandbeverage.govt.nz
What is the purpose of the project? What benefit will this bring to businesses? How will government use the reports?

SITUATION SUMMARY: WILD CAPTURE While New Zealand has a large and sustainably managed wild catch fishery, there is little likelihood of significant volume or throughput increases going forward
5
ALL SEAFOOD: CONSUMERS/MARKETS
Per capita consumption of wild capture seafood hasbeen flat-to-declining globally, due to overfishing andpopulation growing faster than capture quantity. This“deficiency” is being made up for by a massiveexpansion in aquaculture.
Increased consumer demand for seafood across mostdeveloped countries is being driven by (1) scientificresearch showing health benefits and (2) changingdiets. At the same time, key seafood consumingcountries (e.g. South East Asia (SEA), China) areexperiencing growing incomes leading to increasedability to pay for (or demand) more seafood. Thissituation has supported prices.
The majority of fish consumption globally occurs inrestaurants and other foodservice outlets.Supermarkets underperform in seafood (relative toother proteins); significant sales occur in moretraditional channels (e.g. fishmongers and wetmarkets)
Demand for sustainable product varies by market.There is increasing demand in Western markets(Europe/North America), for sustainable productsoften driven by retailers (and vocal activists).However, there is currently low/no demand in Asianand developing markets for sustainability.
NZ exports seafood to over a hundred countries.Broadly speaking Western markets account for about
half of value and the growing Asian market the otherhalf.
Fresh seafood is a highly perishable product and thehighest value products are often those sold fresh(unlike some other foods). Bulk fish for furtherprocessing is also a key channel for NZ.
WILD CAPTURE: NEW ZEALAND
New Zealand has access to a strong set of naturalresources for wild capture fishing. The country is anisolated island nation in the middle of the SouthPacific, 2,100 kilometres from Australia. It has theninth largest exclusive fishing zone (EEZ1) and thetenth longest coastline of any country in the world.
Multiple sources suggest New Zealand’s fisheries areamong the most sustainable fisheries in the world (ona par with Alaska and Iceland). New Zealand useseffectively the same catch management system asIceland. However sustainable management has led toa decline in total wild capture over the past 15 yearsand there is low potential for substantial futuregrowth. Precision Harvesting research over recentyears is driving towards increasing the quality andtherefore value of the catch.
New Zealand has an efficient, modern seafoodindustry with large modern boats, in particular thedeep sea freezer trawlers. More than 130 species arecommercially fished in New Zealand’s EEZ, a similarspecies mix to Australia, Chile, Argentina, etc. The
main catch by volume is hoki, followed by mackereland squid. Rock Lobster are a major export that haveshown strong growth on rapidly growing demandfrom China.
Wild capture fishing is reasonably consolidated, witha handful of major firms and a range of secondaryfirms. Consolidation is more pronounced in deepwater fishing, less so in closer waters.
The industry has mixed ownership, with New ZealandMaori tribal interests predominating, but with onelisted firm (Sanford) and strong private ownershipand foreign investment (primarily Japanese).
WILD CAPTURE: COMPETITORS
NZ achieves a 7% share of the temperate SouthernHemisphere (S.H.) wild catch.2 New Zealandcompetes in the first instance with other colder waterSouthern Hemisphere countries, primarily Australia,Chile, Argentina, and South Africa. Secondarily, thisgroup compete with Northern Hemisphere colderwater fisheries, including Norway, Canada, Iceland,USA/Alaska, UK/Scotland.
Globally the wild capture seafood industry isfragmented with a huge number of medium to smallsized firms competing. Around the world in-shorefishing is highly fragmented and primarily localaround the world. Deepwater fishing is moreconsolidated due to capital requirements for largeboats, but still fragmented globally.
1. EEZ = Exclusive Economic Zone; 2. defined as Chile, Argentina, Brazil, South Africa, NZ & AU; Source: Coriolis
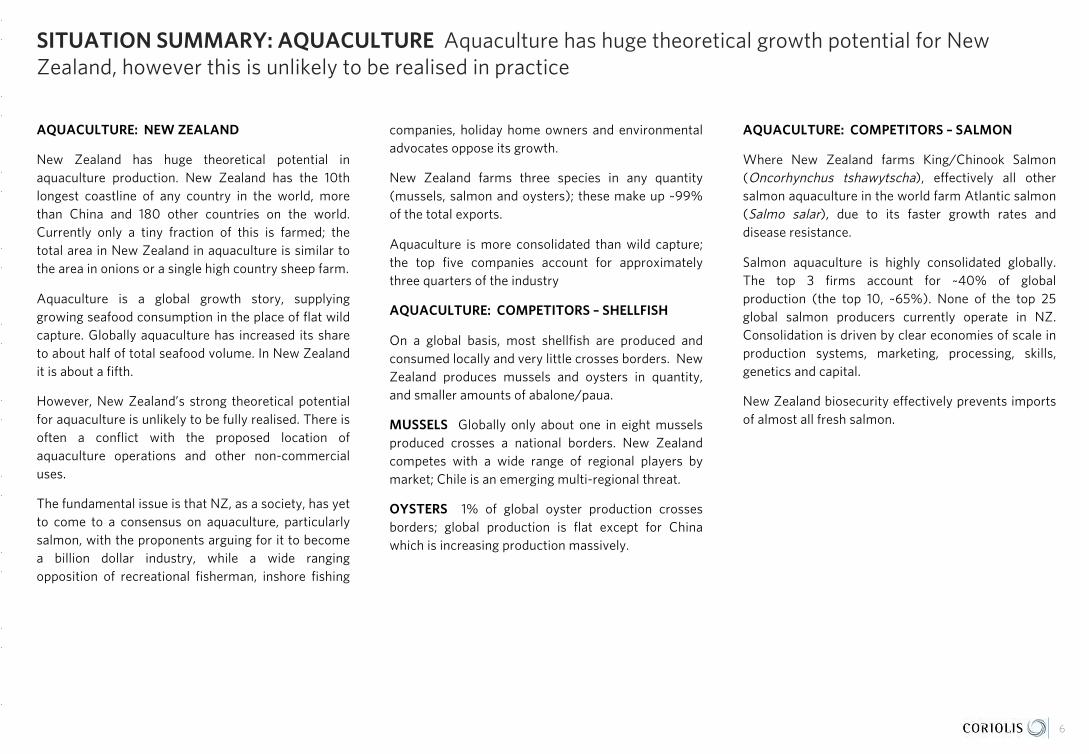
SITUATION SUMMARY: AQUACULTURE Aquaculture has huge theoretical growth potential for New Zealand, however this is unlikely to be realised in practice
6
AQUACULTURE: NEW ZEALAND
New Zealand has huge theoretical potential inaquaculture production. New Zealand has the 10thlongest coastline of any country in the world, morethan China and 180 other countries on the world.Currently only a tiny fraction of this is farmed; thetotal area in New Zealand in aquaculture is similar tothe area in onions or a single high country sheep farm.
Aquaculture is a global growth story, supplyinggrowing seafood consumption in the place of flat wildcapture. Globally aquaculture has increased its shareto about half of total seafood volume. In New Zealandit is about a fifth.
However, New Zealand’s strong theoretical potentialfor aquaculture is unlikely to be fully realised. There isoften a conflict with the proposed location ofaquaculture operations and other non-commercialuses.
The fundamental issue is that NZ, as a society, has yetto come to a consensus on aquaculture, particularlysalmon, with the proponents arguing for it to becomea billion dollar industry, while a wide rangingopposition of recreational fisherman, inshore fishing
companies, holiday home owners and environmentaladvocates oppose its growth.
New Zealand farms three species in any quantity(mussels, salmon and oysters); these make up ~99%of the total exports.
Aquaculture is more consolidated than wild capture;the top five companies account for approximatelythree quarters of the industry
AQUACULTURE: COMPETITORS – SHELLFISH
On a global basis, most shellfish are produced andconsumed locally and very little crosses borders. NewZealand produces mussels and oysters in quantity,and smaller amounts of abalone/paua.
MUSSELS Globally only about one in eight musselsproduced crosses a national borders. New Zealandcompetes with a wide range of regional players bymarket; Chile is an emerging multi-regional threat.
OYSTERS 1% of global oyster production crossesborders; global production is flat except for Chinawhich is increasing production massively.
AQUACULTURE: COMPETITORS – SALMON
Where New Zealand farms King/Chinook Salmon(Oncorhynchus tshawytscha), effectively all othersalmon aquaculture in the world farm Atlantic salmon(Salmo salar), due to its faster growth rates anddisease resistance.
Salmon aquaculture is highly consolidated globally.The top 3 firms account for ~40% of globalproduction (the top 10, ~65%). None of the top 25global salmon producers currently operate in NZ.Consolidation is driven by clear economies of scale inproduction systems, marketing, processing, skills,genetics and capital.
New Zealand biosecurity effectively prevents importsof almost all fresh salmon.

DRIVERS OF SUCCESS New Zealand’s success in seafood has three key drivers
Source: photo credit (purchased or creative commons (freenzphotos.com)) 7
- Strong natural resources for wild capture fishing
- Resources available for aquaculture
- Substantial exclusive fishing zone (EEZ) available for fishing
- Isolated location protected by natural barriers
Available resource
IDEAL WATER & CLIMATE EFFICIENT PEOPLE & SYSTEMS LOCATION & MARKETS
Trusted byconsumers
High share in key products
- Long history of seafood production
- Industry focused on export for over 100 years
- Large pool of skilled people
- Strong Quota Management System and support networks
- Well-organised, cohesive industry
- Excellent proximity to East & South-East Asian markets
- CER agreement with Australia
- Excellent market access across Asia
- NZ was the first developed country to sign a free trade deal with China (2008)

INVESTMENT OPPORTUNITIES There are limited opportunities for new external investment in wild capture; regulatory change and fundamental drivers create more opportunities in aquaculture
8
OOVVEERRAALLLL There are limited entry vehicles for newinvestors into seafood, as industry ownership of largerfirms is locked up by:
- Maori interests (unlikely to sell),
- Family businesses (Talleys, United, Independent, Solander, Vela) unlikely to sell without generational change.
- Cornerstone shareholdings of large global seafood companies (e.g. Nissui in Sealord)
- Long-term cornerstone shareholders in both publicly-listed firms: Sanford (Amalgamated) and New Zealand King Salmon (Oregon Group)
Investors seeking smaller opportunities will find awide range of opportunities among the second tier ofinteresting and innovative firms, many of which areseeking capital.
WILD CAPTURE The industry has a strong andeffective sustainability management system. Thissystem implies that New Zealand will have relativelymore fish in the future compared with overfishedcountries and regions.
Main source of value creation in wild capture is incost reductions via consolidation. This consolidation
is on-going, but progress is slow due to the ownershipissues discussed above. There are also opportunitiesin value creation through delivering a greater percentof the catch to the market in a more fresh/lessdamaged form (see the Precision Seafood HarvestingPrimary Growth Partnership programme, which is apartnership between industry and the Crown.’).
There are opportunities for growth and certainlyopportunities to find new markets for by-products andfish species that are not currently processed orretained.
AAQQUUAACCUULLTTUURREE The attractiveness of New Zealandaquaculture varies by species:
OYSTERS Pacific oysters have low growth potential,due to risks with potential new viral breakouts andglobal market structure/situation.
MUSSELS The industry is mature and consolidatingrapidly. Mussels are relatively low value use of space.Returns over the past twenty years have been mixedand cyclical, particularly for smaller operators (drivingindustry consolidation).
The SpatNZ Primary Growth Partnership programmeis a partnership between industry and the Crownwhich is supporting selective breeding. Theprogramme is on target to deliver hatchery grownmussel spat and will likely deliver constant
incremental gains in the future. However these aremore likely to maintain New Zealand’s relativecompetitiveness (e.g. vs. Chile) rather than translateinto dramatically increased profitability.
SALMON Theoretically New Zealand has hugepotential in salmon aquaculture; in practiceregulations and competing interests will likelyconstrain success. Industry is showing on-goingconsolidation. The largest salmon producer – NewZealand King Salmon – listed on the NZX/ASXsharemarket in late 2016.
NEW SPECIES New Zealand scientists are working ona wide range of new species, however these are allhighly speculative and unproven commercially todate. Only investors with transferable capabilities orstrong appetite for risk should participate. Recentpreliminary success in scampi aquaculture stands out.
FURTHER PROCESSING There are opportunities forinvestment in further processing of New Zealand bulkingredients (e.g. “white fish”) into consumer readyproducts, however this is primarily a greenfieldsopportunity for firms with transferrable skills.
There are clear opportunities for investment inseafood derived products (e.g. nutraceuticals,supplements, petfood)

SWOT ANALYSIS New Zealand has a stable and sustainable position in the global seafood industry
STRENGTHS WEAKNESSES
- Clean water and generally healthy aquatic environment- Unsubsidised industry- Early introduction of quota management system prevented collapse of stocks
through overfishing- Stocks generally at sustainable levels or rebuilding- Regularly ranked in top three sustainable regions- Efficient, modern industry with large modern boats, in particular the deep sea
freezer trawlers- Stable, long-term ownership in place across most major firms - Only country farming green lipped mussels (Perna canaliculus); others farm a
different green shelled species (perna viridis, etc.) or blue mussels (mytilus sp.)- Limited presence of disease in aquaculture species- Unique access to some bio-secure markets (particularly Australia & Japan)- Parts of domestic industry protected from imports by biosecurity measures- Government support of industry R&D
- Most industry wild capture growth metrics negative (Quota system)- Wild catch volume has fallen since 1998 leading to reduced throughput- Relatively small producer on a global scale- Supply fluctuates year-to-year with availability of wild capture fish- Mussels and oysters have low value per hectare; salmon development limited by
regulatory challenges - Most EEZ space low productivity deep water- Industry is bulk supply driven, rather than specialised/consumer focused- Firms primarily small/sub-scale with limited access to capital- Competing users of coastal space for aquaculture (e.g. holiday houses)- Highly regulated- No competitive advantage around aquaculture feed production due to low scale- Lack of market integration, not capturing in-market value- Limited in-market knowledge
OPPORTUNITIES ISSUES/THREATS/RISKS
- Consumer perceptions of health benefits of seafood- Large amounts of fish body currently going to meal and waste- Use of by-products for nutraceuticals /cosmetics sector- Growing interest by some more wealthy consumers in Western markets for eco-
labelling and environmental certification (driven by retailers)- Growing middle class in China and SE Asia- Gradual removal of global fishing subsidies- Ongoing removal of trade barriers and negotiation of new free trade agreements- Streamline regulations- New/improved supply chain technology
- New Zealand’s wild capture continues to decline- Other countries “catching up” on sustainability (e.g. Argentina)- Low cost competitors in low wage/low regulation/higher productivity warm
waters- NIMBY (not in my back yard) attitudes limiting industry activity- Single issue special interest groups driving domestic regulatory agenda- Rising costs of airfreight reducing feasibility of fresh exports
9

SUPPLY CHAIN New Zealand has a robust seafood supply chain that produces seafood products from wild capture and aquaculture
1. There may be one or more layers of wholesaling, depending on product or market; some wholesale functions maybe captive inside retailers or foodservice operators; 2. Includes product for housebrands, canners, fish meal manufacturers; Source: Coriolis analysis
SIMPLIFIED MODEL OF NEW ZEALAND SEAFOOD SUPPLY CHAINModel; 2017
10
Aquaculture
New Zealand waters
Seafood processing (wild+aquaculture)
Seafood wholesale
SeafreightAirfreight
Supermarkets
Fishmongers
Foodservice
Seafood wholesale1
(in-market)
Supermarkets/Fishmongers
Industrial2
Foodservice
Internationalmarkets
Domesticmarket
Non-NZ waters
Wild capture
Distributorwholesaler
SecondaryProcessing(in-market)
Global Market Overview
+ Global situation
+ Consumption
+ Production
+ Import demand
+ Key markets
+ Market growth
01

Fundamental demographic and production shifts have led to the global seafood market experiencing ongoing changes in both supply and demand
CONSUMPTION
- Global seafood consumption is concentrated in E/SE Asia (particularly China), Europe and the Americas
- Global per capita seafood consumption (all forms) is showing moderate growth (1.4% per year)
PRODUCTION
- Global production is 200m tons of seafood- Wild capture stalled around 1990, while aquaculture continues to
grow - As a result of the stall in wild capture, particularly of marine fish, the
global production mix is shifting dramatically to aquaculture production of freshwater fish, aquatic plants and molluscs
- Global seafood production (capture and aquaculture) is concentrated in E/SE Asia; New Zealand is a smaller, second tier producer overall
GLOBAL TRADE
- Global cross-border seafood trade volumes are growing (10y CAGR4%) with moderate price gains across the cycle leading to solid export value growth (10y CAGR 6%)
DEMAND: PRODUCT CATEGORIES
- Total global cross-border seafood trade is spread across a wide range of products
- White fish (US$38b), processed seafood ($23.9b), salmon ($15.1b) and prawns ($14.7b) stand out for size
- Squid, salmon, lobster and processed seafood stand out for their growth in demand over the past five years; white fish has shown slight growth in overall value despite declining volumes
DEMAND: IMPORT MARKETS
- Total global cross-border demand for seafood was US$122b in 2015; the key markets are Europe ($48.2b), the US ($17.8b), Japan ($11.7b) and China/HK (~$10b)
- Vietnam, Thailand, South Korea, China and a wide range of other smaller markets stand out for import market growth; Japan and Russia shrank over the period
- Markets vary in average seafood import price, with Hong Kong, the USA, Canada and Japan, followed by the “Big 4” Europeans, standing out as high value markets
SUPPLY: EXPORTERS
- China is the largest seafood exporter overall; New Zealand is a second tier exporter, similar in size to Australia and Argentina
- New Zealand is achieving moderate export price gains but no increase in volume
- Exporters vary in their average seafood export price, driven largely by product mix; New Zealand achieves a similar return to the US and Norway
12

Global seafood consumption is concentrated in E/SE Asia (particularly China), Europe and the Americas; global per capita seafood consumption (all forms) is showing moderate growth (1.4%)
0
5
10
15
20
1963
1965
1967
1969
1971
1973
1975
1977
1979
1981
1983
1985
1987
1989
1991
1993
1995
1997
1999
200
1
200
3
200
5
200
7
200
9
2011
2013
13* Final supply after processing & trade; * CAGR = Compound Annual Growth Rate; Note: 2013 is latest UN consumption data available as of April 2017; Source: UN FAOStat database; Coriolis analysis
AVAILABLE SEAFOOD SUPPLY BY REGION*Kilograms; millions; food supply quantity; 2013
50Y GLOBAL SEAFOOD CONSUMPTION PER CAPITAKilograms/person; food supply quantity; 1963-2013
Total = 132,829
Europe
Am
ericas
Australasia
NA
/ME/C
A
E/SE AsiaS Asia
SS Africa
Philippines3,108
Spain1,989
16,739816
China47,754
13,729
UK1,316
5,113
Indonesia7,039
France2,152
Other E/SE Asia5,798
Other A
mericas
1,924
78,3707,787
Other S A
sia956
10,274
Italy1,529 India
6,310
NA
/ME/C
A5,113
Vietnam2,995
New
Zealand
112A
ustralia60
9
Brazil2,178
Bangladesh3,008
Turkey455
Canada792
Mexico1,280
Japan6,179
Russia3,275
Other Europe6,023
Peru672
SS Africa
7,787
Myanmar2,897
USA6,883
S. Korea2,600
Pac. Is.95
50yCAGR1.4%
10

Global production is 200m tons of seafood; wild capture stalled around 1990, while aquaculture continues to grow
14* Diadromous fishes (migrate between fresh and salt water (e.g. salmon, eels) Note: 2015 is latest data available for all countries globally in UN FISHStat as of April 2017; Source: UN database; Coriolis
GLOBAL SEAFOOD PRODUCTION BY TYPE & METHODTonnes; m; landed; greenweight; 2015
40 YEAR GLOBAL SEAFOOD PRODUCTION BY METHODTonnes; million; 1975-2015
40yCAGR
3%
Total = 200
Aquatic plants
AquacultureCapture
Other misc.
Freshwater fishes
Crustaceans
Molluscs
Marine fishes
Diadromous fishes*
94
1
44
3
66
10
106
7
7
2
5
1
7
1
29
16
19921991
40y CAGR
1981
1975
19951996
1980
19931994
1990
1985
1982
1986
19841983
19791978
1989
40y ABS
1976
1988
Capture
1987
1977
1997
2012
200
2
200
6
200
9
200
1
2010
200
420
05
200
3
2011
2013
Aquaculture
200
7
2015
1998
200
8
200
01999
2014
78
159
80
163
76
72
189193
200
68
71
74
167176
181
74
81
108
136
112
103
136
103
125
129129
132
121
123
9198
152
156
88
153
140
106
140
100
149
105
31
101 8%
1%

As a result of the stall in wild capture (particularly of marine fish), the global production mix is shifting dramatically to aquaculture production of freshwater fish, aquatic plants and molluscs
15Source: UN FAOStat database; Coriolis analysis
40 YEAR GLOBAL SEAFOOD PRODUCTION BY TYPE & METHODTonnes; million; 1975-2015
GLOBAL SEAFOOD PRODUCTION SHARE BY TYPE & METHOD% of tonnes; 1975-2015
Other aquaculture
2015
Crustaceans
Molluscs
Freshwater fishes
Molluscs
40y ABS
1985
Aquatic plants
Other capture
Marine fishes
1995 20051975
Freshwater fishes
3%
3%
2%
3%
3%
5%
2%
100%
-2%
-0%
-42%
100%100%100%
-1%
+20%
100%
2%
+6%
-1%
+7%
+12%
70%
58%
2%
75%
8%
8%
6%
46%
33%
1%
5%
9%
15%
1%
6%
8%
3%
4%
5%
4%
4%
5%
22%
16%
10%
4%
4%
4%
5%
3%
7%
5%
5%
5%
6%
4%
2%
2005
Freshwater fishes
Other aquaculture
Crustaceans
40y ABS
Molluscs
1975
Molluscs
Other capture
40y CAGR
1995
Aquatic plants
2015
Marine fishes
Freshwater fishes
1985
+42
4
3
3
200
4
9%
2%
91
6%
8%
1%
1%
68
2%
3%
9%
152
+6
+16
+15
+28125
+15
+1
+4
+4
14
29
7
2
3
916
3
0
1
24
44
13
2
4
12
16
8
1
2
51
7
2
7
5
7
7
2
6
4
5
66
4
7064
72
10
3
8
5
6
Aquaculture
Capture

Global seafood production (capture and aquaculture) is concentrated in E/SE Asia; New Zealand is a smaller, second tier producer overall
16Note: 2015 is latest data available for all countries globally in UN FISHStat as of April 2017; Source: UN database; Coriolis analysis
GLOBAL SEAFOOD PRODUCTION BY KEY COUNTRIES & REGIONTonnes; million; 2015
GLOBAL SEAFOOD PRODUCTION BY KEY REGIONTonnes; million; 1975-2015
Total = 200
Europe
Am
ericas
Australasia
NA
/ME/C
A
E/SE Asia
S Asia
SS Africa
21.3
Chile3.2
France0.7
18.0
Other E/SE Asia6.5
Other Europe4.6
Bangladesh3.7
1.6
China79.4
Japan4.7
15.0
Pac. Is.0
.8
129.7
USA5.5
6.3
Peru4.9
7.7
India10.1
Other S A
sia1.3
Denmark0.9
Australia
0.2
Mexico1.7
Turkey0.7
New
Zealand
0.5
Philippines4.5
Russia3.8
Brazil1.3
SS Africa
7.7
UK0.9
Iceland1.3
Other A
mericas
3.7
Viet Nam6.2
Myanmar3.0
Norway3.8
S Korea3.3
Canada1.1
NA
/ME/C
A6.3
Indonesia22.2
Spain1.3
1995
Other E/SE Asia
40y ABS
S. Asia
North America
201520051975
SS Africa
1985
Australasia
Europe
China
Indonesia
NA/ME/CA
C/S America
40y CAGR
5
52
9
33
200
79
2%
68
-1%
91
3%1%
7%
1%
7%
2%
3%
4%
+8
-5
+4
+1
152
+3
+10
+21
+74
125
+5
+12
15
2321
14
22
254
3
18
2017
2 210 14
77
77 7
5
2225
24
15
18
28
7
22
4
1
2
2
4
2
68
5
7 10
46
3

Global cross-border seafood trade volumes are growing (10y CAGR 3%) with moderate price gains across the cycle leading to solid export value growth (10y CAGR 6%)
-
5.0
10.0
15.0
20.0
25.0
30.0
35.0
200
5
200
6
200
7
200
8
200
9
2010
2011
2012
2013
2014
2015
17Note: data is as reported sender FOB; Source: UN FAO database; Coriolis classification and analysis
GLOBAL EXPORT VOLUMEKG; b; 2005-2015
GLOBAL AVERAGE EXPORT PRICEUS$/kg; actual; 2005-2015
$0.00
$0.50
$1.00
$1.50
$2.00
$2.50
$3.00
$3.50
$4.00
$4.50
$5.00
200
5
200
6
200
7
200
8
200
9
2010
2011
2012
2013
2014
2015
GLOBAL EXPORT VALUEUS$; b; 2005-2015
10yCAGR
3%
10yCAGR
3%
$0
$20
$40
$60
$80
$100
$120
$140
$160
200
5
200
6
200
7
200
8
200
9
2010
2011
2012
2013
2014
2015
10yCAGR
6%
X =

Global cross-border seafood trade is spread across a wide range of products, though white fish (US$38b), processed seafood ($23.9b), salmon ($15.1b) and prawns ($14.7b) stand out for size
Note: “Squid, etc.” uses trade codes under HS03047-03079; Note: 2015 is latest available globally; data is as reported sender FOB; Source: UN Comtrade database; Coriolis analysis
GLOBAL SEAFOOD EXPORT VALUE BY PRODUCT CLASS/TYPEUS$; b; FOB; 2015
18
Total = $121.8
MolluscsLive fish Fish ProcessedCrustaceans
$29.4$1.8 $11.7$56.6 $22.4
White fish$38.0
Live fish$1.8
Salmon$15.1
Tuna$3.5
Oysters$0.3
Mussels$0.5
Squid, etc.$9.4
Fish oils & fats$1.7
Fish, dry/salt$3.7
Prawns$14.7
Processed seafood$23.9
Scallops$1.4
Other Crustaceans$4.1
Lobster$3.6
Bubble size is proportional to seafood export value in 2015; a bubble this size is US$3b
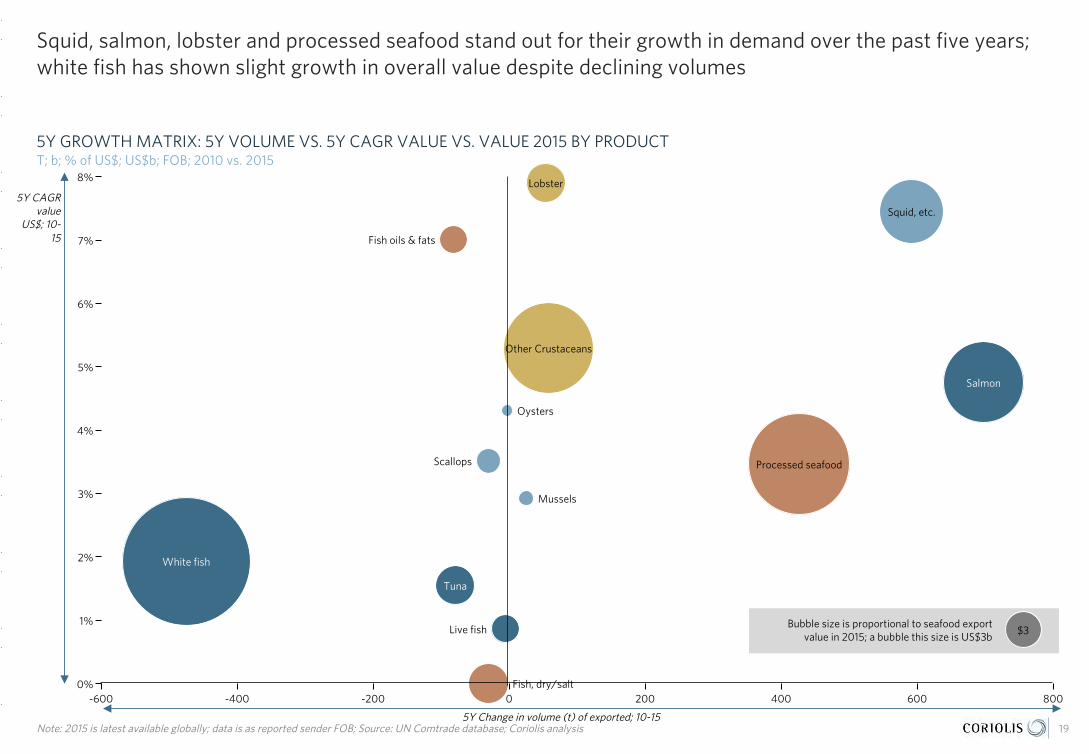
Squid, salmon, lobster and processed seafood stand out for their growth in demand over the past five years; white fish has shown slight growth in overall value despite declining volumes
Note: 2015 is latest available globally; data is as reported sender FOB; Source: UN Comtrade database; Coriolis analysis
5Y GROWTH MATRIX: 5Y VOLUME VS. 5Y CAGR VALUE VS. VALUE 2015 BY PRODUCT T; b; % of US$; US$b; FOB; 2010 vs. 2015
19
0%8000 200 400-200 600-600 -400
2%
5%
3%
4%
1%
8%
7%
6%
$3
Squid, etc.
Oysters
Scallops
Salmon
White fish
Live fish
Tuna
Fish oils & fats
Fish, dry/salt
Processed seafood
Mussels
Other Crustaceans
Lobster
5Y Change in volume (t) of exported; 10-15
5Y CAGRvalue
US$; 10-15

Total global cross-border demand for seafood was US$122b in 2015; the key markets are Europe ($48.2b), the US ($17.8b), Japan ($11.7b) and China/HK (~$10b)
Note: 2015 is latest available globally; data is as reported sender FOB; Source: UN Comtrade database; Coriolis analysis
GLOBAL SEAFOOD IMPORT VALUE BY RECEIVING COUNTRY/REGIONUS$; b; FOB; 2015
20
Total = $121.8
SS Africa
NA
/ME/C
A
Europe S Asia E/SE AsiaAmericasAustraliasia
France$6.1
Spain$5.8
$24.3$1.8
Italy$5.5
Other Americas$1.3 Turkey
$0.2
Other E Asia$2.8
$48.2 $40.5
SS Africa
$2.7
Venezuela$0.0
Saudi$0.5
Chile$0.3
$0.7$3.6
Colombia$0.3
Other Europe$19.7
United Kingdom$4.1
$2.7
Germany$5.2
Singapore$1.1
Brazil$1.1
Other S A
sia$0
.4
Other SE Asia$1.2
Canada$2.6
Malaysia$1.0
Egypt$0.6
Vietnam$4.4
Thailand$2.6
Mexico$0.8
UAE$0.6
Hong Kong SAR$4.3
USA$17.8
Russia$1.4
China$6.6
Other Pacific
$0.3
Sri Lanka$0
.3
Australia$1.4
Other N
A/M
E/CA
$1.9
South Korea$4.8
Japan$11.7
New
Zealand
$0.2

Bubble size is proportional to seafood import value in 2015; a bubble this size is US$3b
Vietnam, Thailand, South Korea, China and a wide range of other smaller markets stand out for import market growth; Japan and Russia shrank over the period
Note: 2015 is latest available globally; data is as reported sender FOB; Source: UN Comtrade database; Coriolis analysis
5Y GROWTH MATRIX: 5Y VOLUME VS. 5Y CAGR VALUE VS. VALUE 2015 BY RECEIVING COUNTRY/REGIONT; b; % of US$; US$b; FOB; 2010 vs. 2015
21
400 500-200 2001000-100 300
5%
0%
-5%
20%
15%
10%
600
S Korea
Other SE Asia
China
Other E Asia
Spain
Japan
$3
Hong Kong SAR
France
Colombia
Other Americas
Italy
UK
Other EuropeGermany
USA
Australia
New Zealand
Canada
Mexico
Chile
Brazil
Other S Asia
Other NA/ME/CA
Sri LankaVietnam
Malaysia
Singapore
Thailand
Turkey
SS Africa
EgyptSaudi
UAE
Russia
5Y Change in volume (t) of imported; 10-15
5Y CAGR value US$;
10-15

Markets vary in average seafood import price, with Hong Kong, the USA, Canada and Japan, followed by the “Big 4” Europeans, standing out as high value markets
Note: therefore area under chart is proportional to import value (volume x $/kg); Source: UN Comtrade data; Coriolis analysis and classifications
TOTAL GLOBAL SEAFOOD IMPORT VOLUME VS. AVERAGE IMPORT PRICE BY KEY MARKETKG; millions; US$/kg; actual; 2015
22
Sri Lanka
UA
E
Hong K
ong SAR
Japan
Canada
Australia
Venezuela
Vietnam
Spain
UK
South Korea
EgyptT
urkey
Italy
Germ
any
Russia
Other Europe
Other E A
sia
Other Pacific
SS Africa
Thailand
Other A
mericas
Chile
Saudi
Other S A
sia
Malaysia
Mexico
Brazil
Other N
A/M
E/CA
France
China
Other SE A
siaC
olombia
Singapore
USA
$2.99 $2.50
$4.86
$3.64
$5.45
$2.69
$5.33
$2.58
$1.79$2.0
8
$2.36
$1.63
$6.00
$5.38
$2.49$2.52
$3.03
$1.65
$3.26
$4.31
$5.33
$3.97
$7.28
$5.54
$6.25
$5.67
$9.99
$3.21
$3.75
$2.08
$3.37
$4.10
$4.15
$2.62
$3.78
Proportional to import volume in 2015
Average import
value per kilogramUS$/kg
2015
Weighted average $4.13

China is the largest seafood exporter overall; New Zealand is a second tier exporter, similar in size to Australia and Argentina
Note: 2015 is latest available globally; data is as reported sender FOB; Source: UN Comtrade database; Coriolis analysis
GLOBAL SEAFOOD EXPORT VALUE BY SENDING COUNTRY/REGIONUS$; b; FOB; 2015
23
Total = $121,840
AmericasAustralasia S Asia
E/SE Asia
NA
/ME/C
A
Europe
SS Africa
Other E/SE Asia$4,891
$42,364$23,893
$2,346
Netherlands$3,377
$2,660
Hong Kong SAR$760
$5,336 $42,917$2,323
Mexico$986
Russia$2,824
Belarus$258
Other Europe$15,590
Other Americas$1,465
Denmark$3,221
Other Pacific
$152
China$19,758
Argentina$1,445
USA$5,751
Australia
$1,066
New
Zealand
$1,105
NA
/ME/C
A$2,660
Turkey$704
Vietnam$6,573
Ecuador$3,533
Norway$9,078
Spain$3,645
Chile$4,456
Japan$1,902
SS Africa
$2,346
Canada$5,063
Other S Asia$519
India$4,818
Sweden$3,668
Indonesia$3,609
Peru$1,193
Thailand$5,424

New Zealand’s seafood trade share is drifting lower, similar to other Southern Hemisphere cool water peers other than Chile (which has a strong aquaculture sector)
Note: 2015 is latest available globally; data is as reported sender FOB; Source: UN Comtrade database; Coriolis analysis
GLOBAL EXPORT MARKET SHARE: KEY SOUTHERN HEMISPHERE COOL WATER SEAFOOD EXPORTERS% of value; US$; 2005-2015
24
2013
Australia
20152014
New Zealand
2005 2006 2007
10Y Change
South Africa
Argentina
2008 2011 20122010
Chile
2009
0.5%0.6%
0.5%
-0.5%
-0.4%
0.3%-0.3%
0.0%
0.0%
0.3%
0.4%0.5%0.5%
0.3%0.3%0.3%
3.8%
3.5%
3.8%
3.7%
4.0%
2.8%
3.9%
3.7%
3.5%
3.3%
3.2%
1.0% 1.0%1.1%
1.3%
1.1%1.0%
0.9% 0.9%0.9%1.0%
1.0%1.0%1.0%
1.1%
1.4%
1.2%
0.9%
0.8% 0.9%0.8%
0.9%0.8%
1.4%
1.3%1.3%
1.2%
1.6%
1.3%
1.1%1.2%1.2%
1.2%
1.1%

Bubble size is proportional to seafood import value in 2015; a bubble this size is US$3b
New Zealand is achieving moderate export price gains but no increase in volume
Note: 2015 is latest available globally; data is as reported sender FOB; Source: UN Comtrade database; Coriolis analysis
5Y GROWTH MATRIX: 5Y VOLUME VS. 5Y CAGR VALUE VS. VALUE 2015 BY EXPORTING COUNTRY/REGIONT; b; % of US$; US$b; FOB; 2010 vs. 2015
25
600-200
15%
4002000
0%
18%
750-10%
-450
-5%
5%
-400
10%
Denmark Netherlands
Russia
Turkey
Other Europe
Belarus
Ecuador
Chile
New Zealand
$3
USA
Other Americas
Norway
Peru
Mexico
NA/ME/CA
Canada
SpainArgentina
Other S Asia
China
Thailand
Other E/SE Asia
Hong Kong SAR
Japan
India
Vietnam
SwedenIndonesia
SS Africa
5Y Change in volume (t) of exported; 10-15
5Y CAGRvalue US$;
10-15

Exporters vary in their average seafood export price, driven largely by product mix; New Zealand achieves a similar return to the US and Norway
Note: therefore area under chart is proportional to import value (volume x $/kg); Source: UN Comtrade data; Coriolis analysis and classifications
SEAFOOD EXPORT VOLUME VS. AVERAGE EXPORT PRICE ACHIEVED BY EXPORTING COUNTRY/REGIONKG; millions; US$/kg; actual; 2015
26
China
Mexico
Australia
Spain
Hong K
ong SAR
Sweden
Other A
mericas
Canada
Belarus
Chile
Indonesia
Turkey
Norway
Japan
Vietnam
Other S A
sia
Thailand
Other Europe
NA
/ME/C
A
Denm
ark
India Russia
Peru
Other E/SE A
sia
Other Pacific
Argentina
SS Africa
Ecuador
New
Zealand
Netherlands
USA
$2.83
$3.48
$4.30
$4.0
5
$5.01
$5.09
$5.51
$5.21
$3.26$2.94
$3.27
$4.13
$3.66 $3.59
$4.61
$4.4
5
$4.60
$6.99
$7.55$16.15
$3.89
$4.39
$7.54
$2.40
$2.04
$3.42
$3.87
$4.98
$4.13
$2.78
$3.54
Proportional to export volume in 2015
Average export
value per kilogramUS$/kg
2015
Weighted average $4.13
Rock Lobster

New Zealand Seafood Production
+ Number of firms
+ Employment
+ Yield/productivity
+ Production
+ Regional activity
+ Growth upside
02

New Zealand produces sustainable quantities of seafood through wild capture and aquaculture
- New Zealand has the 10th largest coastline of any country and 6.7m km2 of controlled ocean space - the ninth largest claimed ocean space of any country – however most of this claim is deep water with low productivity
- New Zealand produces significant amounts of seafood under both wild capture and aquaculture
- Wild capture volumes have benefited from the increase in the allowed Hoki (Blue Grenadier) catch, while aquaculture production has achieved long-term growth
28
Defined as 200 nautical miles from
coastline
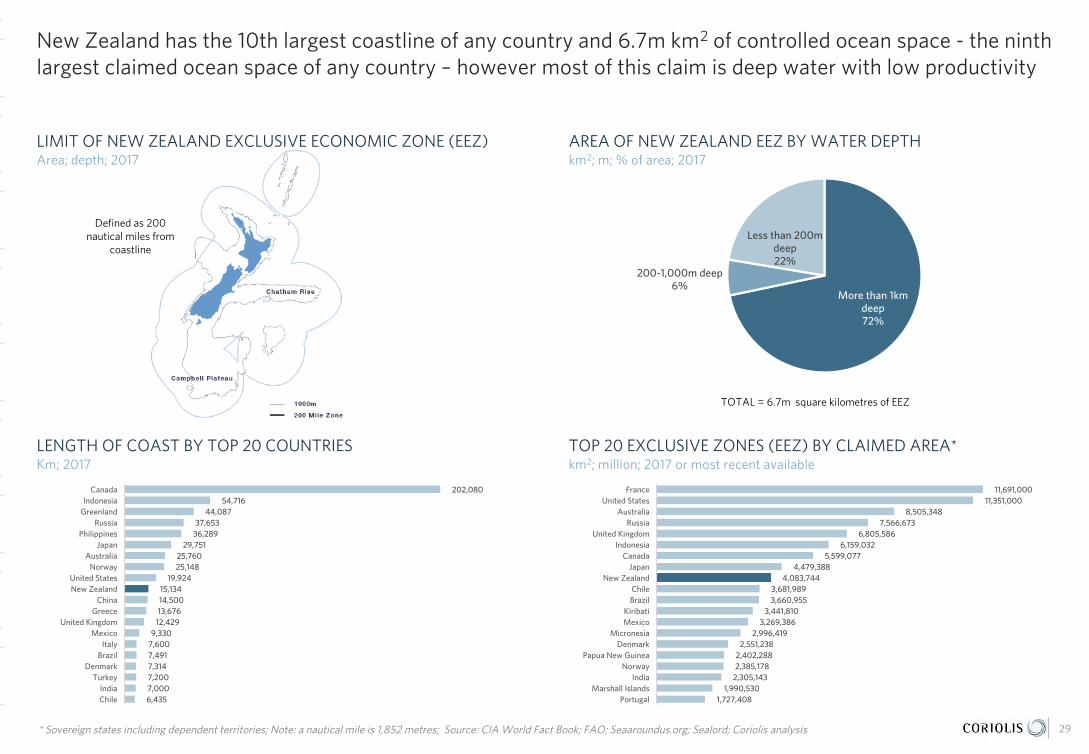
New Zealand has the 10th largest coastline of any country and 6.7m km2 of controlled ocean space - the ninth largest claimed ocean space of any country – however most of this claim is deep water with low productivity
29
LIMIT OF NEW ZEALAND EXCLUSIVE ECONOMIC ZONE (EEZ)Area; depth; 2017
AREA OF NEW ZEALAND EEZ BY WATER DEPTHkm2; m; % of area; 2017
202,080 54,716
44,087 37,653
36,289 29,751
25,760 25,148
19,924 15,134 14,500 13,676
12,429 9,330
7,600 7,491 7,314 7,200 7,000 6,435
CanadaIndonesia
GreenlandRussia
PhilippinesJapan
AustraliaNorway
United StatesNew Zealand
ChinaGreece
United KingdomMexico
ItalyBrazil
DenmarkTurkey
IndiaChile
LENGTH OF COAST BY TOP 20 COUNTRIESKm; 2017
TOP 20 EXCLUSIVE ZONES (EEZ) BY CLAIMED AREA*km2; million; 2017 or most recent available
* Sovereign states including dependent territories; Note: a nautical mile is 1,852 metres; Source: CIA World Fact Book; FAO; Seaaroundus.org; Sealord; Coriolis analysis
TOTAL = 6.7m square kilometres of EEZ
11,691,000 11,351,000
8,505,348 7,566,673
6,805,586 6,159,032
5,599,077 4,479,388
4,083,744 3,681,989 3,660,955
3,441,810 3,269,386
2,996,419 2,551,238
2,402,288 2,385,178
2,305,143 1,990,530
1,727,408
FranceUnited States
AustraliaRussia
United KingdomIndonesia
CanadaJapan
New ZealandChileBrazil
KiribatiMexico
MicronesiaDenmark
Papua New GuineaNorway
IndiaMarshall Islands
Portugal
More than 1km deep72%
200-1,000m deep6%
Less than 200m deep22%

New Zealand produces significant amounts of seafood under both wild capture and aquaculture
0
100
200
300
400
500
600
700
1950
1952
1954
1956
1958
1960
1962
1964
1966
1968
1970
1972
1974
1976
1978
1980
1982
1984
1986
1988
1990
1992
1994
1996
1998
200
0
200
2
200
4
200
6
200
8
2010
2012
2014
30
TOTAL NZ WILD CAPTURE SEAFOOD PRODUCTIONTonnes; 000; 1950-2015
AQUACULTURE PRODUCTION PER KILOMETRE OF COAST Tonnes; actual; 1950-2015
NZ WILD CAPTURE PER PERSONKG/capita; actual; 1950-2015
0%
10%
20%
30%
40%
50%
60%
70%
80%
90%
100%
195019521954195619581960196219641966196819701972197419761978198019821984198619881990199219941996199820
00
200
220
04
200
620
08
2010
2012
2014
SHARE OF TOTAL SEAFOOD PRODUCTION BY TYPE% of tonnes; 1950-2015
Note: 2015 data latest available as of April 2017; Source: UN FAO FishStat database; MFish/MAF/MPI; Coriolis analysis
50-76CAGR
3%
97-08CAGR-3.2%
76-97CAGR
11%
UNCLOS 1982EEZ 200nm
08-15CAGR-0.6%
-
20
40
60
80
100
120
140
160
180
200
1950
1952
1954
1956
1958
1960
1962
1964
1966
1968
1970
1972
1974
1976
1978
1980
1982
1984
1986
1988
1990
1992
1994
1996
1998
200
0
200
2
200
4
200
6
200
8
2010
2012
2014
Aquaculture
Wild capture
-
1
2
3
4
5
6
7
8
9
10
1950
1952
1954
1956
1958
1960
1962
1964
1966
1968
1970
1972
1974
1976
1978
1980
1982
1984
1986
1988
1990
1992
1994
1996
1998
200
0
200
2
200
4
200
6
200
8
2010
2012
2014

Wild capture volumes have benefited from the increase in the allowed Hoki (Blue Grenadier) catch, while aquaculture production has achieved long-term growth
31
TOTAL WILD CAPTURE BY SPECIES GROUPTonnes; 000; 1975-2015
TOTAL AQUACULTURE PRODUCTION BY KEY SPECIES Tonnes; 000; 1975-2015
Note: 2015 data latest available as of April 2017; Source: UN FAO FishStat database; MFish/MAF/MPI; Coriolis analysis
1989
1987
19901991
1988
Pacific salmon
1992
197719781979
1976
AbaloneOyster
1975
198419851986
1983
198019811982
2013
1999
200
520
06
1998
2010
200
0
200
2
2011
200
3
200
1
2012
200
4
1997
1994
2015
1995
1993
Mussel
200
8
2014
1996
200
9
200
7
105
112 111
11091
97
11710
0
19
94
7577
92
11
1712
49
51
5253
2728
29
70
86
105
1
92
2
112
2
108
3
7
87
10
76
33 3
85
200
5
1995
Arrow squid
200
7
2011
200
6
1996
Oreo dories nei
200
0
200
220
01
200
9
Other
1999
200
320
04
1997
2010
200
8
1998
1994
Orange roughy
1987
2015
1976
19811982
1988
1986
Silver warehou
1983
Ling
1984
Hoki
1975
1985
1977
Snoek
1992
19781979
2012
1993
1980
2013
1989
Mackerels nei
Southern blue whiting
2014
Blue mackerel
19911990
6369
7898
19620
820
3
169
117154
167
545
477
495
546
570589
551
453 4
44
44
3 433
44
2
44
04
374
30
352386
470
316
208
241
277
433
648
600
553
649
453
5574
25

New ZealandCategory Performance
+ Segmentation
+ Key products
+ Exports by product
03

New Zealand has a solid position in select seafood products where it has real strengths
33
- New Zealand has a stable wild seafood catch, is a leader in rock lobster and is innovating in mussel and salmon products
- Exports are spread across six categories
- however wild capture (54%), rock lobster (20%), and mussels (14%) are the largest
- Export value is growing across the cycle
- Average export price varies by category, with rock lobster standing out for dramatically higher prices and wild capture accounting for the bulk of export volume
- Mussels, salmon, oysters and lobster are shifting to value (higher prices at lower volumes), while wild capture is experiencing falling volumes and price pressure
- WILD CAPTURE Thanks to pioneering quota management systems, New Zealand has a long-term, sustainable supply of ~450k tonnes of wild capture seafood available
- ROCK LOBSTER* New Zealand has a long-term, sustainable supply of rock lobster available; export value growing strongly, with almost all volume now going to China/Hong Kong
- MUSSELS New Zealand has a strong position in green shelled mussel aquaculture, producing a third of global green supply; export value growing strongly
- SALMON New Zealand is the global market leader in King/Chinook Salmon aquaculture, a small but premium species; there is potential for further strong growth
OVERVIEW BY CATEGORY
* Rock Lobster: While rock lobster is a “wild capture” seafood in New Zealand, this project considers it separately, due to its significance and growth

New Zealand has a stable wild seafood catch, is a leader in rock lobster and is innovating in mussel and salmon products
Source: photo credit (purchased, courtesy of firms or fair use; low resolution; complete product/brand for illustrative purposes); Coriolis classifications and analysis 34
WILD CAPTURE
- Stable, predictable, secure long term supply of fish
- NZ pioneering of wild catch quota management has prevented collapse of fish stocks (unlike competitors)
StableSupply
MUSSELS
- Modern and consolidated industry
- Proven supply chain, track record in in-store merchandising systems
- Recently implemented breeding program driving productivity gains
Pioneering Farmer & ExporterUnique Species
ROCK LOBSTER
- Well managed fishery
- Stable supplies
- One of two major global suppliers of spiny red rock lobster (rest of world primarily clawed lobster)
- Growing strongly into China and wider Asia
Major GlobalExporter
SALMON
- Highly consolidated and at scale
- Effectively only global supplier of farmed Chinook; others hampered by disease
- Lack of key salmon diseases (e.g. ISA)
- Huge potential for growth (5x/10x)
#1 Global FarmedChinook/King Salmon
KEY HIGH-LEVEL CATEGORIES

Exports are spread across six categories, however wild capture (54%), rock lobster (20%), and mussels (14%) are the largest; exports are growing across the cycle
35NOTE: “processed seafood is seafood relevant global trade codes under HS 1603-1605 (see page 80 for details); oysters includes wild catch and export (inseparable at source); Source: UN Comtrade database (from NZ Customs data); Coriolis classifications and analysis
NEW ZEALAND SEAFOOD EXPORT VALUE BY SEGMENTUS$; m; 2015
NEW ZEALAND SEAFOOD EXPORT VALUE BY SEGMENTUS$; m; 2005-2015
Processed seafood
Mussels
2009 2010 2011
Oysters
2007 2008 2014 2015
Wild capture
2012
Lobster
201320062005
Salmon
$131
$1,218
$104
$96
$1,242
$115
$206
$1,105
$153
$129
$1,236
$77 $83$95
$949
$853$83
$907
$1,033 $90
$1,187
$873 $875
$79
$163
$174
$181
$89 $128
$116
$205$12$12
$12
$223
$214
$11
$554$505
$583$574 $539 $559
$673$598
$80$82
$733$678 $668
$10
$36
$113$114
$37$44
$30
$126
$167
$150$144
$142
$124
$119
$15
$13
$14
$12
$15$12
$19 $36
$52
$42
$27$26
$30
Wild capture$598 54%
Lobster$214 20%
Mussels$153 14%
Salmon$36 3%
Oysters$14 1%
Processed seafood, $90 ,
8%
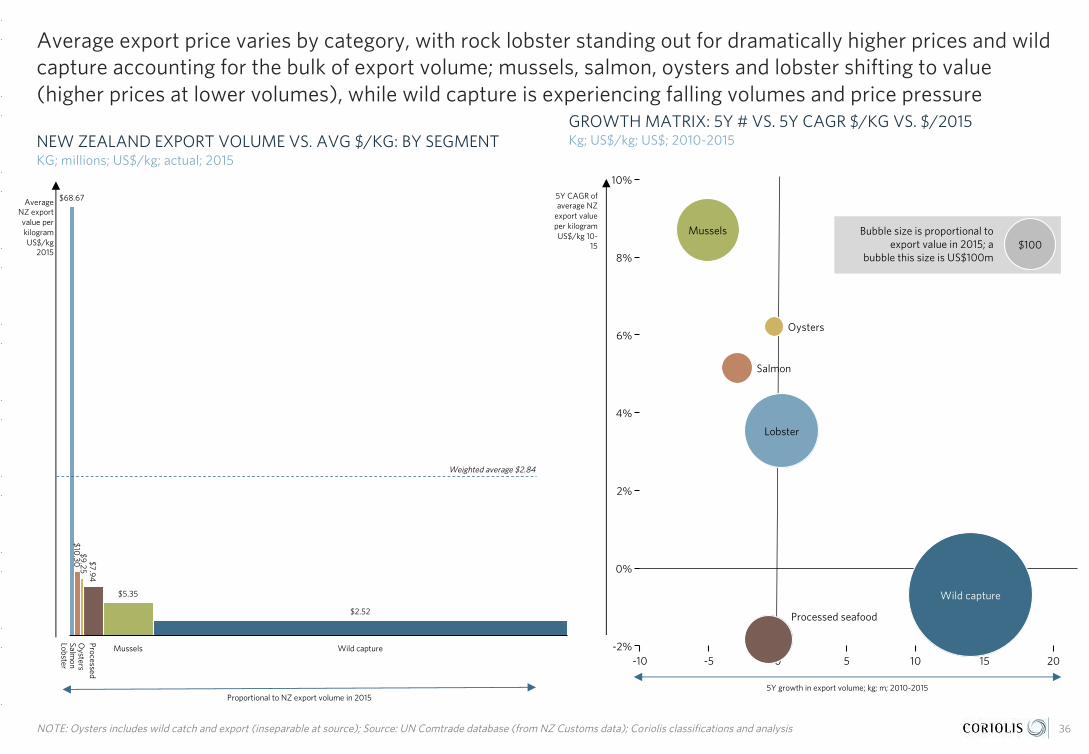
Average export price varies by category, with rock lobster standing out for dramatically higher prices and wild capture accounting for the bulk of export volume; mussels, salmon, oysters and lobster shifting to value (higher prices at lower volumes), while wild capture is experiencing falling volumes and price pressure
36NOTE: Oysters includes wild catch and export (inseparable at source); Source: UN Comtrade database (from NZ Customs data); Coriolis classifications and analysis
NEW ZEALAND EXPORT VOLUME VS. AVG $/KG: BY SEGMENTKG; millions; US$/kg; actual; 2015
GROWTH MATRIX: 5Y # VS. 5Y CAGR $/KG VS. $/2015Kg; US$/kg; US$; 2010-2015
Bubble size is proportional to export value in 2015; a
bubble this size is US$100m
Processed
Lobster
Mussels
Oysters
Wild capture
Salmon
$9.25
$2.52
$7.94
$68.67
$10.30
$5.35
Proportional to NZ export volume in 2015
Average NZ export value per kilogramUS$/kg
2015
Weighted average $2.84
105
6%
4%
10%
8%
2%
2015
0%
-2%-10 -5 0
$100
Lobster
Wild capture
Mussels
Processed seafood
Oysters
Salmon
5Y CAGR of average NZ
export value per kilogramUS$/kg 10-
15
5Y growth in export volume; kg; m; 2010-2015

WILD CAPTURE Thanks to pioneering quota management systems, New Zealand has a long-term, sustainable supply of ~450k tonnes of wild capture seafood available
37Source: US FishStat database; UN Comtrade database; photo credit (CC BY-SA 1.0); Coriolis classifications and analysis
NZ WILD CAPTURE SEAFOOD EXPORTSUS$m; 2005-2015
-
100
200
300
400
500
600
1950
1953
1956
1959
1962
1965
1968
1971
1974
1977
1980
1983
1986
1989
1992
1995
1998
200
1
200
4
200
7
2010
2013
Hoki
Other marine
SquidOther
WILD CAPTURE OF SEAFOOD IN NZ WATERST; 000; 1950-2015
Other Crustaceans
2005 2015
10Y CAGR 10Y ABS
White fish
Squid, etc.
Tuna
Scallops
Live fish
-$87
-$1
+$14
+$1
+$93
+$5$598
$2$1
$505
$574
$412
$15
$32
$20
$126
$2 $39
$1
-11%
-11%
3%
6%
$18
6%
2%

ROCK LOBSTER New Zealand has a long-term, sustainable supply of rock lobster available; export value growing strongly, with almost all volume now going to China/Hong Kong
0
2
4
6
8
10
12
195019521954195619581960196219641966196819701972197419761978198019821984198619881990199219941996199820
00
200
220
04
200
620
08
2010
2012
2014
38Source: US FishStat database; UN Comtrade database; Coriolis classifications and analysis
NEW ZEALAND SPINY RED ROCK LOBSTER CATCH VOLUMET; 000; 1950-2015
GLOBAL CHILLED ROCK LOBSTER EXPORT VALUE BY REGIONUS$m; 2005 vs. 2015
NZ CHILLED/FROZEN LOBSTER EXPORT VALUE BY DESTINATIONUS$m; 2005-2015
EXAMPLE PRODUCTS: KIWI LOBSTER2017
$61
$155
$213
$19
$8
$1
2005 2010 2015
$214
Other
CAGR10%
$163
China/HK$80
OtherEurope
15%
Australia
2005
10Y ABS10Y CAGR
South Africa
New Zealand
2015
Other
+$136
+$338
+$16
$862
$351
+$21$26
$183
$42$76
$521
$212 11%
5%
3%$66 $87
11%
CAGR9%

MUSSELS New Zealand has a strong position in green shelled mussel aquaculture, producing a third of global green supply; export value growing strongly
0
20
40
60
80
100
195019521954195619581960196219641966196819701972197419761978198019821984198619881990199219941996199820
00
200
220
04
200
620
08
2010
2012
2014
39
NEW ZEALAND MUSSEL EXPORT VALUEUS$m; 2005-2015
NZ MUSSEL AQUACULTURE PRODUCTIONTonnes; 1950-2015
NZ SHARE OF GLOBAL MUSSEL EXPORT VALUE BY TYPE% of US$; share of tonnage; 2015
EXAMPLE PRODUCTS: SEALORD2017
Source: US FishStat database; UN Comtrade database; photo credit (courtesy Sealord); Coriolis classifications and analysis
France6%
OtherEurope
15%
2015
10Y CAGR 10Y ABS
2005
Mussels, prepared
Mussels (not-live)
Mussels, live +$1
-$14
$156
$182
$151
$43
$112
$1
$1
-4%
+$40
5%
$29
3%
CAGR2%
Mussels, liveMussels, preparedMussels (not-live)
48.1%
0.7%0.9%
NZ Share of world trade
% of US$; 2015
Proportional to cross-border volume in tonnes in 2015

SALMON New Zealand is the global market leader in King/Chinook Salmon aquaculture, a premium species produced by aquaculture in New Zealand
40Source: UN FishStat database; UN Comtrade database; photo credit (courtesy the great people at Mt Cook Salmon); Coriolis classifications and analysis
NEW ZEALAND SALMON EXPORT VALUEUS$m; 2005 vs. 2015
AGGREGATE GLOBAL SALMON EXPORT GROWTHUS$b; 2005 vs. 2015
AVERAGE EXPORT PRICE: WHOLE CHILLED SALMON: NZ & PEERSUS$/kg; FOB; 2016
EXAMPLE PRODUCTS: MT COOK ALPINE SALMON2017
$3.2
$0.6 $0.7
$1.8
$9.5
$1.6 $1.1
$2.9
Salmon, chilled whole Salmon, smoked Salmon, frozen whole Other salmon
CAGR12%
2005
CAGR11%
2015
CAGR5%
CAGR5%
Salmon, chilled whole
2005
10Y ABS10Y CAGR
Salmon, smoked
Salmon, frozen whole
2015
Other
+$8
+$15
+$2
$44
$19
+$0$3
$11
$4$5
$26
$13 10%
5%11%$0 $1
9%
CAGR9%
$11.10
$8.26
$7.61
$7.35
$7.17
$6.66
$5.84
New Zealand
United Kingdom
Australia
Canada
Norway
Chile
USA

New ZealandGrowth & Innovation
+ Horizons for growth
+ Emerging export stars
+ New viable options
+ Mega-trends driving change
+ Innovation & new products
04

New Zealand firms continue to develop a range of innovative new seafood products
42
THREE HORIZONS OF GROWTH
- Beyond its mature core export products (Horizon 1), New Zealand has both a strong range of emerging export stars (Horizon 2) and continues to innovate and produce new, viable export options (Horizon 3)
HORIZON 2: EMERGING EXPORT STARS
- In Horizon 2, New Zealand is building a range of emerging export products
- Two seafood products emerge as “growth stars” – fish extracts and whole salmon – from an evaluation of ten years of product-level trade growth
- Fish extract exports are growing and the product plays to New Zealand strengths in nutraceuticals
- New Zealand whole chilled salmon exports are growing, with the US market as the key success, having grown from US$2m to US$15m in a decade
HORIZON 3: NEW, VIABLE OPTIONS
- In Horizon 3, New Zealand is creating and nurturing a wide range of viable options for future export success
- Four broad global consumer mega-trends are driving growth and new product development in the food & beverage industry
- New Zealand seafood products succeeding on-shelf in export markets are aligned with these trends
- These trends drive new product development, through (1) packaging, (2) product, (3) category and (4) channel innovation; success, however, often comes down to implementation and execution
- New Zealand seafood firms are delivering on…
- Packaging-driven innovation
- Product-driven innovation
- Category and channel innovation
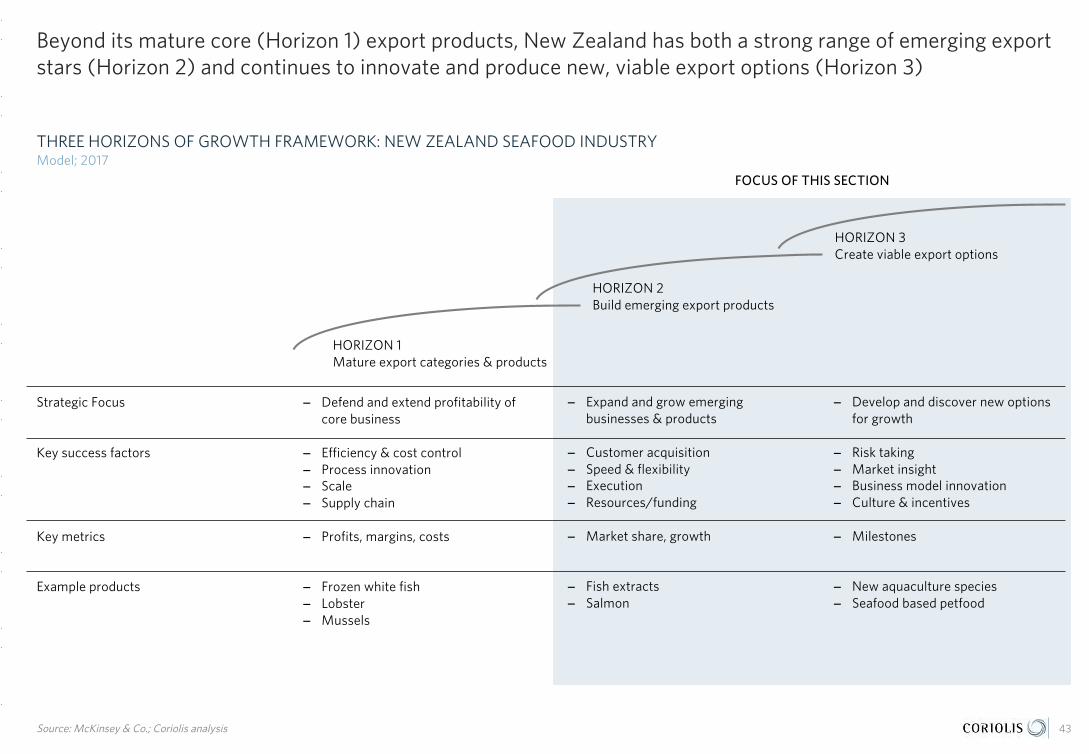
Beyond its mature core (Horizon 1) export products, New Zealand has both a strong range of emerging export stars (Horizon 2) and continues to innovate and produce new, viable export options (Horizon 3)
Source: McKinsey & Co.; Coriolis analysis
THREE HORIZONS OF GROWTH FRAMEWORK: NEW ZEALAND SEAFOOD INDUSTRYModel; 2017
43
HORIZON 1Mature export categories & products
HORIZON 2Build emerging export products
HORIZON 3Create viable export options
Strategic Focus
Key success factors
Key metrics
Example products
FOCUS OF THIS SECTION
− Defend and extend profitability of core business
− Efficiency & cost control− Process innovation− Scale− Supply chain
− Profits, margins, costs
− Frozen white fish− Lobster− Mussels
− Expand and grow emerging businesses & products
− Customer acquisition− Speed & flexibility− Execution− Resources/funding
− Market share, growth
− Fish extracts− Salmon
− Develop and discover new options for growth
− Risk taking− Market insight− Business model innovation− Culture & incentives
− Milestones
− New aquaculture species − Seafood based petfood

In Horizon 2, New Zealand is building a range of emerging export products
Source: McKinsey & Co.; Coriolis analysis
THREE HORIZONS OF GROWTH FRAMEWORK: NEW ZEALAND SEAFOOD INDUSTRYModel; 2017
44
Strategic Focus
Key success factors
Key metrics
Example products
HORIZON 1Mature export categories & products
HORIZON 2Build emerging export products
HORIZON 3Create viable export options
− Defend and extend profitability of core business
− Efficiency & cost control− Process innovation− Scale− Supply chain
− Profits, margins, costs
− Frozen white fish− Lobster− Mussels
− Expand and grow emerging businesses & products
− Customer acquisition− Speed & flexibility− Execution− Resources/funding
− Market share, growth
− Fish extracts− Salmon
− Develop and discover new options for growth
− Risk taking− Market insight− Business model innovation− Culture & incentives
− Milestones
− New aquaculture species − Seafood based petfood

Bubble size is proportional to export
value in 2015; a bubble this size is
US$100m
Two seafood products emerge as “growth stars” – fish extracts and whole salmon – from an evaluation of ten years of product-level trade growth
Note: Data on this page is product level trade codes, not segment level aggregates as presented earlier; Source: UN Comtrade database (from NZ Customs data); Coriolis classifications and analysis
NZ SEAFOOD EXPORT GROWTH STAR MATRIX: 10Y VALUE GROWTH VS. 10Y CAGR $ VS. VALUE IN 2015US$; CAGR on US$; 2005-2015
45
140
15%
-15%
-25 0 50 100
20%
10%
-10%
5%
-5%
0%
Frozen fish meat
Salmon, chilled whole
Prawns, frozen
Skipjack tuna, frozen whole
Oysters
Chilled fish, nes.
Squid (non-chilled)
Mussels (not-live)
Other prep fish
Mussels, prepared
Frozen fish livers and roes
Frozen fish fillets
Mackerel, frozen
$100
Longfin tuna, frozen whole
Frozen fish, nes
Salmon, frozen whole
Rock Lobster, freshChilled fish fillets
Fish extracts
Hake, frozen
10y ABS growth in export value; US$; b; 2005-2015
10y CAGRgrowth in
export value;
US$; 2005-
2015

Fish extract exports are growing and the product plays to New Zealand strengths in nutraceuticals
46Source: UN Comtrade database (from NZ Customs data); photo credit (courtesy Seadragon); Coriolis classifications and analysis
FISH EXTRACT EXPORT VALUE BY MARKETUS$; m; 2005-2015
EXAMPLE: RECENT INVESTMENT IN NEW ZEALAND2016
201520142008 200920072005 2006 2012 20132011
South Korea
2010
Europe
Other
North America
Other E/SE Asia
$7
$1 $6$7
$19
$5$1
$2
$5
$3
$5$1 $6
$2 $7
$33
$0
$43
$0
$0
$0
$32
$0
$4
$26
$11
$21
$7
$5
$34
$20
$14
$1
$0
$1
$1
$2
$1
$2
$1
$2$1
$1$1 $2
$1
$1
$1
$2
$9
$3
$2
$1
$3
$4
$6
$3$1
$1
$1
$2
$1$3
$4
$1
$5
CAGR16%
- Invested $10.8m in new fish oil processing facility, Nelson, New Zealand
- Fully commissioned August 2016- Capacity to refine up to 5,000t of Omega-3 fish oil- Oil sourced from sustainable and traceable Marine Stewardship
Council certified species

New Zealand whole chilled salmon exports are growing, with the US market as the key success, having grown from US$2m to US$15m in a decade
47Source: UN Comtrade database (from NZ Customs data); Coriolis classifications and analysis
CHILLED WHOLE SALMON EXPORT VALUE BY MARKETUS$; m; 2005-2015
EXAMPLE: RECENT NZ FIRM ACTIVITIES IN THE US MARKETSelect activities; 2016
201520142008 200920072005 2006 2012 20132011
Japan
2010
North America
Australia
Other
Other E/SE Asia
$11.0$2.1
$14.7
$17.2
$0.5
$16.9
$4.3
$7.4
$5.3
$6.6
$5.1
$4.5
$3.3
$6.0
$3.6$21.3
$0.4
$26.1
$0.4$0.4
$0.5
$26.9
$0.4
$0.6
$0.5
$27.7
$0.4
$17.5
$0.4
$19.7
$0.4
$23.6$2.9
$12.0$2.6
$7.2
$2.2
$5.1
$1.8
$4.3
$6.1
$4.8
$0.5
$0.5
$0.7
$8.0
$0.7
$5.8
$0.5
$10.1
$4.7
$9.0
$5.2
$6.7$6.4
$6.3
$5.9
$5.8
$3.1
$4.1
$2.5
$5.7
$5.2
$15.2
$3.2$4
.8
CAGR9%
- “Seafood Watch” the globally respected consumer seafood guide on sustainable seafood gives New Zealand Chinook salmon a “Best Choice” 2016
- Ora launched in USA in 2012
- Ora raised specifically for the restaurant trade, targeting high value and highly discerning customers

In Horizon 3, New Zealand is creating and nurturing a wide range of viable options for future export success
Source: McKinsey & Co.; Coriolis analysis
THREE HORIZONS OF GROWTH FRAMEWORK: NEW ZEALAND SEAFOOD INDUSTRYModel; 2017
48
Strategic Focus
Key success factors
Key metrics
Example products
HORIZON 1Mature export categories & products
HORIZON 2Build emerging export products
HORIZON 3Create viable export options
− Defend and extend profitability of core business
− Efficiency & cost control− Process innovation− Scale− Supply chain
− Profits, margins, costs
− Frozen white fish− Lobster− Mussels
− Expand and grow emerging businesses & products
− Customer acquisition− Speed & flexibility− Execution− Resources/funding
− Market share, growth
− Fish extracts− Salmon
− Develop and discover new options for growth
− Risk taking− Market insight− Business model innovation− Culture & incentives
− Milestones
− New aquaculture species − Seafood based petfood

Four broad global consumer mega-trends are driving growth and new product development in the food & beverage industry
Source: Boston Consulting Group; Datamonitor; Coriolis research and analysis; Photo credit: Image(s) used under license from Shutterstock.com 49
HEALTH & WELLNESS AUTHENTIC & RESPONSIBLE EASY & CONVENIENT SENSORY & INDULGENT
− Mid-high income countries experiencing an aging population
− Spread of Western lifestyle and Western diseases of affluence (e.g. obesity)
− Ongoing waves of media hype around fad diets and new "superfoods"
− Food presented and viewed as both the problem and the solution
− Dramatic global shift to city living; 1800=3%, 1900=14%, 2015=50%; developed nations 75%+; 400 cities 1m+
− Loss of attachment to the land and food production
− Ongoing "rights revolution" now spreading to animals
− Ongoing waves of food scares around contamination, additives
− Dramatic increase in female participation on the workforce globally
− Consumers working longer hours to maintain relative income
− Work hours no longer just "9 to 5"; food needs at all times (e.g. night shift)
− Growing income polarisation into “haves and have-nots”
− Strongly emerging trend to premium (and discount) at the expense of the mid-market
− Emerging middle class across developing world driving consumption growth
− Incredible power of food and beverages in many social settings
− May be addressing specific conditions (e.g. weight management; cholesterol)
− May target a specific family member (e.g. omega 3 for joint pain in grandparents)
− May reflect wider "healthy living" worldview
− May target specific foods perceived as high risk, unethical or visible (e.g. unsustainable fish species)
− May target a specific family member (e.g. mercury levels for children)
− May represent a need for an immediate solution (e.g. thirst, hunger)
− May represent an easy solution to a future challenge (e.g. prepared seafood canapes for easy entertaining)
− May range from "everyday luxury" to an occasional "treat"
− May be used to demonstrate social status, taste or style (e.g. fresh lobster for Chinese banquets)
I am concerned about my health and am trying to live a healthy lifestyle
I am mindful of where my food comes from and how it is produced
I am trying to achieve work-life balance and need quick-and-easy meal solutions
I like to indulge in rich and sumptuous living beyond the bare necessities
FOUR CONSUMER FOOD & BEVERAGE MEGA-TRENDS

Natural mussels
New Zealand seafood products succeeding on-shelf in export markets are aligned with these trends
Source: various online websites; Coriolis research and analysis 50
Trusted brand
NZ mussels
Cooked, shelled, ready-to-eat
Secret marinade
Ready-to-eat
Omega 3
Manuka smoked
Salmon slices
Ready-to-eat
Premium New Zealand
NZ king salmon
NZ King Salmon
Kosher Kiwi
Ready-to-eat
Manuka smoked
Australia Singapore Singapore
H&W
A&R
A&R
E&C
E&C
S&I
H&W
A&R
E&C
E&C
S&I
A&R
E&C
H&W
H&W
H&W
Sustainable certificationsA&R
“Artisan range”S&I
Image of manuka honeyH&W

These trends drive new product development, through (1) packaging, (2) product, (3) category and (4) channel innovation; success, however, often comes down to implementation and execution
Source: Coriolis analysis
CONSUMER FACING INNOVATION IN THE FOOD & BEVERAGE INDUSTRY FROM TREND TO EXECUTIONSimplified model; 2017
51
CONSUMER FOOD & BEVERAGE MEGA-TRENDS
1. PACKAGING INNOVATION
NEW PRODUCT DEVELOPMENT
2. PRODUCT INNOVATION 3. CATEGORY INNOVATION 4. CHANNEL INNOVATION
Usage (e.g. ready-to-eat)
Shelf-life (e.g. foil pouch)
Convenience (e.g. multi-pack)
Appearance (e.g. foil pack)
Cost (e.g. plastic vs. glass)
Flavour
Formulation/recipe
New/different ingredients
Source/origin
Production system
Manufacturing process
Line extension
Creation of new category
New temperature state
New processes
Foodservice offer
Non-foods retail offer
Vending
Internet/Home delivery
Own retail stores
IMPLEMENTATION & EXECUTION
HEALTH & WELLNESS AUTHENTIC & RESPONSIBLE EASY & CONVENIENT SENSORY & INDULGENT

New Zealand seafood firms are delivering on packaging-driven innovation
Source: Mt Cook Alpine Salmon, Sanford, Sealord; Coriolis analysis
SELECT EXAMPLES OF PACKAGING INNOVATION: NEW ZEALAND SEAFOOD FIRMS2017
52
COMMENTARY INSIGHTS
- Sealord’s recycled pouch packaging developed Aug, 16
- Driven by consumer demand and feedback
- TerraCycle recycles the plastic - Collectors awarded or able to donate
funds to their local charity
INSIGHTS
- Sanford’s black range (e.g. scampi and snapper)
- High value, value-added, premium range for foodservice, B2B and B2C
- Increased contribution to overall revenue and profit
INSIGHTS
1. PACKAGING INNOVATION
- Traceability – Each Mt Cook Alpine Salmon has a unique code
- The code details what farm it was caught from and when
- Documentation allows full traceability back to the batch of hatchery eggs and their parentage
- Packaging technology focuses on increasing shelf-life and ensuring food safety maintained
- Opportunities to use packaging for messaging the NZ provenance storyand sustainability story
- Focus of many leading NZ companies to transition to ”fresh” as a means of adding value
- Wild capture quotas result in low volume growth; increasingly important for seafood companies to add value to existing catch, innovative packaging allows this

New Zealand seafood firms are delivering on product-driven innovation
Source: Photo credit: Sanford
SELECT EXAMPLES OF PRODUCT INNOVATION: NEW ZEALAND SEAFOOD FIRMS2017
53
- Smoked on-trend - “Holy Smoke”, “The Smokehouse”, “Sealord” with ready to eat smoked salmon, smoked white fish and smoked shellfish ranges
- Products in line with convenience trends, and health and wellness
- Cawthron Institute, New Zealand’s preeminent seafood research centre assisting Smokehouse with packaging and shelf-life technology
INSIGHTS
- Sealord’s range of Gluten-free crumbed hoki fillets and crumbed hoki bites
- In-line with growth of gluten-free options
- In-line with sustainable, ethical harvesting
INSIGHTS
- Sanford’s “Big Glory Bay” brand is a high value, high margin, premium brand covering salmon, mussels and oyster categories
- Brand aims to achieve a 40% premium over commodity seafood products
- Brand messaging around provenance and story telling – from the pristine waters of NZ
INSIGHTS
2. PRODUCTINNOVATION
COMMENTARY
- Large brands are innovating in the drive to increase value added product lines
- Innovative products target a gap in the market (e.g. premium seafood, need for convenient snacking, gluten-free options)
- Innovative products target demand for sustainable, premium, authentic products
- Innovation is supported in New Zealand by government supported programs (e.g. MPI’s Primary Growth Partnership) and by research centres (e.g. Cawthron Institute)
- Innovation often enabled by availability of new technology or science
- Emergence of new packaging forms, materials and technologies (e.g. aseptic pouch) is ongoing globally

New Zealand seafood firms are delivering on category and channel innovation
Source: Coriolis
SELECT EXAMPLES OF CATEGORY & CHANNEL INNOVATION: NEW ZEALAND SEAFOOD FIRMS2017
54
Live Freshwater Crayfish Tiaki Caught Seafood
Seafood maximising the “whole fish” Embracing global sustainability standards
- Live freshwater crayfish “Keewai” sustainably harvested in 1,800 ponds in the remote forests of the South Island, NZ
- Low impact aquaculture
- Promoting the clean-green messaging; nothing artificial in the water
- Trials started in 2013
- Winner of the NZ Food Awards 2016 Bite Gourmet category
- www.keewai.co.nz
3&4. CATEGORY & CHANNEL INNOVATION
- Ethical decision-making is becoming more and more important in premium markets; demand from retailers and consumers
- NZ industry is embracing sustainable certifications such as Marine Stewardship Council (six fisheries over 50% of all NZ seafood, starting with Hoki in 2001 and Orange Roughy most recently in 2016)
- NZ firms are also embracing responsible aquaculture and sustainable sourcing with “Best Aquaculture Practices Certification”; covers 18 sites in NZ (e.g. Mt Cook Alpine Salmon, Sanford, Sealord, NZ King Salmon)
- Method of net fishing replacing trawling, utilising Precision Seafood Harvesting (PSH) technology
- “Tiaki caught” seafood allows some fish to be landed on boats alive and allows some undersized fish to be released
- Focus on sustainably harvesting premium fish adds significant value to catch; fresh fish achieve higher premium
- A Primary Growth Partnership (PGP) between MPI, Sealord, Sanford and Moana Fisheries; programme worth $48m over 6 years
- Winner of NZ Hi-tech Awards 2016
- www.tiaki.com
- Seafood companies move toward utilising the whole fish; see a drive to new and innovative products and categories
- Shellfish used as nutraceuticals key ingredient (e.g. Sanford greenshell mussel powder for joint support, United Fisheries Nutri Zing supplements)
- Skins and mince used as key ingredient in petfoods (e.g. ZiwiPeak Mackerel and Lamb)
- NZKS launch Omega Plus pet food utilising salmon-based omega-3
- www.omegaplus.co.nz

New Zealand beverage firms are supported with access to advice, research facilities and pilot plants across five locations
Source: www.foodinnovationnetwork.co.nz; Coriolis 55
NZFIN
LOCATION FOCUS CAPABILITIES
Processed/FMCG foods Space/equipment for hireExport registrations ~1000 kg/shift
- Extrusion & Milling/Blending- Liquids/Beverage - High pressure processing- Freeze drying- General processing- Multiple packaging styles- Product development kitchen
Dairy & Infant Formula~500 kg/hourVegetable
- Spray dryer- Evaporator- Other dairy equipment- Packing- Powder (vegetable)
All Food and Beverage Specialist expertise- business development - direct to other facilities
DairyFruit & vegetablesAll Food and Beverage
- Same equipment as Manukau (1/5th scale)- Same equipment as Waikato (1/20th scale) - Post harvest technologies- Meat and small goods pilot plant- Located at Massey University
Processed/FMCG FoodsSpace/equipment for hireExport registrations 20-200L batch size
- Mixing /Blending/Emulsifying- Extrusion- Freezing/Cooking/Baking- General Processing- Product Development Kitchen- Technical and Business development
expertise

New ZealandSeafood Firms
+ Enterprises
+ Employment
+ Turnover
+ Ownership
+ Foreign investors
+ Acquisitions
+ Investments
+ Firm Profiles 05
New Zealand has a strong and growing seafood industry that continues to attract investment
57
OVERVIEW
- The number of firms in New Zealand’s seafood industry has stabilised over the last six years
- New Zealand now has a large and robust seafood industry with a range of participants of various sizes
KEY METRICS
- At the enterprise level, employment in the New Zealand seafood industry is relatively flat
- The seafood industry is spread across the country, however Nelson is the dominant region
- Industry employment is declining as the industry seeks productivity in the face of flat catch
- The three largest seafood companies account for almost 45% of the industry employment
FIRM PERFORMANCE
- Sanford, Sealord and Talley’s are clear New Zealand market leaders by turnover; however there is a strong tier two group
- New Zealand seafood industry has a range of owners; important industry for New Zealand iwi
INVESTMENT
- The New Zealand seafood industry has attracted international investment primarily from Asian countries
- New partial acquisitions in seafood are seeking to consolidate the industry and secure supply
- Existing and new firms are investing in the New Zealand seafood industry with new plant and equipment
- Three key drivers support the ongoing investments in the New Zealand seafood industry
- New Zealand seafood firms are also investing in new and improved marketing emphasising “premium” and sustainable themes
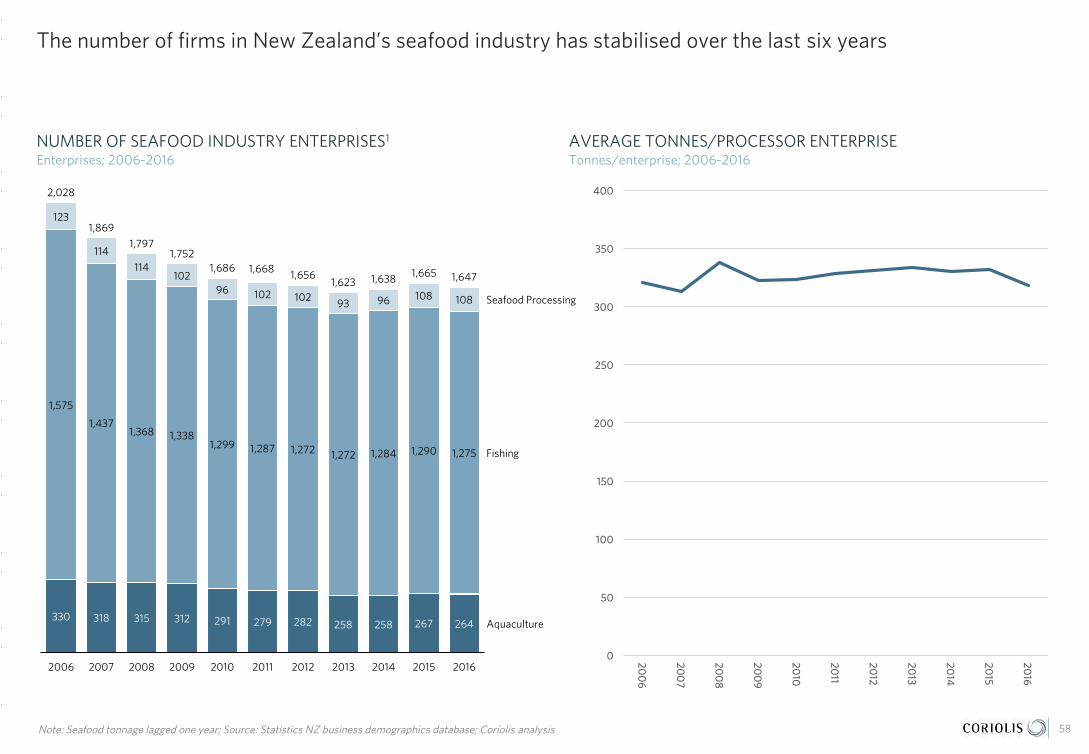
The number of firms in New Zealand’s seafood industry has stabilised over the last six years
0
50
100
150
200
250
300
350
400
200
6
200
7
200
8
200
9
2010
2011
2012
2013
2014
2015
2016
58
NUMBER OF SEAFOOD INDUSTRY ENTERPRISES1
Enterprises; 2006-2016AVERAGE TONNES/PROCESSOR ENTERPRISETonnes/enterprise; 2006-2016
Note: Seafood tonnage lagged one year; Source: Statistics NZ business demographics database; Coriolis analysis
20132012 2014 20162015201120072006 2008 20102009
Fishing
Seafood Processing
Aquaculture258
1,686 1,668 1,656
258
1,797
1,869
264267
1,752
1,647
312315330 318
1,6651,623
282279291
1,63896
1,2841,2721,272
102
102
114
123
1,2751,290
114
102 108
1,3681,437
1,575
2,028
10893
1,2871,2991,338
96

New Zealand has a large and robust seafood industry with a range of participants of various sizes
59
LARGE WILD CAPTURE SEAFOOD MEDIUM/SMALLER WILD CAPTURE SEAFOOD
DEFINED SEAFOOD
LARGE AQUACULTURE
MEDIUM/SMALL AQUACULTURE
SEAFOOD MARKETER/EXPORTERS
WFWESTFLEET SEAFOODS
EST 1979

At the enterprise level, employment in the New Zealand seafood industry is relatively flat
60
TOTAL EMPLOYMENT BY SEAFOOD INDUSTRY ENTERPRISES1
Headcount; 2006-2016AVERAGE EMPLOYEES/PROCESSOR Head/unit; 2006-2016
Note: 2016 data latest available as of April 2017; 1. Defined as A020 Aquaculture, A041 Fishing and C112 Seafood processing; classification is based on what 51% of the firm does; Source: Statistics NZ business demographics database; Coriolis analysis
20132012 2014 20162015201120072006 2008 20102009
Fishing
Aquaculture
Seafood Processing
5,900
8,1307,970
8,180
7,00
0
8,000
8,600
6,500
6,300
8,2708,590
7,00
0
6,80
0
7,40
0 7,40
0
8,2008,060
7,100
6,900
6,900
8,030
420
1,750
730
750
370
430
430
510
1,650
1,500
430
330
44
0
770
770
1,100
9,010
40
0
330
700
810
84
0
380
Seafood Processing
FishingAquaculture
Reclassification of employees within
industry
0
10
20
30
40
50
60
70
80
2006 2007 2008 2009 2010 2011 2012 2013 2014 2015 2016

The seafood industry is spread across the country, however Nelson is the dominant region; industry employment is declining as the industry seeks productivity in the face of flat catch
61
Note: data is geographic units (does not match enterprise units page prior); 2016 data latest available as of April 2017; 1. Defined as A020 Aquaculture, A041 Fishing and C112 Seafood processing; * includes Area Outside of Region; Source: Statistics NZ business demographics database; Coriolis analysis
SEAFOOD INDUSTRY1 EMPLOYMENT BY REGIONHeadcount; at defined geographic units; 2016
10Y CHANGE IN SEAFOOD INDUSTRY EMPLOYMENT BY REGIONHeadcount; at defined geographic units; 2006-2016
South IslandNorth Island
2,191
Auckland735
Waikato500
4,841
Bay of Plenty515
Marlborough835
Southland470
Northland170
Canterbury960
Tasman705
Other NI271
Nelson1,460
Other SI*411
Waikato Region
Other SI
10Y ABS
2006
10Y CAGR
Northland Region
Auckland Region
Other
Canterbury Region
Bay of Plenty Region
Other NI
Tasman Region
Marlborough Region
2016
Southland Region
Nelson Region
+35
0%
-44
-135
-200
+65
+35
+2
+46
9,140
7,714
+105
-745
-20
-570
1%
7052,205
271
670
835
1,530
1,460
730
315
670
735
370
170
650
515
465
500
-1%
1%
1%
-2%
-5%
0%
-4%
1%
1%
470
365
960
490
682
-7%
411
680
CAGR-2%
CAUTION: DATA HERE IS GEOGRAPHIC UNIT EMPLOYMENT NOT ENTERPRISE UNIT
EMPLOYMENT; THESE VARY IN SEAFOOD

The three largest seafood companies account for almost 45% of the industry employment
62Source: SNZ business demographics (detailed industry for enterprise units); various firm websites; published articles; interviews; various other sources; Coriolis analysis
NUMBER OF PEOPLE EMPLOYED: NZ SEAFOOD INDUSTRY BY SELECT FIRM People; 2016
− Kono NZ is an estimate (from total employees across the whole business)
− Talley’s is an estimate (from total employees across the whole business), does not include seasonal workers
COMMENTS/NOTES
TOTAL = 8,590
INCLUDES CORIOLIS ESTIMATES
Other 2,438 28%
Sanford 1,548 , 18%
Sealord 1,100 , 13%
Talley's 1,000 12%
NZ King Salmon450 5%
Moana New Zealand 400 5%North Island Mussels 300 3%
Hawkes Bay Seafood 280 3%
Kono NZ 250 3%
Mount Cook Alpine Salmon 175 2%
United Fisheries 164 2%
Ngai Tahu Seafood 125 1%
Westfleet 100 1%
Independent Fisheries 100 1%
Cloudy Bay Group 100 1%
Fiordland Lobster Co 60 1%

Sanford, Sealord and Talley’s are clear New Zealand market leaders by turnover; however there is a strong tier two group
* Estimate of seafood operations only, see Talley’s profile for more detail; Source: various company annual reports; NZCO; Coriolis estimates and analysis
ANNUAL TURNOVER BY TOP 10 FIRMS: NEW ZEALAND SEAFOOD INDUSTRYNZ$; m; FY2016
63
Actual from AR
FY16 estimate from available data
INCLUDES CORIOLIS ESTIMATES
$463
$454
$450
$170
$155
$114
$85
$80
$75
$55
Sanford
Sealord
Talley's
Moana NZ
Fiordland Lobster Co
NZ King Salmon
Ngai Tahu Seafood
Independent Fisheries
United Fisheries
Kono NZ
*

Iwi 23%
Foreign 12%
Public 21%
Private 44%
New Zealand seafood industry has a range of owners; important industry for New Zealand iwi
Source: New Zealand Companies Office; various annual reports; Coriolis estimates and analysis
ESTIMATED SHARE OF TOTAL INDUSTRY TURNOVER BY OWNERSHIP% of turnover/sales; 2016
64
Partially foreign owned (pro-rata)
INCLUDES ESTIMATESPRO-RATA TO OWNERSHIP
WFWESTFLEET SEAFOODS
EST 1979
WFWESTFLEET SEAFOODS
EST 1979
WFWESTFLEET SEAFOODS
EST 1979

The New Zealand seafood industry has attracted international investment primarily from Asian countries
Source: Coriolis from a wide range of published articles, annual reports and other sources 65
Large Japanese trading company (F&B)
Invested in CedencoAquaculture
Leading NZ seafood company
Malaysian-based Tiong Group NZ leading Salmon company
Japan’s largest seafood company
Large Japanese trading company (F&B)
Leading NZ seafood company

New partial acquisitions in seafood are seeking to consolidate the industry and secure supply
Source: Coriolis from a wide range of published articles, annual reports and other sources 66
- Japanese company acquired a 4.7% stake in Sanford (sharesbought from Avalon Investment Trust, (a Goodfellow vehicle reducing their share from 14% to 9.2%); Mar ‘16
- Cedenco Foods (Imanaka, Japan) acquires 50% share of North Island Mussels (processing and farming interests) from Sealord; JV with Sanford “North Island Mussel Processors” in Tauranga; Oct ’15
- Mt Cook Alpine Salmon acquires 100% of Aoraki Smokehouse Salmon, both freshwater canal seafood companies; Aorakispecialises in smoked salmon for the domestic market; consolidating the canal production gaining scale to meet international demand; Sept 16
N/A
$25m
N/A

Existing and new firms are investing in the New Zealand seafood industry, with new plant and equipment
$76
$28
$20
$6
$-
67Note: KAHC lease plant to Fiordland Lobster Co, see Firm Profile page; Source: Coriolis from a wide range of published articles, annual reports and other sources; image courtesy NZ King Salmon
SELECT SEAFOOD INVESTMENT IN PLANT AND EQUIPMENTIdentified; announced; NZ$m; 2015-2017
TOTAL $130
NZKS
NZ King Salmon – New farm in Pelorus Sound
NZ King Salmon – Cuddon’s designed new barge

Three key drivers support the ongoing investments in the New Zealand seafood industry
68Source: Coriolis from a wide range of published articles, annual reports and other sources; image courtesy Sealord
INCREASING PROCESSING SCALE & EFFICIENCYINVESTMENT IN VESSELS; INCREASING EFFICIENCIES
ngaitahu N/A - New purpose built seafood facility over 1,650 m2 in Bluff for live fish, crustaceans, shellfish, chilled and frozen (28 staff, oyster openers; 30 fishers); Apr ‘16
$18m - Investment in three new salmon farms
$6m - New lobster processing factory in East Tamaki, leased by Fiordland Lobster Company; Apr ‘16
N/A - Replacement seafood processing facility on the Chatham Islands, commissioned Nov ‘15
$70m - Investing $70m in new 82.9m vessel; announced Aug 2016; for delivery 2018
$6m - Invested in fishing vessel refit; Dec 16
$28m - Invested in new fishing vessels, 2016
$2m - Invested in new barge for feed storage and accommodation in Marlborough; Aug ’17
$24m - Primary Growth Partnership joint investment in “Precision Seafood Harvesting”
- 6 year project commenced 2012- New wild fish harvesting technology that
results in more precise catches, species and size
- Tiaki brand launched 2016
$24m
INVESTMENT IN SUSTAINABLE HARVESTING Sealord’s new $70m vessel (via CGI)

New Zealand seafood firms are also investing in new and improved marketing emphasising “premium” and sustainable themes
Source: Coriolis from a wide range of published articles, annual reports and other sources; photo source: NZ King Salmon, Moana, Kono 69
Rebranding
Premium Brand
Ora King is NZ King Salmon’s premium brand; targeting ‘discerning chefs’
This message is reinforced through unique looking, premium packaging
Website video emphases pristine environment and exclusivity of breed
AFL renamed Moana NZ; signals move from ‘fisheries and processing’ to premium seafood and direct connections with consumers
This message is reinforced through rebranded, more premium packaging
Website video reinforces story of “true connection, true provenance, true to nature and true for generations”
New Zealand Seafood Firm Profiles
05

71* Estimate; Source: various companies annual financial statements (NZ Companies Office or company website); various press releases and news articles; Coriolis analysis
CLOUDY BAY GROUP
Isaac PiperManaging Director
DESCRIPTION: Seafood processor and exporter; Cloudy Bay Clams; wild surf clams in Clifford Bay; three harvesting areas; export to Australia, Hong Kong, China, Singapore, USA; Cloudy Bay Seafood; farmed mussels in Marlborough, processing factory in Nelson
KEY PRODUCTS: Diamond shell, tua tua, storm clam, moon shell clams, mussels; blanched chilled or frozen, live chilled
OWNERSHIP: NZ; Private (Piper)
COMPANY NUMBER: 3955443
ADDRESS: 24 Henry Street,Blenheim
PHONE: +64 3 578 4487
WEBSITE: www.cloudybayclams.co.nz
YEAR FORMED: 1990
STAFF EMPLOYED: 100
REVENUE: $15-20m*
COMPANY HIGHLIGHTS: Achieved Friend of the Sea sustainability status in ’13; featured on Masterchef NZ in ‘15; launched two new products, IQF pre-coated Popcorn Clam and frozen 1kg Diamond Shell clam meat in ’16; R&D projects with Auckland University of Technology to research sustainability and opportunities for industry in ‘16
FIORDLAND LOBSTER CO
Alan BucknerChief Executive Officer
DESCRIPTION: NZ’s largest exporter of live lobster; operations in Fiordland, Te Anau, Riverton, Jackson Bay, Christchurch; South Australian Lobster Co, SA, TAS, VIC; 800t from NZ, 500t from AU via 5 export packing facilities; agreement with Ngati Kahungunu(KAHC) to access quota
KEY PRODUCTS: Live lobster
OWNERSHIP: NZ; Private (Hutchins, Wilson 18%, Rowe, Burkhart 16%, Iwi, others)
COMPANY NUMBER: 407182
ADDRESS: 17 Caswell Rd, Te Anau
PHONE: +64 3 249 0023
WEBSITE: www.lobster.co.nz
YEAR FORMED: 1989
STAFF EMPLOYED: 45 (15-20 casual)
REVENUE: $155m (FY16)
COMPANY HIGHLIGHTS: Invested $7-8m in Australia ‘15; South Australia Lobster Company (SA, Tas & Vic) formed to increase supplies; 90% of exports to China; currently 35% of NZ’s live lobster exports; leased new $6m lobster processing plant owned by Kahungunu Asset Holding Co (4th largest shareholder in Fiordland Lobster Co, who lease quota) ’16, largest in Australasia
HAWKES BAY SEAFOODS
Nino D’EspositoManaging Director
DESCRIPTION: Vertically integrated seafood company in Hawkes Bay; fish, seafood, shellfish; domestic and export markets; 16 vessels; long term lease agreement with Ngati Kahungunu (KAHC)
KEY PRODUCTS: Seafood
OWNERSHIP: NZ; Private (D’Esposito)
COMPANY NUMBER: 861866
ADDRESS: Cnr Pandora and West Quay, Ahuriri, Napier
PHONE: +64 6 835 5533
WEBSITE: www.hawkesbayseafoods.co.nz
YEAR FORMED: 1998
STAFF EMPLOYED: 280
REVENUE: $40-50m (FY16)
COMPANY HIGHLIGHTS: New $3m cool store and office development in ‘14
INDEPENDENT FISHERIES
Mark AllisonDirector and General Manager
DESCRIPTION: Deep sea fishing company, 3 vessels, off-shore processing, supplier of whole & dressed fish and squid; 79,000t of annual catch entitlement
KEY PRODUCTS: Whole and dressed fish; hoki, southern blue whiting, mackerel, barracuda, arrow squid
OWNERSHIP: NZ; Private (Shadbolt 60%, others)
COMPANY NUMBER: 125989
ADDRESS: 64 Broad Street, Woolston,Christchurch
PHONE: +64 3 384 2344
WEBSITE: www.indfish.co.nz
YEAR FORMED: 1959
STAFF EMPLOYED: 100
REVENUE: $80m (‘16)
COMPANY HIGHLIGHTS:

72* Estimate; Source: various companies annual financial statements (NZ Companies Office or company website); various press releases and news articles; Coriolis analysis
KONO NZ LP
Rachel TauleleiChief Executive Officer
DESCRIPTION: Kono NZ is the food and beverage business of Wakatu Inc; over 530ha of land and sea; seafood based in Blenheim, producers of wine brands under the Tohu and Aronui brands, horticulture based in Motueka, food distribution; exports to 30 countries
KEY PRODUCTS: Mussels, oysters, lobster, wine, apples, kiwifruit, pears, hops, honey, cider (Tutu), Annies fruit bars
OWNERSHIP: NZ; Private (Wakatu Incorporation, 4,000 shareholders)
COMPANY NUMBER: 3438072
ADDRESS: Wakatū House, Montgomery Square, Nelson
PHONE: +64 3 546 8648
WEBSITE: www.wakatu.org.nz; www.kono.co.nz
YEAR FORMED: 1977/2011
STAFF EMPLOYED: 450
REVENUE: $70-90m (FY16)
COMPANY HIGHLIGHTS: Acquired Annies (fruit bars) in ‘14; established trading entity in Shanghai in ‘15, 4 staff; acquired Yellow Brick Road food distribution company in ‘15; Tutu cider released in ‘15; expanded wine production onsite in ’15; acquires remaining shares of Pure NZ Greenshell Co., Shanghai
LEIGH FISHERIES/LEE FISH GROUP
Gregory BishopChief Executive Officer
DESCRIPTION: Vertically integrated seafood company, NZ and SEA; long line inshore, mid water, migratory species; 70t lobster, 12t packhorse lobster; contract fishers; 40 fishing vessels; factory in Leigh; export 2,500t of chilled product globally; associate companies in USA, EU
KEY PRODUCTS: Snapper, bluenose, groper, by-catch species, live lobster, packhorse lobster, bigeye, bluefin, swordfish.
OWNERSHIP: NZ; Private (Cunningham, NgatiWhatua Moana Holdings, others);
COMPANY NUMBER: 56407
ADDRESS: 10 Pakari Road, Leigh
PHONE: +64 9 422 6424
WEBSITE: www.leefish.com; www.chathamislandfood.com
YEAR FORMED: 1958
STAFF EMPLOYED: 28
REVENUE: $45-50m (FY16) Group
COMPANY HIGHLIGHTS: Lee USA turnover is ~US$30m; Lee Europe turnover is ~CH18m; set up Chatham Food Co., processing and exporting finfish caught around island; labelling is GS1 barcoded with Ftrace, giving how, where and by whom the fish is caught; finalist Auckland Export Award ‘16; Brussels, Boston Seafood Shows in ’16; also owns 50% of Leigh Lobster (300t/year live lobster)
MOANA NEW ZEALAND(formerly AOTEAROA FISHERIES)
Carl Carrington Chief Executive Officer
DESCRIPTION: Pan iwi organisation with 50% ownership in Sealord; largest Maori owned fisheries company in New Zealand; JV with Multi-Pack Ltd “Prepack” produce combat ration packs for Australian Defence Forces
KEY PRODUCTS: Blue abalone, wild abalone, fin fish, lobster, oysters
OWNERSHIP: NZ; Iwi (various iwi holdings)
COMPANY NUMBER: 1581332
ADDRESS: 1-3 Bell Ave, Mt Wellington, Auckland
PHONE: +64 9 302 1520
WEBSITE: www.moana.co.nz
YEAR FORMED: 2004
STAFF EMPLOYED: 400
REVENUE: ~$170m (FY16)
COMPANY HIGHLIGHTS: Rebranded to Moana New Zealand Jun ’16, moves to premium products and sustainability; joint $52m investment in Precision Seafood Harvesting, new 24m state of the art fishing vessel built in Nelson, first of 6 inshore boats, Seabird Smart training; opened new lobster plant in partnership with Port Nicholson Fisheries for live export to Asia (’16); profit of $19.4m for ‘16
MOUNT COOK ALPINE SALMON
David ColeChief Executive Officer
DESCRIPTION: Vertically integrated salmon farmers and processors; 4 farms in Mackenzie Basin;multiple hatcheries around Canterbury; new modern processing plant in Timaru; 1,500t annual production with strong CAGR; certified Global Food Safety Initiative standards
KEY PRODUCTS: Fresh, smoked, frozen salmon, other value added products
OWNERSHIP: NZ; Private (Sinclair Investments 31%, Wale 31%, others)
COMPANY NUMBER: 2225082
ADDRESS: 13 Yewlett Crescent,Queenstown
PHONE: +64 3 929 2526
WEBSITE: www.alpinesalmon.co.nz
YEAR FORMED: 1992
STAFF EMPLOYED: 175
REVENUE: $20-40m (FY16)
COMPANY HIGHLIGHTS: State of art processing facilities in Timaru.Continued support from Callaghan Innovations and NZTE. Consents in place for further expansion to meet high demand for its unique Freshwater King Salmon product. Acquired Aoraki Smokehouse Salmon in ’16, to boost annual production

73* Estimate; Source: various companies annual financial statements (NZ Companies Office or company website); various press releases and news articles; Coriolis analysis
NEW ZEALAND KING SALMON CO
Grant RosewarneChief Executive Officer and Managing Director
DESCRIPTION: Vertically integrated king salmon farming, processing, marketing company; 50% of world’s aquaculture king salmon production; 6,000t of king salmon per year; 7 seafarms in Marlborough; Ora King, Regal Marlborough King Salmon, Southern Ocean brands; 45% volume exported
KEY PRODUCTS: Fresh, frozen, cold smoked and wood roasted King salmon
OWNERSHIP: NZ; Public (NZX,ASX:NZK) (Oregon Group (Malaysia) 40%; NZ Central Securities 20%; China Resources Ng Fung 10%, others)
COMPANY NUMBER: 287485
ADDRESS: 93 Beatty Street, Tahunanui, Nelson
PHONE: +64 3 548 5714
WEBSITE: www.kingsalmon.co.nz; www.orakingsalmon.co.nz; www.regalsalmon.co.nz
YEAR FORMED: 1985
STAFF EMPLOYED: 450
REVENUE: $114m (FY16)
COMPANY HIGHLIGHTS: Opened 3 new farms in Marlborough Sounds in ’16, $18m capex to complete phased build out, allowing doubling in production to 12,000 t over time; IPO Oct ‘16 on NZX and ASZ, allowing Direct Capital to exit; investing $15.3m by ‘18 to increase production ultimately to 12,000t; launched pet food products “Omega Plus” in ‘16
NGAI TAHU SEAFOOD LTD
Joseph ThomasChief Executive
DESCRIPTION: Vertically integrated seafood company with facilities in Bluff, Christchurch, Kaikoura and Picton; supports 50 Ngai Tahu fishing businesses; parent group also includes Ngai Tahufarming, dairy, meat and forestry
KEY PRODUCTS: Lobster, paua, blue cod, Bluff oysters, mussels, fin fish (Tahu brand)
OWNERSHIP: NZ; Iwi (Ngai Tahu Charitable Trust)
COMPANY NUMBER: 386544
ADDRESS: 6 Bolt Place, Christchurch Airport,Christchurch
PHONE: +64 3 358 2761
WEBSITE: www.ngaitahuseafood.com
YEAR FORMED: 1988
STAFF EMPLOYED: 100-150
REVENUE: $81m (FY14) $85m (FY15) Ngai Tahu Group $385m (FY16)
COMPANY HIGHLIGHTS: EBIT $24.6m (FY16); investigating selling live blue cod into export markets Nov ’15; acquired mussel farm in Golden Bay in Sep ‘15; opened new fish processing facility in Bluff in April ‘16; all product now exported under Tahu brand since ‘16
NGATI POROU SEAFOODS GROUP
Mark NgataChief Executive Officer
DESCRIPTION: Vertically integrated seafood business; contract fishing; processing facility and marketing; live lobster holding tanks; exports to Europe, Asia, AU, USA; lobster quota caught through Port Nicholson Fisheries and Moana NZ partnership; Real Fresh, Off the Hook retail stores
KEY PRODUCTS: Live lobster, fish, oysters, mussels, kina, cockles, smoked whitefish; Ahia brand
OWNERSHIP: NZ; Iwi (Te Runanganui O NgatiPorou)
COMPANY NUMBER: 1778412
ADDRESS: 47-53 The Esplanade, Gisborne
PHONE: +64 6 868 1644
WEBSITE: www.npsl.co.nz; www.realfreshnz.co.nz; www.ngatiporou.com
YEAR FORMED: 2002
STAFF EMPLOYED: 35
REVENUE: $5.2m (FY16)
COMPANY HIGHLIGHTS:
NORTH ISLAND MUSSELS LTD
Daniel RamseyGeneral Manager
DESCRIPTION: Mussel farming, processing and sales; 900 long lines over 2,000ha of coastal waters in Coromandel; 5 vessels; 30,000t of mussels processed annually at Tauranga facility; 28 automated mussel opening machines, a world first; 50% of NZ marinated mussels, number of brands
KEY PRODUCTS: Mussels; IQF meat, half shell, marinated mussels
OWNERSHIP: Japan; Private (via Cedenco Foods 50%); NZ; Public (via Sanford 50%)
COMPANY NUMBER: 3995838
ADDRESS: 25 Glenlyon Ave, Greerton,Tauranga
PHONE: +64 7 571 3917
WEBSITE: www.niml.co.nz
YEAR FORMED: 2012
STAFF EMPLOYED: 300
REVENUE: $20-30m*
COMPANY HIGHLIGHTS: Cedenco Foods acquired Sealords 50% stake in ‘15

74* Estimate; Source: various companies annual financial statements (NZ Companies Office or company website); various press releases and news articles; Coriolis analysis
PAKIHI MARINE FARMS
Callum McCallumDirector
DESCRIPTION: Cultivator, harvester and processer of oysters; based in Hauraki Gulf; two farming areas on Clevedon Coast and Waiheke Island; bulk of production is fresh half shell for domestic market
KEY PRODUCTS: Oysters; chilled live, chilled and frozen half shell, chilled and frozen oyster meat
OWNERSHIP: NZ; Private (McCallum, Gill)
COMPANY NUMBER: 113952
ADDRESS: 914 Clevedon-Kawakawa Bay Road, Papakura
PHONE: +64 9 292 8017
WEBSITE: www.clevedonoysters.com
YEAR FORMED: 1982
STAFF EMPLOYED: 40 PT
REVENUE: $2-5m*
COMPANY HIGHLIGHTS:
PAUACO LTD
Jamie McKayGeneral Manager
DESCRIPTION: Paua processing and marketing to South East Asia; result of consolidation of smaller paua fishing and processing companies; significant markets in Hong Kong, Singapore, Malaysia
KEY PRODUCTS: Live, chilled, canned wild paua
OWNERSHIP: NZ; Private (Pacific Canneries 30%,Te Anau Fishing Co. 8%, others)
COMPANY NUMBER: 3962059
ADDRESS: 172 Ruru Road, Bromley, Christchurch
PHONE: +64 3 982 3008
WEBSITE: www.pauaco.co.nz
YEAR FORMED: 2012
STAFF EMPLOYED: 13
REVENUE: $10-15m (‘16)
COMPANY HIGHLIGHTS:
PELCO NEW ZEALAND
Andy Rolleston Director
DESCRIPTION: Wild capture fishing and processing company specialising in pelagic species; based in Mount Maunganui; Pelcold Storage coolstoresubsidiary
KEY PRODUCTS: Mackerel, kahawai, tuna, trevally
OWNERSHIP: NZ; Private (Rolleston)
COMPANY NUMBER: 499562
ADDRESS: 32 Portside Drive,Mount Maunganui
PHONE: +64 7 574 9335
WEBSITE: www.pelco-nz.com
YEAR FORMED: 1995
STAFF EMPLOYED: 25
REVENUE: $25-35m*
COMPANY HIGHLIGHTS:
SANFORD
Volker KuntzschChief Executive Officer
DESCRIPTION: NZ’s largest diversified seafood fishing, aquaculture and marketing company with exports 82% of revenue; NZ’s largest quota holder of fishing rights, 23%; largest Green Lipped Mussel producer; 2nd largest King Salmon producer in NZ; 50 vessels, 210 farms, 7 processing sites
KEY PRODUCTS: Chilled and frozen fish, squid, mussels, salmon, oysters, scampi
OWNERSHIP: NZ; Public (NZX:SAN)(Amalgamated Dairies Ltd 27%, Avalon Investment 9%, Maruha Nichiro 4%, others)
COMPANY NUMBER: 40963
ADDRESS: 22 Jellicoe Street, Freemans Bay,Auckland
PHONE: +64 9 379 4720
WEBSITE: www.sanford.co.nz
YEAR FORMED: 1881/ 1904
STAFF EMPLOYED: 1,548
REVENUE: $463m (FY16)
COMPANY HIGHLIGHTS: Exited from Pacific tuna fishing business, moving from commodity fishing company to value added seafood company in ’16; wanting to restrict foreign ownership under 25% to protect quota in ’16; invested $27.8m in fishing vessels in ‘16; moved into pet food market, supplying ingredients to industry ’16; research into ocean mussel feasibility with Cawthron Institute

75* Estimate; Source: various companies annual financial statements (NZ Companies Office or company website); various press releases and news articles; Coriolis analysis
SEALORD
Steve YungChief Executive Officer
DESCRIPTION: Vertically integrated seafood company comprising fishing, aquaculture, processing and marketing; operating in NZ and AU;exports 90% of NZ catch to over 40 countries;significant global investments
KEY PRODUCTS: Frozen, canned and fresh fish, other seafood products
OWNERSHIP: NZ; Iwi (Moana New Zealand 50%); Japan; Public (Nippon Suisan Kaisha 50%) via Kura Limited
COMPANY NUMBER: 168963
ADDRESS: 666 Central Park, Penrose, Auckland
PHONE: +64 9 589 5359
WEBSITE: www.sealord.com
YEAR FORMED: 1961
STAFF EMPLOYED: 1,100
REVENUE: $454m (FY16)
COMPANY HIGHLIGHTS: Sold 50% stake in North Island Mussels to Cedenco Foods in Oct ’15; invested $70m in new purpose built deep sea vessel in ‘16, to be built in Norway, delivered in mid ’18, at sea production with 20,000t capacity; profit more than doubled to $22.9m in FY16; gained Coles account for supply of fresh salmon
SOLANDER GROUP
Charles HufflettManaging Director
DESCRIPTION: Seafood company; NZ and Fiji operations; exporting and wholesaling primarily from Fiji; own vessels; exports to Japan, USA, AU, Europe, China, NZ; Solander Gourmet Seafood foodservice and retail store, value add processing facilty; South Sea Slipway Ltd in Suva, Fiji
KEY PRODUCTS: Tuna, swordfish, mahimahi, wahoo, moonfish, marlin, shellfish, NZ fish species, deep sea species
OWNERSHIP: NZ; Private (Hufflett)
COMPANY NUMBER: 167871/2297811
ADDRESS: 4 Cross Quay, Port Nelson,Nelson
PHONE: +64 3 545 9650
WEBSITE: www.solander.com; www.slipway.com.fj; www.gourmetseafood.co.nz; www.solander.com.fj
YEAR FORMED: 1988
STAFF EMPLOYED: 83
REVENUE: $30-50m (FY16)
COMPANY HIGHLIGHTS:
SOUTHERN CLAMS LTD
Roger Belton Managing Director
DESCRIPTION: Clam fishing company based in Otago; Southern Rainbow export company; exports to USA, Hong Kong, Singapore, Hawaii, Canada, Tahiti, Australia, UK, Asia, Europe; supplies Costco USA, Waitrose UK, most NZ supermarkets
KEY PRODUCTS: Live chilled clams, clam chowder, clam meat, paddle crabs, scallops, Bluff oysters, fish
OWNERSHIP: NZ; Private (Belton, De Pennart,Witten, Flavell)
COMPANY NUMBER: 209636
ADDRESS: 16 Bombay Street, Dunedin
PHONE: +64 3 477 1505
WEBSITE: www.nzclams.com; www.shellfish.co.nz
YEAR FORMED: 1984
STAFF EMPLOYED: 30
REVENUE: $5-10m (‘16)
COMPANY HIGHLIGHTS: Collaboration with Emerson’s to make Southern Clam Stout
STAR FISH SUPPLY LTD/STAR FOOD SERVICE LTD
Andy ClaudatosDirector
DESCRIPTION: Fish processors, wholesalers and exporters; based in Hawke’s Bay; fishing vessels; onsite fish processing factory; Claudatos and McGoverin co-own with others Star Food Service, food supplies wholesalers
KEY PRODUCTS: Fish, food service food products
OWNERSHIP: NZ; Private (Claudatos, McGoverin)
COMPANY NUMBER: 926592
ADDRESS: 27 Dunlop Road, Onekawa, Napier
PHONE: +64 6 843 0662
WEBSITE: www.starfoods.co.nz
YEAR FORMED: 1966
STAFF EMPLOYED: 35
REVENUE: $30-40m*
COMPANY HIGHLIGHTS:

76* Estimate; Source: various companies annual financial statements (NZ Companies Office or company website); various press releases and news articles; Coriolis analysis
TALLEY’S GROUP
Michael & Peter TalleyJoint Managing Directors
DESCRIPTION: Family owned food business; four main divisions: seafood (Talley’s, Amaltal), meat (AFFCO, 9 plants, SPM), frozen vegetables (Logan Farm, Talley’s) and dairy (75% Open Country Dairy, 3 plants, Crème de la Crème brand); total of 18 processing facilities
KEY PRODUCTS: Meat cuts, frozen vegetables, frozen seafood, marinated mussels, seafood by products, ice cream, dairy ingredients
OWNERSHIP: NZ; Private (Talley)
COMPANY NUMBER: 168346/3342490
ADDRESS: 1 Ward Street, Motueka
PHONE: +64 3 528 2800
WEBSITE: www.talleys.co.nz; www.affco.co.nz;www.opencountry.co.nz
YEAR FORMED: 1936/1904
STAFF EMPLOYED: 2,760-4,600 seas (OCD 310)
REVENUE: $2,000 - 2,500m* (OCD $819m (FY16))
COMPANY HIGHLIGHTS: Open Country Dairy revenue of $819m (FY16); ~$260m invested at OCD FY15; acquired 3 coal mines from Solid Energy as investor with Bathurst Resources in order to diversify in ’16; first kale crop in ‘16; shift into retail ready and value added cut packs using new skin pack technology in ‘17 * See further detail at end of firm profiles
UNITED FISHERIES
Andre KotzikasChief Executive Officer/Owner
DESCRIPTION: Seafood fishing, aquaculture, processing and marketing company based in Christchurch, seafood value added products, nutraceutical products (Nutri Zing); owns several mussel farms
KEY PRODUCTS: Frozen and fresh fish, mussels, oysters, fish fertilisers (Bio Marinus), nutraceutical products (Nutri Zing)
OWNERSHIP: NZ; Private (Keys, Jones, Kotzikas)
COMPANY NUMBER: 126455
ADDRESS: 50-58 Parkhouse Road, Sockburn,Christchurch
PHONE: +64 3 343 0587
WEBSITE: www.unitedfisheries.co.nz; www.biomarinus.co.nz; www.nutrizing.co.nz
YEAR FORMED: 1974
STAFF EMPLOYED: 164
REVENUE: $70-80m (FY16)
COMPANY HIGHLIGHTS: Developed a fish silage for feeding livestock and a fertiliser; recently developed nutraceutical range from co-products, own manufacturing facility
VELA FISHING LIMITED
Geoff BurgessDirector
DESCRIPTION: One of NZ’s largest privately owned fishing quota owners, and exporters of frozen fish and mussels
KEY PRODUCTS: Fish, squid, mussels; Vela and private label brands
OWNERSHIP: NZ; Private (Vela)
COMPANY NUMBER: 923611
ADDRESS: 12 Sir Tristram Avenue, Te Rapa,Hamilton
PHONE: +64 7 849 2376
WEBSITE: www.velafishing.co.nz
YEAR FORMED: 1929
STAFF EMPLOYED: 15
REVENUE: $40-50m*
COMPANY HIGHLIGHTS:
WESTFLEET SEAFOODS
Craig BooteManaging Director
DESCRIPTION: Wild capture fishing, processing, exporting company; 6 trawler and longline vessels; 1fresh fish processing facility; based on West Coast
KEY PRODUCTS: Inshore and deep sea fish; frozen and fresh
OWNERSHIP: NZ; Private (Sealord Group 50%, Boote 50%)
COMPANY NUMBER: 154071
ADDRESS: 84 Gresson Street, Greymouth
PHONE: +64 3 768 5370
WEBSITE: www.westfleet.co.nz
YEAR FORMED: 1979
STAFF EMPLOYED: 100
REVENUE: $45-50m*
COMPANY HIGHLIGHTS: Built new multi million dollar factory in ’14, 3,000 m2
WFWESTFLEET SEAFOODS
EST 1979

77
SEAFOOD PROCESSED/VEGETABLE MEAT DAIRY
- Deepsea fleet (9 vessels)
- Frozen at sea
- Staff: 800- Sites: 4 processing- In-shore land based- 6 own vessels- 100 vessels supply
- Sites: Blenheim, Timaru, Westport, Motueka, Havelock
- Staff: 650-700- Sites: 2- Own farms + growers- Logan Farms- Snapped frozen range- Peas, beans, corn, spinach- Corn carrots, mixed
- Sites: Blenheim, Ashburton
- AFFCO- Sites: 11 (9 plants)
- Sites: 3 - Staff: 310- 900m L- $819m (FY16)- Ownership: Olam 15%
(Singapore), Dairy Investment Fund 7%
- Sites: 1 Motueka- Staff: 26 Ice cream - Domestic: 1m L
Crème de la crème- Japan: 5m L own
brands- Total 6m L
100% 100% 100% 100% 100% 100% 76%
- Subsidiaries100%: Greenshell GLM950%: Clearwater Mussels Ltd
(90 farms 470ha)+ others
Staff: 2,760 FTE (+ 4,600 seasonal) Revenue: $2,000 - $2,500m estimate
Staff: 1,000FTE + 600 seasonalRevenue: $400-500m estimate
Staff: 800 + 4,000 seasonalRevenue: $1,000– 1,500m estimate
Staff: 260Revenue: $620-650m estimate
Source: Talley’s employment site, interviews, published articles, Coriolis estimates and analysis; as at 15 March, 2017
Staff: 700Revenue: $350-450m estimate
- South Pacific Meats
- North Island- Sites: 1

Appendices
+ Industry bodies
+ Trade codes
+ Glossary of terms
06

INDUSTRY ORGANISATIONSNew Zealand has a broad range of organisations that support the seafood industry
79
- Represent all members of the seafood industry
- Peak body for NZ seafood industry
- www.seafood.org.nz
- Represent commercial inshore fishers
- Annual contributions by quota owners + ACE holders
- www.inshore.co.nz
- Represent deepwaterfishing quota holders (~50 seafood companies)
- Fees based on quota
- www.deepwatergroup.org
- Represent interests of owner operator commercial fishermen
- Fee based membership
- www.nzfishfed.co.nz
- Represent nine regional rock lobster fisheries commercial stakeholder organisations
- www.nzrocklobster.co.nz
- Represents aquaculture industry- Greenshell mussels- Pacific oysters, - King salmon
- Industry levy funding
- www.aquaculture.org.nz

TRADE CODES
Source: United Nations trade codes; Coriolis definitions in conjunction with project steering group
GLOBAL HARMONISED SYSTEM (HS) TRADE CODES DEFINED AS SEAFOODHS2002
80
HHSS CCooddee SShhoorrtt DDeessccrriippttiioonn LLoonnggeerr ooffffiicciiaall ddeessccrriippttiioonn
030192 Live eels Live eels
030212 Salmon, chilled whole Fresh or chilled Pacific, Atlantic and Danube salmon
030229 Chilled flat fish Fresh or chilled flat fish (excl. halibut, plai
030234 Bigeye tuna, chilled Bigeye tunas (Thunnus obesus), fresh/chilled (excl. fillets/oth. fish meat of 03.04/livers & roes)
030235 Bluefin tuna, chilled Bluefin tunas (Thunnus thynnus), fresh/chilled (excl. fillets/oth. fish meat of 03.04/livers & roes)
030236 Bluefin tuna, chilled whole Southern bluefin tunas (Thunnus maccoyii), fresh/chilled (excl. fillets/oth. fish meat of 03.04/livers & roes)
030265 Sharks, whole chilled Fresh or chilled dogfish and other sharks
030269 Chilled fish, nes. Fresh or chilled fish, nes
030311 Sockeye salmon, frozen Sockeye salmon (red salmon) (Oncorhynchus nerka), frozen (excl. fillets/oth. fish meat of 03.04/livers & roes)
030319 Salmon, frozen whole Pacific salmon (Oncorhynchusgorbuscha/keta/tschawytscha/kisutch/masou/rhodurus), frozen (excl. of 0303.11; excl. fillets/oth. fish meat of 03.04/livers & roes)
030339 Flat fish, frozen whole Frozen flat fish (excl. halibut, plaice and sol
030341 Longfin tuna, frozen whole Frozen albacore or longfinned tunas
030343 Skipjack tuna, frozen whole
Frozen skipjack or stripe-bellied bonito
030346 Bluefin tuna, frozen whole Southern bluefin tunas (Thunnus maccoyii), frozen (excl. fillets/oth. fish meat of 03.04/livers & roes)
030349 Tuna nes, frozen Frozen tunas, nes
030374 Mackerel, frozen Frozen mackerel
030375 Sharks, whole frozen Frozen dogfish and sharks
030376 Eels, frozen Frozen eels
HHSS CCooddee SShhoorrtt DDeessccrriippttiioonn LLoonnggeerr ooffffiicciiaall ddeessccrriippttiioonn
030378 Hake, frozen Frozen hake
030379 Frozen fish, nes Frozen fish, nes
030380 Frozen fish livers and roes Frozen fish livers and roes
030410 Chilled fish fillets Fresh or chilled fish fillets
030420 Frozen fish fillets Frozen fish fillets
030490 Frozen fish meat Frozen fish meat (excl. fillets)
030541 Salmon, smoked Smoked Pacific, Atlantic and Danube salmon (inc
030559 Dried fish Dried fish, not smoked (excl. cod)
030611 Frozen rock lobster Frozen rock lobster and other sea crawfish
030613 Prawns, frozen Frozen shrimps and prawns
030619 Crustaceans nes, frozen Frozen crustaceans,nes,including flours,meals &
030621 Rock Lobster, fresh Rock lobster and other sea crawfish (excl. froz
030710 Oysters Oysters
030739 Mussels (not-live) Mussels (excl. live, fresh or chilled)
030749 Squid (non-chilled) Cuttle fish and squid (excl. live, fresh or chi
030791 Invertebrates nes., fresh Aquatic invertebrates, nes, live, fresh or chil
030799 Invertebrates nes Aquatic invertebrates,nes,includ.flours,meals,p
150410 Fish-liver oils Fish-liver oils and their fractions
150420 Fish oils Fish fats, oils and fractions (excl. fish liver
160300 Fish extracts Extracts and juices of meat, fish and aquatic i
160419 Prep/pres fish nes Prepared or preserved fish (excl. minced), nes
160420 Other prep fish Other prepared or preserved fish, nes
160590 Mussels, prepared Molluscs and other aquatic invertebrates, prepa

GLOSSARY OF TERMS
81
A$/AUD Australian dollar n/a Not available/not applicable
ABS Absolute change NA/ME/CA North Africa / Middle East / Central Asia
ANZSIC AU/NZ Standard Industry Classification N. America North America (USA, Canada)
AU Australia Nec/nes Not elsewhere classified/not elsewhere specified
Australasia Australia and New Zealand N/C Not calculable
b Billion N.H Northern Hemisphere
CAGR Compound Annual Growth Rate NZ New Zealand
CN China NZ$/NZD New Zealand dollar
C/S America Central & South America (Latin America) R&D Research and Development
CRI Crown Research Institute S Asia South Asia (Indian Subcontinent)
CY Calendar year (ending Dec 21) SE Asia South East Asia
E Asia East Asia S.H Southern Hemisphere
EBITDA Earnings before interest, tax, depreciation and amortization SS Africa Sub-Saharan Africa
FAO Food and Agriculture Organisation of the United Nations T/O Turnover
FOB Free on Board UHT Ultra-high temperature
FY Financial year (of firm in question) US/USA United States of America
GBP British pounds US$/USD United States dollar
HK Hong Kong UK United Kingdom
IQF Individually quick frozen YE Year ending
JV Joint venture YTD Year to date
m Million

AUSTRALIACoriolis Australia Pty Ltd
PO Box 5831St Georges Terrace
Perth, WA 6831Australia
+61 8 9468 4691
NEW ZEALANDCoriolis (New Zealand) Limited
PO Box 90-509Victoria Street West
Auckland, 1142New Zealand
+64 9 623 1848
www.coriolisresearch.com
Coriolis is the leading Australasian management consulting firm specialising in the wider food value chain. We work on projects in agriculture, food and beverages, consumer packaged goods, retailing & foodservice. In other words, things you put in your mouth and places that sell them.
WHERE WE WORK
We focus on the Asia Pacific region, but look at problems with a global point-of-view. We have strong understanding of, and experience in, markets and systems in Australia, China, Japan, Malaysia, New Zealand, Singapore, South Korea, Thailand, the United Kingdom and the U.S.
WHAT WE DO
We help our clients assemble the facts needed to guide their big decisions. We develop practical, fact-based insights grounded in the real world that guide our clients decisions and actions. We make practical recommendations. We work with clients to make change happen. We assume leadership positions to implement change as necessary.
HOW WE DO IT
All of our team have worked across one-or-more parts of the wider food value chain, from farm-to-plate. As a result, our work is grounded in the real world. Our style is practical and down-to-earth. We try to put ourselves in our clients’ shoes and focus on actions. We listen hard, but we are suspicious of the consensus. We provide an external, objective perspective.
WHO WE WORK WITH
We only work with a select group of clients we trust. We build long term relationships with our clients and more than 80% of our work comes from existing clients. Our clients trust our experience, advice and integrity.
Coriolis advises clients on growth strategy, mergers and acquisitions, operational improvement and organisational change. Typical assignments for clients include…
FIRM STRATEGY & OPERATIONS
We help clients develop their own strategy for growing sales and profits. We have a strong bias towards growth driven by new products, new channels and new markets.
MARKET ENTRY
We help clients identify which countries are the most attractive –from a consumer, competition and channel point-of-view. Following this we assist in market entry planning & growth.
VALUE CREATION
We help clients create value through revenue growth and cost reduction.
TARGET IDENTIFICATION
We help clients identify high potential acquisition targets by profiling industries, screening companies and devising a plan to approach targets.
DUE DILIGENCE
We help organisations make better decisions by performing consumer and market-focused due diligence and assessing performance improvement opportunities.
EXPERT WITNESS
We provide expert witness support to clients in legal cases and insurance claims. We assist with applications under competition/fair trade laws and regulations.
82