The Investigation of Three-Dimensional Vibration for ...
12
142 IEEU 'I'IO\NSA(YI'TONY ON UI;I'HASONICS, I~F~RROIILYCTRICS, AND I~'1IYQUENCY CONI'IIOI,, VOL. 48, NO. 1, JANIJAILY 2001 The Investigation of Three-Dimensional Vibration for Piezoelectric Rectangular Parallelepipeds Using the AF-ESP1 Method Chien-Ching Ma and Chi-Hung Huang Abstract-Electronic specklc pattern interferometry (ESPI) is a powerful tool for the full-field measurement of a deformed body. In this papcr, a three-dimensional vibrat- ing block that couples the out-of-plane and in-plane mo- tions is investigated using the amplitude-fluctuation ESPI (AF-ESPI). This method demonstrates the advantages of combining high processing speed, such as in thc subtrac- tion method, with high fringe sensitivity, such as in the time-averaged method. The optical system for AF-ESP1 is then employed to analyze the volume vibration of piezoelec- tric material for a rectangular parallelepiped configuration. Based on the fact that fringe patterns measured by the AF-ESP1 method appear as a clear picture only at the res- onant frequency, both the natural frequencies and the out- of-plane and in-plane vibration mode shapes arc success- fully obtained in this study. Finally, the impedance analysis as well as the finite element method (FEM) with three- dimensional model are also conducted to compare with the result obtained by AF-ESPI. It is shown that the numerical calculation and the experimental result agree fairly well for both the resonant frequency and the mode shape in three- dimensional configurations. I. INTRODUCTION 4 N A coherent laser beam illuniiiiatcs a rough sur- surface will form a random pattcrn of laser spccltles antl fill the entire sp~ce. This is known as the speckle effect. The specklc effect is no longer looked iipon as oiily noise but as an iriformation carrier that can be uscd in niariy applica- tions. The sensitivity of the speckle method is coiitrollecl by the size of speckles, which is the resolution limit of the speckle method. To digitize the speckles and to process them directly is the present research of interest because i L clirninates the use of photographic film. ESPI is a full-field, non-contact, real-time measurement rriethod of displacement of deformed bodies. As compared with the conventional film recording and optical rccori- struction procediircs uscd for holographic interferometry wY face, reflected wavelets froin each point of tlic rough Ivk"hcript received Scpteinbcr 2, 1999; accepted 4pril 21, 2000. This rcscarch was financially supported by the National Science Council (Repnblic oI China) under Grant NSC 86-2212-E002-077. C.-C. Ma is with the Dcpartinent of Mcchanical Engineering, Na- tional Taiwan University, 'Ihipei, Taiwan 1 OB, Rcpuhlic of China (e- mail: cmaQw3.rne.ntu.edu.tw). C.-13. Hiiaiig is with tho Department of Meclianical Enginecring, Cliiiig Yuri Institute of Technology, Chung-Li, Taiwan 320, Rcpuhlic of China. (Rastogi [l]), the int,crferonictric fringes of ESP1 arc pro- duced instautly by the video recording system. ESPI was first proposed by Butters arid Lecridertz [2], who invcsti- gated the oiit-of-plane measurement of a vibrating disk. The most widely used cxperimcrital setup to study vi- brating bodies by the ESPI is the tirnc-averaged (or live fringes) method (Joiics and Wykes [?,I), This single-frame tedniiquc has Lo be proce d by high-pass filtering, rcc- tificatiori, and squaring. 13ascd on 1,he previously rnen- tioned mctliod, the phase-niotlnlatiori method, using the rcfcrcxicc wave rriotlulatioii tcchniquc, was developed by L&bcrg and Hognioen [4 arid Hnrden [5] to clctcrminc the aixiplitnde and reliilive phase of displacement, Sliellabear and Tyrer [6] extended the tirne-averaged method to rriakc three-dirriensional vibration irieasnremciits. In 1985, Lukbcrg [7] indical.cd that in-planc vibration rnodes could be obtained by using an out-of-plaiic setup and tilting the sprcirrien at an angle. It was found that tilting angles bc- tween 60" and 70" is an accept~ble corriprornise bctwcen distortion and sensitivity. In addition, vibration fringe pat- terns could be ohserved by thc subtraction inethod in which the refcrenco lranie is first rccordcd before vibrat,ion. Then, this rccordcd reference frarnr is continuoiisly sub- tractcd from the incoming frames after vibration (Creath et al. [SI; Pouet et al. [Cl]). Although this method can reduce the noise coining from tlic eriviroriineiit, the interferometric fringe visibility and tlic resolution are still not good enough for quantitativc: measurement. For a11 of tlie tinic-averaged methods of ESPI for vibrating nicasurcrneiil, just incn- tioned, the light intensity of rringe patterns is described by a zero-order Bcssel hiction. To increase the visibil- ity of the fringe pattern, an nmplitiide-fhictuatiori method was proposcd by Wang et (1.1, [lo] for out-of-plane vibra- tion measurement. The rcferencc frame in the miplitude- fluctuation method is taltcn in a vibrating state, and both the visibility and resolution of the fringe pattcrn are better than that obtained by otlicr time-averaged mothods. Piezoelectric Imnsdncers arc widely uscd in elcctroim- chariical sciisorsI actuators (Dimitriadis et al. [Ill), antl non-destructive testing as well as electro-optic modula- t,ors, etc. The piezoelectric cffect was discovered in 1880 by Pierre and Jacques Curie, aiid has been addressed in later literature (Bellincourt et al. [12]; Zclcnlta [13]). Piezo- electric eflcct is qplied to Inany modern engineering ap- plications because it expresses the connection hotween the electrical arid mechanical fields. Piezoelectricity describes the phenomenon by which tlie material generatcs electric 11885-3010/$10.00 @ 2001 IEEE Authorized licensed use limited to: National Taiwan University. Downloaded on October 31, 2008 at 02:51 from IEEE Xplore. Restrictions apply.
Transcript of The Investigation of Three-Dimensional Vibration for ...
142 IEEU 'I'IO\NSA(YI'TONY O N UI;I'HASONICS, I~F~RROIILYCTRICS, AND I~'1IYQUENCY CONI'IIOI,, VOL. 48, NO. 1 , JANIJAILY 2001
The Investigation of Three-Dimensional Vibration for Piezoelectric Rectangular
Parallelepipeds Using the AF-ESP1 Method Chien-Ching Ma and Chi-Hung Huang
Abstract-Electronic specklc pattern interferometry (ESPI) is a powerful tool for the full-field measurement of a deformed body. In this papcr, a three-dimensional vibrat- ing block that couples the out-of-plane and in-plane mo- tions is investigated using the amplitude-fluctuation ESPI (AF-ESPI). This method demonstrates the advantages of combining high processing speed, such as in thc subtrac- tion method, with high fringe sensitivity, such as in the time-averaged method. The optical system for AF-ESP1 is then employed to analyze the volume vibration of piezoelec- tric material for a rectangular parallelepiped configuration. Based on the fact that fringe patterns measured by the AF-ESP1 method appear as a clear picture only at the res- onant frequency, both the natural frequencies and the out- of-plane and in-plane vibration mode shapes arc success- fully obtained in this study. Finally, the impedance analysis as well as the finite element method (FEM) with three- dimensional model are also conducted to compare with the result obtained by AF-ESPI. It is shown that the numerical calculation and the experimental result agree fairly well for both the resonant frequency and the mode shape in three- dimensional configurations.
I. INTRODUCTION
4 N A coherent laser beam illuniiiiatcs a rough sur-
surface will form a random pattcrn of laser spccltles antl fill the entire s p ~ c e . This is known as the speckle effect. The specklc effect is no longer looked iipon as oiily noise but as an iriformation carrier that can be uscd in niariy applica- tions. The sensitivity of the speckle method is coiitrollecl by the size of speckles, which is the resolution limit of the speckle method. To digitize the speckles and to process them directly is the present research of interest because iL clirninates the use of photographic film.
ESPI is a full-field, non-contact, real-time measurement rriethod of displacement of deformed bodies. As compared with the conventional film recording and optical rccori- struction procediircs uscd for holographic interferometry
wY face, reflected wavelets froin each point of tlic rough
Ivk"hcript received Scpteinbcr 2, 1999; accepted 4pril 21, 2000. This rcscarch was financially supported by the National Science Council (Repnblic oI China) under Grant NSC 86-2212-E002-077.
C.-C. Ma is with the Dcpartinent of Mcchanical Engineering, Na- tional Taiwan University, 'Ihipei, Taiwan 1 OB, Rcpuhlic of China (e- mail: cmaQw3.rne.ntu.edu.tw).
C.-13. Hiiaiig is with tho Department of Meclianical Enginecring, Cliiiig Yuri Institute of Technology, Chung-Li, Taiwan 320, Rcpuhlic of China.
(Rastogi [l]), the int,crferonictric fringes of ESP1 arc pro- duced instautly by the video recording system. ESPI was first proposed by Butters arid Lecridertz [2] , who invcsti- gated the oiit-of-plane measurement of a vibrating disk. The most widely used cxperimcrital setup to study vi- brating bodies by the ESPI i s the tirnc-averaged (or live fringes) method (Joiics and Wykes [?,I), This single-frame tedniiquc has Lo be proce d by high-pass filtering, rcc- tificatiori, and squaring. 13ascd on 1,he previously rnen- tioned mctliod, the phase-niotlnlatiori method, using the rcfcrcxicc wave rriotlulatioii tcchniquc, was developed by L&bcrg and Hognioen [4 arid Hnrden [5] to clctcrminc the aixiplitnde and reliilive phase of displacement, Sliellabear and Tyrer [6] extended the tirne-averaged method to rriakc three-dirriensional vibration irieasnremciits. In 1985, Lukbcrg [7] indical.cd that in-planc vibration rnodes could be obtained by using an out-of-plaiic setup and tilting the sprcirrien at an angle. It was found that tilting angles bc- tween 60" and 70" is an accept~ble corriprornise bctwcen distortion and sensitivity. In addition, vibration fringe pat- terns could be ohserved by thc subtraction inethod in which the refcrenco lranie is first rccordcd before vibrat,ion. Then, this rccordcd reference frarnr is continuoiisly sub- tractcd from the incoming frames after vibration (Creath et al. [SI; Pouet et al. [Cl]). Although this method can reduce the noise coining from tlic eriviroriineiit, the interferometric fringe visibility and tlic resolution are still not good enough for quantitativc: measurement. For a11 of tlie tinic-averaged methods of ESPI for vibrating nicasurcrneiil, just incn- tioned, the light intensity of rringe patterns i s described by a zero-order Bcssel hiction. To increase the visibil- ity of the fringe pattern, an nmplitiide-fhictuatiori method was proposcd by Wang et (1.1, [lo] for out-of-plane vibra- tion measurement. The rcferencc frame in the miplitude- fluctuation method i s taltcn in a vibrating state, and both the visibility and resolution of the fringe pattcrn are better than that obtained by otlicr time-averaged mothods.
Piezoelectric Imnsdncers arc widely uscd in elcctroim- chariical sciisorsI actuators (Dimitriadis et al. [Il l) , antl non-destructive testing as wel l as electro-optic modula- t,ors, etc. The piezoelectric cffect was discovered in 1880 by Pierre and Jacques Curie, aiid has been addressed in later literature (Bellincourt et al. [12]; Zclcnlta [13]). Piezo- electric eflcct is qplied to Inany modern engineering ap- plications because it expresses the connection hotween the electrical arid mechanical fields. Piezoelectricity describes the phenomenon by which tlie material generatcs electric
11885-3010/$10.00 @ 2001 IEEE
Authorized licensed use limited to: National Taiwan University. Downloaded on October 31, 2008 at 02:51 from IEEE Xplore. Restrictions apply.
M A ANI) IIIJANC: I'IHZOELMCI'RIC RECMNC,IJLAR I'ARALLE1,EPlPEDS
chargc when subjected to stress and, conversely, gcner- ates strain when the elcctric field is applied. Although the vibration characteristics of piezoelectric rnatcrials can be detcrniined by three-dimensional equations of the linear elasticity, the Maxwell equation, arid piezoelectric consti- tutive equal;ions (Ticrsten [14]), it is difficult to obtain analytical solutions even for a simple geometry, such as rectangular parallelepiped and circular disks. There arc two numerical methods that are usually used to study the vibration problem of piezoelectric materials. One is the variational approximation mcthotl, and the other is finite element analysis. Eer Nisse [E] applied the calculus of vari- ation to the analysis of piezoelectric disks and compared the resulls to tho experimental results obtained by Sliaw [le]. Hollaird [17], [18] studied the elaslic contour exten- sional modes of thin rectangular piezoelectric plates and the dilatational modes of rectangular parallelepiped pirzo- electric ceramics using R.ay1eigh-Ritz tcchniqnc. Because of the great flcxibility and extcnsive application, the FEM has bccome the alternative method to the analysis of piezo- electric transducers in various configurations. Kagawa and Yarnabuchi [ 191 calculated the resonant frequencies antl vi- bration modes of a piezoelectric circular rod with height to diamcter between 1 and 5. Kunlcel et al. I201 studied the vibration modes of PZT-5H ceramic disks concerning the diameter to thickness ratio (D/T) ranging from 0.2 to 10. Guo et al. [21] presented the results for PZT-5A piczoelec- tric disks with a D/T of 20 antl 10. There were five types oC modes being classified according i,o tlie mode shape cliarac- teristics, and the physical interpretation was wcll clarified. In addition to variational and nnmcrical methods, cxper- imental techniques have bccn employed for investigation of vibration modes and natural freqiicncies of piezoclec- tric transducers, Shaw [le] used an optical interference technique in which stroboscopically illuminated mnltiple beam is applied to measure the snrCace motion of thick barium titanate disks. However, only normal modes hav- ing symmetry with respect to thc axis and to the central plane wcre observed. Koyuiic~i [22] used ESP1 with rcfcr- encc beam modulation to observe the vibration amplitudes and vibration modes of PZT-4 transducers in air arid wa- ter. Oswin et al. [23] utilized ESPI to validate tlie FEW1 of flextensional transducer with an elliptical shape. Both in-plane and out-of plane vibrations wcre studied and dis- cussed.
143
In this paper, we report experimental results based on AF-ESP1 proposed by Wang et al. [lo] to study threc- dimensional vibration of rectangular parallelepiped piwo- electric transducers. Both in-planc and ont;-of-planc mo- tions in each face of the rectangular parallelepiped arc obtained and discussed. The numerical FEW1 with thrce- dimensional modcl and cxperimcntal impedancc analysis are also used to stndy tlie problcm, and the results are compared with AF-ESPI. It is shown lhat the difference in resonant frcquency between AF-ESP1 and impedance analysis is smaller. than that between AF-ESP1 antl FEM.
I
I I L e _ _ _ _
- 1 referencc I
plate I I I
_ I
I I
Fig, 1. Schcmatic diagram of ESP1 seLup for oiii,-oC-planc measure- merit.
11. THEORY 01,' AF-ESP1 FOR OUT-OF-PLANE AND
IN-PLANE VIBRATION MEASUREMENTS
A. Out-u.f-Plane Vibration
The optical systcm setup of ESPI for out-of-plane vi- bration measurement is shown in Fig. 1. After the speci- men vibrates, we record the first image as a reference. The light intensity of this refercnce irnagc detected by a CCD camera can be cxpressed by a time-averaged rnetliod as (I) (sec next pagc) whcrc IA = object light intensity, IH = reference light intensity, 7 = CCU refresh time, 9 = phase difference between object and reference light, X = wavolcngth of laser, 0 = angle between object light arid observation direction, A = vibration amplitude, and w = angular frequency.
2x 2inr Let T = -(I+ cosO), and assume T = ~ EN; x w
then, (1) c m be worked out as
11 = I A + I B + ZJIAIB(coSd)Jn(rA) (2)
where JO is a zero-order Bessel function of the first kind.
the first image can be expressed as After irnagc processing and rectifying, the interisity of
As thc vibration of specimen goes on, we take the second image by CCD and assume that the vibration amplitude has changed from A to A + AA because of the electronic noise or instability of the apparatus. According to (l), wc can express the intensity of tlic second image as (4) (sec next pagc)
Expanding thc: term cxp(irAA cos w t ) by using Tay- lor series, keeping tlie first two terms, and neglecting the higher order tcrms, we can rcwrite (4) as follows
Authorized licensed use limited to: National Taiwan University. Downloaded on October 31, 2008 at 02:51 from IEEE Xplore. Restrictions apply.
144 ll,;C:# TRANSACl’lONS O N ULTRASONICS, FERROEI,KCTRICS, ANI) YHL?lQlJBNCY CONTROL, VOL. 48, NO, 1 , JANUARY 2001
I
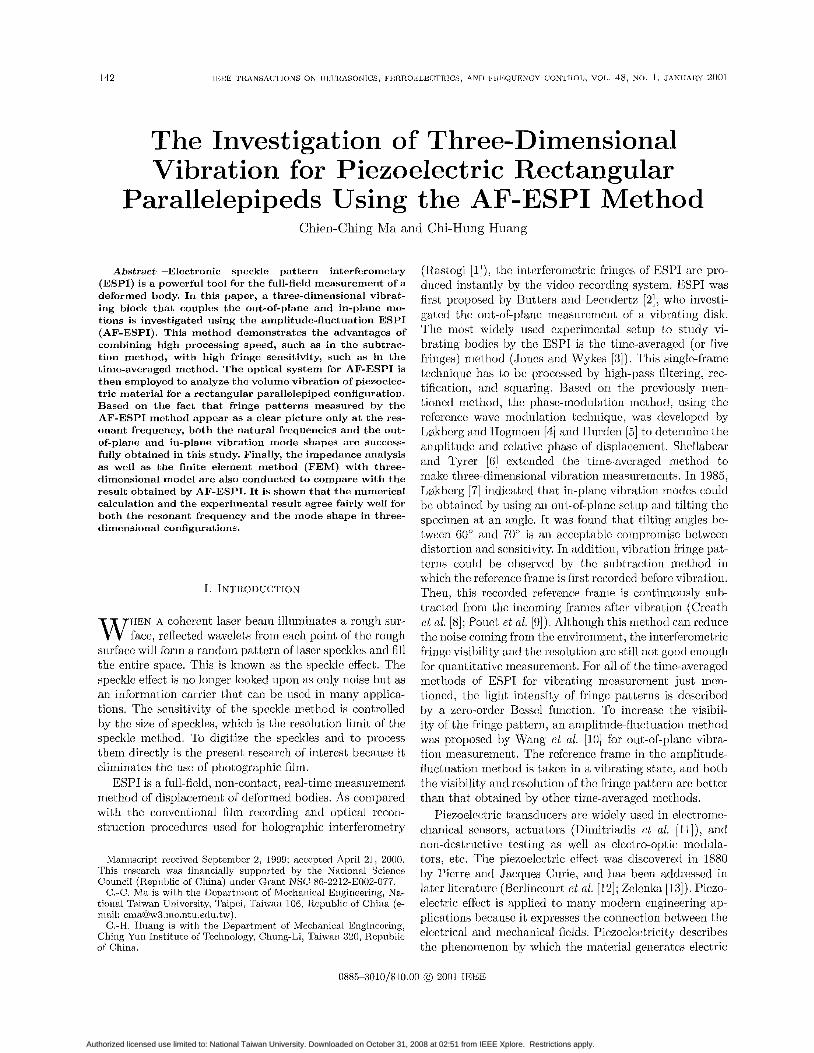
Fig. 2. Schematic diagram of ESPI sctup for in-plane measiiremcut.
By iinage processing and rcctifying, 12 can be similarly expressed as
Whcn these two images (the first arid second images) are subtracted by thc image proccssing system, i.e., sub- bract (3) from ( G ) , and rectified, the resiilting irnage inten- sity can be exprcsscd as
I = I2 - I ]
B. In-Plane Vibration
Thc optical setup of the systcin for in-planc vibration measuremcnt is shown in Fig. 2. Similar to the out-of-planc vibration case, the first, and second image intensities, i.e., I , and 1 2 , for in-plane vibration using the tirnc-averaged method arc expresscd as
I2 = IA + In -E 2 m / ( c o s 4 ) [ 1 - ~T’2(A~’)2].7”(r’A’)l (9)
4
whcrc I A = IB = object light intcnsity, A‘ = vibration
arnplitudc of in-plane vibration, T’ = - (2 sin S’), and 0’ = half of the anglc between two illumination lights.
Subtracting (9) from (8) and rectifying by the irnagc processing system, wc can obtain the resiilting image in- tensity as
2T x
I = I2 - 1 1
It is interesting to notc that the fringe patterns for both tha out-of-planc [J,(rA) in (7)] and in-plane [.7o(I”A’) in ( lo)] vibrating motions obtained by AF- ESPI arc coiitrollcd by zero-order Bessel function. There is a time-avcraged ESPI techniquc called thc video-signal- siibtra,ction mcthod, which was frcquently iiscd by other rescarcliers for vibration mcasurement. The diffcrcnce for vidco-signal-siibtractioii method and AF-ESP1 is that the rcfcrence iinage taken in the vidco-signal-subtraction method is no loiigcr at the vibrating statc but at the stress- free state before vibrating. There are some general fcatures and advantages ol the AF-ESP1 that are explained arid concluded as follows.
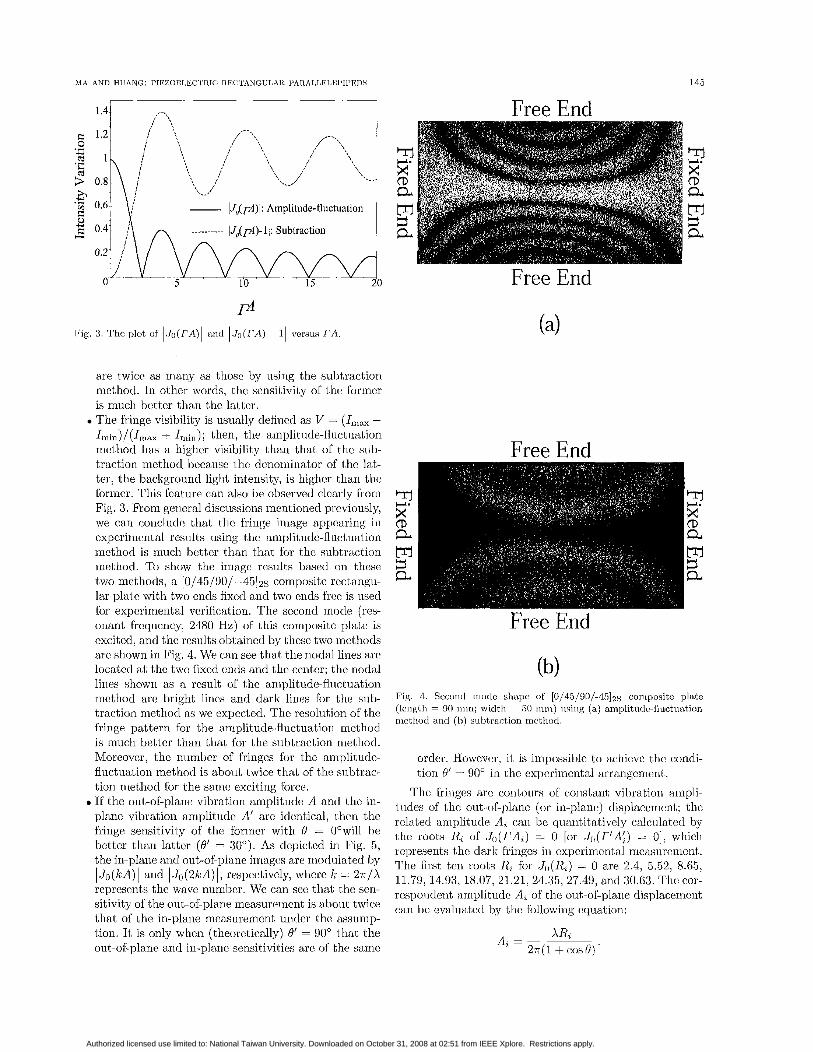
The nodal lines appearing in a vibrating body based on AF-ESP1 method are the brightest lines because the iinage intcnsity is modulated by tlie function IJo(rA) I (6). Howevcr, the image intensity recorded by tlie vidco-signal-subtraction method is controlled by the function )Jo((rA) - 11, which results in the nodal lines bciiig represcnted by thc darkest lines. The brightness distribution of the imngc intensity for these two mcthods is shown in Fig. 3 . As depictcd in Fig. 3 , the number of pcalts for the function IJo(TA)I is about twice that for the fiinc- tion 1.70(rA) - 11 in the sanic range of TA. Hence, for the casc of the same vibration amplitude, the hinges generated by using the amplitude-fluctuation mcthod
Authorized licensed use limited to: National Taiwan University. Downloaded on October 31, 2008 at 02:51 from IEEE Xplore. Restrictions apply.
M A AND HUANC.: PIEZOELEC'L'RIC REC'I'ANC.UI.AL1 I~ARAI,LELh'I'II'RDS 145
1 Free End
are twice as rriauy as those by using the subt,raction method. In other words, the sensitivity of the forrncr is much better than tlic latter. The fringe visibility is usually defined as V = (I,,,, -
Inlin)/(Irr,~lx + Imin ) ; then, the amplil;iitie-fluctiiwtion method has a higher visibility than that of the sub- Free End
onant frequency, 2480 Hz) of this composite plate is fi'ree h d excited, arid the results obtained by these two inethods arc shown in Fig. 4. We can see that the nodal lines arc locatcd at the two fixed ciitls and tlic center; the nodal lines shown as a result of the a~nnlii.ude-fluci,iiatioii
(b)
- - is much better than that {or the snbtraction metliod. Moreover, the nurnbcr of fringes for the amplitudc- fluctuation method is about twice that of the siibti:ac-
order. Howcvcr, it is impossible to achieve the condi- tion 8' = 90" in the expcriincntal arrangement.
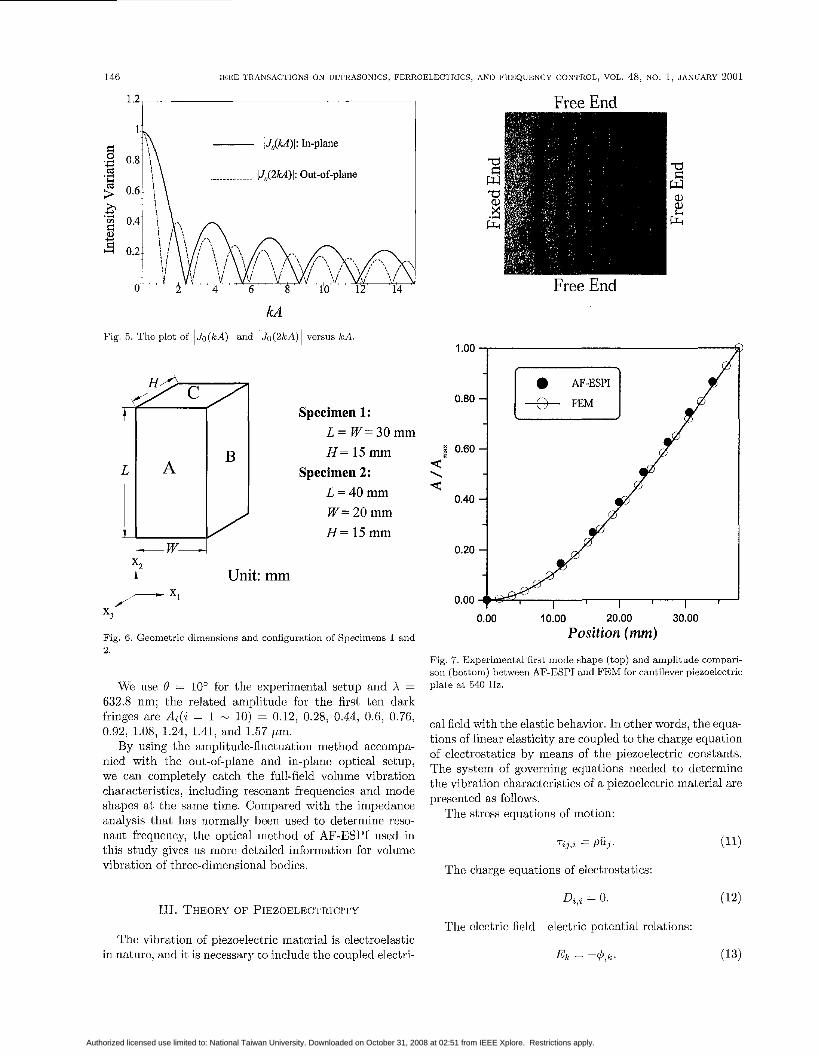
tion method for the samc exciting force. If the out-of-plane vibration amplitude A and the in- plane vibration amplitudc A' arc identical, t.lien the fringe sensitivity of the foriner with H = 0"will he better than latter (e' = 30"). As depicted in Fig. 5, the in-plane and out-of-plane irnagcs are modulated by I.lo(kA)I and IJo(2kA)I, respectively, where k = 2 r / X represents the wave numbcr. We can see that the scn- sitivity of the out-o1-plane nicasureinciit is aboul twice that of the in-plane measurement under I,he assump- tion. It is only when (theoretically) 0' = (30" that the out-of-plane and in-plane sensitivities arc of the samc
The fringes arc contours of constant. vibration ampli- tiides of the oat-of-plane (or in-plane) displacement; t.he related aniplitnde A, can be quantitatively calculated by the roots Ri of Jo(TAi) = 0 [or Jn(T'Ai) = 01, which rcpresents the dark fringes in expcrimcntal rricasnrerucnt. The first tcn roots Ri for Jo(I l i ) = 0 are 2.4, 5.52, 8.65, 11.79, 14.93, 18.07, 27.21, 24.35, 27.49, and30.63. Thecor- respondent aniplitutlc Ai of the oiit-ol-plane displacemcnt can be cvahiatcd by tho following equation:
Authorized licensed use limited to: National Taiwan University. Downloaded on October 31, 2008 at 02:51 from IEEE Xplore. Restrictions apply.
146 IEEE TRANSACI'IONS O N ULTRASONICS, FERROELECTR~CS, A N I ) FREQUENCY CONTROL, VOL. 48, NO. 1, JANUARY 2001
1 .27 Free End
kA Fig. 5. The plot of IJo(kA)l and IJo(2kA)I versus kA.
1.00 ,
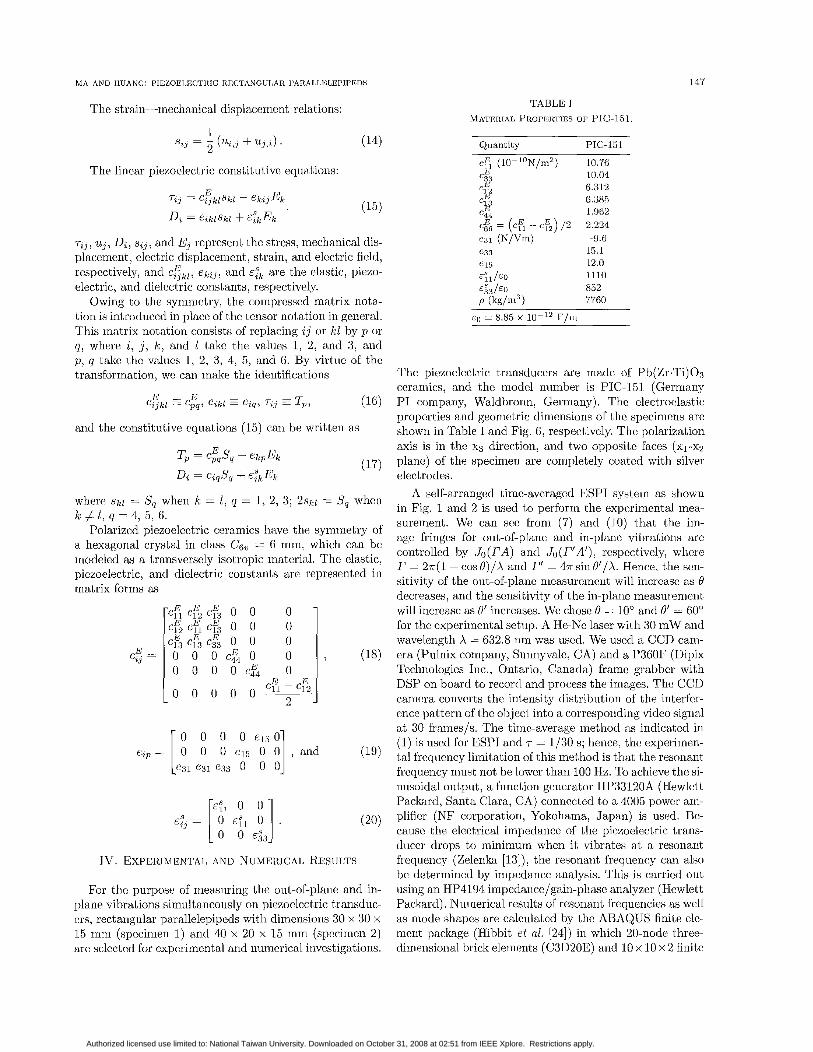
Specimen 1: L = W = 3 0 m m H = 15 mm
Specimen 2: L = 4 0 m m W = 20 mm H = 15 mm
X2 t Unit: mm >- XI X.
3
Fig. 6. Geometric dimensions and configuration of Specimens 1 arid 2
We use 0 = 10" for the experimental sctup and X = 632.8 nm; the related amplitude for the first ten dark fringes are Ai(i = 1 N 10) = 0.12, 0.28, 0.44, 0.6, 0.76, 0.92, 1.08, 1.24, 1.41, and 1.57 pm.
By using the amplitude-fluctuation method accompa- nied with the out-of-plane and in-plane optical setup, we can completely catch the full-field volume vibration charactcristics, including resonant frequencies and mode shapes at the same time. Compared with the impedance analysis that has normally been used to determine reso- nant frcquency, the optical method of AF-ESP1 used in this study gives us more detailed information for volume vibration of three-dimensional bodies.
1 c c \
0 AF-ESP1
0.60
0.40
0.1 I I I 0.00 10.00 20.00 30.00
Position (mm) Fig. 7. Experimental first mode shape (top) and amplitude compari- son (bottom) between AF-ESP1 and FEM for cantilever pieaoelcctric plate at 540 Ha.
cal field with the elastic behavior. In other words, the equa- tions of linear elasticity are coupled to the charge equation of electrostatics by means of the piezoelectric constants. The system of governing equations needed to determine the vibration characteristics of a piezoelectric material are prescnted as follows.
The stress equations of motion:
'Ti,,% = pii,. (11)
The charge equations of electrostatics:
Dt>% = 0. (12) 111. THEORY OF PIEZOELECTRICITY
The clcctric field-electric potential rclations: The vibration of piezoelectric material is electroelastic
in nature, and it is necessary to includc the coupled electri- El, = - 4 , k . (13)
Authorized licensed use limited to: National Taiwan University. Downloaded on October 31, 2008 at 02:51 from IEEE Xplore. Restrictions apply.
MA AND HUANG: PIEZOE1,RCTlIlC RECTANGULAIl 1'ARAI.LELEPIPPDS
The strain--mechanical displacement relations:
0 0 0 - 0 0 0 0 0 0
cf4 0 0 0 cf4 0
cfl ~ cf2 0 0 -
2 -
147
,
The linear piezoclectric constitutive eqimtions:
7 . . ~ cE 23 - i j k l s ~ ~ - elzij&
Di = e ik l sk l +&El, '
r i j , uj, Di, sij, and Ej represcnt the stress, mechanical dis- placement, electric displacement, strain, and elcctric ficld, respectively, and c:,,, e k i j , and E& are the elastic, piezo- electric, and clielcctric constants, respectively.
Owing to the symmetry, the compressed matrix nota- tion is introduced in place of the tensor not,ation in general. This rriatrix riotation consists of rcplacing ij or kl by p or q , where i , j , k , and I take the values 1, 2, and 3 , and p , q take tlic values 1, 2, 3 , 4, 5, and G. By virtue of the transformation, wc can make the identifications
(15)
(:E 23kl = ~ cP,, E eik l e %Il, 7ij TZI, (16)
and the constitutive equations (15) can be written as
where skl = S, when k = 1, 4 = 1, 2, 3; 2sk l = S, when k # 1, q = 4, 5, 6.
Polarized piezoelectric ceramics have the symmetry of a hexagonal crystal in class C,, = 6 mm: which can be modeled as a transversely isotropic material. The clastic, piezoelectric, and diclectric constants arc represented in matrix forms as
CE 1 '23
JV. EXPERIMENTAL AND NUMERICAL REXJLTS
For the purpose of measuring the out-of-plane and in- plane vibrations sirnultaneously on piezoelectric transduc- ers, rectangular parallelepipcds with dinicnsions 30 x 30 x 15 mm (specimen 1) and 40 x 20 x 15 mm (specimen 2) are selectcd for cxperimcntal arid numerical invcstigations.
TABLE I MATERIAL PROIWWIBS OF PIC-151.
Quantily PIC-151
The piwoelectric transducers are made of Pb(Zr.Ti)OS ceramics, and the model number is PIC-151 (Gcrrnany PI company, Waldbronn, Germany). The clectroclastic propcrties and geomctric dimensions of thc specimcns are shown in Table I and Fig. 6, respectively. The polarizatiori axis is in the X Q direction, and two oppositc faces (x1-x~ plane) of the specimen are completely coated with silver electrodes.
A self-arranged time-avcraged ESPI system as shown in Fig. 1 and 2 is used to perform the experimcntal mea- surement. We can sec from (7) arid (10) that the ini- age fringes for out-of-plane and in-plane vibrations are controlled by ,Jo(TA) arid Jo(r'A') , rcspcctively, where T = 27r(l+ cos6')/X and T' = 47rsiii6"/X. Hence, the scn- sitivity of the out-of-plano rricasureincrit will incrcase as 6' decreases, and the scnsitivity of the in-planc measurement will increase as 0' increases. We chose 6' = 10" and 8' = 60" for the cxperimcntal setup. A He-Nc laser with 30 mW and wavelength X = 632.8 nm was uscd. We used a CCD cani- era (Pulnix company, Sunnyvale, CA) and a P360F (Dipix Technologies Inc., Ontario, Canada) frame grabber with DSP on board to record and process the images. Thc CCD camera convcrts tlic intensity distribution of the interfcr- cnce pattern of thc object into a corresponding video signal at 30 frames/s. The time-average method as indicated in (1) is iiscd for ESPI and T = 1/30 s; hence, thc experirnen- tal frequency limitation of this method is that the resonant frequency must not be lower than 100 Hz. To achieve the si- nusoidal output, a function generator HP33120h (Hewlett Paclard, Santa Clara, CA) connected to a 4005 powcr arn- plificr (NF corporation, Yokohama, Japan) is used. Bc- causc the electrical impedance or the piczoclectric trans- duccr drops to minimum whcn it vibrates at a resonarit frequency (Zelenh [13]), the resonant frequency can also be determined by impedance analysis. This is carried out using an HP4194 impedarice/g.ain-phase analyzer (Hewlett Packard). Numerical results of resonant frequcncies as well as mode shapes are calculatcd by thc ABAQUS finite cle- mcnt package (Hibbit et al. [24]) in which 20-node three- dimensional brick elements (C3D20E) and 10 x 10 x 2 finite
Authorized licensed use limited to: National Taiwan University. Downloaded on October 31, 2008 at 02:51 from IEEE Xplore. Restrictions apply.
148 IbWE TRANSACTIONS ON UL'THASONICS, Pl',RllOl,:I.~;CTHICS, AND IW1':QUENCY CONTROL, Vol.. 48, N O , 1, JANUAllY 2001
x1 direction
Fig. 8 First mod? shape of the Spccimcn I obtained by AF-ESP1 and FEM (49 400 Hz)
Fig. 9. Second mode shnpc of the Specimen 1 obl.aincd by AF-ESP1 and FEM (85 300 Hz).
Authorized licensed use limited to: National Taiwan University. Downloaded on October 31, 2008 at 02:51 from IEEE Xplore. Restrictions apply.
FEM res1
T=Tl 140
FEM results
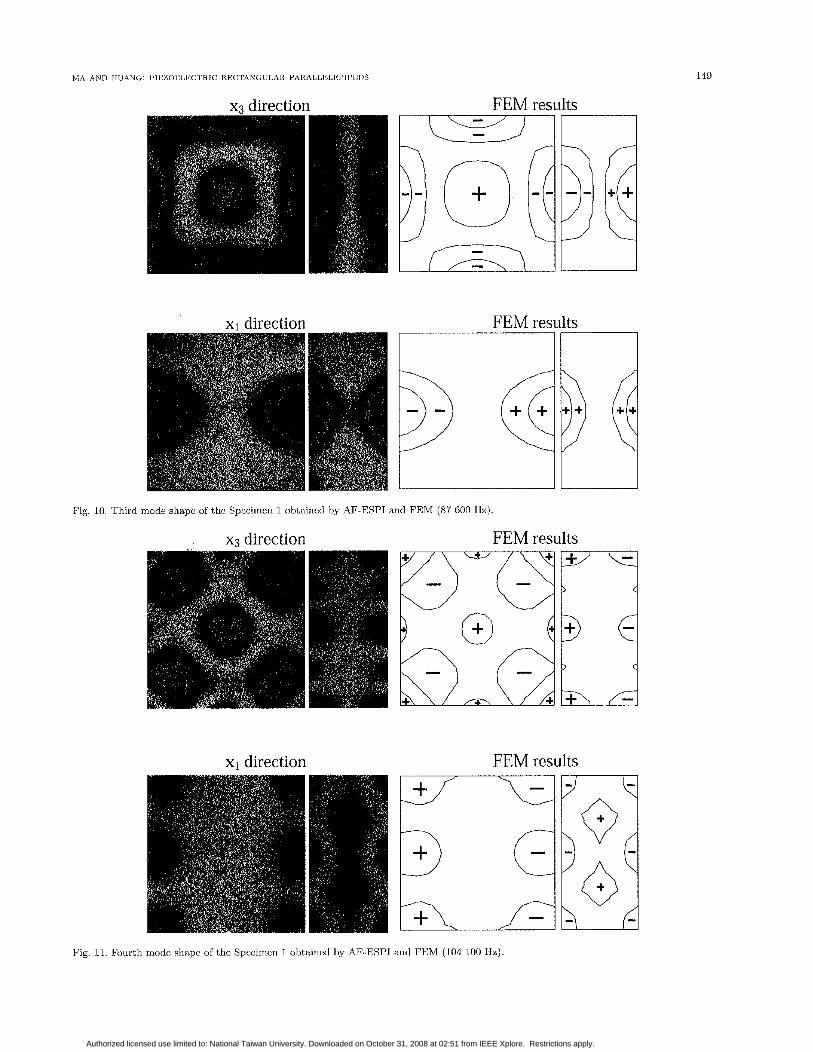
Fig. 10. Third mode shape of the Specimen 1 obtained by AF-ESP1 and FEM (87 600 118)
xs direction FEM results
x1 direction FEM results
Fig. 11. Fourth mode shape of the Specinicri 1 obtained hy AF-ESP1 and PEM (104 100 ITz),
Authorized licensed use limited to: National Taiwan University. Downloaded on October 31, 2008 at 02:51 from IEEE Xplore. Restrictions apply.
150 ICE$ TRANSACTIONS O N ULTRASONICS, FERROELECTRICS, AND FREQUENCY CONI'ROI,, VOI,. 48, NO. 1 , JANUARY 2001
1
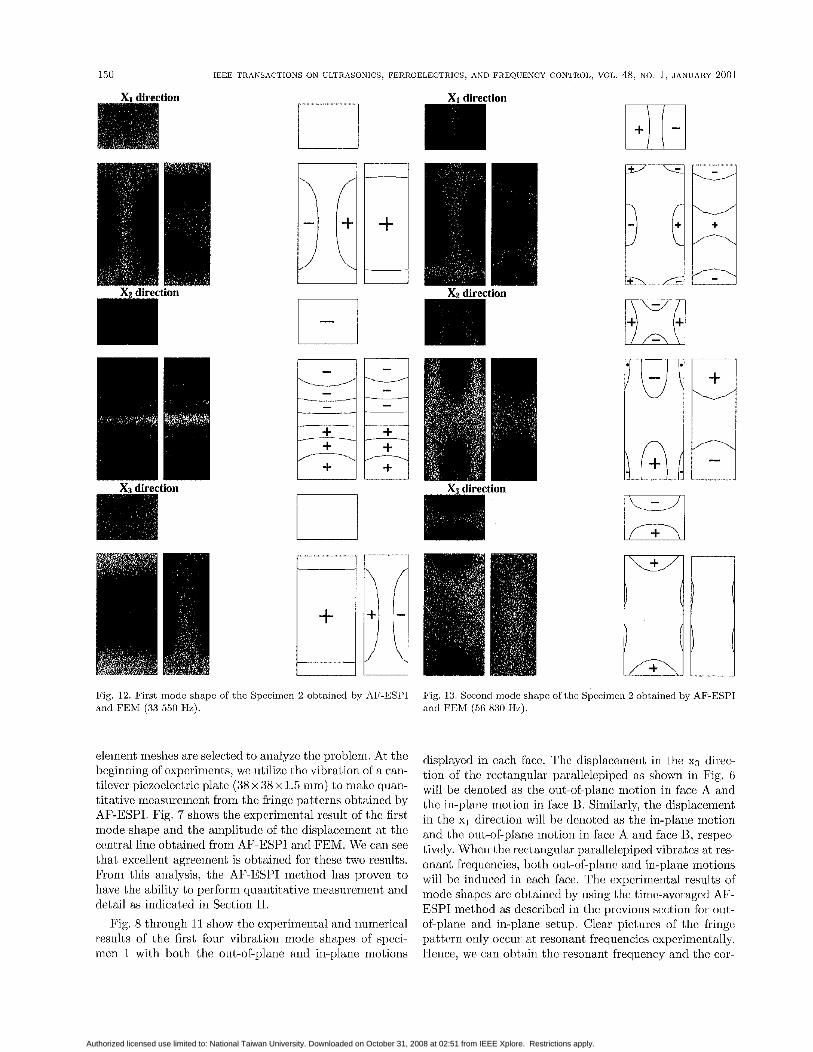
Fig. 12. First mode shapc of thc Speciincn 2 obtaincd by AF-ESP1 and FEM (33 650 H a ) .
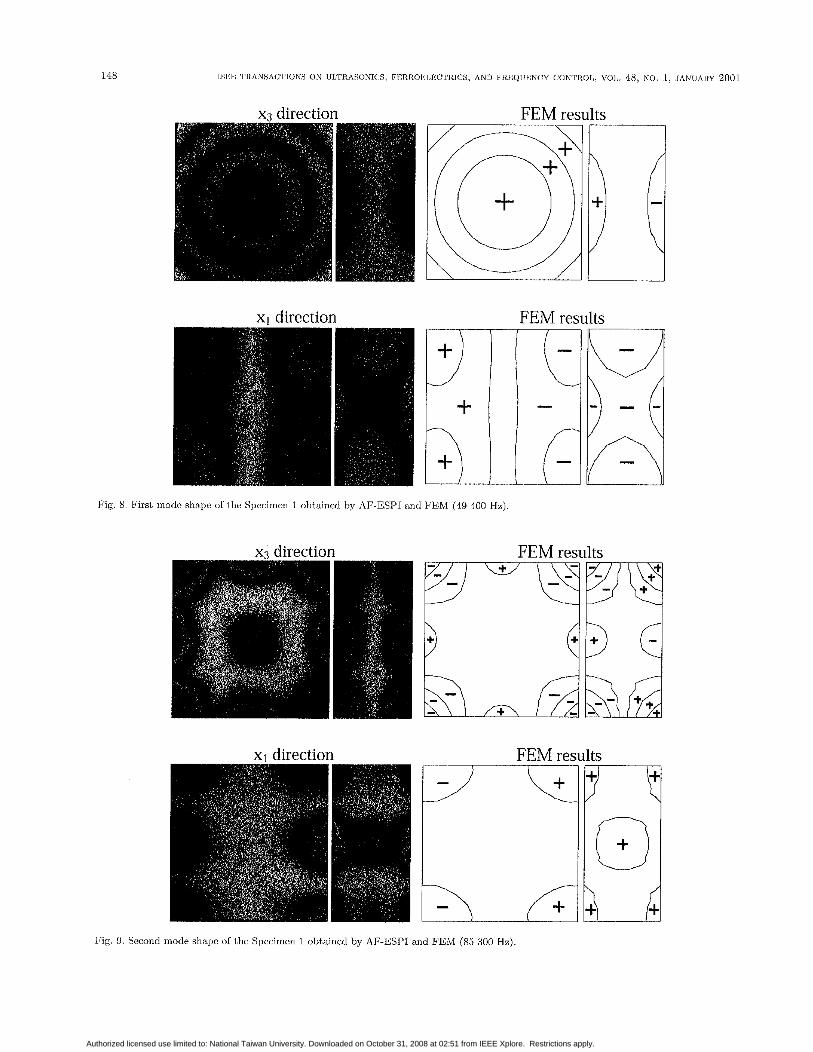
element meshes are selected to ana lye the problem. At the beginning of experiments, we utilizc the vibration of a can- tilever piezoelectric plate (38 x 38 x 1.5 mm) to make quan- titativc rneasurerrierit from the fringe patterns obtained by AF-ESPI. Fig. 7 shows the expcrimcntal rcsult of thc first mode shapc and the amplitude of thc displxcniciit at thc ccntral line obtained from AF-ESP1 and FEM. We can see that excellent agrecment is obtaincd for thcsc two rcsults. From this analysis, the AF-ESP1 method has provcn to have the ability to perform cliiantilative measiircmcnt and detail as indicated in Section 11.
Fig. 8 through 11 show the cxpcrimental ant1 riiiirierical results of the first four vibration mode shapes of spcci- men 1 with both the out-of-plane and in-plane motions
Fig. 13. Second mode shape or Lhe Specinicn 2 obtained by AF-ESP1 and FEM (56 830 117,).
displayed in each face. The displaceinerit in the x3 direc- tion of thc rcctarigular parallelepiped as shown in Fig. 6 will be denoted as the ont-of-pla.nc motion in face A and the in-plane motion in face B. Similarly, the displaceinerit in the XI direction will bc donotcd as the in-plane motion and the out-of-plane motion in face A and face €3, respec- tivcly. Whcri the rectangular parallelepipcti vibratcs at res- onant frcquencies, both out-or-plane and in-plane motions will he indnced in each face. The expcrimental results of mode shapes arc obtained by using the time-averaged AF- ESP1 method as dcscribcd in the previous section for 0111,- of-plane arid iri-plane setup. Clear pictures of the fringe pattern only occur at, resonant frequencics cxpcrimcntally. Hence, we can obtain thc resonant frequcncy and thc cor-
Authorized licensed use limited to: National Taiwan University. Downloaded on October 31, 2008 at 02:51 from IEEE Xplore. Restrictions apply.
m
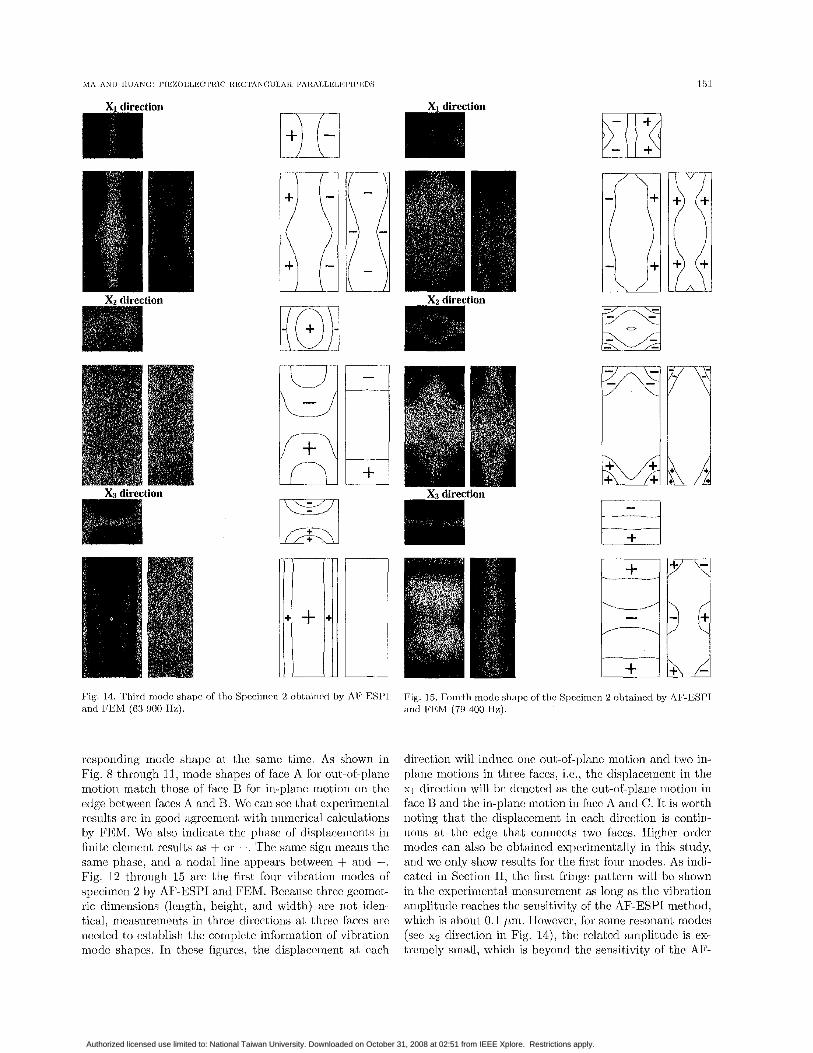
Fig. 14. Third modc shape of thc Specimtxi 2 obtaiiicd by AF-ESP1 and FEM (63 900 IIz).
responding rnotlc shape at the same time. As shown in Fig. 8 throngh 1.1, inode shapes of Cace A loor out-of-plane inotiori match tliosc of facc B for in-plane motion oil tlic edge between faces A and B. We c ~ i sec that cxpcrirricntal results are in good agrccnierit with iiurncrical calculations by FEM. Wc also iiidicate the phase of tlispla,ceiiicnl;s in finite elcmcrit results as + or -. The samc sign sncaris tlic same phase, and a notlal line appcars bctween + arid -. Fig. 12 through 15 are the first four vibration ~riodcs of specimen 2 by AF-ESP1 and FEM. Rccanse thrcc geomc1.- ric dimerisions (leiigth, heighi,, a r i d width) are riot iden- tical, rricasurenicnt,s in three directions at. three faces arc needed to establish the complete information of vibration rnodc shapcs. In these figurcs, the tlisp1acc:iricnt at, each
Fig. 15. Fourl;h modc shape of tlic Specimcn 2 obtained by AF-ESP1 arid FEW1 (79 400 Hz).
direction will iiitliicc oric oul;-of-planc mot,ioii and two in- plane motions iii three faccs! i.e., the displacement in the XI dircction will hc denoted as the out-of-plane snotion in facc U and thc in-plane motion in facc A and C. It is worth iioting that the displacement in each direction is contin- i ioi is at the edge that coniiccts two faces. IIighcr order modes can also hc obtained experiiiicntally in tihis sl,idy, arid we only show results for the first four modes. As indi- cated in Section 11, the first fringe pattern will bc shown in the experimcntal iiicirsiiremcnt as long as the vibration amplitude reaches tlic sensitivity of tlic AF-ESP1 method, which is about 0.1 /mi, Howcvei, for soine resonant modes (see x2 direction in Fig. l d ) , tlie rc1al;cd ainpli1,utle is ex- trcrnely small, which is beyond the scnsit,ivity of the AI?-
Authorized licensed use limited to: National Taiwan University. Downloaded on October 31, 2008 at 02:51 from IEEE Xplore. Restrictions apply.
152 IEEE TRANSACTIONS O N UL'I'HASONICS. FERHOELECTRICS, AND F R E Q U E N C Y CONTROL, VOL. 48, NO. 1, JANUARY 2001
E w
3 H E"
b)
z
k
Width = 20 mm
E w
2 Y $
al
-53
n 75k 150k Frequency (Hz)
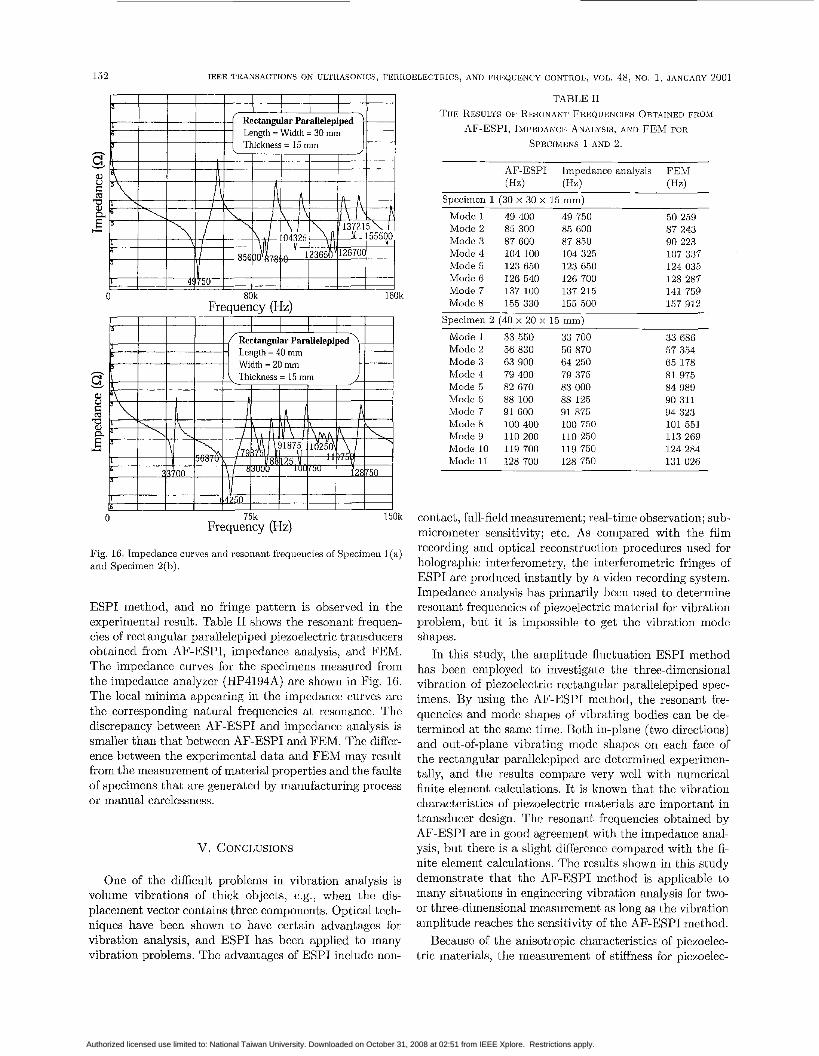
Fig. 16. Impedance ciirvcs and resonant frequencies of Specimen I(a) and Specimen 2(h).
ESPI method, and no fringe pattern is observed in the experimental result . Table I1 shows the resonant. frequen- cies of rectangular Parallelepiped piezoelectric transducers obtained from AF-ESPI, impedance analysis, and FEM. The impedance curves for the specimens measured from the impedance analyxcr (HP4194A) are shown in Fig. 16. The local minima appearing in the impedance curves are thc corresponding natural frequencies at resonance. The discrepancy between AF-ESP1 and impedance analysis is smaller than that bctween AF-ESP1 and FEM. The differ- ence bctween the expcrimental data and FEM may result from the measurcment of material properties and the faults of specimens that are generated by manufacturing process or manual carelessness.
V. CONCLUSIONS
One of the difficult problems in vibration analysis is volume vibrations of thick objects, e.g., when the dis- placement vector contains three components. Optical tcch- niques have been shown to have certain advantages for vibration analysis, and ESPI has been applied to many vibration problems. The advantages of ESPI include non-
TABLE I1 THE RESUVPS OF RESONANI FREQUENCIES OBTAINED FROM
I\F-ESPI, JMPEDANCX ANALYSIS, AND FEM F O R
SPECIMENS 1 AND 2.
AF-ESP1 Impedance analysis FEM (Hz) (Hz) ("a)
SDecimcri 1 130 x 30 x 15 mmi
Mode 1 Mode 2 Mode 3 Mode 4 Mode 5 Mode 6 Mode 7 Mode 8
49 400 85 300 87 600 104 100 123 650 126 540 137 100 155 330
49 750 85 600 87 850 104 325 123 650 126 700 137 215 155 500
50 259 87 243 90 223 107 337 124 035
141 759 157 913
128 287
Specimen 2 (40 x 20 x 15 mni)
Mode 1 33 550 33 700 Mode 2 56 830 56 870 Mode 3 63 900 64 250 Mode 4 79 400 79 375 Mode 5 82 670 83 000 Modo F 88 100 88 126 Mode 7 91 600 91 875 Mode 8 100 400 100 750 Mode 9 110 200 110 250 Mode 10 119 700 119 750 Mode 11 128 700 128 750
33 686 57 354 65 178 81 975 84 989 90 311 94 323 101 551 113 269 124 284 131 026
contact, full-field measurement; real-time observation; sub- micrometer sensitivity; etc. As compared with the film recording and optical reconstruction procedures used for holographic interferometry, the interferometric fringes of ESPI are produced instantly by a video recording system. Impedance analysis has primarily been nsed to determine resonant frequencies of piezoelectric material for vibration problem, but it is impossible to get the vibration mode shapes.
In this study, the amplitude flnctuation ESPI method has been employed to investigate the threc-dimensional vibration of piezoelectric rectangular parallelepiped spec- imens. By using the AF-ESP1 method, the resonant fre- quencies and mode shapes of vibrating bodies can be de- termined at the same timc. Both in-plane (two directions) and out-of-planc vibrating mode shapes on each facc of the rectangular parallelepiped are determined experimen- tally, and the results compare very wcll with numerical finite element calculations. It is known that the vibration characteristics of piezoelectric materials arc important in transducer design. The resonant frcquencies obtained by AF-ESP1 are in good agreement with the impedance anal- ysis, but there is a slight difference comparcd with the fi- nite element calculations. The results shown in this study demonstrate that the AF-ESP1 method is applicable to many situations in engineering vibration analysis for two- or three-dimensional measurement as long as the vibration amplitude reaches the sensitivity of the AF-ESP1 method.
Becausc of the anisotropic characteristics of piezoelec- tric materials, the measurement of stiffness for piezoelec-
Authorized licensed use limited to: National Taiwan University. Downloaded on October 31, 2008 at 02:51 from IEEE Xplore. Restrictions apply.
MA AUD HURNC,: I’IEXOET.k,’C‘I’RIC RE.CTANGUI,AR I’ARAI,I.ELEI’II’I?.DS
tric materials is niorc difficult than for isotropic ones. This is mainly diic to tlie number of independcnt coefficients to he determined and coupling cff’ects. It has been fonnd that tho mechanical test rncthods that are uscd for conventional metallic materials are usually not applicablc to picxoelec- tric materials. Thus, the devcloprrient and evaluation of new test methods for piemclcctric materials has becn a major cliallcnge for thc experimcntal mechanics commu- nity. If vibrations arc? induced in picxoelcctric materials, thcn its dynamic response will bc a function of gcometry, density, boundary conditions, and thc elastic constants. This implies tho possibility of using vibration theory to de- velop non-destriictive tcsts to detcrmirie thc dyriarnic elas- tic constants of piezoelectric rriatcrials. Making usc of the resonant frequencies and vibration mode shapes for piezo- electric materials obtaincd by thc AF-ESP1 optical system, an inverse algoritlini of the material constants is developcd by the authors, arid a good resiilt is obtained. A l‘iirther in- vestigation and results rclated to thc non-destructive eval- uation of piezoclectric materials based on the AF-ESP1 mcthod will bc given in a follow-up report.
153
REFEILI*:NCES
P. K. Rastogi, Holographic interferometry. Berlin, Germany: Springer-Vcrlag, 1994. .J. N. But.ters and J. A. Lcendertz, “Speckle pattern and holo- graphic techniques in engineering metrology,” Opt. Laser Tech- nol., vol. 3, no. 1, pp. 26-30, 1971. R. .Jones and C. Wykes, Holograp/cic and Speckle Interferometry. Cambridge, England: Cambridge University I’rcss, 1989. 0. J. Lflkberg and K. Hogmoen, “Use of niodrilated reference wave in elcct,ronic speckle pattern interferometry,” J. Phys. E: Sci. Instrum., vol. 9, pp. 847-851, 1976. A.P.M. Hurdcn, “An instrument for vibration mode arialysis 11s-
ing electronic spcckle pattern interferometry,” ND’T Int., vol. 15, no. 3 , pp. 143-148, 1982. >I. C. Shellabcar and 3 . R. Tyrer, “Application of ESP1 to three- dimensional vibration measuremcids,” Opt. Lasers h g . , vol. 15, no. 1, pp. 43-56, 1991. 0. J. Lmkbcrg, “Mapping of in-plane vibration modes hy elec- tronic succkle pattcrn interfcrometrv.” Ogt. Enq., vol. 24, no. 2, . . pp. 356-359, 1985. K. Crcat~i and G. A. Slettcrnoen, “Vibration-observatioii tech- nioiies for dirital snecklc-Dattern interferoinot,rv.” J . Ont. Soc. ._ . ” . Amer. A , vol. 2, no. 10, pp. 1629-1636, 1985. n. Pouet, T. Chatters, and S. Krishnaswamy, “Synchronized referencc updating tcchniqiic for electronic speckle interferomc- try.” J. Nondestr. E?Ju~.. vol. 12. no. 2, IID. 133-138. 1993. ” . , ..
[lo] W. C. Wang, C. 11. Hwang, and’s. Y . Lin, “Vibration mcasnre- ment by the tirue-averaged electronic speckle pattern intcrfer- ornctry methods,’’ Appl. Opt., vol. 35, no. 22, pp. 4502-4509, 1996.
[11] E. K. Dimitriadis, C. R. Fuller, and C. A. Rogers, “Piezoelcctric actuators for distributed vibration excitation of thin plates,” J .
[12] D. A. Berlincourt, D. K. Curran, and H. Jaffe, “Piezoclectric and piezomagnetic materials and their function in transduc- ers,” Phys. Acoust., vol. 1(A), pp. lfi9-270, 19fi4.
vib. ACOUSL., VOI. 113, pp. 1on--in7, 1991.
[13] J. Zelenka, Piezoelectric Resonators and Their Application. Czech Republic, Prague: AcadcmialPraguc, 1986.
[14] H. F. Tierstcn, Linear i’iezoeleclric Plate Vibrations. New York: Plemini Press, 1969.
[15] E. P. Eer Nissc, “Variational method for elcctroelastic vibration analysis,” IEEE Trans. Sonics Ultrason., vol. SU-14, no. 4, pp. .~ 153-160, 19G7.
[lo] E.A.G. Shaw, “On the resonant vibrations of thick barium ti- tanate disks,” J . Acoust. Soc. Amer., vol. 28, no. l , pp. 38-50, 1456
[ I T ] R.. IIolland, “Contour extensional resonant properties of rectan- gular pieaoclcctric plates,” Ifll3l3 Trans. Sonics Ultrason., vol. SU-15, no. 2, pp. 97-105, 1968.
[18] -, “Resonant properties of piczoelectric ceramics rectangular parallelepipetls,” .I. Acoust. Soc. Amer., vol. 43, no. 5, pp. 988- 997, 1968.
[19] Y . Kagawa and ’1’. Yamabuchi, “Finite element approach for a piezoelectric circular rod,” IEER Trans. Sonics Ultrason., vol. SU-23, no. 4, pp. 379-385, 1976.
[an] H. A. Kunkel, S. Loclce, and B. Pikeroen, “Finite-clement anal- vsis of vibrational modes in vicaoelectric ceramics disks.” IEEE 7’mns. Ultrason., Ferroelect., F r q . Contr., vol. 37, no. 4, pp. 316-328, 1990.
[all N. Guo, P. Cawley, and D. IIitchings, “Tlic finite element, anal- ysis of the vibration characteristics of piezoelectric discs,” J . Suund Vib., vol. 159, no. I, pp. 115 138, 1992.
[22] U. Koyimcu, “The investigation oC high frequency vibration rnotles of PZT-4 transducers using ESP1 techniques with rcf- crence beam modillation,” OplL Lasers En+, vol. I, pp. 37-48, 1980.
[23] J . R. Oswin, P. L. Salter, F. M. Santoyo, and J. R. Tyrer, “Elec- tronic speckle pattern interfcromctric measurcmcnt of flcxten- siorial transducer vibration patterns: In air and water,” .I. Sound Vib., vol. 172, no. 4, pp. 433-448, 1994.
[24] ADAQUS User’s Manual, ver. 5.5., Pawtucket, RI: Hibbit, Karlsson. arid Sorensen, Inc., 199.5.
C. C. Ma received the B.S. dcgree in agri- culture engineering from the National Taiwan University, Taiwan i n 1978 and the M.S. and Ph.D. degrccs in mechanical crigineeririg from Brown University, R I in 1982 and 1984, re- spectively. Ron1 1984 to 1985, he workcd as a postdoc in the Engineering Division, Brown University. In 1985, he joined the faculty of the Department of Mechanical Engineering, National Taiwan University, Taiwan, Repub- lic of China, as an associate professor. He was promoted to full professor in 1989. His re-
search interests are in the fields of wave propagation in solids, frrx- ture mechanics, solid mechauics, and vibration analysis.
C . H. Huang received his B.S., M.S., and Ph.D. degrccs in mechanical engineering from the National Taiwan University in 1987, 1992, and 1998, respectively. In 1998, he bcgaii working at Ching Yun Institutc of Tcchnol- ogy as an associate professor and has been Chairman of the Mechanical Engineering Do- partment since 1999. His ciirrcnt research In- terests include experimcntal optical measure- mcnt and dynamic behavior of piezoelectric materials.
Authorized licensed use limited to: National Taiwan University. Downloaded on October 31, 2008 at 02:51 from IEEE Xplore. Restrictions apply.