
The Investigation of Newly Designed Transformer Windings ...
69
i High Voltage Technology and Asset Management The Investigation of Newly Designed Transformer Windings with Reduced Thickness of Oil- Impregnated Paper Insulation Adrian-Ionuţ Singuran September 2012
Transcript of The Investigation of Newly Designed Transformer Windings ...

i
High Voltage Technology and Asset Management
The Investigation of Newly Designed Transformer
Windings with Reduced Thickness of Oil-
Impregnated Paper Insulation
Adrian-Ionuţ Singuran
September 2012

Thesis Committee Members:
Prof. dr. J.J. Smit
Dr. ir. P.H.F. Morshuis
Dr. ir. A. Bossche
Ir. C.J.G. Spoorenberg
Ing. P.V.M.van Nes
Delft University of Technology
Faculty of Electrical Engineering, Mathematics and Computer Science
Department of Electrical Sustainable Energy
High-Voltage Technology and Management Group
June 2012
Student number: 4116526
E-mail address: asinguran@ tudelft.nl or [email protected]
Copyright © 2012 by A.I. Singuran, Delft University of Technology and Smit Transformers.

To my niece Lorelai,
Who helped me overcome all the difficulties with her big and graceful smile.


v
Abstract
The power transformer is a key component of the electrical network as it links the
generators, the transmission lines and the distribution networks. In order to ensure that the
electrical power systems is operating in an efficient, reliable and effective manner, the manufacturer
are obliged to produce power transformers that will successfully fulfill the increasingly dependency
on the availability of the electrical power.
Oil-impregnated paper insulation is still widely applied in power transformers, despite the
competition with a variety of synthetic materials. Used for its high intrinsic insulation strength, the
mineral oil used in the transformer tank also serves as cooling medium by either natural or direct
flow. Considered an empirical state of art, the design of a power transformer is a time consuming
process imposed by the large number of design parameters. One of the most important design
parameters is the rated insulation level of the transformer windings, which have an important
influence over the final cost of production for power transformers.
As the power transformer is expected to withstand overvoltages during service life operation,
the lightning impulse test is often a determining factor in the design of the insulation. Defined as the
level of the full wave lightning impulse that the power transformer insulation has to withstand
without any damage or flashover the basic insulation level will determine the insulation dimensions
of the power transformer.
For determining the insulation dimensions, Smit Transformers uses a so called “design
curve”. As the oil-impregnated paper insulation of the windings has been improved, a new design
curve has to be established. A number of different types of transformer winding samples were
subject to lightning impulse tests. The breakdown voltages measured from step-up tests with full and
chopped impulse waves were recorded. The breakdown data population for each type of winding
sample was subject to censor, due to outliers, due to breakdowns that took place at the front of the
wave shape and due to the fact that some samples were not identical.
The possibility of oil quality degradation during testing was investigated by means of oil
quality check for samples taken from the tank before and after testing and by means of statistical
analysis on measurement data taken from two identical series of the same winding type. With the
help of Weibull software analysis, also the breakdown data from full and chopped wave impulses
were compared. As the Weibull distributions could be considered comparable, the breakdown data
from both impulses was merged for each type of winding sample.
The merged breakdown data population was again subject to Weibull analysis and using the
1 percentile intervals, the new design curves for transformer winding could be built. Although no
safety factors were applied, the new design curves present significant increase of breakdown voltage
at the same thickness, when they are compared with the old design curve.


vii
Contents
Abstract .................................................................................................................................................... v
Chapter 1 Introduction ........................................................................................................................... 1
1.1 General .......................................................................................................................................... 1
1.2 Oil-impregnated paper insulation coordination............................................................................ 2
1.3 Aim of the thesis ............................................................................................................................ 2
1.4 Outline of the thesis ...................................................................................................................... 3
Chapter 2 Theoretical background ......................................................................................................... 4
2.1 Oil paper insulation ....................................................................................................................... 4
2.1.1 Mineral oil .............................................................................................................................. 4
2.1.2 Cellulosic Paper ...................................................................................................................... 5
2.1.3 Impregnation process ............................................................................................................. 5
2.2 Winding insulation system ............................................................................................................ 6
2.2.1 Conductor material and types of conductors......................................................................... 6
2.2.2 Types of transformer winding arrangement .......................................................................... 6
2.3 Insulation stresses ......................................................................................................................... 7
2.3.1 Classification of dielectric stresses ......................................................................................... 8
2.3.2 Capacitance network .............................................................................................................. 9
2.4 Breakdown mechanism of oil impregnated paper insulation ..................................................... 10
2.4.1 Steps in breakdown process ................................................................................................. 10
2.4.2 Breakdown process dependency on insulation thickness .................................................... 11
Chapter 3 Experimenthal methods ...................................................................................................... 14
3.1 Purpose of the tests .................................................................................................................... 14
3.2 Impulse wave testing ................................................................................................................... 14
3.3 Winding constructions used for testing ...................................................................................... 16
3.3.1 Conductor dimensions.......................................................................................................... 16
3.3.2 Paper insulation .................................................................................................................... 17
3.3.3 Types of test samples ........................................................................................................... 18
3.4 Test setup description ................................................................................................................. 19
3.5 Applied impulse voltages............................................................................................................. 23

viii
Chapter 4 Analysis of experimental results .......................................................................................... 25
4.1 Experimental procedures ............................................................................................................ 25
4.1.1 Censoring the breakdown data population .......................................................................... 26
4.2 Statistical analysis of the breakdown data .................................................................................. 27
4.2.1 Weibull distribution analysis ................................................................................................ 28
4.2.2 Weibull distribution parameters of investigation ................................................................ 28
4.3 Study of reduction of the oil quality ............................................................................................ 30
4.3.1 Oil quality check using measurement techniques ................................................................ 31
4.3.2 Oil quality statistical analysis ................................................................................................ 33
4.4 V-t curve characteristic ................................................................................................................ 41
4.5 Comparison between full wave and chopped wave results ....................................................... 42
4.5 Study on the behavior of breakdown voltage due to adding enamel and due to paper
registration changes .......................................................................................................................... 45
4.5.1 Study on the behavior of breakdown voltage due to adding enamel on the conductor’s
surface ........................................................................................................................................... 45
4.5.2 Study on the behavior of breakdown voltage due to changes in paper registration .......... 47
4.6 Design lines for transformer winding insulation coordination ................................................... 48
Chapter 5 Conclusions and recommendations .................................................................................... 56
5.1 Summary and conclusions ........................................................................................................... 56
5.2 Recommendations for future research ....................................................................................... 57
Appendix A ............................................................................................................................................ 58
Appendix B .......................................................................................................................................... 113
Appendix C........................................................................................................................................... 136
Appendix D .......................................................................................................................................... 154
Bibliography ......................................................................................................................................... 163
Acknowledgements ............................................................................................................................. 166

1
Chapter 1
INTRODUCTION
1.1 General
Influenced by the energy consumption, the progress and development of transmission and
distribution of electrical energy was impressive during the last century [1]. Due to the economic crisis
and its consequences, the energy consumption in Europe and in other parts of the world stagnated
or even dropped [2]. But the large-scale introduction of renewable energy, like wind and solar
energy, will cause a larger energy flow between production regions and arias of consumption.
Another important aspect is the fact that nowadays a considerable part of the network
system from the developed countries consists of components that have almost reached the end of
their designed lifetime. Adding to this, there is constant pressure of economic and public
considerations, which includes continuously fulfillment of energy demand, assuring the standard
quality limits for delivered voltage and frequency and, also, environmental and health issues. Due to
these considerations, the power utilities are forced to introduce condition-based maintenance
instead of time-based and corrective-based maintenance [3]. This trend may prove to be helpful for
the power transformer manufacturers because a lot of information will be gained. This information
will influence the design criteria of the transformers in order to have their expected lifetime at least
as the old power transformers.
Power transformers are among the most expensive and important equipment in the power
system network. As depicted in figure 1.1, they are the key element in this important system, as they
link the generators, the transmission lines and the distribution networks. With their unique ability,
the power transformers are able to change the voltage to different requirements. By simply
Figure 1.1 Overview of the electrical network, from generation to the end-consumers [4].

Chapter 1 Introduction
2
inductively coupling primary and secondary windings, the voltage is determined by the windings
turns ratio. Due to the fact that losses which occur in the process are relatively small, the power that
is transferred between the circuits is almost unaltered [5].
High reliability and availability at acceptable costs and risks has to be taken into
consideration when delivering electrical power to the end consumers. In nowadays society, all the
equipment in the electric grid plays a crucial role in satisfying the customers demand. The operation
and functionality of the grid rely on the proper functioning of the power transformers, in order to
fulfill the increasingly dependency on availability of the power [6].
If failure occurs in a power transformer, the power system will be subject to an irreparable
loss, as the power delivery will be interrupted. Being a major capital investment, with construction
duration up to 18 months, the power transformers are usually very reliable [7]. But if problems
occur, they are difficult to diagnose and costly to correct. In order to avoid this complicated situation,
the manufacturers are obliged to produce power transformers that are capable of functioning under
operating condition in an effective, reliable, efficient and also economical manner.
1.2 Oil-impregnated paper insulation coordination
Despite the competition with a variety of synthetic materials, oil impregnated paper is still
used in high voltage equipment, especially in power transformers. In order to be used as an electrical
insulator, the paper is first dried under vacuum at elevated temperature and then it is vacuum-
impregnated with insulating oil [8]. The paper represents a critical point for the breakdown strength,
because bad paper quality will give insulation degradation, which will lead to breakdown of the
transformer insulation. The oil in the transformer tank is used because it has high intrinsic insulation
strength and because it provides a good cooling medium for the windings, by natural or direct flow.
Beside the dielectric requirements, the transformer windings should be able to withstand
mechanical and thermal stresses. Due to large mechanical forces that are produced by short-circuit
currents, axial displacement or radial deformation of the transformer windings could reduce the
ability of withstanding dielectric stress [9].
The challenge of transformer design is imposed by the large number of design parameters.
The combinations of the high impulse strength that should be maintained in a transformer and the
complicated insulation geometry will result in a low average electric stress in the total construction.
Compared with the stress values used in capacitors or cables, the stress value in transformers is
usually five times smaller [10].
Designing a power transformer is a time consuming process. Considered by many to be old
and empirical state-of-art, the design process is always changing according to material advances,
changes of requirements, technical improvements or even market demands. Smit Transformers B.V.,
for instance, is investigating the possible change of the insulation coordination, by aiming at thinner
paper insulation with the same basic impulse insulation level. If successful, transformer production
costs are reduced, because less material is needed for the insulation and the time required for
transformer construction is decreased. Also the efficiency of the power transformer is improved, as
thinner insulation involves better heat dissipation obtained between the transformer windings.
1.3 Aim of the thesis
This master thesis project is a part of Smit Transformers B.V. project that was started a
couple of years ago. This project involving the power transformer manufacturer is dedicated to
analyze the behavior of the breakdown strength of a new design of power transformer windings.

Chapter 1 Introduction
3
There were also other parties that were involved in this project, students from Fontys
Hogeschool Eindhoven that worked on two different parts of the project. These studies were related
to statistical analysis on measured data and also developing a model for the breakdown strength.
Both reports gave precious information for completing this master thesis.
The aim of the thesis is to investigate whether thinner paper can be used for winding
insulation by measuring the breakdown voltage values of the samples that are simulating newly
designed transformer windings. The breakdown strength of the oil-impregnated samples is
determined by means of step-up breakdown testing with standardized full wave lightning impulses,
chopped wave lightning impulses and with special impulse waves. These special wave shapes were
measured on the active part of the transformer when standard lightning impulses were applied.
With the help from a powerful software tool, these values are investigated in order to
conclude whether this newly designed oil-impregnated paper insulation will prove to be an
improvement for future generation of power transformers. As tests are performed both on newly
designed insulation samples and on older samples, the analysis of the breakdown results can clearly
indicate if the insulation coordination of the transformer is improved.
1.4 Outline of the thesis
This part of the thesis briefly explains the chronological process of the chapters used in order
to achieve the goals of the thesis.
In chapter 2, the background theory of oil impregnated paper insulation is presented,
including the winding insulation construction, the main stresses and breakdown mechanisms that
could appear in a transformer. Also, some examples that explain the characteristics of breakdown
are given.
The experimental test setup along with a description of the test specimens is explained in
chapter 3. Further, it is described why impulse wave testing is important when designing new
insulation. The requirements and the purpose of the tests that are done in the High Voltage
Laboratory, all the types of samples that were tested and all the applied impulses are also described
in this chapter.
Chapter 4 contains the results of the step-up breakdown tests and the interpretation and
analysis of the results. This chapter includes also an analysis of the breakdown results, an analysis
which proved to be valuable by giving important information regarding the dispersion of measured
data. Oil analysis, by means of humidity and breakdown strength tests, were regularly performed in
order to check if the insulation properties of the mineral oil are not influenced by the breakdowns
that take place in the oil tank. Using the statistical software tool Weibull ++, the measured data was
analyzed, interpreted and compared with different population of breakdown values obtained earlier
in the Smit Transformers B.V. Project.
In chapter 5, the conclusions are presented. Some future recommendations for the tests to
follow in this project are also included in this final chapter.

4
Chapter 2
THEORETICAL BACKGROUND
2.1 Oil paper insulation
Although the properties of synthetic materials are more advantageous (lower tan δ,
increased dielectric strength and lower moisture absorption), oil impregnated cellulose paper is still
the most commonly used type of insulation for high voltage equipment. Due to the paper’s porous
structure, this type of insulation becomes an oil filled fibrous structure. During the impregnation
process, all the cavities disappear and inclusions and defects are surrounded by oil. As oil
impregnated paper insulation is used in a multilayer structure, a possible defect, if present, will be
restricted only to that layer [11]. Compared with other insulating materials, this is advantageous
because the treeing formation that could lead to breakdown is restricted.
2.1.1 Mineral oil
Classified as an organic insulator, the mineral oil represents the best alternative to price-
performance behavior. Still serving as the major type of liquid insulation, mineral oil is used not only
in transformers, but also in power cables, power capacitors, circuit breakers and bushings.
Mineral oil can vary greatly in composition, but the main elements that constitute this liquid
insulator are carbon and hydrogen. As illustrated in figure 2.1, the mixture of hydrocarbon
compounds can occur in three types of structures: paraffins, naphthenes and aromatics.
Figure 2.1 Hydrocarbon configurations for typical mineral oil molecule: a) paraffin chain structure;
b) napththene structure; c) aromatic ring structure; d) typical oil molecule [12],[13].
The mix and treatment of these compounds will give different chemical properties which will further
influence the physical properties of the mineral oil, as chemical degradation will be limited and so
the mechanical and breakdown strength will remain intact. A good combination of viscosity and good

Chapter 2 Theoretical Background
5
electrical properties can be achieved, so that the mineral oil that will be used in transformers could
perform within required parameters. The mineral oil requires having as low humidity as possible, a
small absorption coefficient and impurities should not be present.
The main function of the mineral oil in a transformer is electric insulation. The secondary
function is to provide a heat removing environment for the transformer conductors. An equally
important function of the mineral oil is to provide information regarding the operating conditions.
Like blood is providing information about the human body, so the mineral oil provides useful
diagnostic information about the condition of the transformer. Chemical changes of the transformer
oil indicate faults that appear inside the transformer [14].
2.1.2 Cellulosic Paper
A special type of paper, known as Kraft paper, is used for insulation purposes in transformers.
Depending on the paper’s application, this material can come in different thickness or density.
There is a close relation between the permittivity of the paper, the porosity and the dielectric
strength. The permittivity increases if the density of the paper increases and this will result in a
decrease of the dielectric strength. If the porosity increases, the dielectric strength will decrease, as
there will be less paper fibers to withstand the breakdown.
Designed as a thermally upgraded paper, the basic configuration of the transformer paper is
presented in figure 2.2. Consisting of repetitive glucose units, the paper fiber molecules form a rather
inhomogeneous material structure. The paper should be able to withstand a high field strength at
elevated temperatures, as it represents a critical part in the insulation of the transformer [15].
Figure 2.2 Cellulose molecule configuration of transformer paper [15].
If the cellulose consists of 10-20% hemicellulose components and 2-6% lignin, less
degradation of the insulating paper was obtained at elevated temperatures. Different chemical
reactions of cellulose degradation are avoided. These reactions not only were deteriorating the
insulating properties of old paper, but they were also accelerating the process of releasing impurities
in the mineral oil.
2.1.3 Impregnation process
Being a hygroscopic material, the cellulosic paper first needs to be dried and then
impregnated with mineral oil. As moisture has an adverse effect on the dielectric properties of the
paper, it has to be removed carefully, without damaging the structure of the material. So, the first
step in the impregnation process is vacuum drying at elevated temperature (120°).
The second step is saturating the paper with impregnating oil. This is also a process that
should be performed at elevated temperatures and vacuum, stimulating the evaporation of gas and
increasing the viscosity of the oil. The impregnation is dependent on the cavity size and the nature of
the oil. The chemical interaction between the solid and liquid insulators is limited, but as the oil-
impregnated paper reaches a certain age, it decomposes gradually due to heat dissipation [16].

Chapter 2 Theoretical Background
6
2.2 Winding insulation system
In any power transformer, the windings form an essential feature. Various winding
constructions are used by transformer manufacturers all over the world, but the most common is the
core-type transformer with concentric windings.
2.2.1 Conductor material and types of conductors
The material used for building the transformer conductors is almost exclusively copper. Its
excellent mechanical properties combined with high conductivity values make copper the best choice
for conductor manufacturing [17].
Although silver is recognized to be the best electrical conductor that can be used, it is evident
that designing the transformer with silver conductors is economically inefficient. Due to financial
constraints and sometimes for technical reasons, occasionally aluminum conductors are chosen.
At most of the power transformer manufacturers there is a tendency to use rectangular
shaped conductors. The form of the conductors come in large variety, as the conductors could be
single bulk conductor or continuously transposed conductor. As it can be seen in figure 2.3, a number
of rectangular copper conductors that are each isolated with enamel are transposed at regular
intervals. The advantage of this conductor construction is that eddy current flow through the
conductor is reduced.
Figure 2.3 Continuously transposed copper conductor (CTC) [18].
2.2.2 Types of transformer winding arrangement
Winding design depends on two parameters: the voltage and the current that will flow throw
the conductors. In order to fulfill the insulation coordination, the transformer designer intends to fit
in the smallest physical space as much conductive medium as possible [19]. As depicted in figure
2.4a, the simplest winding system is the helical type or the spiral type, in which each of the windings
are placed against their neighbor, wounded around a core.

Chapter 2 Theoretical Background
7
Figure 2.4 Types of transformer windings: a) spiral (helical) winding; b) disc winding [19],[20].
The radial spacer helical winding type should be used if larger conductors are used. This
construction type introduces radial cooling oil ducts that help remove the heat generated by
conductor losses. If higher voltage level should be achieved, then the cross-section of the conductor
decreases, but the number of turns increases.
To design for an optimal use of space utilization, a disc arrangement of the windings will be
required, as shown in figure 2.4b. By using edge protectors for each disc arrangement and by making
use of an interleaving disc winding construction, a good dielectric control is obtained.
In order to avoid the ampere-turn voids (the mismatch ampere-turns between the windings)
that could occur along the length of the winding, on large power transformers a dedicated tap
winding is used. The configuration of this type of winding along with low voltage winding and high
voltage winding may differ according to the application and the manufacturer.
2.3 Insulation stresses
Beside the dielectric stresses, the transformer windings are subject also to thermal and
mechanical stresses. Thermal stresses occur due to the fact that heat is produced by means of
resistive losses, stray losses. Windings also have to withstand mechanical forces due to possible
short-circuit in the windings or to vibrations. These non-electric stresses will not be treated in this
thesis.

Chapter 2 Theoretical Background
8
2.3.1 Classification of dielectric stresses
During operation, the transformer windings may encounter the following dielectric stresses [21,
22]:
• Power frequency voltage;
• Temporary overvoltages;
• Switching impulses;
• Lightning impulses.
Figure 2.5 Classification of dielectric stress [23].
At normal operating conditions, the windings need to fulfill the demand for uninterrupted
service. For the purpose of insulation coordination, overheating due to dielectric losses should be
prevented, partial discharges should be limited and treeing formation should be avoided.
Temporary higher AC overvoltages in the grid could have amplitudes as high as 1.5 times
nominal voltage with a duration of seconds, until the fault is cleared. Temporary overvoltages occur
due to load rejection, earth faults and resonance and ferroresonance conditions.
According to the International Electrotechnical Commission (IEC) standards, the switching
oscillating transients can occur with frequencies between some hundreds of hertz up to several
thousands of hertz. For testing purposes, a unipolar switching impulse was standardized, with a front
wave duration of 250 μs and a tail attenuation until half of peak value of 2500 μs. However, for
testing power transformers, the switching impulse test has to be modified because it will be
influenced by the saturation effect of the transformer.
Travelling waves could be produced on transmission lines by connecting and disconnecting
unloaded lines, disconnecting unloaded transformers and switching off short-circuits. A particular
case of overvoltage could be obtained at the power transformer if the circuit breaker poles are not
simultaneously interrupted, in which case the crest value could reach five times the nominal voltage.
Lightning surges can have two causes. Most likely possibility is the case when lightning strikes
the tower or the ground protective wires. In this case, travelling waves are created when a voltage is
induced in the conductors or when there is a back flashover of the insulation strings. The other
possibility is when there is a direct strike on the phase wire. In this case, overvoltages of several
megavolts can result due to the current injected by the lightning and the characteristic impedance of
the line.
IEC test specifications state that there must be a standardized impulse with a front duration
of the order of 1.2 μs and 50 μs tail duration. Impulse lightning wave testing will be discussed later in
the next chapter.

Chapter 2 Theoretical Background
9
2.3.2 Capacitance network
In particular, the very short duration of the lightning impulse is important, as it gives the
transformer windings’ capacitance a much more predominant effect compared to power frequencies
[24]. A good way to determine the voltage distribution is to use capacitance networks to model the
transformer windings.
Especially for the two or three microseconds of the impulse wave, a non-uniform voltage
distribution is obtained in the coils, as shown in figure 2.6, with considerable variations at different
parts of the winding. The self-inductions corresponding to a high frequency impulse wave constitute
very large impedances. For this reason, a pure capacitive network is used, with interlayer
capacitances and stray capacitances (�� and��).
Figure 2.6 Equivalent capacity network (a) and potential distribution (b) [24].
The highest voltage drop appears at the winding turns that are closest to the location where the
lightning impulse wave reaches the transformer windings. In order to reduce this high voltage drop
or the impact therefor, several methods can be applied:
• Over-insulate the end turns of the line;
• Utilization of shields between the windings;
• Interleaved disc construction of the winding.
The first solution might be cheap and viable, but the effectiveness of this method will be reduced
when the voltage is increased. By making use of an inter-shielded construction, the capacitance
network can be modified, obtaining a more linear voltage distribution of the windings. Another
method to increase the series capacitance of the winding is to have an interleaved disc construction.
In this way a high series capacitance can be obtained from the capacitance between the axially
arranged coils.
In some cases, a combination of solid insulation material and oil is built between the windings,
allowing the cooling oil to flow between the windings. The advantage of using solid barriers is that
the small oil volume between the windings will increase the withstand voltage stress.

Chapter 2 Theoretical Background
10
2.4 Breakdown mechanism of oil impregnated paper insulation
The breakdown process of oil impregnated paper is a complicated phenomenon. An
appropriate method to explain this phenomenon is to approach first the description of the solid and
the liquid failure phenomena separately.
The breakdown of solid insulation is a complex phenomenon, depending on the duration of
voltage application [25]. As represented in figure 2.7, for lightning impulse, the breakdown can be an
intrinsic type, an avalanche type and an electromechanical type.
Figure 2.7 Variation of breakdown strength with duration of stress [25].
The breakdown in liquid is governed by impurities, ageing process of the liquid and by space
charges. In case of new mineral oil, the breakdown strength is high in absence of defects. The
mineral oil has a permittivity of 2.2, compared with the one of paper insulation which is 4.5. So, it
could be stated that the electric field in the mineral oil is almost two times the electric field in paper
insulation. Therefore, the weakest point in an oil impregnated paper configuration is the oil gap
between paper layers [26].
In transformer windings, the oil-paper interfaces are perpendicular to the electric field. This
combined with the fact that the oil between the paper layers is dried, well-filtered and gas free
results in reaching intrinsic high breakdown value. On industrial scale, the oil paper insulation is the
only example in high voltage engineering where intrinsic breakdown values could be obtained.
2.4.1 Steps in breakdown process
The surface of the copper conductor also plays an important role in the breakdown process.
If the surface of the conductor is not smooth enough and it present protrusions and defects, the
electric field will increase in the defect region, decreasing the breakdown strength of the windings.
When multiple lightning impulses are applied to the winding sample, discharges could appear
at the surface of the HV conductor [27]. These discharges appear at voltages below the breakdown
voltages of winding sample. As the impulses are repeated, the discharges leave permanent marks on
the surface of the dielectric, leading to a cumulative damage that will reduce the value of voltage
that could puncture the first paper layer.
As this test consists of repeated impulses of the same polarity, it is expected that the
subsequent discharges are shorter than the first one. This could be explained by the fact that residual
charge remain on the surface of the first paper layer. As this charge has the same polarity with the
impulse, it will reduce he local field at the place of the conductor where the discharges started. After
the breakdown took place and the sample is removed from the tank, small sparks are obtained at the

Chapter 2 Theoretical Background
11
surface of the windings, thus demonstrating that the residual charge was still present on the
dielectric surface.
The second step in breakdown process starts in the oil between the conductor and the first
paper layer and it develops to an ionized breakdown channel. If the discharges are starting at the
location that is in line with the gap between the first paper layers, then the ionized breakdown
channel forms in the oil gap.
As the channel extends through the oil, the propagation of the channel becomes faster
because the voltage gradient at the tip of the channel becomes stronger. When the breakdown
channel reaches the paper layer, similar surface discharges occur with those from the conductor,
tough on a smaller scale. The puncture of the paper layer follows rapidly and the process repeats
itself.
2.4.2 Breakdown process dependency on insulation thickness
In order to understand better the breakdown process some of the tested winding samples
were carefully investigated after their breakdown. It was observed that there are some differences in
the breakdown paths depending on the thickness of the oil-impregnated paper insulation. As shown
in figure 2.8 a), for 10 layers thickness (or less), the breakdown path appears as a straight line, that
punctures all the paper layers perpendicularly.
In figure 2.8c) it can be observed that the breakdown path chooses the smallest distance
between the electrodes, by bridging the neighbor corners of both conductors of the winding sample.
Compared to this, the example in figure 2.8d) shows that, for thicker insulation, the breakdown
chooses a more complex path. In this case, the start and end points of the breakdown path could be
formed at any place on both conductors surface, even forming from the opposite edges of the
conductors.
After a number of paper layers have been punctured, it can be seen from figure 2.8b) that
the breakdown path starts to deviate. In this region, carbonized trees between paper layers are
produced [28]. The reason for this tree formation is that the potential of the 10th paper layer has
changed from its normal value (intermediate between high voltage and ground conductor). It
approaches the potential that is similar to the conductor from which the breakdown started, as for
the neighbor paper layers, they maintain their intermediate potential. This creates the opportunity
for lateral breakdown, as the electrical strength is lower in that direction.

Chapter 2 Theoretical Background
12
Figure 2.8 Breakdown dependency on insulation thickness: a) breakdown path for thinner insulation (7 paper
layers); b) breakdown path for thicker insulation (16 paper layers); c) location of breakdown for thinner
insulation; d) breakdown behavior for thicker insulation.
An interesting example of the breakdown path is illustrated in figure 2.9, where the
breakdown path develops into two distinct channels. One of the breakdown channels stops at a
certain place, but the other one bridges the conductors. This demonstrates that the theory of the
steps in breakdown process and the theory of lateral breakdown are valid.

Chapter 2 Theoretical Background
13
Figure 2.9 Breakdown path example with two breakdown channels.
During testing of winding samples with thick oil-impregnated paper insulation and after the
breakdown took place, changes in the color at the surface of the paper layers could be observed. This
spots that are presented in figure 2.10 are uniformly spread along both conductors and they
appeared when the samples were tested with lightning impulses with peak values of over 200 kV.
Figure 2.10 Spots formation during testing of winding samples with thicker insulation
Being a HV winding, these types of samples, which presented the spots on the surface of the
paper insulation, have small dimension for the copper conductor. As the amount of energy released
during lightning impulse tests is considerably high, large forces are applied to the conductors. Due to
these forces, the conductors bend and the paper layers that form the oil-impregnated paper
insulation are pressed. As a result, the oil between the paper layers is forced outside and the change
of color becomes visible.
This phenomenon was investigated also by doing an experiment. Just before the sample
broke down, the tests were ceased. After some time, the spots disappear as the paper layers
configuration went to its initial state. When the tests were restarted, the spots appeared again.

14
Chapter 3
Experimental methods
3.1 Purpose of the tests
The design of the winding insulation system is considered state of art and it involves
knowledge from high voltage engineering and also mathematical background regarding the statistical
analysis.
Attaining a reduction in the dimension of the insulation of the transformer windings will
optimize the cost and will improve the efficiency of a power transformer. Manufacturing saving are
achieved not only by using less insulating material, but also by reducing the time required for
producing the windings. From the technical point of view, thinner paper insulation for the same
dimensions and requirements of power transformers will lead to a larger oil gap between the
windings. The result of this improvement will be that the heat transfer will increase, reducing the
thermal stress applied to the windings.
Lightning impulse tests are applied to both new design windings and windings that are
currently used in the manufacturing process of power transformers. Measurements that were
performed before this project started will be taken into consideration, in order to apply statistics on
a larger number of results.
The reliability of the oil impregnated paper windings is established by the ability of the
insulation to withstand these transient voltages [29]. Therefore Smit Transformers wants to confirm
the correct design of the high voltage winding insulation, ensuring that the new built power
transformers will be capable of performing to requirements.
3.2 Impulse wave testing
When in service, the power transformer is expected to withstand voltage conditions under
normal operation. Occasionally, high frequency transient overvoltages that are caused by lightning
and switching phenomena can occur. In order to simulate these transients, standardized lightning
and switching impulse test are created. To ensure the dielectric quality of new insulating material,
lightning impulse testing is needed.
Standardized impulse tests are used for achieving the test specification that will describe the
behavior of the insulation. Impulses are applied for the following types of tests: type tests, sample
tests and routine tests.
Sample tests are destructive tests and routine tests are non-destructive tests. Both are done
after the manufacturing process is finished. These tests are done according to IEC 60076 standards to
check if the design requirements are checked and if quality and performances are within a
guaranteed tolerance.
As destructive tests, the type tests are done on newly designed component or subsystem of
power transformers. After these tests are done, they are not repeated unless essential changes are
made in the design of the high voltage system or component. Lightning impulse test is often a
determining factor in the design of the insulation [30].

Chapter 3 Experimental Methods
15
Insulation dimensions of power transformer are determined by basic insulation level (BIL),
which depends on the nominal operating voltage. BIL can be defined as the level of the full wave
lightning impulse that the power transformer insulation has to withstand without any damage or
flashover.
Although the shape of lightning overvoltages varies strongly, it became necessary to simulate
this kind of transient voltages in a simple manner for testing purposes. IEC Standard 60060 defines
the lightning impulse (LI) as a unidirectional voltage which rises more or less rapidly to a peak value
and then decays relatively slowly to zero.
Figure 3.1 Lightning impulse (LI) wave shape: a) full LI; b) chopped LI on the tail; c) chopped LI on the front [31].

Chapter 3 Experimental Methods
16
In figure 3.1 a) it is shown the shape for the full LI voltage and the LI for the same voltage
chopped at the tail, as presented in figure 3.1 b) or on the front, as depicted in figure 3.1 c). Chopped
waves are simulating the effect of the protective gap flashover.
In order avoid the high frequency oscillations at the beginning of the impulse wave the virtual
origin �� is defined where the line AB cuts the time axis. Also a virtual parameter, the front time ��,
is defined as 1.67 times the interval T between the instants when the impulse is 30 % (A) and 90 % (B)
of the peak value for full or chopped LI. In front-chopped impulses case, the time to chopping �� is
almost equal to ��.
It is quite difficult to obtain a smooth slope within the first voltage rise, because the
measuring systems and the stray capacitances and inductances may be the cause of oscillations.
The front time �� is defined as 1.2 μs and the time to half-value � is 50 μs. Tolerances up to
30 % for �� and up to 20 % for � are allowed. Such impulse voltages are referred to as a ��/�
impulse, and therefore the 1.2/50 impulse is the accepted standard lightning impulse voltage.
3.3 Winding constructions used for testing
For testing purposes, samples were built to represent the windings inside the power
transformer. Different types of sample were tested in the TUDelft High Voltage Laboratory. The
conductor dimensions, the number of insulating paper layers, the degree of bending and the usage of
enamel protection are representative of different winding parts of a power transformer.
3.3.1 Conductor dimensions
As briefly explained in the previous chapter, the conductors that are used for power
transformers have a rectangular shape. In order to have a compact winding structure around the
core, this is a common shape for the copper conductors of the windings.
As presented in figure 3.2, the conductors used for the high voltage (HV) windings and the
low voltage (LV) windings differ. In a power transformer, the cross section of the conductors should
be in close relationship with the current rating. In case of using copper conductors, the design of the
winding must be done taking into consideration that the current density should remain between 2
and 4 A/mm² [32].
Figure 3.2 Winding arrangement: a) single compact conductor used for high voltage (HV) windings; b)
continuously transposed conductors (CTC) used for low voltage (LV) windings.
In case of HV windings, the cross section is considerably less compared to LV windings.
Consisting of a single compact conductor, the test samples representing HV windings have no enamel
applied at the surface of the conductor. However, there were some batches of samples that were
Chapter 3 Experimental Methods
17
built with and also without enamel layer, in order to prove the necessity of using this substance on
the surface of the metal.
The LV conductor is divided into a number of strands (sub-conductors) to reduce the eddy
current losses. These strands are transposed at regular intervals due to the fact that the higher
leakage fluxes through radial depth will induce higher voltages which will lead to larger circulating
currents. In a power transformer, the LV windings consist of continuously transposed conductors
(CTC), but due to the small length of the test samples, the LV samples presented only three
transpositions.
In both cases the conductor has round edges to allow a better coverage of the oil
impregnated paper insulation [33]. In this way, the formation of gaps between the paper layers is
avoided; if the edges of the conductor are not having a round shape, the paper insulation would not
have a flat section. In this manner, the structure of the windings becomes more compact. Another
reason for having round corners is that the field enhancement at the edges is reduced and that the
first paper layer would not be damaged, lowering the possibility of having breakdown in this part of
the winding.
3.3.2 Paper insulation
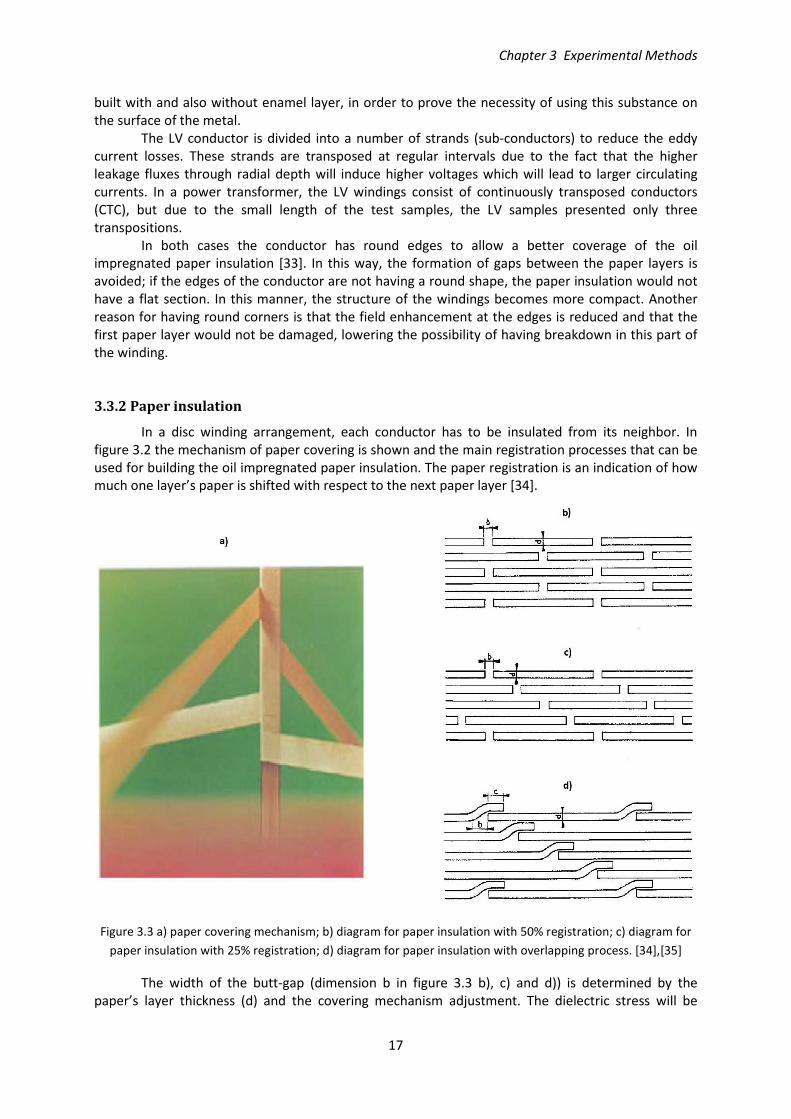
In a disc winding arrangement, each conductor has to be insulated from its neighbor. In
figure 3.2 the mechanism of paper covering is shown and the main registration processes that can be
used for building the oil impregnated paper insulation. The paper registration is an indication of how
much one layer’s paper is shifted with respect to the next paper layer [34].
Figure 3.3 a) paper covering mechanism; b) diagram for paper insulation with 50% registration; c) diagram for
paper insulation with 25% registration; d) diagram for paper insulation with overlapping process. [34],[35]
The width of the butt-gap (dimension b in figure 3.3 b), c) and d)) is determined by the
paper’s layer thickness (d) and the covering mechanism adjustment. The dielectric stress will be

Chapter 3 Experimental Methods
18
affected by the butt-gaps´ dimensions, as they form the weakest point in the dielectric structure of
oil impregnated paper insulation. For the same thickness of insulation, the 50% paper registration
has lower impulse breakdown strength compared with the 25% paper registration, as more butt-gaps
can be situated along the electric field line that is perpendicular to the dielectric [26],[34].
In case of transformer windings samples that were tested, the overlapping process of paper
registration was applied only to two paper layers that form the exterior part of the oil impregnated
paper insulation.
For a power transformer, the LV windings have modest voltages between the adjacent turns,
so the paper insulation thickness is lower compared with HV windings. As a result, few paper layers
with 50% registration are used for constructing the LV windings and a thicker multilayer structure of
both 50% and 25% paper registration is used for building the HV windings.
3.3.3 Types of test samples
A test specimen consists of two insulated conductors, which are connected to high voltage
and ground, respectively. Both conductors that are used for simulating the power transformer
winding construction have similar dimensions and geometry. On one conductor will be applied the
lightning impulse wave and the other one will be connected to ground. The main types of winding
sample geometry are shown in figure 3.4.
Figure 3.4 Types of winding samples: a) CTC type with extra insulation and small piece of board (2 and 3) at the
bend side; b) straight test samples with thinner conductors; c) small angle bent test samples with thinner
conductors.
The part of the samples that is of interest for testing is the middle of the winding. The middle
part will be divided into three sections that are limited by four outer paper layers (1). Separating the
area of interest of the tested windings was helpful for further investigation of the samples after the
breakdown took place. The outer paper layers are glued on the conductor’s insulation in order to
provide mechanical stability of the whole test sample.
Previous experience of Smit Transformers showed that problems can occur near the bend.
Breakdowns near the bend are avoided by placing extra insulation at each conductor´s ends. The

Chapter 3 Experimental Methods
19
insulation is improved by placing small pieces of pressboard (2 in figure 3.4) or by adding extra layers
of paper insulation at the bend as in case of CTC windings (3 in figure 3.4a)).
Figure 3.5 CTC winding sample with extra insulation required at the bend of winding samples.
An example of extra insulation placed at the bend side of the test samples is presented in
figure 3.5. The bending of the conductors at both sides increases the distance between the parts of
the test windings where no dielectric is present. This is done in order to avoid possible flashovers.
3.4 Test setup description
The lightning impulse testing of the samples was done according to IEC 60060-1 test
specifications. In figure 3.6 the test setup with the corresponding components is presented.
The transformer in series with a diode and a resistor is used as a DC source for charging the
Marx impulse generator. The transformer is rated at 30 KVA and is produced by Haefely.
The next device used in the test setup is the Marx generator. This device is a 20 stages
Haefely impulse generator that can provide up to 4MV lightning impulse waves. As the maximum
applied impulse voltage to the samples is only around 300kV and one stage could be used for 200kV
it results that the required number of stages that will be used for lightning impulse testing is only
two.

Chapter 3 Experimental Methods
20
Figure 3.6 Lightning impulse test setup consisting of two sections: high voltage part indicated in by
green line and the low voltage (control) part indicated by the blue square. The high voltage part
consists of: 1 - Supply transformer; 2- Marx impulse generator; 3 - Chopping device; 4 - Conductive
bar; 5 - Insulators; 6 - Oil tank in which the test samples are found; 7 - Resistors; 8 - Voltage divider.
The low voltage side consists of: 9 - coaxial cable; 10 - Digital recorder; 11 - Control unit.
The basic circuit of a single stage of impulse generator is shown in figure 3.7a). � is the
discharge capacitance that is used for storing the energy coming from the transformer. Compared
with the load capacitance ��, the discharge capacitance should be at least three times higher [36].
Figure 3.7 a) single stage impulse generator; b) multistage impulse generator [36]
The arrangement of the tail and front resistors inside the Marx generator is based on
practical reasons, in order to be adjusted for delivering the required impulse. The values of both type
of resistance are marked with different colors so they could be easily recognized. The second sphere
gaps are placed near the tail resistor in order to increase the efficiency of the stage and to have the
possibility of adding a parallel tail resistor for switching impulses.

Chapter 3 Experimental Methods
21
The basic rule for the multistage generator is that the discharge capacitors should be charged
in parallel and discharged in series. As the sphere gaps are placed diagonally between the stages, it
allows the high voltage impulse wave to be generated as the first gap is triggered.
In figure 3.7b), the charging resistors � , needed for charging the generator, are placed in parallel
with the discharge resistors �. As the charging resistors should not to be damaged when the sphere
gaps are triggered, their value is chosen many times larger than � .
The output voltage of the impulse generator is a superposition of two exponential curves of
different signs created by the impulse generator [37]. These curves depend on two time constants
which are related to the front time and the half-value time.
As the test samples represent large capacitances, adjustments of the front resistance needed
to be taken on each type of sample. Affected by the inductance of the impulse generator and of the
front resistors, the generated standard impulse has to remain within the IEC standard tolerance of
±30% of the front time and less than ±5% for the overshoot [38].
Placed in parallel, the multiple chopping gap device is used for chopping the lightning
impulse waves that are produced by the impulse generator. When this device is triggered, a steep
wave is created as the impulse wave drops really fast to zero. If chopped waves are applied to the
samples, the triggering time for the chopping device is settled at 3μs. However, due to the delay in
the signal transmission, the recorded chopping time varies between 3.1μs and 3.5μs for every
applied impulse. The chopping device is designed also to serve as a load capacitor as it consists of
stacked capacitors with inserted damping resistors.
In figure 3.6 there are two resistors (7) placed on the left and on the right of the tank
position. The resistor that is placed in front of the capacitive voltage divider has a value of 300Ω and
it reduces the influence of existing inductance on the test circuit. This damping resistor consists of
one modular unit that also has the purpose to protect voltage divider from transients between the
tested sample and the divider, as the sample experiences a breakdown. Both resistors are influencing
the wave shape of the lightning impulse.
The samples that are tested are placed in an oil tank and submerged under oil until the test is
finished. If the sample is taken out of the tank then the oil drains from the paper layers, decreasing
the dielectric properties of oil paper insulation that was established during the impregnation process.
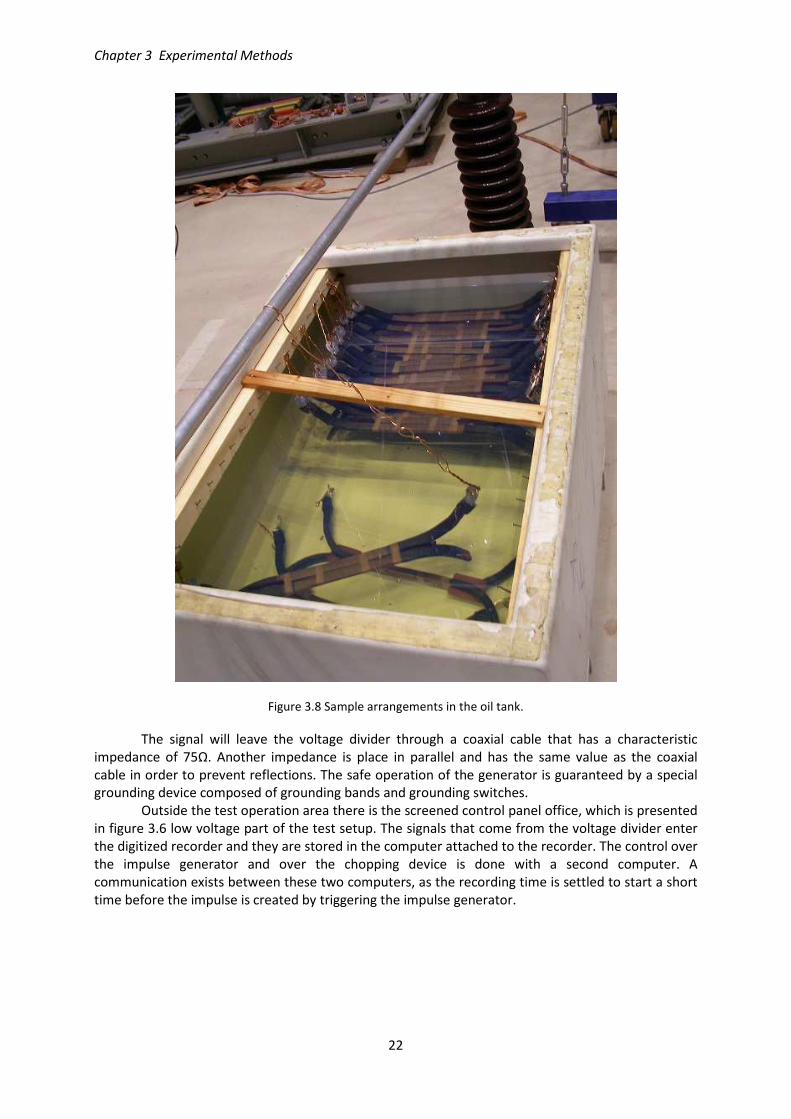
In figure 3.8 the sample arrangement in the oil tank is presented. The porcelain insulators
that also marked with 5 in figure 3.6 are placed on two sides of the oil tank and they assure
mechanical stability of the bar that transmits the lightning waves to the samples. The height of the
insulators is considerably large, as a safe distance had to be provided between the energy bar and
the oil tank that is connected to the ground.
The impulse wave is transmitted to the sample through a 2 meter aluminum bar. This bar
passes above the tank and it allows the connection of sample to the high voltage to be made in the
middle of the tank. If the connection is too close to one of tank’s walls, a flashover can occur at the
surface of the oil. Also great care had to be taken keeping the sample at a safe distance (of at least
5cm) from the bottom of the oil tank, as flashover could also occur at the bottom part of the tank or
between the sample and the other samples that have not been tested.
The ground connection of the sample was built in one corner of the oil tank. In order to have
the shortest possible path to earth, the corner was chosen according to the location of the ground
rod on the floor of the High Voltage Laboratory. This rule was also applied to all the devices used in
this test circuit.
Following this, the voltage divider of damped capacitors is used for measuring the impulse
wave. This voltage divider was home-built in the High Voltage Laboratory and it was previously
calibrated with a special Haefely voltage divider calibrator.
The voltage divider consists mainly of two impedances (high impedance part and low
impedance part) which will give the ratio between the high voltage impulse and the signal that will
be transmitted to a digital recorder.
Chapter 3 Experimental Methods
22
Figure 3.8 Sample arrangements in the oil tank.
The signal will leave the voltage divider through a coaxial cable that has a characteristic
impedance of 75Ω. Another impedance is place in parallel and has the same value as the coaxial
cable in order to prevent reflections. The safe operation of the generator is guaranteed by a special
grounding device composed of grounding bands and grounding switches.
Outside the test operation area there is the screened control panel office, which is presented
in figure 3.6 low voltage part of the test setup. The signals that come from the voltage divider enter
the digitized recorder and they are stored in the computer attached to the recorder. The control over
the impulse generator and over the chopping device is done with a second computer. A
communication exists between these two computers, as the recording time is settled to start a short
time before the impulse is created by triggering the impulse generator.

Chapter 3 Experimental Methods
23
3.5 Applied impulse voltages
Transient voltages that could reach the power transformer insulation could be of positive or
negative polarity. However, for testing purposes, if the test samples have identical conductors which
are uniformly attached and if they are tested under similar conditions, there is no effect of the
polarity over the breakdown strength [29].
Negative impulse wave tests were chosen for measuring the breakdown strength because
the risk of having flashovers between the conductor and the tank is less than the case of applying
positive impulse waves.
There are three categories of lightning impulse wave shapes that were applied to the
samples: full waves, chopped waves and special waves. These are shown in figures 3.9, 3.10 and 3.11.
Figure 3.9 a) Full wave lightning impulse; b) Zoom-in on the left part of the full wave lightning impulse.
Figure 3.10 a) Chopped wave lightning impulse; b) Zoom-in on the left part of the chopped lightning impulse.

Chapter 3 Experimental Methods
24
Figure 3.11 a) Special wave lightning impulse; b) Zoom-in on the left part of the special lightning impulse.
Compared to IEC standard 60423-3, which allows only 5% overshoot of the lightning impulse
wave, the special wave shape required for testing some of the winding samples has a larger
overshoot. This wave shape was recorded at Smit Transformer laboratory. The parameters that make
this impulse wave shape different than the lightning full wave impulses are the shorter front time
(0.7μs) followed by an overshoot of approximately 50%.
The IEC standard for dielectric breakdown voltage using impulse testing recommends that
when having a step-up test, the same value should be applied to the sample three times before
getting to a higher impulse value. However, these tests were done according to Smit Transformer
B.V. procedures, which state that the sample should be subject to only one lightning impulse at the
same value before moving to the next value.
The starting values for the lightning impulse test together with successive increase in
magnitude of the impulse wave were established by the manufacturer. The breakdown value for
each sample is recorded and used afterwards for analysis. If the breakdown occurs on the front of
the lightning impulse wave (the sample breaks down at a much too low value), the previous step
peak voltage is used as the breakdown voltage for that sample. The logic behind this assumption is
that the sample successfully survived previous step peak voltage, but the breakdown of the sample is
imminent.
After each breakdown, the test setup was disconnected from the supply and the sample was
visually inspected to check if the breakdown occurred in the middle of the sample (wanted location).
Before the old sample is replaced with a new one the data from the previous testing is saved in the
computer for further analysis.

25
Chapter 4
Analysis of experimental results
In this chapter the breakdown results of the winding samples are analyzed. Section 4.1
contains the procedures that were accomplished for testing each type of samples and why
censorship measures were applied to the breakdown population data. In section 4.2 Weibull
distribution analysis along with its parameters of investigation is described. Section 4.3 describes two
methods that are used for oil quality investigation and how changes in oil quality due to breakdowns
that take place in the oil tank do not significantly influence the impulse breakdown voltage
characteristics. Section 4.4 contains the V-t curve characteristic. In section 4.5 the comparison
between full wave and chopped wave breakdown results is described. Weibull analysis reveals that
for all CTC samples the confidence intervals overlap and that the Weibull distributions are
comparable. In section 4.5 another two comparisons are described, which present the impulse
breakdown voltage characteristics that is influenced by the enamel on the surface of the copper
conductor or by changes in paper layer registration. Section 4.6 describes the methods used for
building the new design curves for CTC windings.
4.1 Experimental procedures
For a given set of conditions of lightning impulse testing, breakdown results were obtained
for each of the specimens. It is assumed that, as far as possible, identical winding specimens were
tested with identical test regimes [39]. Identical test regimes could not be obtained, because the
efficiency of the impulse generator is lower than 100% and its value differs from impulse to impulse.
So for all the tested samples, it was not possible to apply the same impulse with the same peak
value. However, it could be assumed that identical test regimes were applied. In total, 13 types of windings samples were tested. As presented in table 4.1, the samples
were tested from the beginning of September 2011 until the end of May 2012. Some of the sample
types were produced for testing purposes in batches of 40 samples (samples O, P, M, Q, B1 – with
and without oil duct, B2A and B3). The remaining types of windings came along in batches of only 10
or 20 samples.
The batches of 40 samples were divided into two series, each series being tested with full
wave followed by chopped wave lightning impulses. In this manner, the possible degradation of the
quality of the mineral oil in the tank could be studied by comparing the results of the two series of
full and chopped waves. This will be investigated later on in this chapter.
The majority of the samples was tested with full wave and chopped wave lightning impulses;
exception is made for samples O and B1 which were also tested with special impulse wave shapes,
switching impulse waves and lightning impulse tests for V-t characteristics, respectively. The special
wave shape testing along with the switching impulse testing results are only placed in the appendix
as data results and they will not be included in the statistical analysis of the transformer windings.
Every type of winding sample differs, as dimension of the conductors and of insulation
thickness varies among all winding constructions. The parameters of investigation in this project are
the impulse breakdown values that correspond to a certain oil impregnated paper insulation
thickness. The type of paper is identical for all the samples.
Each sample was tested separately and had a starting impulse voltage and a value of the
step-up impulse voltage imposed by the manufacturer. The peak of the impulse voltage was
increased in the established step until breakdown of the winding sample occurred. After the
Chapter 4 Analysis of Experimental Results
26
breakdown, the peak voltage of the last impulse was recorded along with the breakdown time and
the recording number allocated by the software.
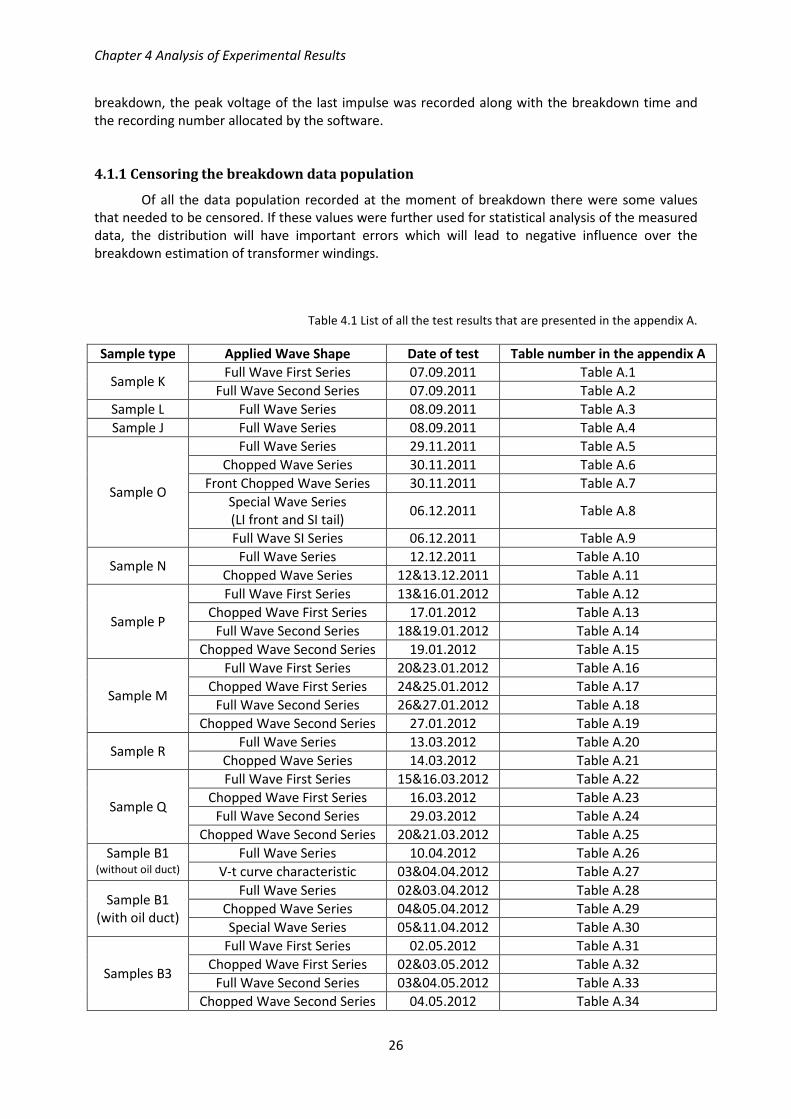
4.1.1 Censoring the breakdown data population
Of all the data population recorded at the moment of breakdown there were some values
that needed to be censored. If these values were further used for statistical analysis of the measured
data, the distribution will have important errors which will lead to negative influence over the
breakdown estimation of transformer windings.
Table 4.1 List of all the test results that are presented in the appendix A.
Sample type Applied Wave Shape Date of test Table number in the appendix A
Sample K Full Wave First Series 07.09.2011 Table A.1
Full Wave Second Series 07.09.2011 Table A.2
Sample L Full Wave Series 08.09.2011 Table A.3
Sample J Full Wave Series 08.09.2011 Table A.4
Sample O
Full Wave Series 29.11.2011 Table A.5
Chopped Wave Series 30.11.2011 Table A.6
Front Chopped Wave Series 30.11.2011 Table A.7
Special Wave Series
(LI front and SI tail) 06.12.2011 Table A.8
Full Wave SI Series 06.12.2011 Table A.9
Sample N Full Wave Series 12.12.2011 Table A.10
Chopped Wave Series 12&13.12.2011 Table A.11
Sample P
Full Wave First Series 13&16.01.2012 Table A.12
Chopped Wave First Series 17.01.2012 Table A.13
Full Wave Second Series 18&19.01.2012 Table A.14
Chopped Wave Second Series 19.01.2012 Table A.15
Sample M
Full Wave First Series 20&23.01.2012 Table A.16
Chopped Wave First Series 24&25.01.2012 Table A.17
Full Wave Second Series 26&27.01.2012 Table A.18
Chopped Wave Second Series 27.01.2012 Table A.19
Sample R Full Wave Series 13.03.2012 Table A.20
Chopped Wave Series 14.03.2012 Table A.21
Sample Q
Full Wave First Series 15&16.03.2012 Table A.22
Chopped Wave First Series 16.03.2012 Table A.23
Full Wave Second Series 29.03.2012 Table A.24
Chopped Wave Second Series 20&21.03.2012 Table A.25
Sample B1 (without oil duct)
Full Wave Series 10.04.2012 Table A.26
V-t curve characteristic 03&04.04.2012 Table A.27
Sample B1
(with oil duct)
Full Wave Series 02&03.04.2012 Table A.28
Chopped Wave Series 04&05.04.2012 Table A.29
Special Wave Series 05&11.04.2012 Table A.30
Samples B3
Full Wave First Series 02.05.2012 Table A.31
Chopped Wave First Series 02&03.05.2012 Table A.32
Full Wave Second Series 03&04.05.2012 Table A.33
Chopped Wave Second Series 04.05.2012 Table A.34

Chapter 4 Analysis of Experimental Results
27
Samples B2A
Full Wave First Series 07.05.2012 Table A.35
Chopped Wave First Series 23.05.2012 Table A.36
Full Wave Second Series 23&24.05.2012 Table A.37
Chopped Wave Second Series 24&25.05.2012 Table A.38
The data that was censored from the breakdown population can be divided into three
categories: censored data due to breakdown that took place at the front of the lightning impulse;
censored data due to differences in the structure of winding samples; outliers that may be present in
the population of breakdowns.
The time to breakdown is an important factor, as it shows the location of the breakdown
along the applied impulse. If the breakdown occurred at the front of the lightning impulse, then a
smaller value is recorded, which would not be relevant for a specific data population of breakdowns
for a type of sample. In this kind of circumstance, the assumption was made that the peak voltage of
previous lightning impulse applied during testing should be taken into consideration as the
breakdown value of that specimen.
Careful investigation of the winding samples showed that in some cases the basic rule of
statistics of having identical samples was not fulfilled. For example, in case of R specimens the
breakdown results presented large dispersion of data population. At a close inspection, the
misleading was caused by the fact that, for some samples, there was a small oil gap between the HV
and the ground conductor. This difference in the construction of the winding caused higher
breakdown values compared with the normal R samples.
By chance, outliers can occur in every population distributions. They are characterized by the
fact that they differ significantly compared with the rest of the data, as their value is larger or lower
than the upper or lower quartiles. The most common way to detect if any outlier is present in a
certain data population is to apply the extreme studentized deviate test (ESD method) [40]. This
method, also called the Grubb´s test, was used to verify every series of breakdown if outliers were
present. In the majority of the cases, the extreme values could be considered to be further from the
rest, but not to be significant outliers.
In tables from the Appendix A, the breakdown data that is censored is highlighted with grey
hash and it will not be used for the statistical analysis of the breakdown data. In the case of
breakdowns that occur at the front of the lightning impulses, the censored data will be replaced with
previously tested peak voltage, as stated in the tables´ comments.
4.2 Statistical analysis of the breakdown data
The breakdown characteristic of insulating material for the power transformer windings
challenges the manufacturers to prepare the design around specific withstand voltage with an
additional safety factor. Since a fixed value for the withstand voltage could not be obtained, the
statistical variable corresponding to a low breakdown probability should be achieved.
Hence, statistical techniques must be used to estimate the lowest likely breakdown voltage
obtained out of the dispersion of the impulse. In the present investigation, the 1% breakdown
probability levels of all the CTC winding samples, which includes both full wave and chopped wave
breakdown results, will compared later in this chapter. In addition, statistical analysis was applied
using both 2 and 3-parameter Weibull distributions to determine which one gives the best fit on
breakdown strength for power transformer windings.
Therefore, it is also important to understand whether the dispersion in breakdown voltage
data that is plotted on the two statistical distributions have similarities or not. For this purpose
statistical software tool ‘Weibull++7’ was utilized.

Chapter 4 Analysis of Experimental Results
28
4.2.1 Weibull distribution analysis
As IEC standard 62539 mentions, the selection of an appropriate distribution is a very
important step in analyzing the breakdown data. For all the samples that were tested, the statistical
analysis should be applied involving all measured breakdown values.
The goal of using Weibull distribution for the statistical analysis is to plot the measured data
in order to have a useful interpretation of the plots. The plot will be further used for forecasting and
prediction of possible failures, so a corrective management action plan could be applied.
There are multiple reasons to use Weibull distribution analysis for investigating from a
statistic point of view the impulse breakdown data of the transformer windings. The main advantage
of this analysis is that this extreme value distribution has a high applicability for systems which fail
when the weakest link fails [39].
Weibull analysis provides the possibility to do failure analysis and forecast, having only a
small number of data population available [41]. From a statistical point of view, a large number of
tested samples are always preferred in order to release a good analysis. But this could not always be
achieved, as building the samples may have high costs and their testing may require a lot of time.
Another advantage is that Weibull analysis offers helpful information for both engineers and
managers, by providing simple, understandable and useful graphical plots. These plots contain
information about physics of failure, the breakdown voltage characteristics and the breakdown
strength of the tested sample.
The inadequacy in data may lead to the so called “bad Weibull plots”. This type of plots could
be defined as plot which has a low correlation coefficient and the plotted breakdown point form
curves with respect to the distribution plot line. Also this kind of data may prove to be useful, as bad
fit to Weibull distribution could mean that different failure mechanisms may be present or that the
quality of data is poor from a statistical point of view (outliers are present in the data population).
4.2.2 Weibull distribution parameters of investigation
By far the most widely used distribution for statistical analysis of electrical breakdown data,
the 2-parameter Weibull distribution has the following cumulative distribution function (CDF):
���� = 1 − �������
(4.1)
,where:
• v is the measured variable defined as the breakdown voltage;
• F(v) is the probability of a failure at a voltage less or equal to v;
• η is the scale parameter;
• β is the shape parameter.
The 3-parameter Weibull distribution CDF is defined as:
���� = 1 − ������� �
�
(4.2)
,where:
• γ is the location parameter.
The probability of failure, F(v), is zero at v=0 and it rises continuously with v until it reaches
the maximum value of 1. The complement of the probability of failure is reliability, defined as 1- F(v).

Chapter 4 Analysis of Experimental Results
29
The scale parameter η, also called the parameter of voltage characteristic, has the same unit as v and
represents the voltage for which the failure probability is 0.632=1-1/e (regardless of β)
The shape parameter β, also called the slope parameter, is a measure the range of the failure
voltages. If the range of breakdown voltages is small, a larger value of β parameter is obtained. Also,
the shape parameter indicates the class of failure that is present during testing, as infant mortalities
(0<β<1), random failures (β=1) or wear out failures (β>1) could be present. In the case of impulse
breakdown tests applied to the winding samples, the expected value of β should be above 1, but
should not present too high values. For example, in the 3-parameter Weibull distribution, the value
of β should not be larger than 6.
The location parameter γ is defined as the threshold voltage value below which the failure
probability is zero. This parameter is an important parameter, as it will give information about the
breakdown strength for specific winding types.
There are certain similarities when Weibull distribution is compared with Normal
distributions. The scale parameter η is approximately equal to Mean Time to Failure (MTTF) for β>1
and they are equal when β=1. The standard deviation σ could have similar values with 1/β. Also, the
correlation coefficient ρ is similar with the σ/MTTF.
By using median rank regression method, the Weibull probability plot could be obtained
along the estimation of Weibull parameters. This method is the most accurate and, therefore, is the
best practical method to determine the Weibull plot [42]. An example of Weibull plot is given in
figure 4.1, where the results of the Weibull analysis of sample M full wave first series are shown.
In this graph, both axes are represented in the logarithmic scale. The horizontal scale
represents the failure voltages which are given in kV. The vertical scale is the CDF, which describes
the cumulative percentage that fails at any voltage.
Figure 4.1 Samples M full wave first series 2-parameters Weibull distribution plot with confidence bounds of
95% and the parameters: β=12.312; η=129.4256; ρ=0.9452.
The Weibull distribution for 2-parameter is represented by a straight line and by studying the
Weibull plot it can be determined how well the failure data fit this straight line. In case of 3-

Chapter 4 Analysis of Experimental Results
30
parameter Weibull distribution, the straight line is replaced by a curved one. The software derives
the scales so the data could conform to a straight line (or a curved line).
A good method to measure the goodness of fit is to determine the correlation coefficient ρ. If
the failure data fits well enough on the straight line, then the ρ value gets closer to 1. Recommended
by Abernethy [44] and adopted by IEC standard 62539 [39], a simple technique for testing the
adequacy of Weibull distribution for 2 and 3-parameters is used.
This technique involves the comparison between ρ and a critical correlation coefficient (CCC).
If ρ is higher than CCC, then the Weibull distribution is considered to be adequate and if it smaller,
then this is the case of a bad fit. As it could be seen from figure 4.11 and 4.12, CCC differs from the
number of samples broken down (higher values are obtained for larger number of specimens) and
from 2-parameter compared with 3-parameter Weibull distribution (higher values are expected for
3-parameter Weibull distribution).
CCC was found by ranking the ρ values for 1000 MonteCarlo trials and choosing the highest
value of the lowest 100 values. As the “check by eye” not always gives a reliable investigation, the
comparison between CCC and ρ offers the perfect way to check the goodness of fit for Weibull
distributions.
Measuring the statistical precision of an estimate, the lower and upper confidence bounds
are built in figure 4.1 together with the estimated “best line” for 2-parameter Weibull distribution.
The confidence level of 95% was chosen, for all the samples, before the data analysis was started. For
the same confidence limits of 95%, as the sample number is larger, also the confidence bounds get
narrower.
It is recommended by Abernethy to have the confidence limits set at the same value as the
reliability of the percentile will be used for comparison [43]. In order to build the final design plots, 1
percentile will be used for comparison. However, Weibull investigation will be done at 95%
confidence, as the estimation range for the Weibull distributions regarding the failure analysis will be
more than satisfactory. Also, taking into account that volume effect and other transformer
parameters were not considered, this confidence limit of 95% reduces the possibility of having
erroneous estimations. 95% confidence limit implies that lower confidence bound of 97.5%, which is
more than enough for analyzing the breakdown strength of transformer windings.
As the Weibull plot shows the onset of the failure, it is necessary to determine the voltage at
which 1% of the measured data population would have failed [44]. Also called the B1 interval (or the
1 percentile), the voltages that are found between the 95% confidence limits for 1% unreliability are
representing a good solution for comparison between results analysis all the CTC samples. This will
help build the design curve of voltage strength dependency on insulation thickness. A lower
percentile comparison is more important than the comparison at higher percentile (for example at
63.2 %), because the breakdown strength of the winding samples is more significant than the
average value of the breakdown population.
The 3-parameter Weibull distribution is preferred to be used when analyzing the data. The
reason for preferring the 3-parameter Weibull fit is the fact that it has narrower confidence intervals
at lower percentiles and it also delivers the location parameter, which is related to the breakdown
strength. However, both 2-parameter and 3-parameter Weibull distribution will be used for analysis
in this project because there were some 3-parameter Weibull plots that were characterized by
unrealistic parameters. The reason for having really high values β (more than 1000), high values for η
and negative γ (which means that the samples failed before the test was started) was because the
data dispersion for breakdown values was too low. In this case, the 2-parameter Weibull distribution
was the alternative case.
4.3 Study of reduction of the oil quality
Before the breakdown tests start, the oil quality is very good, as it has no dark color and it
does not contain any impurities. Along with each breakdown that takes place in the oil tank, dark

Chapter 4 Analysis of Experimental Results
31
smoke and small particles are released in the oil. As seen in figure 4.2, large number of breakdowns
(30-80 per tank) could lead to oil degradation, because the color of the oil becomes brownish and
many particles start to float in the mineral oil. These particles are produced by the burning paper
that is released in the oil due to the energy involved in the breakdown process.
The possible degradation of the quality of the oil that is placed in the tank was studied in two
ways. The first possibility is to measure the humidity, temperature, absorption coefficient and
breakdown strength of two oil samples. One of the oil samples had been taken from the oil tank
before the tests were started and the other one after the tests were finished.
Figure 4.2 Oil quality comparison between a) newly delivered oil and; b) darker with particles.
Another approach to study the influence over the oil quality due to breakdowns that took
place into the tank is to analyze statistically the first series and the last series of breakdown data
under similar conditions and then compare the results.
4.3.1 Oil quality check using measurement techniques
In order to verify that the quality of the oil did not change, measurements were taken for the
oil before tests were started and after the tests were finished. Comparison between these values will
prove if the mineral oil from the tank remains in good parameters, despite the large number of
breakdowns that take place in the oil tank.
First oil samples were collected from the oil tank and were placed in cleaned aluminum
bottles. After this, part of the oil sample some oil from each bottle was diagnosed using a special
probe that could measure the humidity, the temperature and the absorption coefficient. The
remaining oil from the bottle was then used for breakdown strength tests using a standard test set-
up for determining the AC oil breakdown. This device measures the breakdown values between two
rods electrodes submerged in the oil that needs to be tested. The electrodes are gradually charged
until the 2.5mm between the electrodes breaks down.
In order to avoid contamination with oil measurements that were taken before, the special
probe was carefully cleaned and dried out. In order to get a correct result for each oil sample, the
probe was kept in the same position for about ten minutes. This settling time was necessary for the
mineral oil to gain its equilibrium. An example of the settling time and the variation of the measured
values are presented in figure 4.3.

Chapter 4 Analysis of Experimental Results
32
Figure 4.3 Example of oil measurement variations for: a) humidity – blue; b) temperature – green; c) absorption
coefficient – red.
Two sets of measurement were taken from two different oil tanks. The first oil tank had two
types of windings: 17 R samples were first tested followed by the 40 Q samples. The oil
measurements that were taken for the oil in the tank before and after the impulse tests were applied
are presented in table 4.2. This table presents the measured values for absorption coefficient (aw),
temperature (T), relative humidity (H2O), breakdown voltages (Ubd) and average breakdown voltage
(Uav).
The other oil tank measurement results are presented in table 4.3. These measured values
represent the oil quality behavior for the 40 P samples, before and after applying the impulse test.
It can be seen from these two tables that the breakdown strength of the mineral oil decreases with
higher number of impulse tested samples. The decrease from 90 to 75 kV is quite high compared
with the decrease from 88 to 86. This could be explained by the fact that the relative humidity in the
first case grew from 13 to 19 ppm, while in the second case it went from 14 to 15 ppm. The growth
Table 4.2 Oil parameter results for R-Q tank before and after the impulse tests.
Sample day Test day aw T H2O Ubd Uav
- - [] [°C] [ppm] [kV] [kV]
R-Q tank - new oil 13-3-2012 14-3-2012 0,261 20,57 13 89/90/91/82/92/93/
97/87 90,125
R-Q tank - oil after
testing R samples 14-3-2012 14-3-2012 0,28 20,74 14
87/88/84/98/99/99/
74/85 89,25
R-Q tank - oil after
testing Q samples 14-3-2012 14-3-2012 0,354 21,14 19
72/82/75/86/81/79/
85/54/65/78 75,7
Table 4.3 Oil parameter results for R-Q tank before and after the impulse tests.
Sample
day Test day aw T H2O Ubd Uav
- - [] [°C] [ppm] [kV] [kV]
P tank - new oil 13-1-2012 22-3-2012 0,298 20,2 14 93/88/87/78/93/93/93/9
7/75/87/96/92/89/84 88,785
P tank - oil after
testing 18-1-2012 22-3-2012 0,293 20,25 15
74/75/93/75/96/81/88/8
7/99/89/84/77/97/92/92 86,6

Chapter 4 Analysis of Experimental Results
33
of the relative humidity that influences the breakdown strength is also in relationship with the
increase of absorption coefficient.
However, the breakdown strength values for the mineral oil are still more than acceptable
and for the relative humidity a lower value than 25 ppm was obtained. Over this limit for the relative
humidity the influence over the mineral oil performances would be significant [45].
4.3.2 Oil quality statistical analysis
The quality of the oil between the paper layers is not likely to be influenced by the changes
caused by breakdowns that take place in the oil tank. This can be proved by comparing the statistical
analysis of the breakdowns values that were measured when impulse tests started with the ones that
were done later on.
The question that rises is if two data sets, from the same type of samples on which was
applied the same impulse wave, differ significantly. More accurate results and larger samples size for
one type of winding could be obtained if the data sets are not significantly different and the data will
be merged.
This investigation applies for all the types of sample that had been tested in different series.
The samples types are shown in table 4.1.
Selected as an example, the sample M will be fully investigated in this chapter. The 40
samples are divided in 4 series as shown in table 4.1. The breakdown results of the samples are
shown in the appendix A, tables A.16, A.17, A.18 and A.19.
For the first series of full wave measured data, the 2-parameter Weibull distribution was
given as an example in figure 4.1. The 3-parameters Weibull distribution analysis for the same series
is given below, in figure 4.4.
Figure 4.4 Samples M full wave first series 3-parameters Weibull distribution plot with confidence bounds of
95% and the parameters: β=1.1047; η=19.196; γ=107.665; ρ=0.9832.

Chapter 4 Analysis of Experimental Results
34
Following this, the Weibull distribution plots for full wave second series and chopped wave
first and second series are shown in figures: 4.5, 4.6, 4.7, 4.8, 4.9, 4.10.
Figure 4.5 Samples M full wave second series 2-parameters Weibull distribution plot with confidence bounds of
95% and the parameters: β=14.5461; η=128.8114; ρ=0.9379.

Chapter 4 Analysis of Experimental Results
35
Figure 4.6 Samples M full wave second series 3-parameters Weibull distribution plot with confidence bounds of
95% and the parameters: β=1.5686; η=20.7402; γ=106.7455; ρ=0.9626.
Figure 4.7 Samples M chopped wave first series 2-parameters Weibull distribution plot with confidence bounds
of 95% and the parameters: β=25.3801; η=129.6725; ρ=0.9357.

Chapter 4 Analysis of Experimental Results
36
Figure 4.8 Samples M chopped wave first series 3-parameters Weibull distribution plot with confidence bounds
of 95% and the parameters: β=1.9697; η=13.4355; γ=115.4213; ρ=0.9807.
Figure 4.9 Samples M chopped wave second series 2-parameters Weibull distribution plot with confidence
bounds of 95% and the parameters: β=24.1585; η=130.783; ρ=0.9432.

Chapter 4 Analysis of Experimental Results
37
Figure 4.10 Samples M chopped wave second series 3-parameters Weibull distribution plot with confidence
bounds of 95% and the parameters: β=1.8671; η=14.6789; γ=115.4905; ρ=0.957.
For each of these Weibull distributions, the corresponding ρ was plotted in the goodness of
fit in the figure for 2-parameter and for 3-parameter Weibull distributions. The figures 4.11 and 4.12
were built in Matlab (shown in the appendix D.1) so that the indication for the goodness of fit could
be easily checked.
Figure 4.11 Plot to check the goodness of fit of 2-parameter Weibull distribution for M samples.

Chapter 4 Analysis of Experimental Results
38
Figure 4.12 Plot to check the goodness of fit of 3-parameter Weibull distribution for M samples.
As it can be seen from both figures, the Weibull distributions were fitted well for all 4 series
of 10 samples and for both 2 and 3-parameter cases.
After this check, in order to compare the first and the second series for both full and chopped
wave, Weibull distributions are put on the same plot. The cases of 2-parameter Weibull distribution
are plotted in figures 4.13 and 4.15 and the cases of 3-parameter in figures 4.14 and 4.16.

Chapter 4 Analysis of Experimental Results
39
Figure 4.13 Samples M comparison for full wave first and second series - 2-parameters Weibull distribution plot
with confidence bounds of 95%.
Figure 4.14 Samples M comparison for full wave first and second series - 3-parameters Weibull distribution plot
with confidence bounds of 95%.

Chapter 4 Analysis of Experimental Results
40
Figure 4.15 Samples M comparison for chopped wave first and second series - 2-parameters Weibull
distribution plot with confidence bounds of 95%.
Figure 4.16 Samples M comparison for chopped wave first and second series - 3-parameters Weibull
distribution plot with confidence bounds of 95%.

Chapter 4 Analysis of Experimental Results
41
Not only the confidence bounds overlap almost entirely, but also the Weibull probability lines
overlap in the majority of the cases. This indicates that the compared series can have their data
merged, and so become 20 sample data sets.
It can be concluded that the changes in the oil quality do not significantly influence the
impulse voltage breakdown characteristics. For all the other types of samples, similar conclusion
could be drawn. All the other series were analyzed and the plots are found in figures from appendix
A and B.
4.4 V-t curve characteristic
For B1 samples without oil duct a number of 27 samples was tested in order to study the
impulse voltage breakdown behavior of oil-impregnated paper insulation.
The plot line obtained in figure 4.17 was built in Matlab, using a 4th degree polynomial
function. According to this line, constant values are achieved for breakdown times higher than 2 μs.
For breakdown times lower than 2 μs, the line starts to bend upwards.
The highest values of breakdown were achieved around 180 kV. There are two possible
reasons that can explain this value: the intrinsic breakdown value of the sample was reached and the
fact that the limitation of the measured system has been reached.
Due to constant behavior of the plot line above 2 μs, it can be assumed that full wave and
chopped wave breakdown results are comparable for the winding samples that were tested. As the
majority of the samples that were tested with both full wave and chopped wave impulses broke
down at the tail of the lightning impulse, this assumption may prove to be correct.
Figure 4.17 V-t characteristic for B1 samples without oil duct.

Chapter 4 Analysis of Experimental Results
42
4.5 Comparison between full wave and chopped wave results
The M sample analysis example that was previously started in section 4.3 will be continued
here.
After merging the data sets for both full wave and chopped wave, the samples are analyzed
again with 2-parameter and 3-parameter Weibull distributions.
The merged data sets of 20 samples for full wave and for chopped wave are being analyzed
separately. The goodness of fit for 2-parameter and 3-parameter Weibull distributions is again
checked. In figures 4.11 and 4.12 it can be observed that the fit is not satisfactory for the chopped
wave analysis. Still a comparison between full wave and chopped wave distribution is possible.
The results are shown in figures 4.18 and 4.19.
Figure 4.18 Samples M comparison for full wave and chopped wave - 2-parameters Weibull distribution plot
with confidence bounds of 95%.

Chapter 4 Analysis of Experimental Results
43
Figure 4.19 Samples M comparison for full wave and chopped wave - 3-parameters Weibull distribution plot
with confidence bounds of 95%.
Based on previous graphs, it can be concluded that the full wave and the chopped wave
breakdown results are comparable because the confidence bounds and the Weibull plot lines
overlap. As a result, all the M samples breakdown results could be placed in a single data set for all
40 samples.
After this step was taken, the new data set is analyzed again with Weibull distribution. The
plots for 2 and 3-parameter Weibull distribution are placed in figure 4.20 and 4.21.

Chapter 4 Analysis of Experimental Results
44
Figure 4.20 All M samples - 2-parameters Weibull distribution plot with confidence bounds of 95%: β=17.696;
η=129.7908; ρ=0.9704.
Figure 4.21 All M samples - 3-parameters Weibull distribution plot with confidence bounds of 95%: β=3.2782;
η=30.3299; γ=98.913; ρ=0.9864.

Chapter 4 Analysis of Experimental Results
45
These plots and the previous ones are also checked for goodness of fit. The results of
applying CCC technique is placed in figure 4.11 and 4.12. It can be observed that for both Weibull
distributions, the merged data population for all M samples is represented by a good fit, although for
chopped wave distribution the correlation coefficient was not satisfactory.
Similar approaches were done with the other samples. All the full wave and chopped wave
comparisons are placed in appendix B and all the final Weibull plots are placed in appendix C.
For all CTC samples, the same conclusion of merging the full wave and chopped wave data
sets could be drawn. Special attention should be taken related samples B1 with oil duct, B2A and B3.
Their comparison showed that for high percentiles there is a considerable difference between full
wave and chopped wave, as the confidence bounds overlap only for the lower part of the Weibull
distribution. The IEC standard 62539 advises in this case that more samples should be tested in order
to make the correct conclusion.
4.5 Study on the behavior of breakdown voltage due to adding enamel and
due to paper registration changes
The behavior of the breakdown voltage due to adding enamel and due to changes in paper
registration configuration will be approached by studying samples B1 without oil duct, samples B2A
and samples B3. Due to the fact that the samples B1 without oil duct have been tested only with full
wave impulses and due to the fact that there is a difference between full wave and chopped wave
impulse test results of samples B3 and B2A, the comparison will be done only with the results from
full wave impulse tests. For sample B3 and B2A, the comparison will be made with the merged first
and second series of full wave impulse tests as it was shown in appendix B, figures B.22 and B.27.
The samples B1, B2A and B3 are having the same number of oil-impregnated paper layer. B1
samples without oil duct are characterized by having only 50% paper registration and by not having
enamel applied on the surface of the electrode. Samples B2A are being built with 50 % paper
registration, but they have enamel applied at the surface of the conductor. For samples B3, 25%
paper registration construction was chosen and no enamel was applied to the surface of the copper
conductor.
As a result, for the study of breakdown voltage behavior due to adding enamel the B1 and
B2A will be compared and for the behavior due to changes in paper registration construction samples
B1 and B3 will be compared.
4.5.1 Study on the behavior of breakdown voltage due to adding enamel on the
conductor’s surface
The breakdown voltage impulse test results for samples B1 without oil duct (samples which
do not have enamel applied on the conductor’s surface) are shown in appendix A, table A.20 and the
ones for samples B2A (samples which have enamel applied on the conductor’s surface) are shown in
table A.31 and A.32.
The graphs with the comparison of these samples for 2-parameter and 3-parameter Weibull
distributions are shown in the following figures.

Chapter 4 Analysis of Experimental Results
46
Figure 4.23 Comparison between samples B1 without oil duct and B2A samples in case of 2-parameter Weibull
distribution.
Figure 4.24 Comparison between samples B1 without oil duct and B2A samples in case of 3-parameter Weibull
distribution.

Chapter 4 Analysis of Experimental Results
47
From figure 4.23 and from figure 4.24 it can be seen that that there is a significant difference
between the samples without enamel (samples B1 without oil duct) and samples with enamel
(samples B2A). When adding enamel, the increase of scale parameter for 2-parameter Weibull
distribution was with almost 10%, as for 3-parameter Weibull distribution the increase of location
parameter was with 20%.
It can be concluded that, by adding enamel to the surface of the copper conductor,
significant increase in breakdown voltage could be obtained.
4.5.2 Study on the behavior of breakdown voltage due to changes in paper registration
The breakdown voltage impulse test results for samples B3 are shown in appendix A, table
A.35 and A.36. The graph with the comparison of B1 (samples with 50% paper registration) and B3
(samples with 25% paper registration) for 2-parameter Weibull distribution is shown in figure 4.25.
The 3-parameter Weibull distribution comparison is not possible because the software provided
unrealistic values for the full wave impulse test results of the samples that have 50% paper
registration.
Figure 4.24 Comparison between samples B1 without oil duct and B3 samples in case of 2-parameter Weibull
distribution.
Compared with 50% paper registration of the winding insulator, the 25% paper registration is
considered to have higher breakdown strength as lower number of oil gaps are found between the
shortest conductor-exterior distances.
As it can be observed in figure 4.24, the breakdown distributions for both samples are
comparable, with a slight decrease breakdown voltage for the samples with 25% paper registration.

Chapter 4 Analysis of Experimental Results
48
Sample investigation was needed to explain these phenomena, so the samples were carefully
inspected after the breakdown occurred.
The conclusion for this investigation could be explained with the help of the example from
figure 4.25.
Figure 4.25 Comparison between breakdown paths for samples B3 (a) and B1 without oil duct (b).
With the 50% registration of the paper layers which are shifted (as the arrows show in figure
4.25b) as it was the case with all the samples that were investigated, the probability of having the
breakdown path between paper layers (in the oil gaps) is reduced to the same values as for 25%
paper registration case. In other words, if the 50% paper registration configuration is shifted for each
2 layers, then similar breakdown values are obtained as the ones from 25% paper registration
samples.
For this comparison, it can be concluded that the samples with 50% paper registration were
manufactured with construction errors. When these samples were tested and then the breakdown
results were analyzed, the reasons for the breakdown behavior were not clear. Only by investigation
it was proved that the shift of paper layers influenced the breakdown behavior.
4.6 Design lines for transformer winding insulation coordination
Currently, Smit Transformers uses a so called “design curve”. This old curve was built using
Normal distribution statistical analysis in order to determine if the thickness of the windings
insulation is chosen according to the overvoltages that the transformer need to withstand. As the oil-

Chapter 4 Analysis of Experimental Results
49
impregnated paper insulation of the windings has been improved, a new design curve has to be
established.
From the final Weibull distribution analysis of all CTC samples, the 1 percentiles defined by
the confidence intervals (the B 1 intervals) were collected. In order to compare the samples, the B 1
intervals for each sample are placed on graphs which are defined as insulation thickness versus
breakdown voltage.
The comparison was done for CTC-L-EP samples (samples K, N, M and R) and CTC-L (samples
L, J, O and P). The CTC-L comparison graph also includes the data from samples Q, which are only CTC
sample.
After the B1 intervals (interval of the confidence limits for 1 percentile) were plotted on the
graphs, a plot line defined as a 2nd degree polynomial function was built. Along with this line, also the
90% confidence limits have been plotted. An interesting aspect is the plotting for the 3-parameter
Weibull distribution comparison of the location parameter γ. The plot line obtained from γ is almost
similar with the main plot line.
Figure 4.26 Comparison between CTC-L samples using the B1 interval obtained from 2-parameter Weibull
distribution.

Chapter 4 Analysis of Experimental Results
50
In case of CTC-L comparison of 3-parameter obtained data, the sample J is not included, as
Weibull software estimated parameters were not realistic.
Figure 4.27 Comparison between CTC-L samples using the B1 interval obtained from 3-parameter Weibull
distribution.

Chapter 4 Analysis of Experimental Results
51
Figure 4.28 Comparison between CTC-L-EP samples using the B1 interval obtained from 2-parameter Weibull
distribution.

Chapter 4 Analysis of Experimental Results
52
Figure 4.29 Comparison between CTC-L-EP samples using the B1 interval obtained from 3-parameter Weibull
distribution.
It can be seen from figures 4.28 and 4.29 that the B1 interval for 2-parameter Weibull
distributions are larger compared with the intervals for 3-parameter Weibull distributions.
Nevertheless, both plot lines have the same line characteristics and they find themselves at the
similar end values.
For the γ line in case of CTC-L-EP comparison it can be observed that the line is closed to the
line of 90% lower confidence bound, but still remains between the 90% bounds of design plot line for
CTC-L-EP samples.
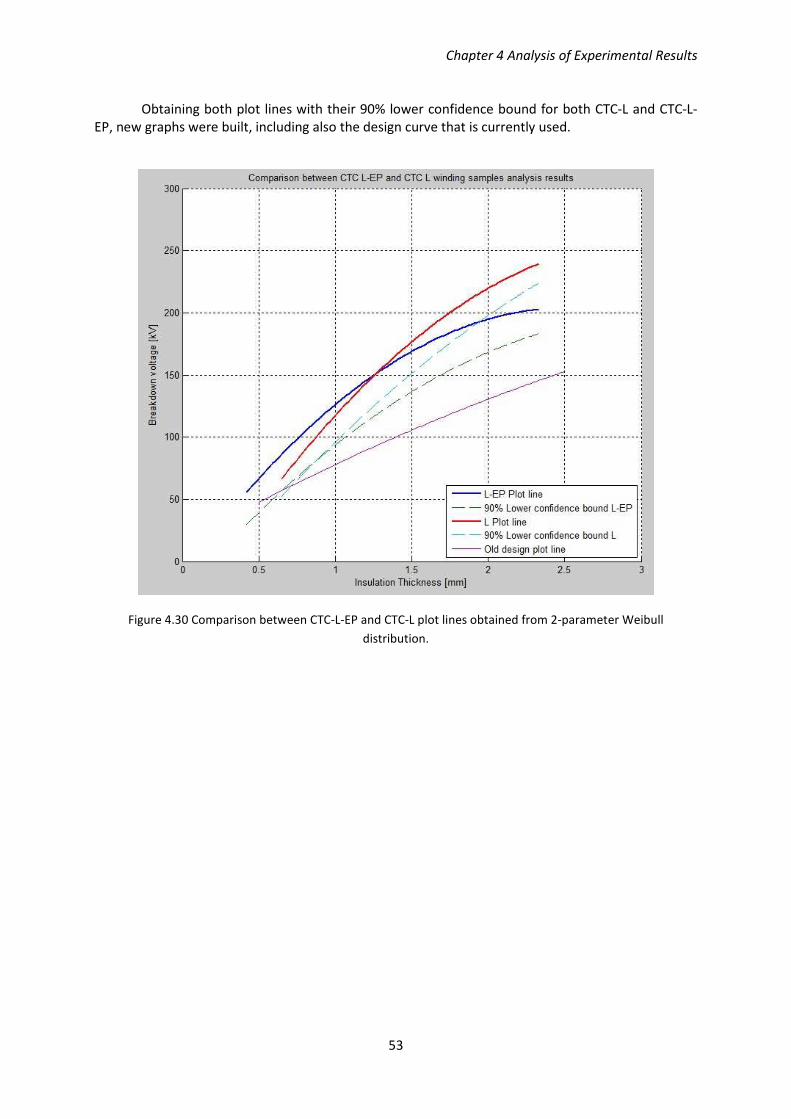
Chapter 4 Analysis of Experimental Results
53
Obtaining both plot lines with their 90% lower confidence bound for both CTC-L and CTC-L-
EP, new graphs were built, including also the design curve that is currently used.
Figure 4.30 Comparison between CTC-L-EP and CTC-L plot lines obtained from 2-parameter Weibull
distribution.

Chapter 4 Analysis of Experimental Results
54
Figure 4.31 Comparison between CTC-L-EP and CTC-L plot lines obtained from 3-parameter Weibull
distribution.
Despite the fact that there were no safety factors applied to the new design plot lines for L-
EP and L CTC samples, there is a substantially difference between the current design line and newly
build plot lines. It can be observed that for both figures, the difference in breakdown voltages
between the old and new design plot lines is substantial for thicker insulation.
In case of CTC L samples, as the insulation thickness gets lower, the breakdown voltage
reaches values that get closer to the old design plot line. This applies for both comparisons of 2-
parameter Weibull B1 intervals and also of 3-parameter Weibull B1 intervals. Especially in the 3-
parameter Weibull comparison, the plot line is narrower descendent to lower breakdown voltages.
Despite the fact that no safety factor was applied to this line, it should be taken into consideration
that this line was plotted only having available 3 B1 intervals from 3 types of samples (samples J, O
and P).
The small difference between old and newly design plot lines for thinner insulation may be
explained by the R sample investigation. As this type of winding sample has the thinnest oil-
impregnated paper insulation, it will be a good example of explaining the behavior of the insulation
when 3 or less paper layer are used for insolating the conductors.
The R sample breakdown values for full wave and chopped wave impulses from table A.20
and A.21 come along with the comments regarding the investigation of the samples after the
breakdown took place. The additional information that was found out during the investigation led to
important conclusions regarding the behavior of insulation with small number of paper layers.

Chapter 4 Analysis of Experimental Results
55
Figure 4.32 R sample examples of bad paper registration.
As it could be seen in figure 4.32 as areas delimited by the red circles, bad paper registration
may influence the quality of the insulator. Instead of having 3 paper layers between the conductor
and the exterior, only 2 paper layer had to withstand the impulse voltages at the location of
breakdown. For such a small number of paper layers that are used for insulating, the probability of
having a bad paper registration that will have a negative impact over the insulating properties of the
windings is considerably high.
Along bad paper registration, the presence of defects also influenced the breakdown results.
Defects were present at the surface of the copper conductor and also at the paper insulating
construction. In case of R sample, the breakdown data needed to be censored (as explained at the
beginning of this chapter) because some samples presented large gaps between the HV and the
ground conductor.
56
Chapter 5
Conclusions and recommendations
The aim of this thesis was to investigate the behavior of impulse breakdown voltage of newly
designed power transformer windings in relation with the thickness of the oil-impregnated paper
insulation. This was accomplished by applying lightning impulses over multiple sets of transformer
winding samples. The measured breakdown values were then subject to statistical analysis, by means
of Weibull distribution applied to the measured population data. With the help of Weibull ++7
software package, the B 1 intervals (1 percentiles) of all types of samples could be compared and a
new design curve that shows the dependency of breakdown voltage over the insulation thickness
could be drawn.
5.1 Summary and conclusions
Over the breakdown data population censorship measures needed to be applied for samples
that broke down at the front of the lightning impulse wave, for samples that did not satisfy the
condition of having identical entities and for samples that presented outliers compared to other
breakdown data. After applying these censorship measures, the remaining breakdown data
population could be further investigated by means of Weibull analysis, as the possibility of having
errors was reduced.
In this thesis it was proven that the breakdowns that take place in the oil tank hardly
influence the quality of the oil, so the breakdown test results were not influenced. Two methods
were used for guaranteeing that the mineral oil in which the samples were tested did not influence
over their breakdown behavior. On one hand, samples of mineral oil, that had been taken from oil
tank before any test was done, were compared with mineral oil samples that were collected after all
test were finished. On the other hand, for some categories of the winding samples, the data from
two different series, representing the same type of windings and on which was applied the same
type of impulse, were statistically compared.
With the main advantage of having high applicability in systems where the weakest link
failure is really important, Weibull distribution analysis was chosen to be the appropriate distribution
for analyzing the breakdown data population. The measured data was plotted on Weibull plots and it
was subject to statistical interpretation.
Both 2-parameter and 3-parameter Weibull distribution were used for statistical analysis of
the breakdown data. The 3-parameter Weibull distribution has the advantage of narrower
confidence bounds for low percentiles, of better fitting curve to the breakdown data and of
delivering the location parameter γ. But in some cases, where the dispersion of the measured data
was too small, the 3-parameter Weibull distribution could not be used, as unrealistic parameter were
provided by Weibull software.
Every Weibull plot had its own parameters of investigation (η, β, γ, ρ) that were used to
verify the veracity of the Weibull distributions the goodness of fit. Along with the Weibull distribution
lines, the 95% confidence bounds are estimated, which, for 1 percentile, are giving the B 1 interval.
This interval proves to be a good method for comparing the samples.

Chapter 5 Conclusions and Recommendations
57
The B types of winding samples are having almost the same construction, as they differ on
enamel on the surface of the conductor or paper registration variation. By comparing the B types of
samples, it was proven that the breakdown voltage increases if enamel is applied on the conductor,
as the enamel layer makes the surface of the conductor more smooth and reduces the probability of
having defects. Due to incorrect wrapping of the paper layers for the samples with the configuration
of 50% paper registration, similar breakdown voltages were obtained when samples with 50% and
with 25% paper registration construction were compared. The reason for this is that errors in
manufacturing process of the 50% paper registration construction changed the configuration of the
paper layers.
With the exception of B type samples, the comparison between full wave and chopped wave
breakdown data showed similarities for the same type of winding samples. In order to reduce the
confidence bounds and also the uncertainty of the analysis for every type of samples, the data from
full wave and chopped wave series was merged.
The Weibull distribution applied to the merged data delivered B 1 intervals for each type of
winding samples. In order to compare them, these intervals were plotted on the same graph. New
design curves, that showed the dependency of breakdown voltage on thickness of oil-impregnated
paper insulation, could be built by uniting the points from the B 1 intervals.
Although no safety factors were applied, the new design curves present significant increase
of breakdown voltage at the same thickness, when they are compared with the old design curve. The
increase is higher in case of thicker oil-impregnated paper insulation usage and it is getting less
significant for thinner insulation. This is caused by the fact that for few paper layer insulation, there is
a high probability for the construction defects to decrease the breakdown strength of the
transformer windings.
5.2 Recommendations for future research
The research that was implemented in this thesis is a part of Smit Transformers B.V. project.
The number of samples that had been tested already has a considerable number of predecessor tests
for different kind of winding samples. Both breakdown values that were measured for this thesis and
ones that were obtain from previous tests should be compared and Weibull statistical analysis should
be applied to them.
From the statistical point of view, the number of samples from the types of windings that
were tested in this thesis should be increased. Not only the confidence bound of the Weibull
distribution will get narrower, but also the confidence limits of Weibull distribution parameters will
decrease.
As the design curves that were built in 4th chapter are based upon B 1 intervals from 8
different types of transformer windings, more types of windings with different thickness of the oil-
impregnated paper insulation should be tested. As more B 1 intervals will appear on the graph
representing the dependency of breakdown voltage on the insulation thickness, the new points will
confirm the new design plot line or they could slightly change the profile of the curve.

163
Bibliography
[1] Allan, D. J.: “Power transformers - the second century”, IEEE Power Engineering J., 1991;
[2]
http://epp.eurostat.ec.europa.eu/statistics_explained/index.php?title=File:Net_electricity_gene
r ation,_1999-2009_(1_000_GWh).png&filetimestamp=20120105172823;
[3] Sokolov, V.; Berler, Z.; Rashkes, V.: “Effective methods of assessment of insulation system
conditions in power transformers: a view based on practical experience”;
[4] Diagnostics for High Voltage Assets and Lab course, first lecture: Insulation Coordination,
page 1;
[5] Heathcote M.J.: “The J&P Transformer Book”, 12th ed., Newnes, Oxford, 1998, page 4-6;
[6] van Schijndel, Arjan “Power Transformer Reliability Modelling”, Ph.D. dissertation, Eindhoven
University of Technology, 2010, page 1-3;
[7] Ryan, H.M.: “High voltage engineering and testing”, Peter Peregrinus Ltd., London, 1994,
page 289-290;
[8] Naidu, S.R.; Neilson, J.B.; Srivastava, K.D.: “The volt-time characteristics of oil-impregnated
Paper insulation in the submicrosecond and microsecond regime”, IEEE Transactions on
Electrical Insulation, Vol.24, No.1, February 1989;
[9] Rahimpour, E.; Hamidi, N.:” The effects of axial displacement of transformer windings on
impulse and transferred voltage distribution”, Electric Power Systems Research 76, 2006, page
509–514;
[10] Malik, N.H.; Al-Arainy, A.A.; Qureshi, M.I.: “Electrical Insulation in Power Systems”, Marcel
Dekker, New York, 1998, page 229-232;
[11] Kreuger, F.H.: “Industrial High Voltage”, Volume 1, Delft University Press, 1991, page 142;
[12] Allan, D. J; Moore H.: “Electric Power Transformer Engineering”, Second Edition, 2004, page
249;
[13] R. Bartnikas, K.D. Srivastava – “Power and Communication Cables – Theory and
application”, Institute of Electrical and Electronics Engineers, United States of America,
2000;
[14] Harlow, J.H.: “Electric Power Transformer Engineering”, CRC Press, 2004, page 248;

Bibliography
164
[15] Cigré, "Ageing of cellulose in mineral-oil insulated transformers", Cigré Brochure 323,
2007, page 46;
[16] Malik, N.H.; Al-Arainy, A.A.; Qureshi, M.I.: “Electrical Insulation in Power Systems”, Marcel
Dekker, New York, 1998, page 231-232;
[17] Heathcote, M.: “J&P Transformer Book”, 13th
edition, Newark Ltd., 2007, page 54-55;
[18] Allan, D. J; Moore H.: “Electric Power Transformer Engineering”, Second Edition, 2004, page
31;
[19] Ryan, H.M.: “High voltage engineering and testing”, Peter Peregrinus Ltd., London, 1994,
page 269-273;
[20] Allan, D. J; Moore H.: “Electric Power Transformer Engineering”, Second Edition, 2004, page
36-37;
[21] Ryan, H.M.: “High voltage engineering and testing”, Peter Peregrinus Ltd., London, 1994,
page 278-280;
[22] Kreuger, F.H.: “Industrial High Voltage”, Volume 3, Delft University Press, 1991, page 1-10;
[23] IEC Standard 60071: “Computational guide to insulation co-ordination and modelling of
electrical networks”, 2004;
[24] Ryan, H.M.: “High voltage engineering and testing”, Peter Peregrinus Ltd., London, 1994,
page 43-46;
[25] Malik, N.H.; Al-Arainy, A.A.; Qureshi, M.I.: “Electrical Insulation in Power Systems”, Marcel
Dekker, New York, 1998, page 173-177;
[26] Kreuger, F.H.: “Industrial High Voltage”, Volume 1, Delft University Press, 1991, page 141;
[27] Standring, W.G.; M.A.; Hughes, R.C.: “Breakdown under impulse voltages of solid and liquid
dielectrics in combination”, IEEE, 1956;
[28] Robinson G.: “Ageing characteristics of paper-insulated cables”, Power Engineering Journal,
March 1990;
[29] IEC Standard 60423-3: “Methods of Test for Electric Strength of Solid Insulating Materials –
Part 3: Additional Requirements for 1.2/50 μs Impulse Tests”, 2002;
[30] Kreuger, F.H.: “Industrial High Voltage”, Volume 3, Delft University Press, 1991, page 13-19;
[31] IEC 60060-1 Ed. 3.0: “High-voltage test techniques. Part 1: General definitions and test
requirements”, 2009;
Bibliography
165
[32] Heathcote, M.: “J&P Transformer Book”, 13th
edition, Newark Ltd., 2007, page 125-127;
[33] Heathcote, M.: “J&P Transformer Book”, 13th
edition, Newark Ltd., 2007, page 124-125;
[34] Kreuger, F.H.: “Cigre 206 – Variables affecting the dielectric strength of oil-impregnated
cables”, 1962;
[35] www.transformermaterials.com.sg;
[36] Kreuger, F.H.: “Industrial High Voltage”, Volume 3, Delft University Press, 1991, page 49-52;
[37] Kuffel, E.; Zaengl W.S.; Kuffel J.: “High Voltage Engineering – Fundamentals”, Second
Edition, Newnes, 2000, page 52-63;
[38] Naidu, M.S.; Kamaraju V.: “High Voltage Engineering”, Second Edition, McGraw-Hill PLC,
1996, page 134-135;
[39] IEC Standard 62539: “Guide for the statistical analysis of electrical insulalation breakdown
data”, 2007;
[40] Kececioglu, D.: Reliability & Life Testing Handbook, Volume 1, Englewood Cliffs, New Jersey,
USA: PTR Prentice-Hall Inc., 1993, page 616;
[41] Abernethy, R.B.: “The new Weibull Handbook”, Fourth Edition, Printings, 2000, page 2-4;
[42] Abernethy, R.B.: “The new Weibull Handbook”, Fourth Edition, Printings, 2000, page 34;
[43] Abernethy, R.B.: “The new Weibull Handbook”, Fourth Edition, Printings, 2000, page 124;
[44] Abernethy, R.B.: “The new Weibull Handbook”, Fourth Edition, Printings, 2000, page 17-20;
[45] E. Peschke and E. von Olshausen, “Cable Systems for High and Extra-High Voltage“, Berlin:
Publicis MCD, 1999.

166
Acknowledgements
I would like to express my gratitude to Mister Kees Spoorenberg for his confidence in my
work, for providing me with all the necessary literature and for explaining me the insides of
power transformer theory. He was always available to help me to interpret and analyze the
results.
I also want to thank ing. Paul van Nes for helping me with the measurements and for
assisting me to understand better the insides of high voltage testing. Another person that I
would like to show appreciation is Wim Termorshuizen for always being helpful.
Furthermore, I would like to be grateful to dr.ir. Peter Morshuis for giving me inspiration
and for giving important advices in writing this report.
I would also like to thank ir. Lukasz Chmura for explaining me in the simplest manner the
functionality of Weibull Software.
Another thanks to prof. dr. Johan Smit and dr.ir. Andre Bossche, for participating in my
thesis committee. I appreciate it that you are taking time for this.
Finally, I would like to thank my sister, my brother-in-law and my parents for supporting
me throughout my master years at TUDelft.


![U-165 Reference Design: Isolated 50 Watt Flyback Converter ...Transformer Design [2] The transformer in a flyback converter is actually a coupled inductor with multiple windings. Trans-formers](https://static.fdocuments.in/doc/165x107/6067efcf513c1477013c4438/u-165-reference-design-isolated-50-watt-flyback-converter-transformer-design.jpg)
