The Intersection of Theory and Application in …painter/articles/kjp023.pdf · in Elucidating...
80
Math. Model. Nat. Phenom. Vol. 4, No. 4, 2009, pp. DOI: 10.1051/mmnp/20094402 The Intersection of Theory and Application in Elucidating Pattern Formation in Developmental Biology H. G. Othmer 1* , K. Painter 2 , D. Umulis 3 and C. Xue 4 1 School of Mathematics and Digital Technology Center University of Minnesota, Minneapolis, MN 55455 USA 2 Department of Mathematics Department of Mathematics and Maxwell Institute for Mathematical Sciences Heriot-Watt University, Edinburgh, EH14 4AS, UK 3 Agricultural & Biological Engineering Purdue University, West Lafayette, IN USA 47907 USA 4 Mathematical Biosciences Institute Ohio State University, Columbus, OH 43210 USA Abstract. We discuss theoretical and experimental approaches to three distinct developmental systems that illustrate how theory can influence experimental work and vice-versa. The chosen systems – Drosophila melanogaster, bacterial pattern formation, and pigmentation patterns – il- lustrate the fundamental physical processes of signaling, growth and cell division, and cell move- ment involved in pattern formation and development. These systems exemplify the current state of theoretical and experimental understanding of how these processes produce the observed pat- terns, and illustrate how theoretical and experimental approaches can interact to lead to a better understanding of development. As John Bonner said long ago ‘We have arrived at the stage where models are useful to suggest experiments, and the facts of the experiments in turn lead to new and improved models that suggest new experiments. By this rocking back and forth between the reality of experimental facts and the dream world of hypotheses, we can move slowly toward a satisfactory solution of the major problems of developmental biology.’ Key words: robustness, chemotaxis, bacterial patterns, animal coat markings AMS subject classification: 35Q80, 92B05 * Corresponding author. E-mail: [email protected] 1
Transcript of The Intersection of Theory and Application in …painter/articles/kjp023.pdf · in Elucidating...

Math. Model. Nat. Phenom.Vol. 4, No. 4, 2009, pp.
DOI: 10.1051/mmnp/20094402
The Intersection of Theory and Applicationin Elucidating Pattern Formation in Developmental Biology
H. G. Othmer1∗, K. Painter2, D. Umulis3 and C. Xue4
1 School of Mathematics and Digital Technology CenterUniversity of Minnesota, Minneapolis, MN 55455 USA
2 Department of MathematicsDepartment of Mathematics and Maxwell Institute for Mathematical Sciences
Heriot-Watt University, Edinburgh, EH14 4AS, UK3 Agricultural & Biological Engineering
Purdue University, West Lafayette, IN USA 47907 USA4 Mathematical Biosciences Institute
Ohio State University, Columbus, OH 43210 USA
Abstract. We discuss theoretical and experimental approaches to three distinct developmentalsystems that illustrate how theory can influence experimental work and vice-versa. The chosensystems – Drosophila melanogaster, bacterial pattern formation, and pigmentation patterns – il-lustrate the fundamental physical processes of signaling, growth and cell division, and cell move-ment involved in pattern formation and development. These systems exemplify the current stateof theoretical and experimental understanding of how these processes produce the observed pat-terns, and illustrate how theoretical and experimental approaches can interact to lead to a betterunderstanding of development. As John Bonner said long ago
‘We have arrived at the stage where models are useful to suggest experiments, and the facts ofthe experiments in turn lead to new and improved models that suggest new experiments. By thisrocking back and forth between the reality of experimental facts and the dream world of hypotheses,we can move slowly toward a satisfactory solution of the major problems of developmental biology.’
Key words: robustness, chemotaxis, bacterial patterns, animal coat markingsAMS subject classification: 35Q80, 92B05
∗Corresponding author. E-mail: [email protected]
1

H. G. Othmer et al. The intersection of theory and application in developmental biology
1. IntroductionThe word pattern, which stems from the French patron and the Latin patronus, means variouslya model or template (as in design), a regularly-repeating sequence of shapes, objects or states intime and/or space (in mathematics), or more colloquially, something to be emulated. What does itmean in biology? Often the term is used loosely to mean the variation of a structure or occurrenceor characteristic in space and/or time. For example, the leopard spots and zebra stripes shown inFigure 1 show differing degrees of regularity, and animal coat markings in general usually do notexhibit precise symmetry properties, yet we refer to them as patterns. Similarly, the arrangement ofhair follicles is referred to as a spatial pattern, even though its primary characteristic is a roughlyequal distance in space between the ‘units’. Obviously there are many levels at which what wecall pattern occurs, from the population-level, as in the bacterial patterns described later, to thesingle organism level of animal coat markings (though many cells are involved here), to the singlecell level in early Drosophila melanogaster development. Certainly the mechanisms that generatepatterns at the different levels differ in detail, but some aspects are common: there must be a signalof some sort, and mechanisms for detecting that signal and acting on it. Of course what the signalis and what it means to act on the signal differs from case to case.
Skin pigmentation markings, such as the characteristic stripes of zebras or the spots of a leop-ard, provide one of the most common and elegant examples of biological patterns (see Figure1). Many of the advantages that accrue from the display of markings are obvious: these includecamouflage, warnings, like-recognition and mate attraction, yet a number of less apparent benefitshave also been set forth. For instance, in the case of zebra stripes these include social interactions,thermoregulation and even protection from insects such as tsetse flies [193].
In the developmental context, the adult form of an organism is achieved by numerous repe-titions of three basic developmental processes: (i) growth and cell division, (ii) morphogeneticmovements of cells and, (iii) determination and molecular differentiation of cells. The develop-mental fate of either isolated cells or cells in a tissue is governed both by its current internal stateand by its previous history. Pictorially one can view the instantaneous internal state as a point ina high dimensional space in which the coordinates are concentrations and other relevant factors,and the evolution of the state in time determines a curve, or better a tube, given the inevitablefluctuations in the state, in this state space. A cell is said to be determined when a particulardevelopmental pathway has been singled out, whereas it is differentiated when the program forthat pathway has been executed. At the molecular level, determination is generally viewed as ei-ther preparation for transcription, or actual transcription, of a particular battery of genes, whereasmolecular differentiation involves the production of enzymes or structural proteins that alter themorphology and function of a cell. These processes are more or less tightly coupled, though theremay be separate control of RNA processing, and hereafter we simply speak of differentiation.
1.1. Fundamental mechanisms of pattern formationWhile significant advances in understanding the molecular components involved in signal trans-duction and gene expression for model systems such as Drosophila melanogaster have been made
2

H. G. Othmer et al. The intersection of theory and application in developmental biology
Figure 1: Patterning at various levels. Top: The leopard and the zebra. (left) Persian Leopard, (Right)Grevy’s zebra, Bottom: The fruitfly Drosophila melanogaster (left) and patterns in E. coli colonies (right)(courtesy of J. Shapiro).
in the past forty years, the problem of pattern formation remains a major challenge. For sometime following the discovery of the structure of DNA, the prevailing attitude was that the prob-lem would be solved if one could understand how the information encoded in genes is translatedinto the patterns of synthesis that characterizes a given cell type. However, this was a faint hope,because the developmental fate of a cell in a multicellular system (which we will call a tissue)is determined not only by its genome, but also by its internal state, which in turn can depend onits spatial position within the tissue. The genes do not determine the detailed program of cellularactivity, but rather, limit the scope of these activities. By setting bounds on the type of responsethat is possible for a cell in a given environment at a given stage of its development, the broad out-line of cell development is set, but details remain a function of the cellular environment. Becausegene transcription can be influenced by transcription factors in the cytoplasm, and because cellscan exchange material either directly via gap junctions or indirectly via the extracellular space,intercellular communication can play a significant role in determining which part of the geneticcode is transcribed at a particular point in space and time.
1.1.1. Patterning controlled by prepatterns
Morphogen-based models for pattern formation and regulation fall into two main classes: thosewith specialized regions that produce or degrade morphogens and those in which pattern emergesspontaneously in an aggregate of identical cells. Models of the former type are generally describedas positional information models, but we call them prepattern models, since the next stage of
3

H. G. Othmer et al. The intersection of theory and application in developmental biology
patterning is predicated on the pattern established in a previous stage. The other main class hastwo subclasses, one in which the pattern has a high degree of regularity with respect to somereference frame, for example, the boundary of a tissue, whereas the other type is characterized bya more or less random reference point of the structures, but also a more or less uniform spacingbetween them. The canonical example of the first subclass is a Turing model, and an example ofthe second is the spacing of hair follicles [42].
While spatial differentiation can certainly occur in a single isolated cell such as the Drosophilaegg, the difficult theoretical problems arise in tissues, because in order to produce position-dependentdifferentiation, each cell must evolve along the appropriate curve in state space so as to select theappropriate developmental pathway. Such space dependent differentiation or pattern formationcan be thought of as resulting from the cellular response to an appropriate spatial pattern of controlsignals that establishes which genes are to be transcribed, which proteins produced, and what otherchanges of cellular state are to be made. These signals can be biochemical or mechanical, andmay be the concentration of a critical substrate that produces changes in transcription, an extracel-lular diffusable ligand that produces downstream changes in response to changes in occupancy ofreceptors in the membrane, or some other cellular state variable. This primary pattern of signals,which we call a prepattern, may be inherited or externally-maintained, or it may arise sponta-neously within the tissue. Development usually proceeds in stages, and the pattern in one stageoften serves as the prepattern of the next, as will be seen in the context of Drosophila melanogaster.In Alan Turing’s words ‘Most of an organism, most of the time, is developing from one patterninto another, rather than from homogeneity into a pattern’ [219].
The spatial distribution of extracellular state variables defines what we call the morphogeneticlandscape to which the cells respond, and frequently alter by release of components into the ex-tracellular space. When the signals in extracellular variables are diffusible molecules that affectthe internal state in a concentration-dependent manner, they are called morphogens, a term coinedby the British mathematician Turing [219]. More precisely, morphogens are defined as secretedsignaling molecules that (i) are produced in a restricted portion of a tissue, (ii) are transported bydiffusion [116], active transport, relay mechanisms, or other means to the remainder of the tissue[109], (iii) are detected by specific receptors or bind to regulatory regions of DNA, and (iv) initi-ate an intracellular signal transduction cascade that initiates or terminates the expression of targetgenes in a concentration-dependent manner. The concept of a morphogenetic landscape, usuallydescribed as a developmental field similar to the classical fields in physics, played a role through-out the early history of theoretical work in pattern formation [40]. When morphogens are involved,the morphogenetic landscape usually varies smoothly in space, but as the zebra exemplifies, andas will be seen later for Drosophila melanogaster, there is often a very sharp delineation betweendifferent elements of a pattern. Thus the response to an established prepattern may require con-version of a smoothly-varying extracellular signal into a step-like response via some downstreamthresholding mechanism.
The early theories of developmental fields were synthesized into the theory of positional infor-mation by Wolpert [235]. Formally the theory posits that a cell must ‘know’ its position relative toother cells in order to adopt the correct developmental pathway, but of course what a cell ‘knows’is determined by the information it extracts from the past and current signals received. Drosophila
4

H. G. Othmer et al. The intersection of theory and application in developmental biology
melanagaster is one of several model systems discussed later for which a number of morphogenshave been identified, and for which many of the components of the signal transduction and genecontrol networks involved in patterning are known. However, less is known about how these net-works produce the desired spatio-temporal pattern of gene expression.
1.1.2. Spontaneous emergence of pattern
To distinguish between the control mechanism underlying spontaneously-forming patterns thatare fixed with respect to a boundary from those characterized by a more or less random locationbut regular spacing, consider a two-dimensional network of cells, each of which is coupled to itsnearest neighbors by junctional membranes, and suppose that the network is effectively isolatedfrom the remainder of the organism. In the second type of pattern, the spatial distribution ofdifferentiated cells is not rigidly fixed relative to the boundary, but rather, the spacing betweendifferentiated cells is approximately constant. Examples of this kind of pattern include the locationof certain kinds of insect bristles [43], the spacing of hair follicles [42], the pattern of peripheralnerve connections in vertebrates, the eye where Notch-Delta signaling is involved [60, 27] and ingeneral, any pattern in which the absolute number and location of pattern elements is less importantthan the final density of these elements.
In contrast, the first type of pattern contains a fixed number of structures located at more orless fixed positions. Examples of this type abound: on many insects the sensory structures on theepidermis are arranged in a constant number of rows with a fixed number of structures in eachrow. Other examples are the over-all body segmentation pattern in arthropods and worms, thesegmentation of internal structures such as vertebrate somites, and the synaptic connections ofretinal ganglion cells in the midbrain tectum. In many of these examples the number of structuresis constant over a wide range of total cell number and hence aggregate size, thereby reflecting ahigh degree of regulation with respect to the number of structures. Figuratively speaking, thesesystems behave as though the basic pattern is embedded in a rubber sheet and then stretched orcompressed to accommodate to the overall size of the organism.
It is easy to construct a hypothetical control scheme for the second type of pattern. As an exam-ple, consider an insect bristle pattern and suppose that initiation of bristle formation occurs whenthe concentration of some essential substrate exceeds a threshold level. Further, suppose that everycell produces this substrate, that growth and maintenance of a bristle requires a constant supply ofthe substrate, and that the production rate in a single cell is insufficient to support a bristle. If allcells are initially below threshold, initiation will occur in randomly-located cells in the aggregate.If the cells are all coupled and the substrate can diffuse between cells, bristle formation in a givencell will deplete the substrate in surrounding cells and prevent formation of nearby bristles. Statis-tical analysis of the final density of structures that can be supported has been carried out and theresults agree very well with observed densities, not only for bristle patterns but also for hair folliclepatterns in several different species [76]. An alternate hypothesis that leads to similar patterns hasit that each bristle, once initiated, emits an inhibitory substance that prevents formation of bristlesnearby. At present one cannot decide between the depletion and inhibition models because themolecular basis of the control scheme is not yet known. In a related problem, Jung, et al. [100]
5

H. G. Othmer et al. The intersection of theory and application in developmental biology
show that the feather tract is initiated by a continuous stripe of sonic hedgehog and growth factorexpression in the epithelium, which then separates into distinct feather primordia. They develop acomplex model that involves a uniformly-distributed activator, an activator of primordium ‘com-petence’ that propagates across the field, and local activators and inhibitors whose production isinitiated in primordia.
The random-initiation-site model is clearly inadequate for producing the precisely-ordered pat-terns of the first type, and the most interesting theory proposed for the generation of such patternsis due to Turing [219]. In Turing’s model two or more chemical substances called morphogensreact within each cell and diffuse between cells. All cells are assumed to be identical initially andcells at the boundary are closed, and thus the reaction-diffusion equations that describe the modelhave a solution that is spatially- uniform. What Turing showed is that this uniform state can be un-stable to some non-uniform disturbances if the kinetic interactions and the diffusion constants arechosen appropriately. Such instabilities, which Turing called symmetry-breaking, can lead to ei-ther a steady or time- periodic nonuniform distribution of morphogens. The unstable wavelengthsare fixed by the kinetic coefficients and the diffusivities, and therefore each unstable system hasan intrinsic chemical wavelength. Thus identical systems will give rise to an identical distributionof morphogens and, via an appropriate interpretation mechanism, to an identical pattern of celldifferentiation. Turing himself suggested that the model could account for the regular spacing oftentacles on Hydra and that it might be applicable to phyllotaxis. In the early sixties several biolo-gists used the model to explain the pattern of sensory structures on the epidermis of certain insects.Since none of the morphogens were identified in any of the systems, the applicability of the modelto these systems still remains in doubt.
More recently the existence of theoretically-predicted patterns has been demonstrated un-der carefully controlled experimental conditions in the “CIMA” (Chlorite-Iodide-Malonic Acid-Starch) reaction, [39, 54, 171]. When all of the measured parameters are entered into the mathe-matical model derived from the known chemical reactions, excellent agreement is found betweenthe predicted patterns and those observed experimentally [120]. These and further observationsleave little doubt that interactions of reaction and diffusion can give rise to instabilities and resultin well-defined spatial patterns (cf. also [127]).
What remains in doubt is whether the mechanism is applicable to any biological systems. Twopotential applications are the generation of feather bud tracts in birds and hair follicle patterns ofmammals (cf. also [87], this issue). In the former, Jung et al. [100] have identified a number ofactivators and inhibitors that are involved in feather bud formation and suggest that the patterningmay involve a Turing mechanism, but this remains to be shown. In the latter Sick et al. [207] reportexperimental evidence that Wnt and its inhibitor Dkk function as an activator-inhibitor pair in theTuring sense for hair follicle formation. On the other hand, Mou et al. [142] report the additionalactivator-inhibitor coupling between Edar receptor and its inhibitor BMP in localizing follicles.The incorporation of these interactions along with further species into the actual network raisesquestions as to whether a two-component representation will be adequate in practice. The best thatcan be done at present is to withhold judgment until more concrete tests of its applicability arepossible.
6

H. G. Othmer et al. The intersection of theory and application in developmental biology
1.1.3. Spatial patterns in populations of mobile units
In the previous discussion we focused on patterning in systems of immobile objects, whethera single cell or a network of connected cells. In these systems the spatial patterning requiresmechanisms for distinguishing the states of adjacent cells or regions within a cell, and reaction-diffusion mechanisms have been widely-invoked in this context. However, when the functionalunits are mobile, movement of the units may play an essential role in pattern formation, whichadds a potentially-important new pattern-generating mechanism. Self-organization at the popula-tion level gives rise to flocks of birds, schools of fish, herds of various mammals, and at a lowerlevel, various types of aggregations in single-cell organisms. It is only recently that the importanceof multicellular organization in prokaryotes, aside from examples such as Myxococcus xanthus,has been recognized [201]. It is now known that intercellular communication and coordination arewidespread in prokaryotes, and many different classes of signaling molecules have been identified.Current interest in this phenomenon stems from the discovery of quorum-sensing molecules suchas the N-acyl homoserine lactones, and their possible role in biofilm formation [68]. Much sim-pler, and more tractable from the modeling standpoint, examples of pattern formation arise in E.coli, S. typhimurium, and B. subtilis colonies [34, 35, 201]. Pattern formation in E. coli , which wediscuss in detail later, involves sensing of extracellular signals and alterations in the swimming be-havior of individuals, as well as production of the attractant. However, spatial patterns can involvemillions of cells, and heretofore modeling of them has been primarily phenomenological; detailsof the cell-level behavior were not incorporated into the equations that describe population-levelbehavior until recently.
Another example of self-organized pattern formation in unicellular organisms arises in the so-cial amoeba Dictyostelium discoideum, which uses oscillatory signaling for aggregation [168].These cells normally live in forest soil where they feed on bacteria [28], but when the food supplyruns out amoebae express receptors that allow them to detect cAMP. They can also relay cAMPsignals, and after about eight hours post-starvation, randomly located cells called pacemakers be-gin to emit cAMP periodically. Nearby cells detect the signal, move towards the cAMP source,and relay the cAMP signal to more distant cells. Eventually the entire population collects intomound-shaped aggregates, each containing up to 105 cells. Mounds elongate to form slugs, whichtopple over and migrate over the substratum. At this stage cells also start to differentiate into pre-stalk and prespore cells, which occurs randomly in a mound. However, as a result of cell sortingand cAMP signaling, the prestalk cells end up in the anterior quarter of the slug, while the presporecells occupy the remaining posterior part. When conditions are favorable, the slug tip is extendedupwards, the anterior prestalk cells become immobilized in a central stalk tube, which the remain-ing cells use as a support for upward movement. When the stalk has reached a certain length theprespore cells mature into spores, which remain dormant until they are dispersed and find condi-tions favorable for growth. The autonomous production and relay of cAMP pulses by starving cellsresults in a very efficient process of chemotactic aggregation, and cAMP oscillations subsequentlyorganize the transformation of mounds into slugs, the migration of slugs over the substratum, andthe culmination into fruiting bodies.
7

H. G. Othmer et al. The intersection of theory and application in developmental biology
1.2. The role of modeling in understanding patterningThe theoretical papers by Turing [219] and Wolpert [235] provided a framework within whichto formulate hypotheses about pattern formation and differential gene expression, but it was notuntil 1988, thirty six years after Turing’s paper and nearly twenty years after Wolpert’s, that thefirst morphogen was identified in a biological system. Driever and Nusslein-Volhard found thatchanging the level or distribution of bicoid mRNA (bcd) resulted in changes in the bicoid (Bcd)protein distribution and a subsequent shift of anterior structures that respond to Bcd in Drosophila[59, 58]. In addition to Bcd, a number of other morphogens have been identified, including thebone morphogenetic proteins, members of the fibroblast growth factor (FGF) family, the epithelialgrowth factor (EGF) family, and additional members of the transforming growth factor-β (TGF-β)family (reviewed in [115, 191]). Many questions about the various steps in Bcd signaling remaintwenty years after the discovery of Bcd as a morphogen, but they go beyond the identity of themolecular components involved.
Currently rapid progress on many questions in pattern formation can be made by integratingmathematical modeling with experimentation in order to understand the mechanisms of patterningin various systems. Over the past decade there has been an explosion in the number of papers thatcouple mathematical modeling with experimentation to understand the biology, determine biophys-ical parameters, and provide a platform for hypothesis testing. Mathematical, mechanistic-basedmodels are thus serving as tools for biological discovery in new and exciting ways, and in manyinstances the mathematical models are leading the biology, rather than simply explaining existingobservations. Mathematical models for Drosophila oogenesis, Bcd patterning, BMP-mediated pat-terning, planar cell polarity, EGF patterning, and segment polarity have all led to experiments thatwould have not have otherwise been carried out, and contributed greatly to our understanding ofthose systems [241, 77, 206, 3, 184]. Some of these will be discussed later.
Numerous phenomenological models for patterning were developed well before the discoveryof the first morphogen in a biological system, and continue to have a substantial impact today.The most prominent example is the Turing model discussed earlier, which has served precisely asPopper held scientific theories should, i.e., a theory should be considered scientific if and only ifit is falsifiable. More colloquially, it is said that ‘all experiments ever do is ruin a good theory’,and this is what should be expected when developing a mathematical model. If the modeling workis compelling enough that it leads to experiments, which may take years to complete, the data thatemerge from this endeavor will increase our understanding of the underlying mechanisms, andmay very well invalidate some components of the model.
The availability of experimental data for Bcd and other morphogens has led to a shift frompredominantly phenomenological models to mechanism-based models, the goals of which are notonly to explain the existing observations within a mechanistic framework, but to also be useful astools for discovery by biologists, biochemists, and geneticists. Some examples of how mathemati-cal models of development have been used in the past are as follows.
• Determine what theoretically-possible mechanism(s) may work. This involves phenomeno-logical modeling or initial hypothesis testing [61, 138, 203, 224] .
8

H. G. Othmer et al. The intersection of theory and application in developmental biology
• Determine how the system works: Quantitatively measure transport and molecular mecha-nisms of pattern formation and include this information in the model [184, 82, 110, 83, 224,200]. This also includes simulating aspects of patterning that are not easily observed such asmorphogen dynamics [224, 97, 138, 3].
• Determine why the system works as it does: Identify mechanisms that confer reproducibility,insensitivity, scale-invariance, or other beneficial performance objectives [61, 227, 224, 82,203, 190, 83, 50, 167, 223, 21, 81].
As a specific example, mathematical modeling has proved very helpful in uncovering mecha-nisms of bacterial pattern formation, as illustrated by the following.
• E.coli can sense and adapt to ligand concentrations spanning five orders of magnitude, andcan detect a change in occupancy of the aspartate receptor Tar of as little as 0.1% [29].The gain of the system, defined as the change in bias divided by the change in receptoroccupancy, can be as high as 55 [197], and mathematical modeling has been integrated withexperimentation to understand the source of the high gain. The model developed in [210]predicted that in the absence of cooperativity in signal transduction, a Hill coefficient of atleast 11 for binding of CheYp at the motor was needed to explain the observed gain of 3-6,and this was subsequently confirmed experimentally [44].
• When E. coli cells secrete a substance to which they also respond, complex patterns mayform under different growth conditions (cf. Section 4.). The hybrid cell-based model de-scribed later provides opportunities to investigate the importance of intracellular processesduring pattern formation by tuning intracellular parameters. One example starts from asteady state of the Patlak-Keller-Segel system with random noise. Simulation in 1D revealsthat a longer adaptation time leads to a larger aggregate size, while either no adaptation orinstantaneous adaptation preclude aggregation. Therefore a finite time for adaptation to thesignal is important for aggregate formation, which explains the experimental finding thatadaptation-defective mutants cannot aggregate.
System-specific details on how theoretical and experimental work has interacted to illustrateBonner’s assertion are given in the remainder of the paper. In the following section we give abrief introduction to the mathematics and physics of pattern-forming processes, and discuss themodeling process in general terms. In Section 3. we treat patterning in Drosophila melanogaster,for which the morphogens are known and cell differentiation involves a prepattern: Bcd alongthe anterior-posterior axis and others along the DV axis. Here the primary processes are reactionand diffusion, since the movement of nuclei to the periphery of the egg is not taken into accountin the model. Section 4. deals with bacterial patterning, where pattern arises spontaneously dueto signaling and cell movement. Both hybrids of cell-based and continuum models, as well aspure continuum models are used here, and the spatial patterns that emerge are primitive forms ofbiofilms. In addition to cell-cell signaling, cell motility plays an essential role here. In Section 5.we discuss pigmentation patterns that occur in butterflies, fish and mammals. As in the bacterial
9

H. G. Othmer et al. The intersection of theory and application in developmental biology
patterns, both spontaneous pattern formation and cell movement are involved, but in these systemspatterning occurs on a growing domain, and growth can modify the patterning process significantly.
2. An overview of the mathematics and physics of pattern for-mation
2.1. The French flag problemIn the simplest version of a prepattern model, either specialized source and sink cells located at theboundary of the developmental field maintain the concentration of the morphogen at appropriatefixed levels, or they produce the morphogen at a fixed rate. In the former case, absent degradationof the morphogen, a linear distribution can be established in a one–dimensional system of about 1mm in length in the time that is normally available for commitment to differentiation [236, 51], andgiven fixed thresholds between different cell types, the tissue can be proportioned into any numberof cell types in a perfectly scale–invariant way. However this scheme clearly has limitations, sincethe flux between source and sink in a one-dimensional system of length L scales as 1/L, and thusthe morphogen producing or consuming cells at the boundary must adjust production to adjust forthe size of the system. For the latter case we introduce a simple version in which the flux at theboundary, rather than the concentration, is specified – generalizations will be discussed later in thecontext of Drosophila patterning. Suppose that a single morphogen is produced at the boundary ofa one-dimensional system, diffuses through the region, and decays via a first-order reaction. Thegoverning equations for the steady-state morphogen concentration c are
Dd2c
dx2= κc x ∈ (0, L)
−Ddc
dx= j x = 0 (2.1)
dc
dx= 0 x = L.
In scaled coordinates this becomes
d2c
dξ2= λ2c ξ ∈ (0, 1)
−dc
dξ= J ξ = 0 (2.2)
dc
dξ= 0 ξ = 1,
whereλ2 ≡ κL2/D and J = jL/D.
10

H. G. Othmer et al. The intersection of theory and application in developmental biology
The solution of this is
c(ξ) =J
λ
[eλ(2−ξ) + eλξ
e2λ − 1
]≡ J
λφ(ξ) =
j√κD
φ(ξ).
Thus the stationary distribution is characterized by one dimensionless parameter λ that is theratio of a diffusion time scale τD ≡ L2/D and a kinetic time scale τK ≡ κ−1, and a dimensionalparameter that is the ratio of the input flux j to a characteristic velocity defined by the diffusionconstant and the decay rate. The former enters in the shape function φ via the exponential termsand determines how rapidly the morphogen concentration decays in space: the larger λ the morerapidly the solution decays from the value at the source. It is clear that for a fixed input flux jboth the amplitude and the shape of the morphogen distribution depend on L, and thus this simplemechanism does not suffice when significant variations in length occur in the developing sys-tem. More complex patterning driven by prepatterns can result when there are several specializedboundary regions. One example arises in vertebrate limb development, where specialized regionscalled the ZPA and the AER direct outgrowth and patterning [57]; others to be discussed laterinclude dorsoventral (DV) patterning in Drosophila melanogaster and the localization of eyespotsin butterfly wing markings.
2.2. The standard Turing modelTuring models involve at least two morphogens that interact chemically and diffuse passively ina network of identical cells [219]. Turing only considered periodic systems or closed surfaces, inwhich case no boundary conditions are needed. More generally, any system of reaction-diffusionequations in which the kinetic mechanism has certain structural features described later, and forwhich the boundary conditions are of the same type for all species, will be called a Turing system[56]. Under certain conditions described later, instabilities of a spatially-uniform stationary statemay develop and lead to either a spatially non–uniform stationary state or to more complicateddynamical behavior. The resulting non-uniform distribution might in turn lead, via an unspeci-fied ‘interpretation’ mechanism, to spatially nonuniform differentiation. Most analyses of Turingmodels only treat instabilities of uniform stationary states, since numerical analysis is generallyrequired for more general stationary states. However, Turing himself recognized the biological un-reality of this in stating that ‘most of an organism, most of the time is developing from one patternto another, rather than from homogeneity into a pattern’ [219]. An excellent review of some of thebackground on pattern formation, particularly of two-component Turing systems, is given in [52]and applications of two component systems to biological problems is described in [75, 131, 10].
In the following analysis we will assume that the temporal dynamics in a spatially uniformsystem are governed by the solution of a system of ordinary differential equations. Let Ω be abounded region in <q, q ≤ 3 with a smooth boundary and outward normal n. The simplest version
11

H. G. Othmer et al. The intersection of theory and application in developmental biology
of Turing’s model for pattern formation is described by the system of reaction–diffusion equations
∂c
∂t= D∇2c + R(c, p) in Ω
n ·D∇c = 0 on ∂Ω (2.3)c(r, 0) = c0(r),
where c = (c1, c2, · · · , cm)T , D is usually assumed to be a constant diagonal matrix, and R is thereaction rate vector. We assume for the present that all Di > 0. The reaction term R(c, p) mayalso contain mass transfer with the surroundings, for if the system is thin in one dimension thenaveraging across that dimension leads to a system such as (2.3) with transfer terms [169].
Let ω−1 be a time scale characteristic of the reactions, let L be a measure of the size of thesystem, and let Ci be a reference concentration for the ith species. Suppose that the species areordered so that maxiDi = D1. Define the dimensionless quantities ui = ci/Ci, τ = ωt,θi = Di/D1, ν = D1/ωL2, and ζ = r/L, where r ≡ (x1, · · · , xq). The dimensionless governingequations are
∂u
∂τ= νD∇2u + R(u, p) in Ω
n · ∇u = 0 on ∂Ω
u(ζ, 0) = u0(ζ),
(2.4)
where D = diag1, θ2, . . . , θm and R(u, p) is the dimensionless form of R(u, p). It is easy toshow from (2.4) that when the reaction term is absent, the solution relaxes exponentially to theaverage concentration set by the initial conditions. It follows that whenever the relaxation timefor diffusion of each species is sufficiently short compared to that of the chemical reactions, thesolution of the variational equation should relax to zero. The relaxation time of the kinetics relativeto that of diffusion is given by ν = ω−1/(L2/D1), and one should expect that solutions of thenonlinear problem will also converge to spatially uniform solutions when ν >> 1. In particular,this should occur when L is sufficiently small, which has been shown rigorously in [162, 45, 7].
However, Turing showed that diffusion could destabilize a steady state that is stable in theabsence of diffusion, and when this occurs one calls it a Turing or diffusive instability. In order todefine this precisely we have to consider the variational system associated with (2.4). Suppose thatus is a time–independent solution of (2.4), and suppose that we linearize (2.4) around us. If we letξ = u− us, then we obtain the variational system
∂ξ
∂τ= νD∇2ξ + Kξ
n · ∇ξ = 0 (2.5)
ξ(ζ, 0) = ξ0(ζ).
12
H. G. Othmer et al. The intersection of theory and application in developmental biology
By assuming solutions of the form ξ = eλτΨ, we obtain the spectral problem
νD∇2Ψ + (K − λI)Ψ = 0
(2.6)n · ∇Ψ = 0.
This is an n-component spectral problem and the eigenfunctions are difficult to obtain in general,but if us is a constant the eigenfunctions can be written Ψjn = yjnφn, where φn is a solution of thescalar eigenvalue problem
∇2φn = −α2nφn
n · ∇φn = 0.(2.7)
It follows that the vector yjn ∈ <m is a solution of the algebraic eigenvalue problem
(K − µnD − λI)y = 0, (2.8)
where µn ≡ α2nν. Generically the eigenfunctions are complete, and the solution of the variational
equation can be written
ξ(ζ, τ) =∞∑
n=0
e(K−µnD)τynφn(ζ), (2.9)
where the yn ∈ <m are determined by the initial data†. Thus stability in an L2(Ω) sense for thelinearized reaction-diffusion equation with homogeneous boundary conditions is governed by theeigenvalues of the family K − µnD∞n=0. It is also well–known that the principle of linearizedstability holds for equations like (2.5), which means that asymptotic stability or instability for thezero solution of the variational equations implies the same properties of the solution us of thenonlinear equations.
The spatial eigenfunction φn(ζ) determines the spatial variation of that mode, but this has theequivalent form
φn(ζ) = φ(αnζ) = φ(αn
Lr)
, (2.10)
where φ is the solution of∇2φ = −φ in Ω
with homogeneous Neumann boundary conditions. Thus all of the spatial modes can be obtainedfrom a universal function by appropriately scaling the argument, but this only holds in the case ofhomogeneous boundary conditions.
Since the Laplacian has a compact inverse for a reasonable domain, the variational problemhas a discrete spectrum, but it is convenient at present to replace µn with a continuous variable.Then stability of us is governed by the character of the eigenvalues of the one-parameter family ofmatrices K − µD for µ ∈ <+, and a diffusive instability is defined as follows [56].
†The mathematical structure of the solution is essentially unchanged if one considers a regular lattice of cells thatinteract with their neighbors via a passive diffusive flux proportional to the concentration differences; all that changesis that the sum is finite [169, 7].
13

H. G. Othmer et al. The intersection of theory and application in developmental biology
Definition 1. Suppose that us is asymptotically stable as a steady–state solution of u′ = R(u, p).We say that a zero–amplitude diffusive instability of us exists if there exist µ±, 0 < µ− ≤ µ+ < ∞,such that K − µD has at least one eigenvalue with a positive real part when µ ∈ (µ−, µ+). If forsome µ∗ ∈ (µ−, µ+), K − µ∗D has a single real positive eigenvalue the instability is stationary atµ∗, while if K−µ∗D has complex eigenvalues with a positive real part the instability is oscillatoryat µ∗.
Thus whenever the first eigenvalue that crosses from the left-half plane (LHP) to the right-half plane (RHP) is real the instability is stationary, and generically this leads to bifurcation ofa stationary solution from us, whereas oscillatory instabilities generically lead to bifurcation ofperiodic solutions from us.
In the study of pattern formation one is interested in conditions on the kinetics under whichTuring instabilities can arise, and the following theorem summarizes necessary conditions for sta-bility of a uniform steady state. From this one can identify the type of kinetic interactions that canpotentially give rise to diffusive instabilities under appropriate conditions on the parameters. In thetheorem, K[i1, i2, · · · , ip] denotes a p×p principal submatrix of K formed from rows and columnsi1, i2, · · · , ip for 1 ≤ p ≤ n− 1.
Theorem 2..1. [163] Let D be diagonal with Dj ≥ 0. In order that σ(K − µD) ⊂ LHP for allsuch D and all µ ∈ [0,∞), it is necessary that
• σ(K) ⊂ LHP
• σ(K[i1, i2, · · · , ip]) ⊂ LHP for all pth-order submatrices of K, where 1 ≤ p ≤ n− 1.
These conditions are also sufficient for linearized stability for all µ ∈ [0,∞) for n = 2 and n = 3.The physical interpretation of how instabilities arise at positive wavelengths when one of the
conditions in Theorem 2..1 is violated goes as follows. Suppose that there is an unstable subsystemof order p represented by K1, and suppose that K is partitioned as in the proof of Theorem 2..1,i.e.,
K =
[K1 K2
K3 K4
].
By hypothesis, the complementary subsystem, whose matrix is K4 and which comprises speciesp + 1 through n, is stable. The off-diagonal blocks K2 and K3 represent the interaction betweenthe two subsystems. Were K2 and/or K3 identically zero, the two subsystems would be uncoupledand the composite system of species 1 . . . n would be unstable. However, because the unstablesubsystem is embedded in a larger network, the instability in the subsystem can be suppressedthrough stabilizing interactions with the rest of the network in a spatially-homogeneous system.
When spatial variations are allowed, the amplitudes of the Fourier components of any distur-bance satisfy the equation
dyk
dτ= (K − µkD)yk
and if we choose
D =
[0 00 I
]
14

H. G. Othmer et al. The intersection of theory and application in developmental biology
and partition yk appropriately, then
dyk1
dτ= K1yk1 + K2yk2
(2.11)dyk2
dτ= K3yk1 + (K4 − µkI)yk2.
Since σ(K1)∩RHP 6= ∅, yk1(τ) grows exponentially if yk2(τ) ≡ 0. Of course yk2(τ) 6≡ 0 initially,but if µk is large enough it will decay rapidly and its stabilizing effect on yk1 will be lost. Thusdiffusion offsets the influence of the stable subsystem by quenching the amplitude of the stablecomponents.
A similar analysis can be done when the reference solution is a spatially-uniform periodicoscillation, rather than a steady state, and the result is that synchronized oscillations can also bedestabilized when the diffusion coefficients differ appropriately [162].
2.2.1. Diffusive instabilities for two component systems
When a diffusive instability cannot be ruled out, a more detailed analysis of how the intervals ofunstable wave numbers depend on the linearized kinetic parameters and on the ratio of diffusioncoefficients for a two-component system goes as follows (cf. [161, 149]). When there are onlytwo components the only diffusive instabilities possible are stationary for non-negative diffusioncoefficients, and thus instability occurs if det(K − µD) becomes negative for some µ. Supposethat the second component is self-activating, which means that k22 > 0, then one finds that µ± > 0only if θ ≡ D2/D1 < −k22/k11
‡. Furthermore, for fixed kij the discriminant of det(K − µD) is aquadratic in θ, the roots of which are
θ± =detK − k12k21 ± 2
√−k12k21 det K
k211
.
It can be shown that
0 < θ− <−k22
k11
< θ+,
and therefore the maximum allowable θ for which a zero–amplitude diffusive instability occurs atsome µ > 0 is θc ≡ θ−. Note that if trace K = det K = 0, then θ± → 1, which means that adiffusive instability can occur when the ratio of the diffusion coefficients is arbitrarily close to one,provided that both eigenvalues of the Jacobian for the kinetics are sufficiently close to zero. Thisconclusion carries over to n-component systems as well [182].
At the critical value θ of the ratio of diffusion coefficients, the critical µ is
µ+ = µ− ≡ µc =k22 + θck11
2θc, (2.12)
‡In section 5.2.1. Figure 14, we display representative examples of the types of stationary patterns that can emergefor a specific two-component system in two space dimensions.
15

H. G. Othmer et al. The intersection of theory and application in developmental biology
and the corresponding critical wave number is
αc
L≡
√µcω
D1
=
√ω
D1
(k22 + θck11
2θc
). (2.13)
The reciprocal of this defines a natural or intrinsic wavelength at marginal instability, which Turing[219] called the chemical wavelength. It is determined by the physico-chemical properties of thesystem, in particular the kinetic sensitivities at the steady state and the diffusion coefficients, but isindependent of any geometric properties of the domain. In a one–dimensional system of length Lwith homogeneous Neumann boundary conditions, αn = nπ, n = 0, 1, · · · and φn = cos nπx/L,while under homogeneous Dirichlet conditions αn = nπ, n = 1, · · · and φn = sin nπx/L. Ineither case the critical wave number is indexed by the integer n closest to
L
π
√ω
D1
(k22 + θck11
2θc
)
(see [163]). If K andD are such that there is a positive real eigenvalue of K−µD for µ ∈ [µ−, µ+],then perturbations containing the mode φn are unstable when
L ∈ [L−n , L+
n
]=
[nπ
√D1
ωµ+, nπ
√D1
ωµ−
]. (2.14)
In a slowly growing system, one expects that as L increases from zero the uniform steady statealways loses stability with respect to φ1 first and is linearly unstable with respect to φ1 over therange
∆L1 ≡ L+1 − L−1 = π
√D1
ω
[1√µ−
− 1√µ+
].
A more detailed analysis of growth shows that this is correct for growth that is very slow comparedto the reaction and diffusion dynamics, but a more detailed analysis is needed in general, as willbe shown later.
Assuming that growth is sufficiently slow, a simple measure of the range for which the quali-tative features of small-amplitude patterns are invariant under changes in length is the interval ofinstability for the nth mode, which is given by
∆Ln = nπ
√D1
ω
[1√µ−
− 1√µ+
].
Whenever n is large enough or θ is sufficiently small, the intervals overlap and there is more thanone mode to which the uniform steady state is unstable. In this case it is possible that more than onespatially-varying solution is stable or that the spatial distribution of the morphogens in the stablesolution bears little resemblance to the spatial variation of the eigenfunctions. Thus linear analysisgives little information about scale–invariance in the full nonlinear model in these cases, but it
16

H. G. Othmer et al. The intersection of theory and application in developmental biology
emphasizes again the fact that Turing’s model does not show perfect scale–invariance. Modelswith different boundary conditions on different species, for instance homogeneous Neumann onsome species and homogeneous Dirichlet conditions on the others, show greater insensitivity tochanges in scale [56], and perfect scale-invariance can be achieved by modulating either the kineticcoefficients or the diffusion coefficients appropriately, as is discussed later.
2.3. Other morphogen transport mechanismsIn either Turing’s model or models based on source-sink mechanisms, the system is regarded as ahomogeneous medium in which reaction occurs and transport is by passive diffusion as describedby Fick’s law, for which the flux of a species is proportional to the spatial gradient of that species.However there are several other modes of cell-cell communication, including the following.
• Indirect transfer via secretion into the extracellular space followed by re-uptake by a varietyof mechanisms. The analog of Turing’s problem for this mode of communication has beenanalyzed for passive secretion and uptake mechanisms [163], but detailed models of endo-and exocytosis have not been included in this context. This is a formidable task, as theexample of the Drosophila wing disc shown in Figure 2 suggests.
• All-to-all communication, in which all cells release the signaling species and all detect andperhaps internalize the signal [164]. While not useful for establishing a spatial pattern, thismode does serve as a quorum-sensing mechanism [16, 8, 78] that can control gene expressionand cell motility, and may be involved in size-regulation in some systems [95].
• Direct cell-cell communication, either via gap junctions or direct receptor-ligand interactions(which is often called juxtacrine signaling). Numerous examples of both types are known:in the Drosophila melanogaster, wing disc cells are coupled via gap junctions [232], butjuxtacrine signaling via Notch and various ligands is used for establishing compartmentboundaries or directing neighboring cells to adopt different fates.
• Active transport, for instance along microtubules, may play a role in polarizing cells.
Several of these mechanisms play an important role in the patterning of the wing disc in Drosophila,as illustrated in Figure 2.
Frequently the complexity involved in the interactions of the different processes is hidden byanalyzing the spread of morphogens using a simple reaction-diffusion system such as (2.3) [110],but how to relate the individual steps in what may be a very complex process to such a high-leveldescription is not known.
Processes such as directed transport along microtubules require different descriptions of trans-port, and we discuss two of them here. The first is a generalization of the simplest Brownianmotion model that leads to Fick’s law, in which particles execute a random walk in space due totheir interaction with the background particles in the medium. We call this the position- or space-jump process, since it comprises a sequence of alternating pauses and jumps. In pure moleculardiffusion the pauses are negligible but when, for example, binding is allowed, the duration of a
17

H. G. Othmer et al. The intersection of theory and application in developmental biology
Figure 2: Patterning of epithelial cells in the Drosophila wing imaginal disc. The morphogen Dpp patternsthe Anterior/Posterior compartments of the Drosophila wing imaginal disc in (A) top view showing the pouchand (B) slice (along dotted line in (A)) showing the geometry of the columnar cells. (C-D) Dpp establishesa non-uniform distribution to pattern the anterior/posterior axis by transport and reaction. Numerous pro-cesses may contribute to formation of the Dpp distribution including diffusion around columnar cells (C) ortranscytosis through columnar cells (D). Dpp secreted in the basolateral space cannot enter the lumen andvice versa due to the presence of septate junctions (SJ) in (D).
pause is governed by an exponential waiting time distribution. Furthermore, the direction of thesteps is uniformly distributed and the distribution of lengths sharply peaked. A general formulationthat can be reduced to the simplest diffusion process leads to the renewal equation
P (x, t|0) = Φ(t)δ(x) +
∫ t
0
∫
Rn
φ(t− τ)T (x,y)P (y, τ |0) dy dτ, (2.15)
wherein P (x, t|0) is the probability that a particle that begins at the origin at time 0 will be at x ∈Ω ⊂ Rn at time t, φ is the waiting time distribution, Φ is the complementary cumulative waitingtime distribution, and T is a kernel that determines the next position x for a walker currently at y[165]§. The primary assumption in this formulation is that the waiting time between jumps and thesize and direction of a jump are uncoupled. Under suitable assumptions concerning the existenceof limits as the mean step size goes to zero and the frequency of stepping goes to infinity, theprocess is governed by a diffusion equation, but other evolution equations will result for otherwaiting time distributions or other jump kernels. Using this formalism it is easy to incorporate‘resting’ or transient ‘trapping’ states, and thereby to model various modes of binding or temporarylocalization. If for example, the waiting time distribution has a sufficiently fat tail this can lead towhat is called ‘sub-diffusion’, for which the mean square displacement of a particle is characterizedby < r2 >∝ tα, for α < 1 [194].
§This result is a generalization of an earlier result due to Scher and Lax [195] for lattices. The authors of [165]were unaware of the earlier result until very recently.
18

H. G. Othmer et al. The intersection of theory and application in developmental biology
2.4. The mathematical description of chemotaxisFormation of spatial patterns of morphogens and cell determination may also involve cell move-ment in addition to reaction and transport. A dramatic example of this occurs in the formationof pigmentation patterns, which are discussed in Section 5. For instance in fish, various types ofpigment cells migrate in the epithelium to form the variety of spots and stripes that are observed.Although it has not been established experimentally, it is likely that pigment cells respond to aspatial distribution of chemical attractants and repellents, and thereby establish the spatial patternof pigment cells. A phenomenological model of cell movement in response to chemoattractants orchemorepellents leads to what is called the classical chemotaxis equation or the Patlak-Keller-Segel(PKS) chemotaxis equation (2.18), and this has been applied to model chemotactic movement inmany different contexts [104, 105, 106, 180, 70, 128, 4, 192]. In Sections 4. and 5. we summarizemodels of bacterial pattern formation in E. coli and fish pigmentation, respectively, that employthe PKS equation. Here we provide a brief introduction to the derivation of this equation.
Let n(x, t) denote the cell density as a function of space and time, and suppose that in theabsence of chemosignals cells execute an unbiased random walk. Under a suitable scaling of spaceand time, n evolves according to a diffusion process governed by
∂n
∂t= ∇ · (Dn∇n), (2.16)
where Dn is the diffusion coefficient of the cells. The diffusive flux is given by j = −Dn∇n,which is simply Fick’s law applied to cells. In the presence of a gradient of a chemosignal onepostulates that the random walk is biased, which gives rise to a chemotactic drift. To incorporatethe drift, the phenomenological form
j = −Dn∇n + χ(n, S)n∇S (2.17)
is often used, and the evolution equation for cell density becomes
∂n
∂t= ∇ · (Dn∇n− χn∇S). (2.18)
The coefficient χ = χ(n, S, ...) is called the chemotactic sensitivity, us = χ∇S is called themacroscopic chemotactic velocity, and equation (2.18) is called the classical chemotaxis or PKSequation.
Equation (2.18) was first derived by Patlak [181] from a random walk with ‘persistence ofdirection’ and ‘external bias’. Persistence of direction means that the direction of the next step iscorrelated with that of the previous step, whereas external bias means there can be external forceson the particle or other external factors that bias the movement. Equation (2.18) results when thebias is caused by chemosignals. Later Keller and Segel [104] derived a system of four parabolicequations to model the chemotactic movement of Dictyostelium discoideum, and reduced it to(2.18) and the following reaction-diffusion equation for the chemosignal
∂S
∂t= Ds∆sS + R(n, S). (2.19)
19

H. G. Othmer et al. The intersection of theory and application in developmental biology
They suggested that the aggregation of cells results from an instability of the uniform steady state,but it is now known that this is not the correct explanation; aggregation results from the response ofcells to waves of a chemoattractant that are initiated by pacemaker cells. Later, similar equationswere applied to bacterial chemotaxis, with the aim of explaining the traveling bands observed in E.coli by Adler [1, 105, 106]. Here too the conclusion is in doubt because the authors required thatthe chemotaxis sensitivity χ = χ0/S become singular at S = 0 in order to establish the existenceof a traveling wave.
More recently (2.18) and (2.19) have been studied extensively mathematically (see [92] for adetailed review and references). These analyses were motivated by biological features of chemo-tactic movement and the spatial patterns that result. Existence of stable non-uniform steady statesand blow-up solutions were explored to determine if the model can produce patterns of cell con-centration or aggregation [41, 98, 88, 170]. Existence of traveling wave solutions has been studiedto determine whether the model can produce patterns corresponding to the traveling bands of bac-teria observed experimentally [106, 103, 93]. Many variations on the minimal form given by (2.18,2.19) have been developed to incorporate mechanisms, such as excluded volume, that prevent theblow-up solutions in finite time (see [90] for a review). Equations that describe taxis in the presenceof multiple signals have also been derived under various cases [174, 240].
A major drawback in using the phenomenological approach that leads to (2.18) is how onerationalizes the constitutive assumption (2.17). Some characteristics of the microscopic responseof individual cells have been incorporated into the chemotactic sensitivity χ in different contexts.Keller and Segel [105] related the chemotactic sensitivity to the frequency of reversals of a particlemoving along the real line, and Segel [198] incorporated receptor dynamics. Ford and Lauffen-burger [72, 71] have estimated taxis coefficients within the framework of the phenomenologicalapproach. Pate and Othmer [180] derived the chemotactic velocity of amoeboid (crawling) cells interms of forces exerted by the cells, beginning from Newton’s law for the motion of a point parti-cle, neglecting inertial effects, and assuming that the motive force exerted by a cell is a function ofthe attractant concentration. They showed how the chemotactic sensitivity is related to the rate ofchange of the force with attractant concentration, and in this approach the dependence of the fluxon the gradient of the attractant arises from the difference in the force exerted in different direc-tions due to different attractant concentrations. Experimental support for this approach comes fromthe work of Varnum-Finney, Voss, and Soll [226], who show that in Dictyostelium discoideum, asmany pseudopods are produced down-gradient as up-gradient, but those that are up-gradient aremore successful in generating cell movement. Another approach, based on a continuous time re-inforced random walk in which the walker modifies the transition probabilities of an interval forsuccessive crossings, is developed in [170] for a single tactic substance and in [174] for multiplesubstances.
Although the PKS equation has been used widely in modeling chemotactic movement and otherkinds of tactic movement, the general problem of systematically incorporating microscopic detailsof the cell response into the chemotactic sensitivity remains a challenge. However, some progresshas been made on incorporating characteristics of cell-level behavior into the classical descriptionfor the movement of bacteria and Dictyostelium discoideum [89, 166, 64, 63, 65, 240]. In Section4.4. we discuss this aspect in the context of bacterial chemotaxis. The starting point for these
20

H. G. Othmer et al. The intersection of theory and application in developmental biology
analyses is a second major type of movement called a velocity-jump process. In this process themotion consists of a sequence of “runs” separated by reorientations, during which a new velocityis chosen. This leads to the following evolution equation for the density p(x,v, t) of individuals ata spatial position x ∈ Ω ⊂ Rn, that are moving with velocity v ∈ V ⊂ Rn at time t ≥ 0 [165]:
∂
∂tp(x,v, t) + v · ∇p(x,v, t) = −λp(x,v, t) + λ
∫
V
T (v′,v)p(x,v′, t) dv′. (2.20)
The parameter λ is the turning rate (1/λ is the mean run time between jumps), and in generalit may be space-dependent and depend on internal and external variables as well. The turningkernel T (v,v′) defines the probability of a jump from v′ to v when a jump occurs, and implicitin this formulation is the assumption that the choice of a new velocity is independent of the runlength. The turning kernel may also be space-dependent, and it may depend on the total densityof individuals. As will be shown in Section 4., when this approach is applied to the bacteriumE.coli the turning frequency must depend on the extracellular signal, as transduced through thesignal transduction and motor control system. The situation is more complex when this approachis applied to amoeboid cells such as Dictyostelium discoideum, which use both run length controland taxis [69], because there the extracellular cAMP distribution affects the forces involved in theturning process and these must be accounted for explicitly [65]. As in the space-jump process,resting states can be incorporated, as can birth-death processes [89]. It is also straightforwardto develop a model of intracellular transport that uses both kinesin and dynein (which move inopposite directions along microtubules) using the velocity-jump process.
2.5. The problem of robustness and scale-invarianceThe entire process of development, including growth and pattern formation, can be characterizedby its tendency to produce a normal adult, or to regulate, in the face of various disturbances im-posed during development. At one extreme is mosaic development in which removal of a part of adeveloping embryo at one stage results in the absence of that part (or parts that develop from it) inlater stages. In mosaic eggs such as annelids and mollusks, removal of portions of the cytoplasmfrom the egg leads to the absence of those organs that normally develop from the excised region.On the other hand, many systems show a high degree of regulation, particularly at early stagesof development. For instance, each of the cells that results from the first cleavage in amphibianeggs can, when separated from the other, develop into a normal, although usually smaller, adult.Regeneration of lost limbs in Hydra, a small marine creature, is an example of regulation in asystem in its terminal state of development. Development is rarely either strictly mosaic or strictlyregulative at all stages, but rather, shows both characteristics at different stages. Certainly regu-lation requires some form of intercellular communication and some kind of feedback mechanismwhereby removal of part of an organism is sensed by the remainder and development redirected tocompensate for the part removed. The current thinking is that such a mechanism either coincideswith or is a part of the mechanism that controls pattern formation.
To understand what we mean by robustness of a model, consider the dynamical systemdx
dt= F (x, p, S(t)) x(0) = x0, (2.21)
21

H. G. Othmer et al. The intersection of theory and application in developmental biology
wherein p is a vector of model parameters and S(t) is a time-dependent input. Three classes of‘perturbations’ lead to three types of ‘insensitivity’ or ‘robustness’.
1. Insensitivity with respect to inputs, by which we mean that some components of the stateof the system ‘ignore’ a certain class of deterministic inputs in the long run. This type ofrobustness is a characteristic of systems in which one or more components adapt to constantsignals, such as the motor control protein Cheyp in E. coli.
2. Insensitivity with respect to changes in the vector field, i.e.,the function F in (2.21). Thisis captured in the notion of coarseness or structural stability: a vector field is structurallystable if its associated flow is orbit equivalent to the flow generated by any vector field in asufficiently small neighborhood in a suitable topology. This is the broadest definition, for itincludes changes in F itself, but it is a strictly local (in a suitable topology) result, except forlinear vector fields.
3. Insensitivity with respect to changes in parameters. Strictly speaking this is a subset of (2),but is often considered by itself.
4. Closely related to all of these is insensitivity to either internally-generated noise, due forexample, to molecular fluctuations, unequal partition of molecules at cell division, etc, or toexternal noise due to fluctuations in the system environment. The main difference betweenthis case and the first three is that noise is usually thought to be persistent in time and is oftensmall amplitude, whereas, E. coli, for instance, can adapt to signal amplitudes ranging overfive orders of magnitude.
A first step is to decide what characteristic of the dynamics is being tested for robustness. Inthe context of spatial pattern formation, it is often a measure of the size of the system that is ofinterest with respect to robustness. As we have seen, reaction-diffusion systems, either with orwithout specialized source regions, are often used to describe pattern formation, and as we saw inthe simple case of the French flag and in the analysis of Turing systems, the standard models do notproduce scale-invariant patterns. In either case the spatial distribution of a morphogen is governedby the intrinsic kinetic and diffusion time scales, and thus scale-invariance may be achieved bysuitably modulating either one in a size-dependent manner. One way of doing this is to modulatethese scales with a species produced by all cells. The essential idea can be illustrated in a systemhaving only one morphogen.
Let c denote the concentration of the morphogen and let m denote the concentration of themodulating or control species. Suppose that they react and diffuse in the region Ω according to thefollowing equations
∂c
∂t= ∇ · (D(m)∇c) + λ(m)R(c) in Ω
∂m
∂t= Dm∇2C + R in Ω
−n · (D(·)∇c) = 0 on ∂Ω
m = 0 on ∂Ω.
22

H. G. Othmer et al. The intersection of theory and application in developmental biology
As indicated, either or both of the diffusion coefficient or the characteristic kinetic time scale ofthe morphogen can be modulated by the control species [167]. In effect, the former changes theunderlying space metric by changing the diffusion coefficient, and the latter changes the time scaleby modulating the reaction rates. If only diffusion is modulated then the diffusion coefficients mustscale as L2, which in effect changes the metric, since the level sets of the control species providea measure of distance from the boundary. In Drosophila melanogaster and related dipterans, it isunlikely that the diffusion coefficients are modulated [81], but it is shown in Umulis et al [223]that if the total number of nuclei does not change with the size of the embryo and other conditionsare met, then the morphogen gradient will scale with size, as is observed experimentally [81]. Thisinvariance can be understood by thinking of the total number of nuclei as embedded in a rubbersheet, and then stretching the sheet to fit the embryo size. Thus the density of nuclei scales as L−2,which is what is required to produce the correct scaling of the morphogen distribution.
2.6. The role of growth and cell movement in pattern formationIn some systems growth, cell movement and patterning occur on comparable time scales and theremay be feedback between them. An example treated later arises in pigmentation patterns in fish.Here we consider the following model for growth and cell movement in a two-dimensional layerof cells (for details see Section 5. and Painter, et al., [173]). Assume that (i) there are two celltypes, which may have different diffusion constants and chemotactic sensitivities, and (ii) there aren morphogens which diffuse and react throughout the system. We suppose that morphogens makea negligible contribution to the total mass and momentum of the tissue.
Let ρi be the density in mass/volume of the ith cell type and suppose that the total density isconstant. Then the overall continuity equation for the cell mass reads
∂ρ
∂t+∇ · (ρv) =
∑ρiRi (2.22)
where Ri is the net rate of creation or conversion of the ith cell type per unit of mass of that type.Since ρ is constant by hypothesis we have
ρ∇ · v =∑
i
ρiRi (2.23)
or∇ · v =
∑i
ωiRi (2.24)
where ωi is the mass fraction of the ith species. Note that there are no diffusion terms in (2.22)because we define the velocity v via
v =∑
ωivi.
The balance equations for the individual cell types are
∂ρi
∂t+∇ · (ρivi) = ρiRi (2.25)
23

H. G. Othmer et al. The intersection of theory and application in developmental biology
and we rewrite this as
∂ρi
∂t+∇ · (ρiv) = −∇ · ρi(vi − v) + ρiRi (2.26)
= −∇ · ji + ρiRi (2.27)
where ji is the flux relative to the mass–average velocity. This is comprised of diffusive and tacticcomponents. Clearly if we sum (2.25) over i and use the definition of ρ and v we obtain (2.22) andhence (2.23). We define the fluxes ji as
ji = ρi(vi − v) = −Di∇ρi + χi(u)ρi∇ui, (2.28)
where ui is the attractant or repellent for the ith cell type, and χi is the chemotactic sensitivity ofthat type to ui. Some or all of the sensitivities may be zero, and cells may be sensitive to multiplesignals. If we sum (2.28) over i we obtain
∑i
ji = 0.
Thus we have the desired ‘counter–transport’ wherein one species displaces the other but the localdensity remains fixed.
We write a similar set of equations for the morphogens, amongst which we include the chemoat-tractants and repellents, and we assume that the morphogens are transported only by diffusion andconvection, the former relative to the mass average velocity of the cells. Thus we write
∂ui
∂t+∇ · (uiv) = uiRi (2.29)
where ui is the mass density of the ith morphogen, which is used because v represents the massaverage velocity. Both the cell density and morphogen densities could be expressed in molar termsas well, and then the molar average velocity would appear in the equations.
We must now postulate the velocity field to avoid solving the momentum equations as well.Since
∇ · v =∑
ωiRi,
the simplest hypothesis is that the cell growth rates Ri are all identical, and then in two spacedimensions
∇ · v =∂vx
∂x+
∂vy
∂y= R. (2.30)
This can be satisfied by postulating that
V =R
2(xi + yj). (2.31)
This implicitly assumes a coordinate frame fixed at one corner of the tissue, which grows at equalrates per unit length in each direction. With this assumption (2.26) becomes
∂ρi
∂t+ ρi∇ · v + v∇ρi = −∇ · ji + ρiR
24

H. G. Othmer et al. The intersection of theory and application in developmental biology
or∂ρi
∂t+
R
2x∂ρi
∂x+
R
2y∂ρi
∂y= −∇ · ji. (2.32)
Note that the growth rate has disappeared from this equation, because the ‘convective flux’ due tovolume expansion on the left-hand side exactly balances the growth term on the right-hand side. Ifwe now introduce new coordinates so as to map the growing domain onto the unit square via thetransformation
ξ =x
L1(t), ν =
y
L2(t), τ = t
then we find that
∂ρi
∂τ=
1
L21
∂
∂ξ
(Di
∂ρi
∂ξ− χiρi
∂u
∂ξ
)+
1
L22
∂
∂ν
(Di
∂ρi
∂ν− χiρi
∂u
∂ν
). (2.33)
Thus we see that in the moving frame the connective terms all disappear. Similar reductions holdfor the morphogen equations. The convenience of such simplifications will be exploited in Section5.4. to investigate pigmentation pattern control on the growing skins of fish. A more generalanalysis of patterning in growing domains appears in Crampin, et al., [49].
3. Morphogen-mediated patterning in Drosophila melanogaster
3.1. BackgroundWhile morphogen-mediated patterning has been studied in zebrafish [244], frogs [21], and othermodel organisms, the most extensive biological and mathematical work has been done on themodel organism Drosophila melanogaster (the common fruitfly). During the first four hours ofDrosophila development, morphogens pattern the anterior/posterior (AP) and dorsal/ventral (DV)axes into regions of differential gene expression that presage the relative spatial position of adultstructures. Examples of the AP and DV protein distributions that result from zygotic gene expres-sion are shown in Figure 3.
The developing embryo of Drosophila approximates a prolate ellipsoid 500 µm long and 160 µmin diameter at the midpoint that is surrounded by a 0.5 µm thick fluid-filled shell called the periv-itelline (PV) space. The AP axis extends from the anterior extremum, defined by the maternallocalization of bicoid mRNA (discussed later) in early development, to the opposite extremumwhere nanos mRNA is maternally-localized. The DV axis, which lies perpendicular to the APaxis, is established early in development through activation of the transcription factor Dorsal in theventral most region of the embryo ¶.
Drosophila development is temporally divided into a number of distinct stages. Pattern for-mation begins during oogenesis, which occurs prior to fertilization and during which the mature
¶Often Drosophila genes are named for their mutant phenotype rather than for the function of the gene product –thus, for example, knocking out the transcription factor Dorsal results in an embryo forming only dorsal tissues.
25

H. G. Othmer et al. The intersection of theory and application in developmental biology
Figure 3: Morphogens pattern the anterior/posterior (AP) and dorsal/ventral (DV) axes during the first 4hours of embryonic development. (A) The top view shows a population mean distribution of pMad signaling,a signaling intermediate for a step of the DV patterning network. (B) The side view shows the distribution ofeven-skipped and Kruppel (from [73] Cell with permission). (C) Cross sectional view showing nuclear andyolk/cytoplasm levels of the anterior morphogen Bicoid (from [83] with permission).
egg forms in the female fly egg chambers located in the ovaries. At 25o C oogenesis proceeds forapproximately three days, through a distinct series of developmental stages. The separate devel-opmental events are divided into 17 stages defined by the changes that occur in the morphologicalstructure of the egg chamber [183].
Embryogenesis begins immediately after fertilization, and this process is divided into 17 stagesbased on distinct morphological changes in the developing embryo. Furthermore, due to the im-portance of early development, the first five stages are divided by cell-cycle number based on thesequence of synchronous nuclear divisions, beginning at fertilization. A very good approximationto the total number of nuclei in the syncytium at any given stage is 2n−1 where n is the currentcycle (i.e. during the 14th nuclear division cycle there are ≈ 213 nuclei in the embryo). During the14th mitotic division membranes begin to form between the nuclei that line the periphery of theembryo, and later they invaginate to delineate individual cells. Thus, during nuclear division cycle14 there is an ambiguity as to whether nuclei or cells are lining the PV membrane. To further com-plicate matters, nuclei during this stage of development respond to local receptors, are surroundedby many cellular organelles, and secrete proteins in a spatially restricted manner similar to cellsthat participate in cell to cell signaling.
3.2. Bicoid gradient formation and AP patterningThree genes – gurken, torpedo and cornichon, are currently known to be the primary factors forthe initial formation of both the AP and DV axes [154, 183]. gurken gene expression originates inthe germline cell whereas torpedo expression takes place in the somatic follicle cells. Absence ofeither gurken or torpedo produces eggs that lack polarity along both the AP and DV axes. Gurken,a signaling molecule, is transported with the aid of Cornichon from the endoplasmic reticulum tothe oocyte surface where it is released through the membrane. Once released, Gurken is thought tointeract with Torpedo, the Drosophila homologue of the Epidermal Growth Factor (EGF) receptor[154]. This early signal is believed to cause the terminal follicle cells to adopt a posterior fate
26

H. G. Othmer et al. The intersection of theory and application in developmental biology
and thus the origin of AP polarity [183]. This group of follicle cells returns a signal to the oocytecausing a reorganization of the cytoskeleton and reversed polarity of the microtubules. Microtubulepolarity reversal allows transport of maternal RNAs bicoid and oskar to the anterior and posteriorpoles respectively via kinesin motors. The localized RNA remains until early embryogenesis whereit becomes translated to further specify the AP axis.
bicoid mRNA tethered at the anterior pole encodes a transcription factor Bicoid (Bcd), which isa morphogen that specifies regions of gene expression in a concentration dependent manner [59].The spatial distribution of Bicoid protein has a maximum near the anterior pole, where bicoidmRNA is produced, and decays monotonically to its minimum near the posterior pole [59] (seeFigure 4). Bicoid promotes the transcription of the zygotic gene hunchback, which is expressedin the anterior half of the embryo. Hunchback acts as both a repressor and activator that specifiesregions of expression for other targets called the gap genes [96]. A complex system of activatingand repressing interactions ultimately generates the segmented body plan for Drosophila.
Analysis of Bicoid-mediated embryonic patterning has focused on two major questions: 1)what processes interact to regulate the dynamic, spatial distribution of the Bicoid protein, and 2)what processes contribute to the precise position and reproducibility of Bicoid target gene expres-sion?
Early studies demonstrated that increases or decreases in maternally-supplied bcd mRNA leadto increases or decreases in Bicoid levels in the embryo and subsequent shifts in the position of an-terior structures [59]. The stained protein distribution of Bicoid is well approximated by a decayingexponential [81, 94], which arises automatically from a mathematical model for the diffusion of amolecule that undergoes first-order decay (see Section 2.1.). Since the protein distribution is ap-proximated well by such a model it was widely assumed that the Bicoid distribution is establishedby simple diffusion and decay. The only remaining problem was to measure the rates of diffusionand linear decay.
To estimate the diffusion coefficient of Bicoid protein, investigators injected small amounts ofdextran molecules of approximately the same molecular weight and size of Bicoid protein intoDrosophila embryos [81]. The dynamic transport of the dextran molecules was imaged in liveembryos and their diffusion constant estimated by fitting the image data to a mathematical model.The calculated diffusion coefficient of ≈ 20 µm2/sec suggested that diffusion was rapid enoughto be the principle means of Bicoid transport along the AP axis [81]. However, more recently ithas been demonstrated that the in vivo diffusion rate for a Bicoid-eGFP (eGFP: enhanced GreenFluorescent Protein) fusion protein is much lower than the biologically inert dextran molecules[83].
In embryos stained for Bicoid protein, the majority of Bicoid accumulates in the nuclei liningthe periphery of the embryo (See Figures 3C and 5A) and not in the core yolk cytoplasm. SinceBicoid concentrations are clearly higher in the nuclei, a natural hypothesis is that the nuclei play animportant role in determining the dynamics and distribution of Bicoid [81, 46, 83]. To investigatethe role of the nuclei, Gregor et al. [83] employed Fluorescence Recovery After Photobleaching(FRAP) to measure the import and export rates responsible for the exchange of Bicoid betweenthe cytoplasm and the nuclei. The FRAP data were fitted to a linear local model for the number of
27

H. G. Othmer et al. The intersection of theory and application in developmental biology
Figure 4: After fertilization, maternally-supplied bcd mRNA tethered at the anterior pole is translated tobicoid protein. The nonuniform spatial distribution of the protein has a maximum near the anterior end anddecays posteriorly. There are numerous possible spatial pathways for Bicoid transport.
fluorescent Bicoid molecules (n) in a single nucleus given by
dn(t)
dt= kinCout − 1
τn
n(t). (3.1)
Here kin (kout) is the import (export) rate, kd−nuc is the decay rate, Cout is the concentration ofBicoid-eGFP, and τn ≡ (kout + kd−nuc)
−1 is the time constant defined by the export and decayrates [83]. The solution of (3.1) for a reduction in the number of fluorescent molecules ∆n0 is
n(t) = n∞ −∆n0 exp (−t/τn), (3.2)n∞ = kinτnCout, (3.3)
and thus the recovery after photobleaching depends on the time-scale for nuclear export. Thesimple nuclear import-export and decay model was fitted to FRAP data, giving a calculated time-constant of τn ≈ 70s, which is sufficient for establishing a steady-state Bicoid distribution whencoupled with the rapid diffusion approximated from the dextran molecules. Given the very rapidrecovery after photobleaching, one would expect the concentration of Bicoid within each nucleusto remain constant or, if not constant, that the total number of Bicoid molecules in the nucleuswould remain constant. During the course of the experiment, a further observation suggestedanother intriguing aspect of Bicoid-mediated patterning: as the nuclei grow, the concentration ofBicoid in each nucleus decreases at a rate inconsistent with either a fixed concentration or a fixedtotal number of molecules in the system. Gregor et al. found that the observed nuclear Bicoid
28

H. G. Othmer et al. The intersection of theory and application in developmental biology
concentration is predicted best by a model in which nuclei act as perfect absorbers, and transportto the nuclei is diffusion-limited. This assumption leads to the rate kin = 4πrnD, where rn is thenuclei radius and D is the diffusion constant, and with this, the diffusion constant of Bicoid inthe cortical cytoplasm is predicted to be ≈ 0.37µm2/sec, almost 100-fold lower than the diffusionof dextran molecules. This yields a diffusion time τD = L2/D of ≈ 150 hours for the entireembryo length (or ≈ 9 hours for one decay-length), far greater than the 3.5 hour developmenttime. To directly measure the diffusion coefficient in vivo, Gregor et al. used FRAP in the corticalcytoplasm and calculated a diffusion coefficient of ≈ 0.3 µm2/sec, consistent with the predictedvalue.
It therefore appears that diffusion is too slow in the context of AP patterning in Drosophila,but a number of both experimental and modeling issues require resolution. First, in the modelfor nuclear transport of Bicoid, the extracellular concentration is assumed constant and it appearsthat the cytoplasmic content in the vicinity of the nuclei also remains constant. However, the pho-tobleached Bicoid molecules exported from the nuclei will compete with fluorescent Bicoid forimport. Since D = (Cin/Cout)(r
2n/3τn), a small decrease in τn will lead to an increase in the pre-
dicted diffusion coefficient [83]. Additionally, the in vivo measurements for the diffusion constantD were carried out in the cytoplasm near the embryonic periphery and technology does not permitdirect measurement deeper in the embryo. The experiments only measure the concentration of Bi-coid in the nuclei and cytoplasm of the embryo, not the flux of molecules in the different internalregions of the embryo. It is possible that the bulk of Bicoid transport occurs through regions of theembryo removed from the nuclei at the periphery, but once at the periphery the high import rateslead to nuclear accumulation of Bicoid.
Another intriguing possibility that was recently investigated is that the non-uniform distribu-tion of Bcd protein depends on the non-uniform distribution of maternal bcd mRNA. This suggeststhat the positional information may arise from processes that regulate the transcript transport in ad-dition to the protein transport and additional work is needed to investigate the relationship betweenchanges in the bcd mRNA distribution and the resulting Bcd protein distribution [211].
To investigate alternative possibilities of Bcd patterning, the current generation of mathematicalmodels will have to be extended to include a more realistic 3D geometry that better reflects thestructure and allows a more accurate description of the underlying processes. For instance, a3D FRAP model that accounts for both intra- and extra-nuclear bleached and fluorescent Bicoidmolecules would provide additional insight into the transport and diffusion rates. In addition,more sophisticated 3D organism-scale models of the embryo would allow one to test alternativetransport mechanisms and quantitatively determine the relative contributions of cortical vs. coreBicoid fluxes. These mathematical models will provide deeper insights and lead to additionalbiological experiments that quantitatively determine the mechanisms of Bicoid transport.
3.3. Terminal gradient formation in Drosophila embryosNuclei are also involved in patterning the terminal regions of the Drosophila embryo. The anterior-and posterior-most structures rely on a non-uniform spatial distribution of phosphorylated ERK/MAPK [47] (ERK: extracellular-signal regulated kinase; MAPK: mitogen-activated protein kinase;
29
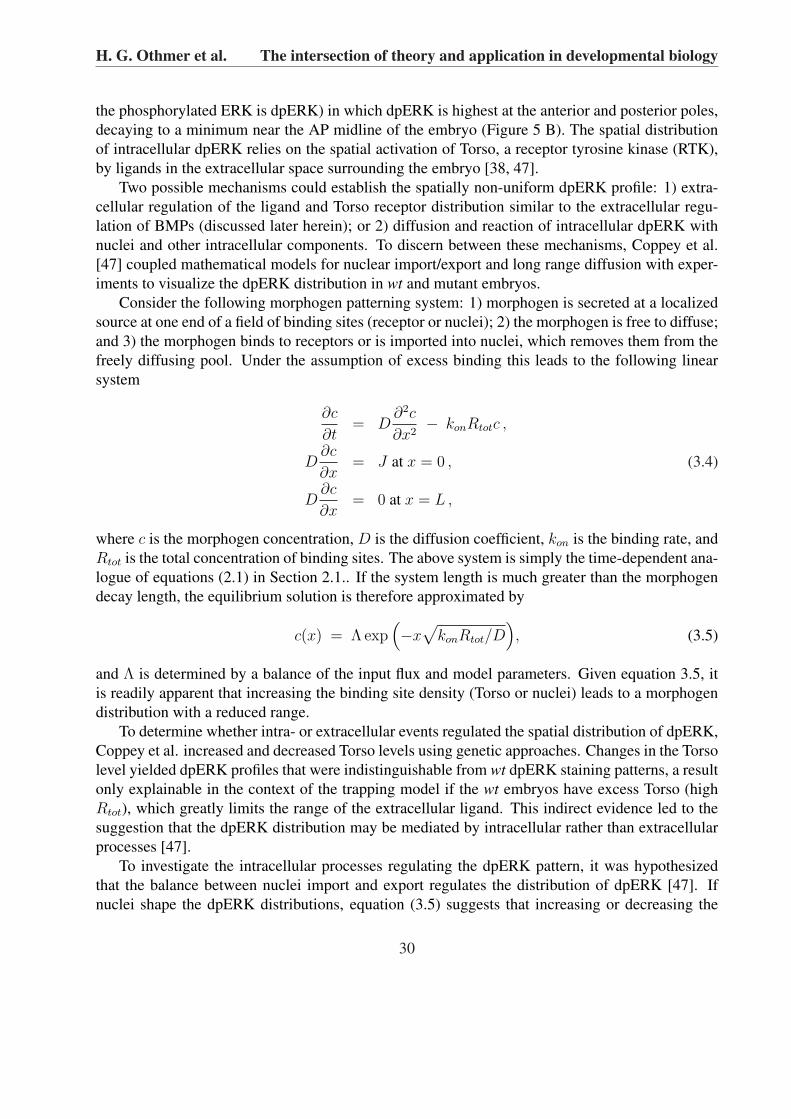
H. G. Othmer et al. The intersection of theory and application in developmental biology
the phosphorylated ERK is dpERK) in which dpERK is highest at the anterior and posterior poles,decaying to a minimum near the AP midline of the embryo (Figure 5 B). The spatial distributionof intracellular dpERK relies on the spatial activation of Torso, a receptor tyrosine kinase (RTK),by ligands in the extracellular space surrounding the embryo [38, 47].
Two possible mechanisms could establish the spatially non-uniform dpERK profile: 1) extra-cellular regulation of the ligand and Torso receptor distribution similar to the extracellular regu-lation of BMPs (discussed later herein); or 2) diffusion and reaction of intracellular dpERK withnuclei and other intracellular components. To discern between these mechanisms, Coppey et al.[47] coupled mathematical models for nuclear import/export and long range diffusion with exper-iments to visualize the dpERK distribution in wt and mutant embryos.
Consider the following morphogen patterning system: 1) morphogen is secreted at a localizedsource at one end of a field of binding sites (receptor or nuclei); 2) the morphogen is free to diffuse;and 3) the morphogen binds to receptors or is imported into nuclei, which removes them from thefreely diffusing pool. Under the assumption of excess binding this leads to the following linearsystem
∂c
∂t= D
∂2c
∂x2− konRtotc ,
D∂c
∂x= J at x = 0 , (3.4)
D∂c
∂x= 0 at x = L ,
where c is the morphogen concentration, D is the diffusion coefficient, kon is the binding rate, andRtot is the total concentration of binding sites. The above system is simply the time-dependent ana-logue of equations (2.1) in Section 2.1.. If the system length is much greater than the morphogendecay length, the equilibrium solution is therefore approximated by
c(x) = Λ exp(−x
√konRtot/D
), (3.5)
and Λ is determined by a balance of the input flux and model parameters. Given equation 3.5, itis readily apparent that increasing the binding site density (Torso or nuclei) leads to a morphogendistribution with a reduced range.
To determine whether intra- or extracellular events regulated the spatial distribution of dpERK,Coppey et al. increased and decreased Torso levels using genetic approaches. Changes in the Torsolevel yielded dpERK profiles that were indistinguishable from wt dpERK staining patterns, a resultonly explainable in the context of the trapping model if the wt embryos have excess Torso (highRtot), which greatly limits the range of the extracellular ligand. This indirect evidence led to thesuggestion that the dpERK distribution may be mediated by intracellular rather than extracellularprocesses [47].
To investigate the intracellular processes regulating the dpERK pattern, it was hypothesizedthat the balance between nuclei import and export regulates the distribution of dpERK [47]. Ifnuclei shape the dpERK distributions, equation (3.5) suggests that increasing or decreasing the
30

H. G. Othmer et al. The intersection of theory and application in developmental biology
nuclei density would reduce or expand the range of dpERK signaling respectively. To investigatethis dependence, Coppey et al. [47] imaged the distributions of dpERK in nuclear division cyclen =10-14 embryos (recall there are ≈ 2n−1 nuclei per cycle) and in mutants that locally disruptthe nuclear density. With this approach, three observations were made: 1) dpERK concentration innuclei is between 1.4 and 2 times higher than in the surrounding cytoplasm; 2) the steepness of thedpERK distribution increases as the number of nuclei increases; and 3) the dpERK distribution issensitive to changes in nuclear density as observed in shakleton mutant embryos. The combinationof dpERK profile sharpening during the synchronous nuclear division cycles and the disruptionsof dpERK in shakleton embryos demonstrates a clear relationship between nuclear density andmorphogen profile [47].
One obvious extension of the Torso/dpERK model is to investigate the scale-invariance ofdpERK distributions between different Drosophila species. Different species of Drosophila layembryos varying greatly in size, but containing similar numbers of nuclei produced by synchronousnuclear division. Two groups have independently suggested that nuclei may play an important rolein the scale-invariance of morphogen gradients such as Bicoid [223, 83]. The main hypothesiscentral to this theory is that if nuclei bind the morphogen that is otherwise free to diffuse, scale-invariance occurs automatically as long as the number of nuclei remains constant, even if the sizeof the embryo changes considerably [223, 83].
Figure 5: Nuclei are not passive observers of the morphogen gradient. (A) Bicoid is in dynamic equilibriumbetween the nuclei and the surrounding cytoplasm (from [83], with permission). (B) Nuclei shape the dpERKdistribution in relation to their density and spatial localization (from [47], with permission).
31

H. G. Othmer et al. The intersection of theory and application in developmental biology
3.4. BMP-mediated embryonic patterningShortly after the discovery of Bicoid, the secreted morphogen Decapentaplegic (Dpp) was dis-covered in Drosophila. Dpp and Bicoid are similar in the sense that both are proteins formingdynamic, non-uniform distributions that ultimately specify differential gene expression over a fieldof naive cells, but this is where the similarities end. Bicoid is a transcription factor produced bymRNA that is maternally-deposited during oogenesis, and it is transported directly into the nucleithat line the periphery of the syncytial embryo. In contrast, Dpp is a zygotically-produced memberof the bone morphogenetic protein (BMP) family that is secreted into the extracellular space, iscontrolled by numerous extracellular regulators, and must bind to transmembrane receptors thatinitiate a series of downstream steps that ultimately lead to target gene expression.
Dorsal surface patterning of the Drosophila embryo depends upon the activity of a heterodimerof BMP ligands Decapentaplegic (Dpp) and Screw (Scw) [203]. Screw is produced in all nuclei,whereas Dpp is produced along the dorsal half of the embryo. While monomers of both Dpp/Dppand Scw/Scw are present, the Dpp/Scw heterodimer has ≈ 10-fold higher activity and is proba-bly the principal ligand for patterning. Dpp/Scw is secreted into the thin, fluid-filled perivitelline(PV) space surrounding the embryo. The BMP ligand transduces its signal by binding to type IBMP receptors Thickveins (Tkv) and Saxaphone (Sax) and type II BMP receptors Punt to forma heterotetrameric active signaling complex [203]. The activated receptor is a kinase that phos-phorylates the intracellular molecule Mad to form pMad. pMad binds to two co-SMADs (Medea)and forms an active transcription factor that accumulates in the nucleus to regulate target geneexpression.
If Dpp/Scw secretion and receptor binding were the only processes occurring, one would expectthat the spatial distribution of pMad would encompass nearly the entire region where Dpp/Scw isproduced. Instead, pMad begins low and broad, consistent with uniform receptor binding through-out the Dpp/Scw secretion zone, but later the pMad signal simultaneously intensifies and contractsfrom the broad early expression to form a narrow, high-intensity band centered at the dorsal mid-line, as shown in Figure 6. Dorsal surface patterning by BMPs requires the activity of at least4 additional secreted molecules that control various aspects of the morphogen dynamics, range,and robustness (for a review, see [158]). The secreted BMP ligand is regulated by the secretedinhibitor Short gastrulation (Sog), the secreted co-factor Twisted gastrulation (Tsg), and the met-alloprotease Tolloid (Tld) (see Figure 6). Tsg is produced along the dorsal surface in a band thatcovers the central 1/3 of the embryo centered between the anterior and posterior poles. Sog isproduced laterally in regions that flank the secretion zone of Dpp/Scw. The metalloprotease Tld isroughly constant throughout the dorsal half. The prevailing picture is that laterally-secreted Sogbinds dorsally-secreted Tsg to form a potent inhibitor of Dpp/Scw. Dpp/Scw binds to Sog/Tsg,and the complex cannot bind to receptors but is free to diffuse. Tld then cleaves Sog specificallywhen it is in complex with Tsg and Dpp/Scw. The cleavage of Sog releases Dpp/Scw. The bindingof Dpp/Scw to Sog/Tsg is highest where the product of Dpp/Scw and Sog/Tsg concentrations ishighest (near the Sog and Dpp/Scw secretion interface) and lowest near the dorsal midline wherethe balance between Tld processing and formation of Dpp/Scw/Sog/Tsg favors the greatest releaseof Dpp/Scw.
32

H. G. Othmer et al. The intersection of theory and application in developmental biology
Figure 6: (A) BMP ligands and regulators are secreted into the thin, fluid-filled perivitelline space surround-ing the embryo. The cross-sectional view of the syncytial embryo shows the chemical reactions that takeplace to localize BMP signaling to the dorsal surface. (B) The contraction of pMad expression with time.(From [224]. Copyright 2006 National Academy of Sciences, U.S.A.)
The model equations for Dpp/Scw-mediated patterning with positive feedback developed in[224] are as follows:
∂B
∂t= DB∇2B + φB(x)− k3I ·B + k−3IB + λT ld · IB
− k4B · C + k−4BC − k5B ·R + k−5BR (3.6)∂S
∂t= DS∇2S + φS(x)− k2S · T + k−2I (3.7)
∂T
∂t= DT∇2T + φT (x)− k2S · T + k−2I + λT ld · IB − δT T (3.8)
∂I
∂t= DI∇2I + k2S · T − k−2I − k3I ·B + k−3IB (3.9)
∂IB
∂t= DIB∇2IB + k3I ·B − k−3IB − λT ld · IB (3.10)
33

H. G. Othmer et al. The intersection of theory and application in developmental biology
∂C
∂t=
ΛBRν
Kνh + BRν
− k4B · C + k−4BC − k7BR · C + k−7BCR− δEC (3.11)
∂BC
∂t= k4B · C − k−4BC − k6BC ·R + k−6BCR− δEBC (3.12)
∂BCR
∂t= k6BC ·R + k7BR · C]− k−6BCR− k−7BCR− δEBCR (3.13)
∂BR
dt= k5B ·R− k−5BR + k−7BCR− k7BR · C − δEBR (3.14)
Rtot = R + BR + BCR. (3.15)
Here, B is the BMP dimer (Dpp/Scw), S is Sog, T is Tsg, I is the Sog/Tsg inhibitor complex, IB isthe complex when bound to the BMP ligand, R is the receptor level, and C is the level of secretedBMP binding protein. As can be seen from the preceding equations, the regulation of BMPsrequires many non-linear steps that work in concert to produce BR distributions that correspondwith our pMad observations.
The complex regulation of BMP signaling has been the focus of numerous mathematical mod-eling studies. Unlike the mathematical models used to measure aspects of Bicoid and dpERKpatterning, the focus of the modeling of BMP patterning has been on discovering modules thatsatisfy a number of performance objectives [115, 61, 138, 224, 223, 203]. The general idea behindthis approach is that while we cannot measure specific conditions such as kinetic rates, transportrates, and molecular interactions in vivo, we can develop models that incorporate a number ofplausible possibilities and use large-scale parameter screens to identify networks that reproducefeatures that are also observed in the biological system. For instance, in BMP-mediated embryonicpatterning, some of the performance objectives that models were tested against include: 1) a sharp,dorsally-centered distribution of BMP ligands bound to receptors, 2) insensitivity to reductions inthe levels of extracellular regulators, 3) correct spatiotemporal evolution of signaling, 4) insensi-tivity to increases or decreases in receptor levels, and 5) robustness against changes in embryo size(scale-invariance). The first modeling study on BMP-mediated dorsal surface patterning used alarge-scale screen to identify model parameters that 1) produced a sharp BMP distribution, and 2)reproduced the experimentally observed robustness against genetic reductions in sog, scw, tsg, andtld. Eldar et al. used the results of their large-scale screen to predict that Scw and Dpp diffusionrates must be extremely slow unless it was bound by the inhibitor Sog, and they tested this bystaining for pMad signaling in eve2>dpp, sog−/− embryos. Without the inhibitor Sog, they foundthat pMad signaling was restricted to the site of Dpp production. Following this study, Mizutani etal. suggested that Dpp was actually highly diffusible, but in the presence of receptors, the range ofDpp diffusion is very low [138]. (For a review, see [158]).
Following the initial modeling work that established the plausibility of the shuttling mecha-nism, further experiments demonstrated that the extracellular transport of Dpp/Scw formed only apiece of the puzzle, and that positive feedback as a result of prior BMP signaling was also requiredfor the dynamic refinement and localized spatial distribution of pMad signaling [231] (Figure 6).Upon further investigation of the Eldar et al. and Mizutani et al. models with constant and uni-form BMP production (Eldar et al. also considered a special case where Dpp production is turnedoff after 10 minutes, however this is demonstrably false [203]), it was found that neither model
34

H. G. Othmer et al. The intersection of theory and application in developmental biology
captured the appropriate dynamics of pMad signaling [61, 138, 224]. During development, pMadbegins broad and low and refines to a narrow, high intensity band just prior to gastrulation (Figure6). Both models predict that BMP-receptor (proportional to pMad) levels begin broad and lowand, as time progresses, that the signal gets stronger and wider. Taking the new biological infor-mation and dynamics into consideration, Umulis et al. [224] developed a modular-based model tocompare a number of different receptor/feedback mechanisms. In this study, the additional perfor-mance objectives included were that 1) the model produce the correct dynamics, and 2) the levelof BMP-receptor complexes is insensitive to reductions or increases in the number of receptorsas experimentally observed [231, 224]. The additional analysis suggested that positive feedbackof a membrane-associated BMP binding protein such as Crossveinless-2 (Cv-2) yields the correcttemporal dynamics, spatial distribution, and robustness of BMP signaling [224] (Figure 7 A-D).With the inclusion of positive feedback coupled with endocytosis in the BMP-patterning model,a new type of BMP-signal interpretation emerged: the dynamics of pMad signaling suggest thatcells are dynamically responding to the extracellular distribution and competing for a limited num-ber of BMP ligands [224]. The dynamic interpretation of BMP signaling not only reproduces thecorrect spatiotemporal signaling during development, but also produces very sharp boundaries be-tween high and low signaling cells due to bistability. In the dynamic evolution to equilibrium,dorsally localized cells outcompete adjacent lateral cells for limited BMP ligands, thus reinforcingthe difference between high and low pMad signaling (Figure 7 A- bottom panel).
Positive feedback can also lead to hysteresis which suggests that the concentration of BMPsis less important than the exposure of BMPs to different levels of signaling (Figure 7 B). Anadditional performance objective that is gained by inclusion of positive feedback is the insensitivityof signaling to the number of receptors. Both increases and decreases in the number of BMPreceptors lead to pMad distributions that are virtually indistinguishable from wt (Figure 7 C). Todemonstrate the increased robustness against receptor levels, Umulis et al. [224] compared threedifferent receptor models: 1) rapid equilibration, 2) receptor-mediated endocytosis, and 3) positivefeedback of a secreted binding protein (Figure 7 D). With positive feedback, the modeling suggeststhat receptor levels can vary from less than 100 nM to greater than 5× 10³ nM concentrations andstill produce the desired level of cells receiving high levels of BMP signaling. While the positivelyregulated molecule that controls pMad dynamics during embryogenesis has not been found, therecent discovery of the role of collagen in the embryo provides a new pathway of potential targets[230]. Briefly, Wang et al. [230] found that type IV collagen plays an important role in complexassembly between Dpp/Scw and the secreted inhibitors. Since modeling suggests that the positivefeedback molecule must be localized where it is produced, it is possible that type IV collagen alsoplays a role in restricting the movement of other secreted BMP binding molecules.
In addition to embryonic patterning, a related model has been used to investigate the positivefeedback of BMP signaling in a completely different patterning context. Here BMP patterningoccurs during the development of crossveins in the Drosophila wing [200]. Wing patterning reliesupon a set of secreted regulators homologous to those used for embryonic patterning, but it alsorequires the activity of an autonomous BMP binding protein called Cv-2. Cv-2 is involved inmany different contexts and species as a positive and/or negative regulator of BMP signaling. Inthis context, local models were developed to identify biologically testable conditions that switch
35

H. G. Othmer et al. The intersection of theory and application in developmental biology
Figure 7: Mathematical modeling results for dorsal surface patterning. (A) Positive feedback leads to dy-namic contraction of BMP-receptors and bistability which leads to the sharp boundary between high andlow signaling states. (B) Hysteresis leads to a dynamic interpretation of extracellular BMP in the posi-tive feedback model. (C) pMad staining in wt and tkv mutant embryos is nearly identical. (D) The modelwith positive feedback is less sensitive to changes in receptor levels than models other models of receptorregulation. (From [224]. Copyright 2006 National Academy of Sciences, U.S.A.)
Cv-2 from being an activator to an inhibitor of BMP signaling. According to the modeling, usinga low affinity ligand and changing the concentration of Cv-2 impart the biphasic behavior of Cv-2regulation. The model predictions were later tested and verified both in vivo and in vitro; additionaldetails can be found in [200].
36

H. G. Othmer et al. The intersection of theory and application in developmental biology
4. Bacterial pattern formationBacteria are single cell organisms that proliferate through binary fission. Generally of the order ∼1−10µm, they adapt to a wide variety of environments and, while many are pathogenic, form vitalsymbiotic relationships with many higher-level organisms (for example, in the digestive system).The capacity to move is an essential trait in many bacteria that allows them to migrate towardsmore favorable environments or away from more harmful environments in response to extracellularsignals such as chemicals, light and oxygen. Of these, the tendency to follow extracellular chemicalgradients (chemotaxis) has been widely studied for its critical role in coordinating multicellularbehavior.
Many bacteria do not live as individuals, but rather form multicellular colonies that com-municate through chemical signals [201]. Intercellular communication leads to the formationof biofilms, communities of one or more bacterial types enclosed by self-secreted extracellularmatrices [234, 53, 229, 80, 112]. Biofilms form almost anywhere a nutrient supply is availableand surface attachment is possible, for example, plaques on teeth and slippery coatings on stones.Initiation of biofilms involves random attachment of planktonic cells to surfaces, and subsequentgrowth is facilitated by chemotactic movement toward the colonizers, which thereby increases theattachment probability. Mature biofilms form channels that ensure the efficient delivery of nutri-ents from exterior to interior.
Depending on the context, biofilms can be either harmful or beneficial. On teeth, on artificialmedical implants, and in chronic wounds the formation of biofilms is harmful. On the other hand,biofilms play important roles in bioremediation technology, allowing chemical waste to be de-graded in water [209]. The chemotaxis of bacterial cells towards contaminants has the potential tobring cells into close proximity to waste, thereby facilitating the degradation process. Understand-ing the mechanisms controlling biofilm formation and function may therefore lead to improvedmodes for eliminating harmful bacteria and improving their beneficial effects.
The spectacular growth patterns observed in a variety of bacterial colonies [34, 35, 237, 20,17, 26, 189] provide a simple and manipulable system for studying the initiation of biofilms. Thefundamental processes of proliferation and movement conspire to generate diverse pattern forms,and understanding their development will allow us to exploit biofilm properties to treat biofilminduced disease or increase the effectiveness of bioremediation. In this section we review boththe biological experiments and mathematical models for the patterns formed in Escherichia colicolonies. Pattern formation in other bacterial colonies, e.g. Bacillus, Proteus and Myxococcus isdiscussed in [18, 238, 101, 102] and references therein.
4.1. Pattern formation in E. coli coloniesEscherichia coli is a cylindrical enteric bacterium that swims using a run-and-tumble strategy[22, 23, 228]. Each cell possesses 5–8 helical flagella extending several body lengths, with eachflagellum capable of rotation clockwise (CW) or counterclockwise (CCW), driven by its basal ro-tary motor. When rotated CCW the flagella form a smooth bundle to propel the cell forward in asmooth “run” with speeds between 10 and 30 µm/s; when rotated CW the bundle flies apart, the
37

H. G. Othmer et al. The intersection of theory and application in developmental biology
cell stops almost immediately due to the low Reynolds number (∼ 10−6), and “tumbles” randomly.Each tumble reorients the cell in a quasi-random direction, although there is a slight bias in the di-rection of the previous run [86]. In the absence of signal gradients, the alternation between runningand tumbling results in random cell movement, and run/tumble times are exponentially distributedwith means of 1 and 0.1 seconds, respectively. However, when exposed to a signal gradient runtimes are extended when moving up (down) a chemoattractant (chemorepellent) gradient, therebybiasing cell movement.
The molecular mechanism of chemotaxis in E. coli has been studied extensively [123, 228, 29].The signal transduction pathway contains three basic elements, as is shown schematically in Figure8. The first is the detection of the signal by chemoreceptors. E. coli has five chemoreceptortypes, four of which are methyl-accepting chemotaxis proteins (MCPs). MCPs form homodimersthat span the bacterial cell membrane, and these assemble into trimers of dimers, which are thefunctional unit of MCPs. The cooperativity of the functional units contribute one part of the highgain of the chemotaxis system. The second is the transduction of the signal, which involves adecrease in autophosphorylation of and phosphotransfer to chemotaxis proteins. Attractant bindingto a receptor reduces the autokinase activity of the associated CheA, and therefore reduces the levelof phosphorylated CheYp, which is the output of the transduction network, on a fast time scale(∼ 0.1 s). This constitutes the excitation component. Changes in the methylation level of thereceptor by CheR and CheB restores the activity of the receptor complex to its pre-stimulus levelon a slow time scale (seconds to minutes). This results in adaptation to the ambient signal, whichenables the cell to respond to further signals. The third component is the change in bias of therotation of flagellar motors due to changes in CheYp. The default rotation of the motor is CCW,which leads to smooth swimming. When CheYp binds to the switch protein FliM on the flagellarmotor, the motor has a higher probability to rotate CW. The ultrasensitivity of the motor to CheYp
contributes to the remaining part of the high gain. The concerted motion of several flagellar motorsenables the cell to swim. Therefore increasing attractant concentration leads to decreasing CheYp
and therefore a longer run time on average.Chemotaxis in E. coli plays a major role in spontaneous, self-organized pattern formation,
primarily when factors such as the nutrient supply vary in space. Experiments by Adler in the1960s led to the discovery of moving bands/rings for a bacteria colony exposed to a nutrient thatalso serves as a chemoattractant [1]. Budrene and Berg uncovered a wide spectrum of stablespatial pattern types generated by E. coli cells, attributed in part to the fact that the bacteria secretechemoattractants (aspartate and analogues) [34, 35]. Similarly-derived patterns have also beenobserved in S. typhimurium colonies [237].
In the first type of experiment, a small number of E. coli cells was introduced at the cen-ter of a semi-solid agar substrate in the presence of a single nutrient source (succinate or otherhighly-oxidized intermediates of the TCA cycle). Over the following three days, a concentricswarm ring is observed to spread radially from the inoculation site (IS) with a symmetric arrayof spots or stripes forming sequentially in its wake (Figure 9). The initial dynamics are drivenmainly through proliferation of the inoculation, with a doubling time of approximately 2 hours[35]. Succinate consumption induces the production of aspartate by the growing colony, leadingto a chemotactically-driven compact aggregate at the IS of the order of 200 µm diameter. Lo-
38

H. G. Othmer et al. The intersection of theory and application in developmental biology
+CH3R
ATP ADPP
~
flagellarmotor
Z
Y
PY
~
PiB
B~P
Pi
CW-CH3
ATP
WA
MCPs
WA
+ATT
-ATT
MCPs
Figure 8: Signaling components and pathways for E. coli chemotaxis. Chemoreceptors (MCPs) span thecytoplasmic membrane (hatched lines), with a ligand-binding domain on the periplasmic side and a signalingdomain on the cytoplasmic side. The cytoplasmic signaling proteins, denoted Che in the text, are identifiedby single letters, e.g., A = CheA. (From [210]. Copyright 1997 National Academy of Sciences, U.S.A.)
cal depletion of succinate leads to starvation and the cessation of aspartate secretion at its center,while cells at its boundary continue to produce aspartate due to succinate diffusing into the aggre-gate from the surrounding substrate. As these cells spread outwards, a positive aspartate gradientis generated that provides the directional information for centralized cells to keep pace with thefront. A swarm ring thus develops that moves radially outwards with constant speed. Dependingon the initial succinate concentration, aggregates may or may not form and stabilize in the wake ofthe swarm ring. At low concentrations of succinate the swarm ring may propagate to the edge ofthe petri dish without breaking up (Figure 9, a). At higher concentrations aggregates form insidethe ring. The ring continues to move and the aggregates gradually detach from the ring. The cellsin the aggregates finally become nonmotile, which stabilizes the pattern. The radial sequence ofaggregates form by a repetition of the sequence that initiated the first generation of aggregates.If the concentration of succinate is not too high the aggregates are aligned radially (Figure 9, b).When the radius becomes large, new spokes of aggregates appear between the old ones. If theconcentration is higher, new aggregates form between the preceding sites (Figure 9, c). The speedof the swarm ring is inversely proportional to the succinate concentration, as is the radius at whichthe ring collapses into spots.
A second set of experiments was performed by suspending E. coli cells in a liquid medium.Under sufficiently high cell densities, the chemotactic response to aspartate induces the cells toform networks initially, which subsequently collapse into moving aggregates which merge overtime [24]. The timescale of patterning for the liquid suspension experiments is of the order ofminutes and the role of proliferation can therefore be neglected. The properties of a single aggre-gate have been investigated in [137] for a quasi-2D system. The equilibrium size of aggregates,150 ∼ 200 µm in diameter, was shown to depend only weakly on the density of cells and mostprobably on the sensory mechanism of the bacteria. The tumbling rate of a cell depends strongly
39

H. G. Othmer et al. The intersection of theory and application in developmental biology
Figure 9: Patterns generated by E. coli cells cultured in semi-solid agar [35] under different succinate levels:(a) 1 mM, (b) 2 mM, (c) 3 mM, (d) 3 mM. The E. coli strains used in experiments are not chemotactic toserine and either have the gene tsr deleted (a,b,c, strain HCB317) or are serine-blind (d, strain RP4368).A similar pattern to that in (d) can be generated with the strain HCB317. The concentration of succinaterequired to generate a particular pattern differs for different strains, but the sequence of patterns with respectto succinate concentration remains the same. (From [35], with permission.)
on its position within the aggregate and the direction of movement: tumbling is suppressed whenswimming towards the center of the cluster, resulting in overshoot, but when swimming at the pe-riphery of the aggregate cells tumble immediately. These two responses conspire to maintain theboundary and fix the aggregate size.
The formation of these bacterial patterns involves a complex interplay between different pro-cesses, including consumption of nutrients, production of chemoattractants, tactic movement to-wards the attractant, cell growth and loss of motility. Moreover, formation of these spatial patternscan involve millions of cells. Mathematical models of the patterns include continuum models thatincorporate these processess using phenomenological descriptions of the processes, and hybridcell-based models that allow detailed description of microscopic behavior. The continuum modelsare easier to implement and more amenable to mathematical analysis, but justification of the mod-els has to be addressed. Hybrid cell-based models give a better description of the experimentalpicture and allow for investigation to the balance of different processes, but can be expensive toimplement. In the remainder of this section we first review both types of models that facilitatedour understanding of the mechanisms underlying formation of the complex patterns, and we thensummarize the current results on deriving the continuum model from the cell-based model.
40

H. G. Othmer et al. The intersection of theory and application in developmental biology
4.2. Continuum models for bacterial pattern formationA variety of Patlak-Keller-Segel type systems, as described in Section 2.4., have been developedand applied to model E. coli and S. typhimurium patterns [106, 117, 118, 19, 218, 237, 221, 220,222, 185]. In [106] it is shown that the system of equations
∂n
∂t= ∇ · (Dn∇n− χ0
Sn∇S),
∂S
∂t= Ds4S − kS,
(4.1)
allows for an analytic traveling wave solution, but the singular chemotaxis sensitivity chosen thereviolates the fact that cells have bounded traveling speed when S is small. A nonsingular chemotac-tic sensitivity however would lead to a moving band with decreasing speed and broadening densityprofile due to diffusion. Later in [117, 118] it is shown numerically that by incorporating cellgrowth and death the speed and shape of the band can be stabilized.
To model the E. coli patterns published [34, 35], the PKS model was extended to include bothattractant and substrate. In Ben-Jacob et al. [19] and Tsimring et al [218] a second repellent fieldwas assumed to autocatalyze the production of attractant. Simulations revealed radially alignedand sunflower-like aggregation patterns. However, the assumption of the repellent field was notbiologically supported. In [221] a minimal model was proposed to account for patterns formed inboth liquid and semi-solid media. The equations describe the dynamics of the cell density n, theattractant concentration S, and substrate (nutrient) concentration f as follows,
∂n
∂t= Dn4n−∇ ·
(k1n
(k2 + S)2∇S
)+ k3n
(k4f
2
k9 + f 2− n
), (4.2)
∂S
∂t= Ds4S +
k5fn2
k6 + n2− k7nS, (4.3)
∂f
∂t= Df4f − k8n
k4f2
k9 + f 2. (4.4)
Simulations under suitable parameter sets reveal aggregate and swarm patterns roughly agreeingwith the experiments shown in Figure 9 (b)-(c). However no clear swarm rings with sharp bound-ary seem to form as in the semi-solid agar, nor does the network/stranded pattern which precedesthe formation of aggregates seen in liquid medium experiments. The model was later analzsedunder the condition k3 = k7 = 0 corresponding to aggregate formation, merging and disappear-ance in liquid medium in [220]. Linear analysis around the spatially-uniform solution showed thatthe uniform steady state is always stable to large wave number perturbations but unstable to lowerwave number perturbations for a limited amount of time, and that leads to the appearance anddisappearance of the aggregates. The analysis agrees with the experiments and simulations quali-tatively, but the index of the mode with the largest amplitude differs from the number of peaks insimulations by a factor of two. How the nonlinearity in the system contributes to this discrepancyis not clearly understood. Polezhaev et al. [185] proposed a model that also incorporates lossof motility of cells due to starvation. The resulting simulations revealed the formation of a swarm
41

H. G. Othmer et al. The intersection of theory and application in developmental biology
ring and stable aggregation patterns composed of immobile cells. However, the swarm ring formedhas a very diffusive front, in contrast to what is observed in experiments. Although all the abovemodels can produce patterns with some similarity to those in the semi-solid agar experiments, howdifferent processes balance to shape the patterns was not addressed.
This was addressed by Brenner al. [31], who developed a model for the purpose of understand-ing which processes are responsible for different localized features of the patterns, e.g., swarmring formation and aggregate formation and disassociation from the ring. The PKS chemotaxisequation was coupled to reaction-diffusion equations for attractants and nutrients and a minimalmechanism for the swarm ring and aggregate formation was proposed. The authors suggested thatmovement of the swarm ring was driven by local nutrient depletion, with its integrity resultingfrom the high attractant concentration at the ring location; in contrast, aggregates were proposed toform within the ring through fluctuations about the unstable uniform cell density. An asymmetricprofile in the attractant concentration arises due to the consumption of aspartate by cells followingthe depletion of succinate. The results are qualitative due to the discrepancies between predictionsof the linearized system and the full nonlinear system, and mechanisms for the regularity of thepatterns in semi-solid agar were not considered. In a subsequent paper [25] an analysis of the trans-formation of high cell density cylinders into regularly spaced aggregates from the swarm ring wasundertaken, with the conclusion that a shifting balance between diffusion and chemotaxis leads tocollapse of the strands.
4.3. Cell-based models of bacterial pattern formationHybrid cell-based models have been developed for bacterial pattern formation in [62, 240, 238].In these models, each cell is characterized by its position x ∈ RN , velocity v ∈ V ⊆ RN , internalstate y and age θ. In E. coli the cell speed is more or less constant throughout the movement, sowe assume that only the direction of the velocity changes during a tumble, therefore V becomesa sphere. In the experiments of Budrene and Berg [35], the cell density is O(108) ml−1, thusthe average volume fraction of the cell population in the substrate is O(10−4). Even if in anaggregate cells are 100 times more crowded than average, the volume fraction would still be assmall as O(10−2). Therefore, it is plausible to assume that cells are well separated, and there isno mechanical interaction between them. This means that we can treat the movement of differentcells as independent processes. Since the mean tumbling time (∼ 0.1 s) is much shorter than therun time (∼ 1 s), we also neglect the tumbling time and assume that cells reorient immediately.Therefore the chemotactic movement of each bacterial cell is an independent velocity jump process(see Section 2.4.). The turning rate and turning kernel are determined by the internal variables y.
The signal transduction pathway of E. coli is very complicated, and several detailed mathemat-ical models have been proposed for the entire signal transduction network [210, 202, 134, 188].However the essential dynamics are simple and can be captured by a minimal cartoon model thatincorporates both the adaptation and excitation processes crucial to chemotaxis [168]. It was shownin [64] that the following model predicts qualitatively and quantitatively similar input-output be-
42

H. G. Othmer et al. The intersection of theory and application in developmental biology
havior to that of the full model in [210]:
dyi1
dt=
G(S(xi, t))− (yi1 + yi
2)
te, (4.5)
dyi2
dt=
G(S(xi, t))− yi2
ta. (4.6)
Here the superscript i is the index of the cell, S is the local attractant concentration and te andta (with te ¿ ta) are constants defining excitation and adaptation timescales. The function G(S)models the detection of the extracellular (chemoattractant) signals. We adopt this cartoon modeland suppose that the turning kernel T and turning rate λ are given by
T =1
|V | and λi = λ0(1− yi1
γ0 + |yi1|
) , (4.7)
where ∫
V
T (v,v′) dv = 1 .
This cell-based description for chemotactic movement can be augmented with reaction-diffusionequations to describe dynamics of the extracellular nutrient and attractant and numerically solvedwith a hybrid scheme: the movement of each cell is simulated by a Monte Carlo method while thereaction-diffusion equations are solved with an alternating direction method. The details of thisalgorithm can be found in [240]. In the following we present numerical results in a 2-D domain.Although we do not expect significant differences, extension of the results to 3-D is currently underinvestigation.
4.3.1. Network and aggregate formation in E. coli liquid medium
To model the liquid medium experiments, E. coli cells are distributed evenly in a 3 cm × 3 cmsquare under a uniform initial nutrient supply and zero initial attractant. The dynamics for theattractant and nutrient concentrations are described by
∂S
∂t= Ds4S + γ
N∑n=1
δ(x− xi)− µS. (4.8)
∂f
∂t= Df4f − k
N∑n=1
δ(x− xi). (4.9)
Here Ds and Df are the diffusion rates, γ defines the attraction secretion rate by cells and µ isan unspecified degradation rate. The experimental time for liquid medium experiments is between10 and 15 minutes and proliferation/death is therefore negligible. Furthermore, in an abundantsupply the nutrient equation can be dropped. Figure 10 shows the evolution of cell density, firstinto a network of high cell density, then breaking up into randomly-distributed aggregates. Theseclusters remain motile and a cluster close enough to another merges with it. Moreover the cluster
43
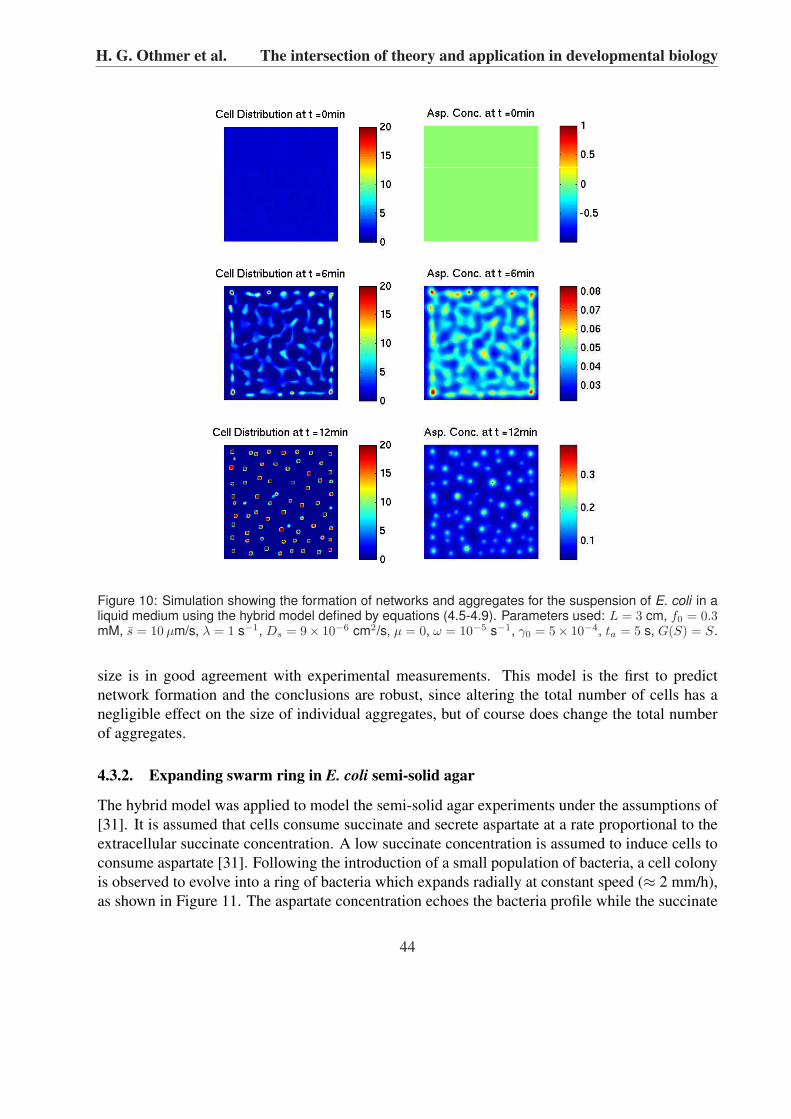
H. G. Othmer et al. The intersection of theory and application in developmental biology
Figure 10: Simulation showing the formation of networks and aggregates for the suspension of E. coli in aliquid medium using the hybrid model defined by equations (4.5-4.9). Parameters used: L = 3 cm, f0 = 0.3mM, s = 10 µm/s, λ = 1 s−1, Ds = 9× 10⁻⁶ cm2/s, µ = 0, ω = 10−5 s−1, γ0 = 5× 10⁻⁴, ta = 5 s, G(S) = S.
size is in good agreement with experimental measurements. This model is the first to predictnetwork formation and the conclusions are robust, since altering the total number of cells has anegligible effect on the size of individual aggregates, but of course does change the total numberof aggregates.
4.3.2. Expanding swarm ring in E. coli semi-solid agar
The hybrid model was applied to model the semi-solid agar experiments under the assumptions of[31]. It is assumed that cells consume succinate and secrete aspartate at a rate proportional to theextracellular succinate concentration. A low succinate concentration is assumed to induce cells toconsume aspartate [31]. Following the introduction of a small population of bacteria, a cell colonyis observed to evolve into a ring of bacteria which expands radially at constant speed (≈ 2 mm/h),as shown in Figure 11. The aspartate concentration echoes the bacteria profile while the succinate
44

H. G. Othmer et al. The intersection of theory and application in developmental biology
is rapidly depleted by the colony, forming a sharp gradient. The sharp wave front predicted here isin agreement with experiments.
Figure 11: Simulations showing an expanding swarm ring for an E. coli colony inoculated in the semi-solidagar. Parameters used: L = 3 cm, f0 = 0.3 mM, s = 10 µm/s, λ = 1 s−1, Ds = 9 × 10⁻⁶ cm2/s, ω = 10−5
s−1, γ0 = 5× 10⁻⁴, ta = 5 s, starving delay = 20 min.
In Figure 12 the sensitivity of the chemotaxis mechanism is increased by 10 fold (γ0 = 5 ×10⁻⁵). Inhomogeneities inside the swarm ring lead to the formation of a polygon pattern withfast-moving high-density aggregates and connecting catenary arcs. The pattern arises from thefact that the aggregates consume succinate at a higher rate and therefore move with a larger speedthan the arcs. Notably, this pattern was also observed in certain species of E. coli in unpublisheddata [33]. The disassociation of aggregates from the swarm ring is currently the subject of furtherinvestigations; a possible driving mechanism is the high aspartate concentration in the swarm ringsaturating the cells and impeding their movement towards regions of higher nutrient. How differentparameters in saturation lead to the different patterns of aggregation formation or polygon patternsremains to be investigated.
Figure 12: Simulated polygon formation in an E. coli colony.
45

H. G. Othmer et al. The intersection of theory and application in developmental biology
4.4. From cell to continuumAs discussed earlier, a classical PKS approach has been employed to model bacterial pattern for-mation by a number of authors [19, 218, 220, 221, 185]. However questions remain as to whetherthe PKS equation is a justifiable limit of the underlying microscopic process. Following the in-troduction of velocity jump processes to characterize the movement of bacterial cells in [165],significant progress has been made in determining the conditions under which the PKS equationcan be derived [89, 166, 64, 63, 240].
The transport equation for the classical velocity jump process described in Section 2.4. is
∂
∂tp(x,v, t) + v · ∇p(x,v, t) = −λp(x,v, t) + λ
∫
V
T (v′,v)p(x,v′, t) dv′, (4.10)
where p(x,v, t) is the probability density of a cell at position x with velocity v at time t > 0,λ is the turning rate of the cell and T (v′,v) is the probability density of jumping between v′
and v at a “tumble”. Note that conservation of cells implies∫
VT (v′,v)dv = 1. Under the
assumption of independent and identical cells, p can be also viewed as the cell density. Underreasonable assumptions on the turning kernel, the diffusion limit of the transport equation (4.10)was investigated in [89] and equation (2.16) was derived using regular perturbation analysis. Ingeneral, the diffusion ‘coefficient’ Dn is a second-rank tensor, and conditions under which Dn isdiagonal were determined [89]. In the presence of a chemical signal, the classical PKS chemotaxisequation (2.18) was derived under the assumption that the extracellular signal field S enters via thefunctions λ and T [166].
To understand how the chemotactic sensitivity depends on parameters of the intracellular dy-namics, Erban and Othmer incorporated the velocity jump process with the internal state variables,y [64, 63]. The transport equation becomes
∂p
∂t+∇x · (vp) +∇y · (fp) = −λ(y)p +
∫
V
λ(y)T (v,v′,y)p(x,v′,y, t) dv′. (4.11)
Applying moment closure techniques and regular perturbation analysis, the authors obtained theequation
∂
∂tn = ∇ ·
[s2
Nλ0
∇n−G′(S(x, t))bs2ta
Nλ0(1 + λ0ta)(1 + λ0te)n∇S
], (4.12)
first derived in 1D, and later extended to 3D on the diffusion time and space scales [64, 63]. Amajor assumption in this derivation is that b
λ0G′(S)∇S · v ∼ O(ε) sec−1, i.e., the signal gradient
is shallow. Other assumptions include time-independent signals S = S(x) and a linear turningrate λ = λ0 − by1. The derivation was generalized in [240] to admit a time dependent signal andnonlinear dependence of the turning rate on internal variables. The shallow gradient assumptiontherefore becomes H := a1
λ0G′(S)(∇S · v + ∂S
∂t) ∼ O(ε) sec−1, where a1 = − ∂λ
∂y1. In addition,
the analysis was further generalized by considering external forces. As an example, treating theswimming bias that arises when cells are near a surface ( which leads to the spiral density patternsseen in P. mirabilis ) as an external force, leads to the equation
∂
∂tn = Dn4n−∇ · [G′(S)n
(χ0∇S + β0(∇S)⊥
)](4.13)
46

H. G. Othmer et al. The intersection of theory and application in developmental biology
under the assumption of fast excitation (te = 0). Here
Dn =s2
2λ0(1− ψd) +2ω2
0
λ0(1−ψd)
, (4.14)
χ0 =a1s
2(1− ψd)[λ0(1− ψd)(λ0(1− ψd) + 1ta
)− ω20]
2((λ0(1− ψd) + 1ta
)2 + ω20)(λ
20(1− ψd)2 + ω2
0), (4.15)
β0 =ω0a1s
2(1− ψd)(2λ0(1− ψd) + 1ta
)
2((λ0(1− ψd) + 1ta
)2 + ω20)(λ
20(1− ψd)2 + ω2
0). (4.16)
The parameter ω0 measures the swimming bias, while ψd is the index of directional persistence(see [239] for details).
The ultimate aim is to derive equations for the cell density from the cell-based model undera variety of signal gradients. In [238] it is shown that for an ultra-small signal gradient, H ≤O(ε2) sec−1, the chemotactic response of the population enters into the cell density solution assmall perturbations (higher order terms) to a diffusion process (n0) with Dn = s2/(Nλ0), andthe chemotaxis equation (4.12) still provides a good approximation. For larger signal gradients,H ≥ O(1) sec−1, however, Equation (4.12) may fail to provide a reasonable approximation, sincethe macroscopic velocity
uS = χ(S)∇S = s
(a1s
λ0
G′(S)∇S
) (− 1
|V |∫
V
v ⊗ (taλ0A− 1)−1vdv
)(4.17)
can increase beyond realistic cell speeds when ∇S is large. Exactly how to derive appropriatemacroscopic equations from the microscopic process and what equation to expect for larger signalgradients remains an open problem. Related unresolved issues arise when one tries to derive thePKS equation for amoeboid cells [65].
5. Pigmentation markingsPigmentation in vertebrates initiates early in the embryo following the migration of pigment cellprecursors from their neural crest origin to the dermal skin layers [119]. At the time at which thepattern is laid down, each stripe of the zebra or spot of a leopard is of the order of 100 pigmentcells in diameter, and the question naturally arises as to what mechanisms are involved in the largescale organization of cells to produce a particular pattern within the skin. The study of pigmenta-tion patterning is thus an elegant model system for exploring the fundamental processes governingembryonic morphogenesis. In particular, pigment patterning provides a rare opportunity to ex-amine the coupling between embryonic growth and morphogenetic patterning, because for certainspecies (particularly fish) the pigmentation pattern evolves with organism growth throughout theindividual’s lifespan.
Despite the many differences at the microscopic level, for example the number of pigmentcell types and the mode by which pigment is transferred, the same basic pattern types – stripes
47

H. G. Othmer et al. The intersection of theory and application in developmental biology
and spots – are widespread across the animal kingdom, raising the question as to whether similarmechanisms control pigmentation in different species. Our insights into the biological control ofpigmentation have principally derived from the study of a few model systems, including salaman-ders, mice and zebrafish, while theoretical models have focused mainly on mammalian, fish andbutterfly pigmentation. In this section we begin by comparing and contrasting pigmentation inthese systems, examples of which are shown in Figures 1 and 13, with detailed consideration ofthe patterning process observed in angelfish and zebrafish. We consider the various theories ex-pounded for the control of pigment regulation, with particular emphasis on the reaction-diffusionbased model for pigment patterning.
Figure 13: Examples of pigmentation patterns in fish and butterflies. Clockwise from top right: Emperorangelfish (Pomacanthus imperator), Eastern bath white (Pontia edusa), Swallowtail (Papilao machaon) andBeaked coralfish (Chelmon rostratus). Images by K.J. Painter.
48

H. G. Othmer et al. The intersection of theory and application in developmental biology
5.1. Biology of pigmentation5.1.1. Pigmentation in mammals
In mammals, pigmentation derives from a single pigment cell type – melanocytes – which generateoranges and blacks through transfer of pigment granules via dendrites into hairs and epithelialcells; other colors, such as the blues on the face of a Mandrill, are attributed to the scatteringof light within the skin rather than a specific pigment [186]. As noted earlier, pigmentation inmammals and other vertebrates involves the migration of pigment cell precursors from their neuralcrest origin to the dermal skin layers [119]. Successful migration along a complex path leading totheir final destination depends on their ability to respond to local cues (e.g. see [217]), but long-range cues (e.g. chemotactic signals) released in the developing dermis also appear to play a role[216].
It is generally believed that the pigmentation patterns of mammals are fixed early in embryonicdevelopment (for example, from the 3rd to 5th week of gestation in the zebra according to [12])with subsequent alterations stemming mainly from deformation due to organism growth. However,there are a number of notable exceptions, which indicate that the underlying pattern may undergocontinual refinement well into juvenile stages. Newborn Malaysian tapirs display an elegant patternof dappled white stripes and spots on a brown coat which disappear during their first few monthsinto the solid black/white pattern of the adult, while the white spots of foals disappear into analmost uniform brown pigmentation in adult deer. Furthermore, it has been suggested that catpigmentation markings derive from the same fundamental pattern of “solid spots”, which thentransform into a wide range of adult patterns (e.g. “rosettes” in leopards and jaguars, spots incheetahs, “patches” in clouded leopards) during subsequent growth [233]. The evolution of thistransition between solid spots and “rosettes” can be observed in leopard and jaguar cubs [122].
5.1.2. Pigmentation in fish
Fish (and other animal classes) possess a greater range of pigment cell types (or chromatophores),including melanophores, iridophores and xanthophores, which arrange into ordered layers of thedermis to form the dermal chromatophore unit [9]. The distinct arrangement of these layers gener-ates dazzling and contrasting colors, many of which can not be obtained through a single pigmentcell type.
At a macroscopic level, many species of fish (as well as amphibians and reptiles) alter their pig-mentation throughout their life cycle. Rapid changes – physiological color change – are stimulatedthrough hormonal and/or neural signals which trigger the redistribution of the pigment granuleswithin the pigment cells, thus allowing animals such as chameleons and flatfish to blend into thesurrounding environment. Certain fish can even adopt the form of a chessboard when placed onan appropriate surface [152]. Slower changes – morphological color changes – occur much moregradually and result from changes to pigment cell densities or the transfer of pigment granules tothe skin (for a review, see [215]). For example, long-term exposure of the medaka (Oryzias) toa dark background results in increased densities of melanophores and decreased numbers of leu-cophores [214]. In many instances, the pigmentation pattern is dynamic, undergoing continuous
49

H. G. Othmer et al. The intersection of theory and application in developmental biology
transformation as the fish develops from larval to adult stages. Consequently, fish pigmentationoffers a tractable system for studying the intrinsic relationship between embryonic growth andmorphogenetic patterning. Two examples have attracted particular attention from theoreticians:the marine angelfish and the zebrafish.
Pigmentation in the marine angelfish
The marine angelfish family Pomacanthidae comprises 9 genera and more than 70 individualspecies found in tropical waters of the Atlantic, Indian and Pacific oceans [153], with their exquisiteand diverse coloration popularizing them as ornamental fish for aquariums. One of the strikingcharacteristics for many of the species in this family are the markedly different juvenile and adultmarkings. Most species in the genus Pomacanthus (and sub-genus Pomacanthus Euxiphipops) dis-play a broadly consistent juvenile pattern composed of a number of curved white bars on a darkblue background. During juvenile growth, the numbers of these stripes increases in proportion tofish size with new stripes regularly inserting between pre-existing ones [113], first emerging faintand narrow but widening as the fish continues to grow. This process may repeat several times be-fore being replaced by the adult pattern, which varies widely from species to species (e.g. see [2]).Adoption of a distinct pattern confers an advantage to the juvenile: adults are highly territorial andtend to attack other fish with similar markings [74].
Pigmentation in zebrafish
The beautiful coupling between organism growth and pattern formation described above is offsetby its impracticality for detailed study: the long period of growth, large size, sensitivity to theenvironment and territorial nature preclude intensive study of Pomacanthus in the laboratory. Instark contrast, the zebrafish Danio rerio has emerged as one of the predominant model organismsfor studying embryonic development (for a review, see [84]). Unsurprisingly, the pigmentationpattern is one of its defining traits, consisting of alternating black and silver/yellow stripes thatextend horizontally across the flank.
Zebrafish pigmentation appears early and melanophores are already visually identifiable 24hours post fertilization (hpf) and the pattern is dynamic from early larval through to adult stages.The rapid development of zebrafish (3-4 weeks from fertilization to adult), the large repertoire oflarval and adult pigmentation mutants [107, 159, 85], the number of closely related species withvaried markings [175] and the growing understanding of the molecular events controlling pigmentcell differentiation and positioning [208] collectively make zebrafish pigmentation an ideal systemfor studies of morphogenetic patterning.
Pigmentation can be divided into two distinct phases: a larval pattern that begins to form 24hpf, and the characteristic horizontal black/silver stripe pattern of the adult. Pigment cell pre-cursors originate in the neural crest (a transitory population of precursor cells also giving rise toneural, glial and skeletal cells) along the dorsal midline between the neural tube and surface ecto-derm [119]. Melanin-expressing melanophores can be identified shortly following their migrationaway from the crest where they begin to populate the dorsal stripe, one of three melanophorestripes that characterizes the larval pattern [136]. Patterning of the dorsal stripe initiates anteriorly
50

H. G. Othmer et al. The intersection of theory and application in developmental biology
and progresses posteriorly, consistent with the migration of cells away from the neural crest. After30 hpf melanophores begin to form a ventral stripe with a lateral stripe the last to become estab-lished (at approximately 42 hpf). Two further pigment cell types contribute to the larval pattern:xanthophores (yellow) in melanophore-free zones and iridophores associated with melanophoresin the stripes [91]. Over subsequent days of development this basic pattern is consolidated throughincreased numbers of pigment cells.
Metamorphosis to the adult pattern commences two to three weeks post-hatching. Melanophoresbegin to appear from latent precursors [179] to form the first two adult stripes on either side of thelarval lateral stripe. An interstripe predominantly composed of xanthophores develops in between,while those melanophores in the larval lateral stripe either die or migrate into one of the formingstripes [178]. The formation of adult stripes and interstripes appears to partially depend on theattractive and repulsive relationships between the various chromatophore types [125, 177]. Duringthe following days, pigment cell numbers increase to reinforce the stripes and interstripes untileach stripe is densely populated by pigment cells and approximately 6 cell diameters in width.With continued adult growth, new stripes/interstripes appear dorsally and ventrally of the existingadult stripes [130], although occasionally an existing adult stripe may split (particularly in olderfish, [6]). For further details on metamorphosis to the adult pattern see, e.g. [99, 176, 125, 175].
5.1.3. Pigmentation in butterfly wings
Pigmentation patterns in butterfly wings form in a flat two-dimensional structure composed of ahighly organized mosaic of individually colored “tiles”: the pigmented scales [156]. A subset ofepidermal cells differentiates to form a monolayer of scale cells that subsequently extend broadand flat cellular appendages, the scales. Coloration of the scale is achieved through the transfer ofpigment granules synthesized in the scale cell, each of which can produce a single pigment color,[111]. Synthesis of the pigment, and hence appearance of the color pattern, does not occur untilshortly before the emergence of the adult butterfly (i.e. late pupal stages), yet specification of thecolor type of scale cells is established during larval and early pupal stages, thereby generating animperceptible prepattern of scale cells each committed to a pigment type. The fixed structure ofthe scale cell monolayer precludes cell movement during the specification of the scale cells, whichexcludes the involvement of movement during pattern organization [156]. This is in stark contrastto vertebrates where pigment cells can potentially migrate within the dermis.
Each of the attractive and complex pigmentation markings observed in the wings of differ-ent species can be broken down into common sets of elemental pattern types, referred to as thenymphalid groundplan [196, 213, 156, 160]. Patterning observed on wing patterns is comprised ofboth “localized” forms, such as the characteristic “eyespots”, an example of which can be seen tothe bottom left of the Swallowtail wing pattern in Figure 13, or the specific markings correlatedwith structural elements of the wing (e.g. the thin black markings along the wing veins of theSwallowtail) and “global” forms consisting of the larger scale patterns spanning entire wing tracts,for example the alternating dark/white patchwork pattern on the Eastern Bath White (Figure 13) orthe wide black band running parallel to the distal wing in the Swallowtail.
At a cell and molecular level, the determination of eyespots (in Nymphalidae) is currently the
51

H. G. Othmer et al. The intersection of theory and application in developmental biology
most well understood process. Eyespots usually consist of a pattern of concentric color rings usedas a means of startling predators. Each eyespot develops about a group of organizing cells that actas signaling centers, and while the signal is not known, the fact that the cells signal is demonstratedby transplanting them to other wing regions and observing the formation of ectopic eyespots at thenew locations [30]. In [37] the expression patterns of a number of candidate genes was exploredand the eyespot organizing cells at the center were identified by their unique expression of Distal-less. A variety of further transcription factors have been found to be expressed in rings coincidentwith the color markings [32]. These results imply a model in which organizer cells stimulate geneexpression and, eventually, pigment specification in the surrounding cells.
5.2. Chemical prepattern and reaction-diffusion models for pigmentation5.2.1. Mammalian pigmentation
Much of the current interest in modeling pigmentation patterning stems from the influential workof Murray on mammalian coat markings and lepidopteran wing patterns in the late 1970s (see[143, 144, 145]; a comprehensive and detailed review of this topic is given in Chapter 3 of [146]).Murray’s proposal was that a system of reacting and diffusing morphogens could generate a chem-ical pre-pattern within the developing integument via a Turing instability. The subsequent coatpattern was simply assumed to reflect the chemical pre-pattern via differential response of the pig-ment cell precursors to the levels of these morphogens. A similar reaction-diffusion based modelfor mammalian pigmentation was developed in [13].
One of the compelling arguments for the reaction-diffusion theory of pigmentation lies in itsimpressive capacity to replicate many of the observed pigment patterns through a single mech-anism. We consider a two component Turing model given by Equation (2.3), with c = (u, v)representing hypothetical chemical morphogens in the integument. Assuming that (a) the depth ofthe integument is small with respect to the scale of patterns, and (b) the initial pigmentation patternis fixed over a relatively short timescale early in development, it is reasonable to assume the re-action takes place on a fixed 2D domain (we consider coupling growth to pigmentation patterninglater). For the simulations here the reaction term R is given by the Lengyel-Epstein model [120]developed to describe the Turing patterns observed in the CIMA chemical reaction [39], althoughmany other kinetics would generate equivalent results. The equations are given by
∂u
∂t= Du∇2u + k1
(v − uv
1 + v2
)(5.1)
∂v
∂t= Dv∇2v + k2 − v − 4uv
1 + v2, (5.2)
on a 2D rectangular domain Ω with periodic boundary conditions. A stability analysis about thepositive homogeneous steady state at (1 + k2
2/25, k2/5) determines the conditions on the parame-ters for Turing instabilities to occur and in Figure 14 we plot the spatial distributions of activator(v) predicted by equations (5.1)-(5.2) at various points in Dv–k1 space. Clearly, the above systemis capable of producing many of the commonly occurring pattern-types observed in animal skins,
52

H. G. Othmer et al. The intersection of theory and application in developmental biology
including “spots”, “stripes”, “reticulated stripes” and “inverted spots”. The conditions that distin-guish between stripes or spots in reaction-diffusion systems have been investigated by a number ofauthors; a major factor is the dominating nonlinearity in the kinetics (e.g [124, 66, 132]).
Figure 14: Activator (v) concentrations at different values of Dv (horizontal axis) and k1 (vertical axis).At each Dv–k1 pair, equations (5.1)-(5.2) were solved numerically to t = 10000 from initial distributions(u(x, 0), v(x, 0)) = (us, vs) + r(x), where (us, vs) is the uniform steady state and r(x) a small randomspatial perturbation. Other model parameters were fixed at Du = 1.0 and k2 = 11.0 with periodic boundaryconditions on the 2D square domain of dimensions 10 × 10. Concentration is represented through thecolorscale (red = high, blue = low). Note that in the top right hand corner, the conditions for a Turinginstability are not satisfied and no spatial pattern develops.
Predictions of the reaction-diffusion model stem from the link between geometry and pattern-ing: the patterns generated by Turing systems possess a characteristic wavelength (see Figure 14)and it is therefore expected that average widths/diameters of stripes/spots are broadly consistentacross the body. The intrinsic relationship between the pattern and the domain geometry sub-sequently leads to a number of generic predictions. For example, spotted mammals can exhibitstriped tails while the reverse does not occur, and both very small and very large mammals cangenerally be expected to display uniform pigmentation (see [146] for further details). The former
53

H. G. Othmer et al. The intersection of theory and application in developmental biology
prediction appears to hold true while the latter, albeit not universal (giraffes and species of voleprovide counter-examples at either end of the size distribution), generally seems to be upheld. Ata finer scale, reaction-diffusion models have also been proposed to provide the information forthe positioning of the individual hair follicles [150, 151, 140] and recent experimental data haverevealed potential networks that may operate in a Turing-like fashion ([142, 207], see also [87] thisissue).
While the reaction-diffusion model is far from the only hypothesis for the origin of pigmenta-tion patterns, see Section 5.3.), the seductive charm lies in its capacity to generate highly realisticpatterns (particularly when solved on life-like geometries, see Figure 15) and has led to its applica-tion to model pigment pattern control across the animal kingdom. Reaction-diffusion models havebeen employed in [199] to explain butterfly wing markings (see section 5.2.3. below), Meinhardt[133] uses activator-inhibitor systems to replicate the enormous diversity of patterns of tropicalsea-shells, their application to the markings of various species of ladybird beetles is considered in[121], and [187] have examined within-feather pigmentation control via a Turing system. Overthe past decade interest in reaction-diffusion models has been further heightened by their ability toreplicate the highly dynamic patterns observed in the skins of fishes.
Figure 15: Simulations of equations (5.1)-(5.2) on “animal-shaped” geometries replicating the pigmenta-tion patterns in Tiger Salamander (Ambystoma tigrinum) (left) and Juvenile Koran Angelfish (Pomacanthussemicirculatus) (right).
5.2.2. Fish pigmentation
The first proposal for a reaction-diffusion model controlling fish pigmentation was formulated byKondo and Asai [113] following observations on the patterning of the marine angelfish genus Po-macanthus. As previously described, juvenile members display evolving patterns in which thenumber of stripes increases proportional to body length before metamorphosis to the adult patternoccurs. The close correspondence between simulations of reaction-diffusion models and temporalfeatures of the pattern change observed in real fish led to the proposal for a reaction-diffusion modeldriving angelfish pigmentation [113] (see Section 5.4.). A number of further reaction-diffusionbased models have been developed to describe additional features of pigmentation in Pomacan-thus and other species: Barrio and others [225, 15] have considered the special role that domaingeometry and boundary conditions may play; Painter and others [173, 172] augmented a reaction-diffusion model to incorporate the accumulation of pigment cells into stripes via chemotaxis. A
54

H. G. Othmer et al. The intersection of theory and application in developmental biology
number of authors have explored the mechanisms regulating stripe orientation, (eg., [204, 205]and [135]). The latter demonstrated how stripes of specific orientations can be experimentallygenerated in the CIMA chemical reaction.
A reaction-diffusion model for adult zebrafish patterning has been proposed in [6], indicatingthat perturbation to a single parameter in a standard reaction-diffusion system could generate atransition between horizontal stripes (as observed in the zebrafish Danio rerio) to labyrinthine andspotted patterns (observed in the leopard mutant). In later work by the same group, experimentalresults in which zebrafish stripes reformed following their partial ablation were replicated usinga reaction-diffusion model, which suggests that the adult stripe pattern is dynamically-controlledrather than fixed at its time of formation [242].
5.2.3. Butterfly pigmentation
As described above, the complexity observed in butterfly wing pattern can be broken down intoa number of distinct pattern elements [196, 213, 156], and theoretical modeling has generallyconcentrated on understanding the control of these various elements separately. The mechanismfor eyespot formation has been considered by a number of authors. Nijhout [155] proposed thatcells at the eyespot focus could produce a signal, leading via diffusion to a morphogen gradientthat provides positional information to the surrounding cells. A number of detailed investigationshave explored these ideas in greater detail (e.g. [156, 139, 55]). In contrast, the models in [67,129], are aimed at explaining eyespot generation through simulating candidate gene regulatorynetworks. The pre-specification of eyespot organizers from an undifferentiated population of scalecells has been modeled in [156] using an activator-inhibitor mechanism. This model was capable ofproducing point-wise chemical prepatterns at the precise locations of future organizers by assumingwing veins act as a source of activator. Furthermore, chemical concentrations predicted in themodel displayed a complex temporal sequence later shown within the gene-expression patterns ofDistal-less.
A number of models have been developed to describe the mechanistic basis for global pattern-ing features, i.e. patterning that covers large portions of the wings (see [157] for a detailed review).Murray [145] proposed a diffusion-morphogen-gene-activation model in which wing margins pro-vide the source for a diffusible morphogen which, in turn, triggers gene activation and eventualcolor specification. Theoretical results of this model were consistent with a wide variety of ob-served patterns. A diffusion-based model has been developed by Bard and French in [14]. Eye-spots and the wing-margin are assumed to act as sources and sinks for a chemical morphogen, thesubsequent profile of which is assumed to provide the positional information for color specifica-tion. More recently, work by Sekimura and others (e.g. [199, 126, 157]) has explored the potentialfor reaction-diffusion type mechanisms to generate features of global patterning. Focusing on thespectacular and varied color patterns of the species Papilio dardanus, a standard activator-inhibitortype mechanism has been solved on realistic wing geometries with specific boundary conditions(representing activator sources) along the distal wing edges. Perturbations to model parameterswere shown to generate the variety of patterns observed in this species.
55

H. G. Othmer et al. The intersection of theory and application in developmental biology
5.3. Cell-based models for pigmentationDespite the successes of the reaction-diffusion model at capturing certain patterning elementsacross the animal kingdom, including mammalian, fish and butterfly pigmentation, the in vivoidentification of plausible morphogens is lacking and the model does not consider the potentiallyimportant role the pigment cells themselves may play in setting or regulating the pattern (e.g.[177, 125]). In the reaction-diffusion model it is generally assumed pigment cells are “passive”objects that respond to threshold concentrations of the morphogens through differentiation, buta number of other models have been developed that explicitly incorporate a role for cells in thepatterning process.
In vertebrates, pigment cells derive from the neural crest, an embryonic population contributingto a variety of cell populations in the adult organism. During development neural crest cells arehighly motile, occasionally traveling across the organism to their final destination, and it is thoughtthat both local and long distance chemical signals control neural crest cell migration in vivo. Basedon data collected on the timing of stripe formation in embryonic and hatchling alligators, [147]proposed a cell-chemotaxis model for pigmentation, while [148] suggested a similar model forpigmentation in snakes. In these models, the pigment cells play a crucial role in generating thepigment pattern through migration in response to self-regulated morphogens. As described in thecontext of bacterial patterning, models of this form can certainly generate macroscopic patternsqualitatively similar to observed pigment patterns. Chemotaxis has also been incorporated into themodels by Painter et al. [173, 172] to explain specific aspects regarding the dynamic pigmentationpatterns in the angelfish genus Pomacanthus. In these models the cells respond chemotactically tothe primary pattern generated by a Turing system, rather than inducing their self-organization.
Based on the findings in [177, 125], recent discrete-cell models developed in [141] and [36] dis-pense with extrinsic chemical signals and demonstrate that the pigmentation pattern for zebrafishcan be generated solely through specific local interactions (i.e. adhesive or repulsive) betweenthe principal pigment cell types (melanophores and xanthophores). Perturbations to the self- (i.e.melanophore-melanophore or xanthophore-xanthophore) and cross- (melanophore-xanthophore)interactions generates a wide variety of pattern types corresponding to pigmentation mutants. Thecapacity for differential-adhesion to generate the cellular sorting of different populations has beenknown since the seminal work of Steinberg and others (e.g. see [212]).
Other discrete cell models for pigmentation have been developed in [243] and [79] for mam-malian pigmentation, adopting cellular-automata type models. While pigment cells are explicitlyincorporated into these models, their input into the patterning process occurs via their regulationof chemical activators and inhibitors, subsequently leading to similar pattern phenotypes to thosegenerated by continuous reaction-diffusion systems.
5.4. Patterning on growing skinsIn the foregoing we have generally restricted attention to the modeling of pigmentation patterningon fixed geometries. Yet, for many species, the color markings undergo continual change through-out the lifespan of the organism, a striking example of which is given by the juvenile angelfishdescribed earlier [113]. Adult zebrafish also show stripe insertion, with new stripes inserted dor-
56

H. G. Othmer et al. The intersection of theory and application in developmental biology
sally and ventrally [130] following sufficient adult growth. As previously mentioned, there is alsoevidence of transformations during mammalian pigmentation, particularly in certain species of cats[233, 122].
These examples all imply a link between morphogenetic patterning and domain growth: theinsertion of new stripes in juvenile angelfish is closely correlated with fish size, with stripes in-creasing twofold with each doubling in the head-tail length. There is also an age-structure to thestripes, with old stripes bright and wide and newer stripes faint and thin. To explain these trans-formations it is necessary to account for the domain growth, as has been done by a number ofauthors (e.g. [5, 114, 113, 173, 49, 57, 48, 11]). In general, tissue growth will depend on a range ofboth global and local cues (for example mitotic and apoptotic factors) and expansion is expected todepend on the spatial distribution of underlying factors transported with tissue growth and modelsfor “morphogen” controlled domain growth have been developed by [57, 49, 48, 11]. Earlier (seesection 2.6.) we developed a model to describe the planar expansion of a tissue through cellulargrowth, and demonstrated that under the assumption of spatially uniform growth the equationssimplify to a form that lacks the additional terms resulting from growth-induced transport.
5.4.1. Stripe insertion in juvenile angelfish: uniform growth
To model stripe insertion in juvenile angelfish it is necessary to consider the in vivo growth ofjuveniles. In the absence of empirical data it is reasonable to expect uniform growth and equations(5.1)-(5.2) are extended onto a 1D growing domain [0, L(t)] representing the head-tail axis. Fol-lowing the process in Section 2.6. and rescaling onto a fixed domain [0, L(0)], the equations for agrowing-domain are given by
∂u
∂t=
Du
L(t)2
∂2u
∂x2+ k1
(v − uv
1 + v2
)− L′(t)
L(t)u , (5.3)
∂v
∂t=
Dv
L(t)2
∂2v
∂x2+ k2 − v − 4uv
1 + v2− L′(t)
L(t)v . (5.4)
The impact of growth is absorbed into time-dependent diffusion coefficients and additional “decay-type” terms interpreted as chemical dilution due to domain growth. Analogous equations havebeen derived by [114], [173] and [49] using a variety of methods. In the context of angelfishpigmentation, the principal question is whether the above generates a regular insertion of newstripes as the fish doubles in size. To explore this we simulate equations (5.3)-(5.4), assumingthat juvenile growth (at least initially) is exponential (the impact of different growth forms hasbeen considered in [173, 49]), thus L(t) = L0 exp(rt) where r is the growth rate. The activatordistribution (v) is shown in Figure 16, and the results demonstrate that for a wide range of growthrates the reaction-diffusion model does indeed generate a robust “doubling” sequence in whichactivator peaks insert with each doubling of the domain length, consistent with stripe insertion onthe angelfish.
That a Turing system could generate “peak doubling” was predicted in [5] and re-discoveredin the context of juvenile angelfish patterning by Kondo and Asai [113], strengthening their hy-pothesis for an underlying reaction-diffusion system governing pigmentation. A number of subse-
57

H. G. Othmer et al. The intersection of theory and application in developmental biology
r = 0.01r = 0.1 r = 0.001 r = 0.0001 r = 0.00001do
mai
n le
ngth
time time time time time
Figure 16: Simulations showing activator (v) concentration from equations (5.3)-(5.4) for a 1D exponentiallygrowing domain [0, exp(rt)]. Simulations show that for a wide range of growth rates it is possible to generatea robust sequence of “frequency doubling” in which new activator peaks insert between preexisting ones.For very slow and very fast growth rates, this sequence breaks down.
quent extensions of their analysis have been made to understand additional features in the pig-mentation sequence. For example, Painter et al. [173, 172] analyzed patterning on more re-alistic two-dimensional geometries and incorporated a chemotaxis-based hypothesis for the ac-cumulation of pigment cells into the forming stripes. On the 2D uniformly growing domain(x, y) ∈ [0, L1(t)]× [0, L2(t)], their equations are
∂c
∂t=
1
L21
∂
∂x
(Dc
∂c
∂x− χcc
∂u
∂x
)+
1
L22
∂
∂y
(Dc
∂c
∂y− χcc
∂u
∂y
), (5.5)
∂u
∂t=
Du
L1(t)2
∂2u
∂x2+
Du
L2(t)2
∂2u
∂y2+ k1
(v − uv
1 + v2
)− (L′1(t)/L1(t) + L′2(t)/L2(t)) u,(5.6)
∂v
∂t=
Dv
L1(t)2
∂2v
∂x2+
Dv
L2(t)2
∂2v
∂y2+ k2 − v − 4uv
1 + v2− (L′1(t)/L1(t) + L′2(t)/L2(t)) v, (5.7)
where the additional equation for c represents the density of the predominant pigment cell typepopulating the “stripes”. In Figure 17 we show the results of simulations of the above model using“logistic” growth, for which the initial growth is approximately exponential, but later the domainsize stabilizes. The activator concentration (v) is plotted in the top row, showing that a robustsequence of stripe insertion also occurs in 2D, but it should be noted that the developing stripesshow no persistent age structure. However, the corresponding pigment cell density (bottom row)does show an age structure to the stripes due to the slower process of chemotactic migration.
5.4.2. Stripe insertion in zebrafish: boundary growth
While new stripes appear throughout adult zebrafish growth, their pattern of appearance is some-what different from that of juvenile angelfish: new zebrafish stripes appear along the dorsal andventral edges of the flank with increased growth. Clearly, the uniform growth scenario describedabove is unable to explain this sequence, since uniform growth predicts the appearance of newstripes across the entire dorsal-ventral flank. We consider the possibility that growth in adultzebrafish occurs principally through stretching at the dorsal/boundary extremes, i.e. boundary
58

H. G. Othmer et al. The intersection of theory and application in developmental biology
Cel
l den
sity
(c)
Act
ivat
or c
onc.
(v)
time
Figure 17: Simulation of the 2D chemotactic-reaction-diffusion hybrid model showing (top row) activatorconcentration v and (bottom row) pigment cell density c. The accumulation of cells at the sites of “new”stripes proceeds slowly, resulting in an age-structure to the stripes consistent with the pattern observed injuvenile angelfish.
growth. For example, by assuming domain growth occurs along the y = 0 boundary (representingthe dorsal flank), the reaction-diffusion systems equations become [172, 49]
∂u
∂t=
Du
Lx(t)2
∂2u
∂x2+
Du
Ly(t)2
∂2u
∂y2+
yL′yLy
∂u
∂y+ k1
(v − uv
1 + v2
), (5.8)
∂v
∂t=
Dv
Lx(t)2
∂2v
∂x2+
Dv
Ly(t)2
∂2v
∂y2+
yL′yLy
∂v
∂y+ k2 − v − 4uv
1 + v2. (5.9)
The nonuniform growth results in the addition of convective terms describing the transport of thechemicals due to the stretching of the skin, as in [57]. Under reasonable forms for the growth terms,the above equations can indeed predict the appearance of new stripes along the dorsal extremes,consistent with the mode of stripe insertion in zebrafish, as shown in Figure 18.
6. Future PerspectivesRecent years have witnessed a dramatic rise in the use of mathematical modelling to understandthe basic mechanistic processes underlying biological pattern formation, from patterning within an
59

H. G. Othmer et al. The intersection of theory and application in developmental biology
Figure 18: Simulation of the 2D boundary growth model demonstrating (top row) insertion of new stripesalong the dorsal side. For these simulations, we assumed Lx(t) = 2 and Ly(t) = 1 + rt for r = 0.01.
individual cell, via the organization of tissues and organs during development to the coordinatedbehaviour of organisms within a population. The advancement in experimental methodology isleading to increasingly detailed and quantitative data on the core regulators of pattern formation,in turn resulting in a new generation of detailed mathematical models both driven by and drivingexperimental research. However, more traditional, phenomenological-based models still play avital role, providing an established theoretical framework in which to understand details of thesemore complex models. We conclude this paper with a brief consideration of outstanding questionsrelating to pattern formation both in general and with respect to the three examples reviewed earlier– Drosophila, E. coli and pigmentation patterning – highlighting the core role that modelling mayplay in this process.
6.1. DrosophilaThe timing is propitious for mathematical modeling of pattern formation and morphogenesis inDrosophila, as there is a good balance of established facts and questions that remain to be an-swered. In recent years, a number of biological questions relied on developing and analyzingmathematical models of varying complexity, as discussed earlier, but there is ample scope forfurther work. As discussed for each case earlier, to truly couple the modeling with the experi-mentation to make the next wave of biological discoveries, one has to develop more geometricallyrepresentative models of the organisms and tissues used for the experimentation. While significantbiological insight has been gained from simple 1D models, we have reached the limits of whatwe can use the models for in terms of leading experimental design. Furthermore, experimentalistshave been exploiting the orthogonal nature of AP and DV patterning to drive ectopic expression ofDV genes in spatially restricted zones along the AP axis. These types of experiments provide moreflexibility in developing experiments to delineate the function of BMP regulators, and none of thecurrent 1D models are capable of predicting the signaling patterns for any of these experiments.Furthermore, experimentalists used a method of mRNA injection to decipher various aspects of
60

H. G. Othmer et al. The intersection of theory and application in developmental biology
BMP-mediated positive feedback in the Drosophila embryo. In order to test the next generation ofmodels and plausible positive feedback mechanisms against the experimental observations, a full3D model must be developed and this work is ongoing.
With a 3D organism-scale model of the Drosophila embryo, modelers can investigate a numberof other phenomena that have not yet been addressed. First, one could perturb the geometry of themodel to determine the sensitivity of patterning to the specific embryo geometry. One could alsocouple the 3D model with new biological data such as the VirtualEmbryo, which is a new spa-tiotemporal map of gene expression in Drosophila, and determine the sensitivity of BMP signalingto perturbations in the spatial distribution of upstream components.
Figure 19: Future work– geometry, dynamics and concentration data. (From [108] with permission)
6.2. BacteriaBiofilm formation is a complicated process that involves cell growth, differentiation, cell-cell sig-naling, and mechanical response to substrate. Bacterial patterns formed in laboratories provide amanipulable model system to understand biofilm initiation and growth. In particular, the beauti-ful patterns formed in E. coli colonies have posed excellent challenges to understand the com-plex interplay between different processes involved through mathematical modeling. Althoughthe previous models have been shown to produce qualitatively similar patterns in experiments, theunderstanding of the mechanisms underlying these patterns is still poor and has to be addressed.
• Further development of the hybrid cell-based model. The hybrid cell-based model providesopportunities for modelers to describe individual cells in great detail and investigate the role
61

H. G. Othmer et al. The intersection of theory and application in developmental biology
of intracellular processes in the populational patterns. Two major aspects of the E. coli pat-terns in semi-solid agar are the swarm ring formation and the regular aggregation patternformation. The hybrid cell-based model has already been shown to predict the outward-moving swarm ring, with a sharper wave front and a diffusive wave tail. Depending onparameters, instability develops inside the ring and may induce fast moving aggregates. Inorder to obtain stable aggregates disassociated from the ring, one has to incorporate satu-ration of receptors at high concentration of attractant and change of motility of cells in thefuture. In addition, since succinate has been shown to be a weak attractant for E. coli , it isworthwhile to investigate the contribution of response towards multiple signals to the patternformation.
• Derivation of continuum models. In section 4.4., chemotaxis equations were derived fromthe cell-based model under the shallow signal gradient condition. How to derive the macro-scopic equations for large signal gradient remains an open problem. In addition, in thederivation cell-cell mechanical interaction was ignored since the cell density is low. How-ever when cell density becomes high, one may need to consider the volume filling effects.How to derive the macroscopic equation with volume filling from a suitable cell-based modeldeserves future investigation. An initial step to address the question would be to considerthe case with no signal gradient and derive a nonlinear diffusion equation.
6.3. Pigmentation patternsPigmentation patterning presents an ideal system for understanding the emergence of pattern andform in the developing embryo. The rich tradition of modeling in this area provides a convenientplatform for formulating expanded models that integrate recent data regarding the molecular con-trols and cellular interactions determining pigment cell specification and positioning. The naturalcell markers (i.e. the pigment) and the ability to follow pattern change in a noninvasive manneroffers a potential to formulate testable predictions into the fundamental mechanisms controlingpatterning. To conclude this section, we offer a number of challenges for modelers to address inthis exciting area.
• Distinguishing between models for pigmentation. As described above, the reaction-diffusionmodel accurately predicts many known pigment patterns across a wide variety of species.Yet a number of diverse models, including chemotaxis-based and differential-adhesion-basedmodels, are capable of predicting similar pattern types. How do we successfully differentiatebetween these various models to identify the fundamental mechanism underlying pigmenta-tion control?
• Integrating microscopic data into the modeling. In the absence of detailed information con-cerning the cellular and molecular processes underpinning patterning, the majority of mod-eling has focused on a phenomenological level, employing generic assumptions regardingthe underlying interactions. Recent work, particularly in zebrafish and butterflies, is reveal-ing greater insight into molecular and cellular interactions, leading to recent formulations of
62

H. G. Othmer et al. The intersection of theory and application in developmental biology
cell-based models of pigmentation control [141, 36]. A challenge for future modeling willbe to integrate new data into existing models to generate experimentally testable predictions.
• Positioning of pigment cell precursors. Pigmentation models have generally focused onexplaining the origin of the adult form with less attention on the initial stages. Followingtheir migration from the neural crest, larval pigment cells of the zebrafish organise intoa number of longitudinal melanophore stripes with xanthophores occupying the spaces inbetween. The development of models that consider both the generation of this larval patternas well as its subsequent transformation to the juvenile/adult form remains unexplored.
• Explaining patterning diversity. In zebrafish and related species the pigmentation patternmay vary considerably [175], leading to questions regarding a link between patterning anddiversification. A number of theoretical studies have begun to explore the impact of per-turbations to a model for the form of the adult pattern (e.g. [6, 141, 36]), yet extending thisfurther will be required with increased understanding into the biological processes governingpatterning.
In summary, we are at the beginning of a transition in the modeling of development in biology.Models are changing from qualitative descriptions to explain some peculiar or non-intuitive data,to quantitative models that make predictions that can be tested experimentally to drive the biologyforward. As mathematical models of biological mechanisms continue to provide significant newinsights into the underlying biology that can be directly assayed in vivo, we will observe a revolu-tion in biology that transforms it from a qualitative, observation-driven discipline, to a quantitative,analysis-driven discipline.
7. AcknowledgementsThe research herein was supported by the National Science Foundation (US), the National Insti-tutes of Health (US), the Alexander von Humboldt Foundation, the Digital Technology Center, andthe Minnesota Supercomputing Institute.
References[1] J. Adler. Chemotaxis in bacteria. Science, 153 (1966), 708–716.
[2] G. Allen, R. Steene, M. Allen. A guide to angelfishes and butterflyfishes. Odyssey, 1998.
[3] K. Amonlirdviman, N. A. Khare, D. R. Tree, W. S. Chen, J. D. Axelrod, C. J. Tomlin.Mathematical modeling of planar cell polarity to understand domineering nonautonomy.Science, 307 (2005), No. 5708, 423–6.
[4] R. P. Araujo, D. L. S. McElwain. A history of the study of solid tumour growth: The contri-bution of mathematical modelling. Bull. Math. Biol., 66 (2004), No. 5, 1039–1091.
63

H. G. Othmer et al. The intersection of theory and application in developmental biology
[5] P. Arcuri, J. Murray. Pattern sensitivity to boundary and initial conditions in reaction-diffusion models. J. Math. Biol., 24 (1986), 141–165.
[6] R. Asai, E. Taguchi, Y. Kume, M. Saito, S. Kondo. Zebrafish leopard gene as a componentof the putative reaction-diffusion system. Mech Dev, 89 (1999), 87–92.
[7] M. Ashkenazi, H. G. Othmer. Spatial patterns in coupled biochemical oscillators. Jour.Math. Biol., 5 (1978), 305–350.
[8] S. Atkinson, C. Y. Chang, R. E. Sockett, M. Camara, P. Williams. Quorum sensing inyersinia enterocolitica controls swimming and swarming motility. J Bacteriol, 188 (2006),No. 4, 1451–61.
[9] J. Bagnara, M. Hadley. Chromatophores and color change. Prentice-Hall, Eaglewood Cliffs,New Jersey. 1973.
[10] R. E. Baker, E. A. Gaffney, P. K. Maini. Partial differential equations for self-organizationin cellular and developmental biology. Nonlinearity, 21 (2008), No. 11, 251–290.
[11] R. E. Baker, P. K. Maini. A mechanism for morphogen-controlled domain growth. J MathBiol, 54 (2007), 597–622.
[12] J. Bard. A unity underlying the different zebra striping patterns. J. Zool., 183 (1977), 527–539.
[13] J. Bard. A model for generating aspects of zebra and other mammalian coat patterns. J.Theor. Biol., 93 (1981), 363–385.
[14] J. Bard, V. French. Butterfly wing patterns: how good a determining mechanism is the simplediffusion of a single morphogen? J. Embryol. Exp. Morph., 84 (1984), 255–274.
[15] R. Barrio, C. Varea, J. Aragn, P. Maini. A two-dimensional numerical study of spatial patternformation in interacting Turing systems. Bull. Math. Biol., 61 (1999), 483–505.
[16] B. L. Bassler. How bacteria talk to each other: regulation of gene expression by quorumsensing. Curr Opin Microbiol, 2 (1999), No. 6, 582–587.
[17] E. Ben-Jacob, I. Cohen, A. Czirok, T. Vicsek, D. L. Gutnick. Chemomodulation of cellularmovement, collective formation of vortices by swarming bacteria, and colonial development.238 (1997), No. 1, 181–.
[18] E. Ben-Jacob, I. Cohen, H. Levine. Cooperative self-organization of microorganisms. Ad-vances in Physics, 49 (2000), No. 4, 395–554.
[19] E. Ben-Jacob, I. Cohen, O. Shochet, I. Aranson, H. Levine. Complex bacterial patterns. 373(1995), No. 6515, 566–557.
64

H. G. Othmer et al. The intersection of theory and application in developmental biology
[20] E. Ben-Jacob, O. Schochet, A. Tenenbaum, I. Cohen, A. Czirok. Generic modelling of co-operative growth patterns in bacterial colonies. 368 (1994), No. 6466, 46–49.
[21] D. Ben-Zvi, B. Shilo, A. Fainsod, N. Barkai. Scaling of the BMP activation gradient inXenopus embryos. Nature, 453 (2008), 1205–1211.
[22] H. Berg. Random walks in biology 1983.
[23] H. C. Berg. Motile behavior of bacteria. Physics Today, 53 (2000), No. 1, 24–29.
[24] H. C. Berg. http://webmac.rowland.org/labs/bacteria/movies/others/. (2008).
[25] M. D. Betterton, M. P. Brenner. Collapsing bacterial cylinders. Physical Review E, 64(2001), 061904.
[26] K. Bisset, C. Douglas. A continuous study of morphological phase in the swarm of proteus.J. Med. Microbiol., 9 (1976), 229–31.
[27] V. Bolos, J. Grego-Bessa, J. L. de la Pompa. Notch signaling in development and cancer.Endocr Rev, 28 (2007), No. 3, 339–63.
[28] J. T. Bonner. The development of Dictyostelium, Chapter Comparative Biology of CellularSlime Molds. Academic Press 1982, 1–33.
[29] R. B. Bourret, K. A. Borkovich, M. I. Simon. Signal transduction pathways involving pro-tein phosphorylation in prokaryotes. 60 (1991), 401–441.
[30] P. Brakefield, V. French. Eyespot development on butterfly wings: the epidermal responseto damage. Dev. Biol., 168 (1995), 98–111.
[31] M. P. Brenner, L. S. Levitov, E. O. Budrene. Physical mechanisms for chemotactic patternformation by bacteria. 74 (1998), No. 4, 1677–1693.
[32] C. Brunetti, J. Selegue, A. Monteiro, V. French, P. Brakefield, S. Carroll. The generationand diversification of butterfly eyespot color patterns. Curr. Biol., 11 (2001), 1578–1585.
[33] E. O. Budrene. Personal communication 2005.
[34] E. O. Budrene, H. C. Berg. Complex patterns formed by motile cells of Escherichia coli.Nature, 349 (1991), No. 6310, 630–633.
[35] E. O. Budrene, H. C. Berg. Dynamics of formation of symmetrical patterns by chemotacticbacteria. Nature, 376 (1995), No. 6535, 49–53.
[36] C. Caicedo-Carvajal, T. Shinbrot. In silico zebrafish pattern formation. Dev. Biol., 315(2008), 397–403.
65

H. G. Othmer et al. The intersection of theory and application in developmental biology
[37] S. Carroll, J. Gates, D. Keys, S. Paddock, G. Panganiban, J. Selegue, J. Williams. Patternformation and eyespot determination in butterfly wings. Science, 265 (1994), 109–114.
[38] J. Casanova, G. Struhl. The torso receptor localizes as well as transduces the spatial signalspecifying terminal body pattern in Drosophila. Nature, 362 (1993), 152–155.
[39] V. Castets, E. Dulos, P. D. Kepper. Experimental evidence of a sustained standing Turing-type nonequilibrium chemical pattern. 64 (1990), No. 24, 2953–2956.
[40] C. M. Child. Patterns and problems of development. University of Chicago Press 1941.
[41] S. Childress, J. K. Percus. Nonlinear aspects of chemotaxis. 56 (1981) 217–237.
[42] J. H. Claxton. The determination of patterns with special reference to that of the centralprimary skin follicles in sheep. J. Theor. Biol., 7 (1964), 302–317.
[43] J. H. Claxton. Developmental origin of even spacing between the microchaetes ofDrosophila melanogaster. Aust J Biol Sci, 29 (1976) 131–135.
[44] P. Cluzel, M. Surette, S. Leibler. An ultrasensitive bacterial motor revealed by monitoringsignaling proteins in single cells. Science, 287 (2000), 1652–1655.
[45] E. Conway, D. Hoff, J. Smoller. Large time behavior of solutions of systems of nonlinearreaction-diffusion equations. SIAM J. Appl. Math., (1977).
[46] M. Coppey, A. Berezhkovskii, Y. Kim, A. Boettiger, S. Shvartsman. Modeling the bicoidgradient: diffusion and reversible nuclear trapping of a stable protein. Dev. Biol., 312(2007), 623–630.
[47] M. Coppey, A. Boettiger, A. Berezhkovskii, S. Shvartsman. Nuclear trapping shapes theterminal gradient in the Drosophila embryo. Curr. Biol., 18 (2008), 915–919.
[48] E. Crampin, W. Hackborn, P. Maini. Pattern formation in reaction-diffusion models withnonuniform domain growth. Bull. Math. Biol., 64 (2002), 747–769.
[49] E. J. Crampin, E. A. Gaffney, P. K. Maini. Reaction and diffusion on growing domains:Scenarios for robust pattern formation. Bulletin of Mathematical Biology, 61 (1999), No. 6,1093–1120.
[50] O. Crauk, N. Dostatni. Bicoid determines sharp and precise target gene expression in theDrosophila embryo. Curr Biol, 15 (2005), No. 21, 1888–1898, comparative Study.
[51] F. H. Crick. Diffusion in embryogenesis. Nature, 225 (1970), 420–422.
[52] M. C. Cross, P. C. Hohenberg. Pattern formation out of equilibrium. 65 (1993), No. 3, 851–1112.
66

H. G. Othmer et al. The intersection of theory and application in developmental biology
[53] R. Daniels, J. Vanderleyden, J. Michiels. Quorum sensing and swarming migration in bac-teria. FEMS Microbiol Rev., 28 (2004), 261–89.
[54] P. de Kepper, V. Castets, E. Dulos, J. Boissonade. Turing-type chemical patterns in thechlorite-iodide-malonic acid reaction. D 49 (1991) 161–169.
[55] R. Dilao, J. Sainhas. Modelling butterfly wing eyespot patterns. Proc. Biol. Sci., 271 (2004),1565–1569.
[56] R. Dillon, P. K. Maini, H. G. Othmer. Pattern formation in generalized Turing systems I.Steady-state patterns in systems with mixed boundary conditions. Journal of MathematicalBiology, 32 (1994), No. 4, 345–393.
[57] R. Dillon, H. G. Othmer. A mathematical model for outgrowth and spatial patterning of thevertebrate limb bud. J. Theor. Biol., 197 (1999), No. 3, 295–330.
[58] W. Driever, C. Nusslein-Volhard. A gradient of bicoid protein in Drosophila embryos. Cell,54 (1988), No. 1, 83–93.
[59] W. Driever, C. Nusslein-Volhard. The bicoid protein determines position in the Drosophilaembryo in a concentration-dependent manner. Cell, 54 (1988), No. 1, 95–104.
[60] S. Eglen. Development of regular cellular spacing in the retina: theoretical models. Mathe-matical Medicine and Biology, 23 (2006), No. 2, 79–99.
[61] A. Eldar, R. Dorfman, D. Weiss, H. Ashe, B. Z. Shilo, N. Barkai. Robustness of the BMPmorphogen gradient in drosophila embryonic patterning. Nature, 419 (2002), No. 6904,304–308.
[62] R. Erban. From individual to collective behavior in biological systems. Ph.D. thesis, Uni-versity of Minnesota 2005.
[63] R. Erban, H. Othmer. From signal transduction to spatial pattern formation in E. coli: Aparadigm for multiscale modeling in biology. 3 (2005), No. 2, 362–394.
[64] R. Erban, H. G. Othmer. From individual to collective behavior in bacterial chemotaxis.SIAM J. Appl. Math., 65 (2004), No. 2, 361–391.
[65] R. Erban, H. G. Othmer. Taxis equations for amoeboid cells. J Math Biol, 54 (2007), 847–885.
[66] B. Ermentrout. Stripes or spots? nonlinear effects in bifurcation of reaction-diffusion equa-tions on the square. Proc. Roy. Soc. Lond. A., 434 (1991), 413–417.
[67] T. Evans, J. Marcus. A simulation study of the genetic regulatory hierarchy for butterflyeyespot focus determination. Evol. Dev., 8 (2006) 273–283.
67

H. G. Othmer et al. The intersection of theory and application in developmental biology
[68] A. Filloux, I. Vallet. Biofilm: set-up and organization of a bacterial community. Med Sci(Paris), 19 (2003), No. 1, 77–83.
[69] P. R. Fisher, R. Merkl, G. Gerisch. Quantitative analysis of cell motility and chemotaxisin Dictyostelium discoideum by using an image processing system and a novel chemotaxischamber providing stationary chemical gradients. J. Cell. Biol., 108 (1989), 973–984.
[70] R. M. Ford, D. A. Lauffenburger. Analysis of chemotactic bacterial distributions in popula-tion migration assays using a mathematical model applicable to steep or shallow attractantgradients. 53 (1991), No. 5, 721–749.
[71] R. M. Ford, D. A. Lauffenburger. Measurement of bacterial random motility and chemotaxiscoefficients: II: Application of single-cell-based mathematical model. Biotechnol. Bioeng.,37 (1991), 661–672.
[72] R. M. Ford, B. R. Phillips, J. A. Quinn, D. A. Lauffenburger. Measurement of bacterial ran-dom motility and chemotaxis coefficients: I. stopped–flow diffusion chamber assay. Biotech-nol. Bioeng., 37 (1991) 647–660.
[73] C. Fowlkes, C. Hendriks, S. KerŁnen, G. Weber, O. Rbel, M. Huang, S. Chatoor, A. De-Pace, L. Simirenko, C. Henriquez, A. Beaton, R. Weiszmann, S. Celniker, B. Hamann,D. Knowles, M. Biggin, M. Eisen, J. Malik. A quantitative spatiotemporal atlas of geneexpression in the Drosophila blastoderm. Cell, 133 (2008), 364–374.
[74] H. Fricke. Juvenile-adult colour patterns and coexistence in the territorial coral reef fishPomacanthus imperator. Marine Ecology, 1 (1980), 133–141.
[75] A. Gierer, H. Meinhardt. A theory of biological pattern formation. 12 (1972), No. 1, 30–39.
[76] L. Glass. Stochastic generation of regular distributions. Science, 180 (1973), 1061–1063.
[77] L. A. Goentoro, G. T. Reeves, C. P. Kowal, L. Martinelli, T. Schpbach, S. Y. Shvartsman.Quantifying the Gurken morphogen gradient in Drosophila oogenesis. Dev. Cell, 11 (2006),263–272.
[78] A. B. Goryachev, D. J. Toh, T. Lee. Systems analysis of a quorum sensing network: designconstraints imposed by the functional requirements, network topology and kinetic constants.Biosystems, 83 (2006), No. 2–3, 178–87.
[79] C. Gravan, R. Lahoz-Beltra. Evolving morphogenetic fields in the zebra skin pattern basedon turing’s morphogen hypothesis. Int. J. Appl. Math. Comput. Sci., 14 (2004), 351–361.
[80] E. P. Greenberg. Bacterial communication: Tiny teamwork. Nature, 424 (2003), 134.
[81] T. Gregor, W. Bialek, R. R. de Ruyter van Steveninck, D. W. Tank, E. F. Wieschaus. Diffu-sion and scaling during early embryonic pattern formation. Proc Natl Acad Sci U S A, 102(2005), No. 51, 18403–7.
68

H. G. Othmer et al. The intersection of theory and application in developmental biology
[82] T. Gregor, D. W. Tank, E. F. Wieschaus, W. Bialek. Probing the limits to positional infor-mation. Cell, 130 (2007), No. 1, 153–164.
[83] T. Gregor, E. F. Wieschaus, A. P. McGregor, W. Bialek, D. W. Tank. Stability and nucleardynamics of the bicoid morphogen gradient. Cell, 130 (2007), No. 1, 141–152.
[84] D. Grunwald, J. Eisen. Headwaters of the zebrafish – emergence of a new model vertebrate.Nat. Rev. Genet., 3 (2002), 717–724.
[85] P. Haffter, J. Odenthal, M. C. Mullins, S. Lin, M. J. Farrell, L. Vogelsang, H. F., M. Brand,F. van Eeden, M. Furutani-Seiki, M. Granato, M. Hammerschmidt, C. P. Heisenberg, Y. J.Jiang, D. A. Kane, N. Kelsh, R. N. Hopkins, C. Nusslein-Volhard. Mutationa affecting pig-mentation and shape of the adult zebrafish. Dev. Genes. Evol., 206 (1996), 260–276.
[86] H.Berg, D. Brown. Chemotaxis in Escherichia Coli analyzed by three-dimensional tracking.Nature, 239 (1972), 502–507.
[87] D. Headon, K. J. Painter. Stippling the skin: Generation of anatomical periodicity byreaction-diffusion mechanisms. Submitted to MMNP, (2008).
[88] M. Herrero, J. Velazquez. Chemotactic collapse for the Keller-Segel model. J. Math. Biol.,35 (1996), 177–194.
[89] T. Hillen, H. G. Othmer. The diffusion limit of transport equation derived from velocity-jumpprocesses. Siam J. Appl. Math., 61 (2000), No. 3, 751–775.
[90] T. Hillen, K. Painter. A user’s guide to pde models for chemotaxis. J. Math. Biol., 58 (2008),183–217.
[91] M. Hirata, K.-i. Nakamura, T. Kanemaru, Y. Shibata, S. Kondo. Pigment cell organizationin the hypodermis of zebrafish. Dev Dyn, 227 (2003) 497–503.
[92] D. Horstmann. From 1970 until present: the Keller-Segel model in chemotaxis and its con-sequences I. Jahresbericht der DMV, 105 (2003), No. 3, 103–165.
[93] D. Horstmann. A constructive approach to traveling waves in chemotaxis. Journal of Non-linear Science, 14 (2004), 1–25(25).
[94] B. Houchmandzadeh, E. Wieschaus, S. Leibler. Establishment of developmental precisionand proportions in the early Drosophila embryo. Nature, 415 (2002), No. 6873, 798–802.
[95] L. Hufnagel, A. A. Teleman, H. Rouault, S. M. Cohen, B. I. Shraiman. On the mechanism ofwing size determination in fly development. Proc Natl Acad Sci U S A, 104 (2007), No. 10,3835–40, epub 2007 Feb 28.
[96] J. Jaeger, J. Reinitz. On the dynamic nature of positional information. Bioessays, 28 (2006),No. 11, 1102–11.
69

H. G. Othmer et al. The intersection of theory and application in developmental biology
[97] J. Jaeger, S. Surkova, M. Blagov, H. Janssens, D. Kosman, K. Kozlov, Manu, E. Myas-nikova, C. Vanario-Alonso, M. Samsonova, D. Sharp, J. Reinitz. Dynamic control of posi-tional information in the early Drosophila embryo. Nature, 430 (2004), No. 430, 368–71.
[98] W. Jager, S. Luckhaus. On explosions of solutions to a system of partial differential equa-tions modelling chemotaxis. 329 (1992), No. 2, 819–824.
[99] S. L. Johnson, D. Africa, C. Walker, J. A. Weston. Genetic control of adult pigment stripedevelopment in zebrafish. Dev Biol, 167 (1995), 27–33.
[100] H. S. Jung, P. H. Francis-West, R. B. Widelitz, T. X. Jiang, S. Ting-Berreth, C. Tickle,L. Wolpert, C. M. Chuong. Local inhibitory action of BMPs and their relationships withactivators in feather formation: implications for periodic patterning. Dev Biol, 196 (1998),No. 1, 11–23.
[101] D. Kaiser. Coupling cell movement to multicellular development in myxobacteria. Nat. Rev.Microbiol., 1 (2003), No. 1, 45–54.
[102] D. Kaiser. Myxococcus — from single-cell polarity to complex multicellular patterns. An-nual Review of Genetics, 42 (2008), No. 1, 109–130.
[103] E. F. Keller, G. M. Odell. Necessary and sufficient conditions for chemotactic bands. Math-ematical Biosciences, 27 (1975), 309–317.
[104] E. F. Keller, L. A. Segel. Initiation of slime mold aggregation viewed as an instability. J.Theor. Biol., 26 (1970), 399–415.
[105] E. F. Keller, L. A. Segel. Model for chemotaxis. J. Theor. Biol., 30 (1971), 225–234.
[106] E. F. Keller, L. A. Segel. Traveling bands of chemotactic bacteria: A theoretical analysis. J.Theor. Biol., 30 (1971), 235–248.
[107] R. N. Kelsh, M. Brand, Y. J. Jiang, C. P. Heisenberg, S. Lin, P. Haffter, J. Odenthal, M. C.Mullins, F. J. van Eeden., M. Furutani-Seiki, M. Granato, M. Hammerschmidt, D. A. Kane,R. M. Warga, D. Beuchle, L. Vogelsang, C. Nusslein-Volhard. Zebrafish pigmentation mu-tations and the processes of neural crest development. Development, 123 (1996), 369–389.
[108] S.V. Keranen, C.C. Fowlkes, C.L. Luengo Hendriks, D. Sudar, D.W. Knowles, J. Malik,M.D. Biggin. Three-dimensional morphology and gene expression in the Drosophila blas-toderm at cellular resolution II: dynamics. Genome Biol. 7 (1006), R124
[109] M. Kerszberg, L. Wolpert. Mechanisms for positional signalling by morphogen transport:a theoretical study. J. Theor. Biol., 191 (1998), No. 1, 103–114.
[110] A. Kicheva, P. Pantazis, T. Bollenbach, Y. Kalaidzidis, T. Bittig, F. Julicher, M. Gonzalez-Gaitan. Kinetics of morphogen gradient formation. Science, 315 (2007), No. 5811, 521–525.
70

H. G. Othmer et al. The intersection of theory and application in developmental biology
[111] P. Koch, D. Keys, T. Rocheleau, K. Aronstein, M. Blackburn, S. Carroll, R. ffrench Constant.Regulation of dopa decarboxylase expression during colour pattern formation in wild-typeand melanic tiger swallowtail butterflies. Development, 125 (1998), 2303–2313.
[112] R. Kolter, E. P. Greenberg. Microbial sciences: The superficial life of microbes. Nature, 441(2006), 300–302.
[113] S. Kondo, R. Asai. A reaction-diffusion wave on the skin of the marine angelfish Pomacan-thus. Nature, 376 (1995), 675–768.
[114] P. Kulesa, G. Cruywagen, S. Lubkin, P. Maini, J. Sneyd, M. Ferguson, J. Murray. On amodel mechanism for the spatial patterning of teeth primordia in the alligator. J. Theor.Biol., 180 (1996), 287–296.
[115] A. D. Lander. Morpheus unbound: reimagining the morphogen gradient. Cell, 128 (2007),No. 2, 245–256.
[116] A. D. Lander, Q. Nie, F. Y. M. Wan. Do morphogen gradients arise by diffusion? Dev. Cell,2 (2002), No. 6, 785–96.
[117] I. R. Lapidus, R. Schiller. A model for traveling bands of chemotactic bacteria. Biophys J.,22 (1978), No. 1, 1–13.
[118] D. Lauffenburger, C. R. Kennedy, R. Aris. Traveling bands of chemotactic bacteria in thecontext of population growth. Bulletin of Mathematical Biology, 46 (1984), No. 1, 19–40.
[119] N. Le Douarin, C. Kalcheim. The neural crest. CUP, Cambridge, 2nd edition 1999.
[120] I. Lengyel, I. R. Epstein. Modelling of Turing structures in the chlorite-iodide-malonic acid-starch reaction system. Science, 251 (1991) 650–652.
[121] S. Liaw, C. Yang, R. Liu, J. Hong. Turing model for the patterns of lady beetles. Phys RevE Stat Nonlin Soft Matter Phys, 64 (2001), 041909.
[122] R. Liu, S. Liaw, P. Maini. Two-stage Turing model for generating pigment patterns on theleopard and the jaguar. Phys Rev E Stat Nonlin Soft Matter Phys, 74 (2006), 011914.
[123] R. Lux, W. Shi. Chemotaxis-guided movements in bacteria. Crit. Rev. Oral. Biol. Med., 15(2004), No. 4, 207–20.
[124] M. Lyons, L. Harrison. Stripe selection: An intrinsic property of some pattern-forming mod-els with nonlinear dynamics. Dev. Dyn., 195 (1992) 201–215.
[125] F. Maderspacher, C. Nusslein-Volhard. Formation of the adult pigment pattern in zebrafishrequires leopard and obelix dependent cell interactions. Development, 130 (2003), 3447–3457.
71

H. G. Othmer et al. The intersection of theory and application in developmental biology
[126] A. Madzvamuse, P. Maini, A. Wathen, T. Sekimura. A predictive model for color patternformation in the butterfly wing of papilio dardanus. Hiroshima Math. J., 32 (2002), 325–336.
[127] P. K. Maini, K. J. Painter, H. P. C. Nguyen. Spatial pattern formation in chemical andbiological systems. J Chem Soc Faraday Trans, 93 (1997), No. 20, 3601–10.
[128] N. V. Mantzaris, S. Webb, H. G. Othmer. Mathematical modeling of tumor-induced angio-genesis. J. Math. Biol., 49 (2004), No. 2, 111–87.
[129] J. Marcus, T. Evans. A simulation study of mutations in the genetic regulatory hierarchy forbutterfly eyespot focus determination. BioSystems, 93 (2008), 250–255.
[130] M. McClure. Development and evolution of melanophore patterns in fishes of the genusDanio (Teleostei: Cyprinidae). J. Morphol., 241 (1999) 83–105.
[131] H. Meinhardt. Models of biological pattern formation. Academic Press, New York 1980.
[132] H. Meinhardt. Models for positional signalling with application to the dorsoventral pattern-ing of insects and segregation into different cell types. Development, supplement (1989),169–180.
[133] H. Meinhardt, P. Prusinkiewicz, D. Fowler. The algorithmic beauty of sea shells. Springer2003.
[134] B. A. Mello, Y. Tu. Quantitative modeling of sensitivity in bacterial chemotaxis: the role ofcoupling among different chemoreceptor species. Proc. Nat. Acad. Sci. (USA), 100 (2003),8223–8228.
[135] D. Mıguez, A. Munuzuri. On the orientation of stripes in fish skin patterning. Biophys.Chem., 124 (2006), 161–167.
[136] N. Milos, A. D. Dingle. Dynamics of pigment pattern formation in the zebrafish, Brachy-danio rerio. I. Establishment and regulation of the lateral line melanophore stripe duringthe first eight days of development. J Exp Zool, 205 (1978), 205–216.
[137] N. Mittal, E. O. Budrene, M. P. Brenner, A. Oudenaarden. Motility of Escherichia coli cellsin clusters formed by chemotactic aggregation. Proc. Natl. Acad. Sci. (USA), 100 (2003),No. 23, 13259–63.
[138] C. M. Mizutani, Q. Nie, F. Y. Wan, Y. T. Zhang, P. Vilmos, R. Sousa-Neves, E. Bier, J. L.Marsh, A. D. Lander. Formation of the BMP activity gradient in the Drosophila embryo.Dev. Cell, 8 (2005), No. 6, 915–24.
[139] A. Monteiro, V. French, G. Smit, P. Brakefield, J. Metz. Butterfly eyespot patterns: evidencefor specification by a morphogen diffusion gradient. Acta Biotheor., 49 (2001), 77–88.
72

H. G. Othmer et al. The intersection of theory and application in developmental biology
[140] J. R. Mooney, B. N. Nagorcka. Spatial patterns produced by a reaction-diffusion system inprimary hair follicles. J. Theor. Biol., 115 (1985), 299–317.
[141] J. Moreira, A. Deutsch. Pigment pattern formation in zebrafish during late larval stages: amodel based on local interactions. Dev. Dyn., 232 (2005).
[142] C. Mou, B. Jackson, P. Schneider, P. A. Overbeek, D. J. Headon. Generation of the primaryhair follicle pattern. Proc. Natl. Acad. Sci. U.S.A., 103 (2006), 9075–9080.
[143] J. D. Murray. A pattern formation mechanism and its application to mammalian coat mark-ings. volume 39 of Lecture Notes in Biomathematics, Springer, Berlin, Heidelberg, NewYork. 1979, (360–399).
[144] J. D. Murray. On pattern-formation mechanisms for leipdopteran wing patterns and mam-malian coat markings. Phil. Trans. Roy. Soc. Lond. B, 295 (1981), 473–496.
[145] J. D. Murray. A pre-pattern formation mechanism for animal coat markings. J. Theor. Biol.,88 (1981), 161–199.
[146] J. D. Murray. Mathematical biology ii: Spatial models and biomedical applications.Springer, New York, 3rd edition 2003.
[147] J. D. Murray, D. Deeming, M. Ferguson. Size-dependent pigmentation-pattern formation inembryos of alligator-mississippiensis - time of initiation of pattern generation mechanism.Proc. Roy. Soc. Lond. B, 239 (1990), 279–293.
[148] J. D. Murray, M. Myerscough. Pigmentation pattern formation on snakes. J. Theor. Biol.,149 (1991), 339–360.
[149] J. D. Murray. Mathematical biology, volume 19 of Biomathematics 1989.
[150] B. N. Nagorcka, J. R. Mooney. The role of a reaction–diffusion system in the formation ofhair fibres. J. Theor. Biol., 98 (1982) 575–607.
[151] B. N. Nagorcka, J. R. Mooney. The role of a reaction-diffusion system in the initiation ofprimary hair follicles. J. Theor. Biol., 114 (1985), 243–272.
[152] T. Naitoh, A. Morioka, Y. Omura. Adaptation of a common freshwater goby, yoshinobori,rhinogobius brunneus temminck et schlegel to various backgrounds including those contain-ing different sizes of black and white checkerboard squares. Zool. Sci., 2 (1985), 59.
[153] J. Nelson. Fishes of the world. John Wiley and Sons, New York, 3rd edition 1993.
[154] F. S. Neuman-Silberberg, T. Schupbach. The Drosophila dorsoventral patterning genegurken produces a dorsally localized RNA and encodes a TGF alpha-like protein. Cell,75 (1993), No. 1, 165–74.
73

H. G. Othmer et al. The intersection of theory and application in developmental biology
[155] H. Nijhout. Wing pattern formation in lepidoptera: a model. J. Exp. Zool., 206 (1978),119–136.
[156] H. Nijhout. A comprehensive model for color pattern formation in butterflies. Proc. Roy.Soc. Lond. B, 239 (1990), 81–113.
[157] H. Nijhout, P. K. Maini, A. Madzvamuse, A. Wathen, T. Sekimura. Pigmentation patternformation in butterflies: experiments and models. C. R. Biol., 326 (2003), 717–727.
[158] M. B. O’Connor, D. M. Umulis, H. G. Othmer, S. S. Blair. Shaping BMP morphogen gra-dients in the Drosophila embryo and pupal wing. Development, 133 (2006), 183–93.
[159] J. Odenthal, K. Rossnagel, P. Haffter, R. N. Kelsh, E. Vogelsang, M. Brand, F. J. van Eeden.,M. Furutani-Seiki, M. Granato, M. Hammerschmidt, C. P. Heisenberg, Y. J. Jiang, D. A.Kane, M. C. Mullins, C. Nusslein-Volhard. Mutations affecting xanthophore pigmentationin the zebrafish, Danio rerio. Development, 123 (1996), 391–398.
[160] J. Otaki. Physiologically induced color-pattern changes in butterfly wings: mechanistic andevolutionary implications. J. Insect Physiol., 54 (2008), 1099–1112.
[161] H. G. Othmer. Interactions of reaction and diffusion in open systems. Ph.D. thesis, Univer-sity of Minnesota, Minneapolis 1969.
[162] H. G. Othmer. Current problems in pattern formation. In Some mathematical questions inbiology, volume VIII, Amer. Math. Soc., Providence, R.I. 1977, (57–85).
[163] H. G. Othmer. Synchronized and differentiated modes of cellular dynamics. In H. Haken,editor, Dynamics of Synergetic Systems, Springer-Verlag.
[164] H. G. Othmer, J. A. Aldridge. The effects of cell density and metabolite flux on cellulardynamics. J. Math. Biol., 5 (1978), 169–200.
[165] H. G. Othmer, S. R. Dunbar, W. Alt. Models of dispersal in biological systems. J. Math.Biol., 26 (1988), No. 3, 263–298.
[166] H. G. Othmer, T. Hillen. The diffusion limit of transport equations, Part II: chemotaxisequations. SIAM JAM, 62 (2002), 1222–1260.
[167] H. G. Othmer, E. F. Pate. Scale-invariance in reaction-diffusion models of spatial patternformation. Proc Natl Acad Sci U S A, 77 (1980), No. 7, 4180–4184.
[168] H. G. Othmer, P. Schaap. Oscillatory cAMP signaling in the development of Dictyosteliumdiscoideum. Comments on Theoretical Biology, 5 (1998), 175–282.
[169] H. G. Othmer, L. E. Scriven. Instability and dynamic pattern in cellular networks. J. Theor.Biol., 32 (1971), 507–537.
74

H. G. Othmer et al. The intersection of theory and application in developmental biology
[170] H. G. Othmer, A. Stevens. Aggregation, blowup and collaps: The ABC’s of generalizedtaxis. SIAM J. Appl. Math., 57 (1997), No. 4, 1044–1081.
[171] Q. Ouyang, H. L. Swinney. Transition from a uniform state to hexagonal and striped turingpatterns. Nature, 352 (1991), 610–612.
[172] K. Painter. Mathematical models for biological pattern formation, chapter Modelling ofpigment patterns in fish. Number 121 in IMA Volumes in Mathematics and its Applications,Springer-Verlag, Berlin 2000, (59–82).
[173] K. J. Painter, P. K. Maini, H. G. Othmer. Stripe formation in juvenile Pomacanthus ex-plained by a generalized Turing mechanism with chemotaxis. Proc. Nat. Acad. Sci., 96(1999), 5549–5554.
[174] K. J. Painter, P. K. Maini, H. G. Othmer. Development and applications of a model forcellular response to multiple chemotactic cues. J. Math. Biol., 41 (2000), No. 4, 285–314.
[175] D. Parichy. Homology and the evolution of novelty during Danio adult pigment patterndevelopment. J. Exp. Zool. B Mol. Dev. Evol., 308 (2007), 578–590.
[176] D. M. Parichy, D. G. Ransom, B. Paw, L. I. Zon, S. L. Johnson. An orthologue of thekit-related gene fms is required for development of neural crest-derived xanthophores and asubpopulation of adult melanocytes in the zebrafish, Danio rerio. Development, 127 (2000),3031–3044.
[177] D. M. Parichy, J. M. Turner. Temporal and cellular requirements for Fms signaling duringzebrafish adult pigment pattern development. Development, 130 (2003), 817–833.
[178] D. M. Parichy, J. M. Turner. Zebrafish puma mutant decouples pigment pattern and somaticmetamorphosis. Dev Biol, 256 (2003), 242–257.
[179] D. M. Parichy, J. M. Turner, N. B. Parker. Essential role for puma in development of postem-bryonic neural crest-derived cell lineages in zebrafish. Dev Biol, 256 (2003), 221–241.
[180] E. Pate, H. G. Othmer. Differentiation, cell sorting and proportion regulation in the slugstage of Dictyostelium discoideum. J. Theor. Biol., 118 (1986), No. 3, 301–319.
[181] C. S. Patlak. Random walk with persistence and external bias. Bull. of Math. Biophys., 15(1953), 311–338.
[182] J. E. Pearson, W. Horsthemke. Turing instabilities with nearly equal diffusion coefficients.Journal of Chemical Physics, 90 (1989), No. 3, 1588–1599.
[183] F. Peri. The role of EGF and TGF-b signaling in specifying the polarity of the Drosophilaegg and embryo. Doctoral, University of Cologne 2001.
75

H. G. Othmer et al. The intersection of theory and application in developmental biology
[184] T. J. Perkins, J. Jaeger, J. Reinitz, L. Glass. Reverse engineering the gap gene network ofDrosophila melanogaster. PLoS Comput Biol, 2 (2006), No. 5, 0417–28.
[185] A. A. Polezhaev, R. A. Pashkov, A. I. Lobanov, I. B. Petrov. Spatial patterns formed bychemotactic bacteria escherichia coli. Int J Dev Biol, 50 (2006), No. 2-3, 309–14.
[186] R. Prum, R. Torres. Structural colouration of mammalian skin: convergent evolution ofcoherently scattering dermal collagen arrays. J. Exp. Biol., 207 (2004), 2157–2172.
[187] R. Prum, S. Williamson. Reaction-diffusion models of within-feather pigmentation pattern-ing. Proc. Biol. Sci., 269 (2002), 781–792.
[188] C. V. Rao, J. R. Kirby, A. P. Arkin. Design and diversity in bacterial chemotaxis: A com-parative study in Escherichia coli and Bacillus subtilis. PLoS Biol, 2 (2004), No. 2, E49.
[189] O. Rauprich, M. Matsushita, C. J. Weijer, F. Siegert, S. E. Esipov, J. A. Shapiro. Periodicphenomena in proteus mirabilis swarm colony development. J Bacteriol, 178 (1996), No. 22,6525–38.
[190] G. Reeves, R. Kalifa, D. Klein, M. Lemmon, S. Shvartsman. Computational analysis ofEGFR inhibition by Argos. Dev. Biol., 284 (2005), 523–535.
[191] G. T. Reeves, C. B. Muratov, T. Schupbach, S. Y. Shvartsman. Quantitative models of de-velopmental pattern formation. Dev Cell, 11 (2006), No. 3, 289–300.
[192] T. Roose, S. J. Chapman, P. K. Maini. Mathematical models of avascular tumor growth.SIAM Review, 49 (2007), No. 2, 179–208.
[193] G. Ruxton. The possible fitness benefits of striped coat coloration for zebra. Mammal. Rev.,32 (2002), 237–244.
[194] M. J. Saxton. A Biological Interpretation of Transient Anomalous Subdiffusion. I. Qualita-tive Model. Biophysical Journal, 92 (2007), No. 4, 1178.
[195] H. Scher, M. Lax. Stochastic transport in a disordered solid. I. theory. Phys. Rev. B, 7(1973), No. 10, 4491–502.
[196] B. Schwanwitsch. On the groundplan of the wing pattern in nymphalids and certain otherfamilies of rhopalocara. Proc. Zool. Sci. Lond., 34 (1924) 509–528.
[197] J. E. Segall, S. M. Block, H. C. Berg. Temporal comparisons in bacterial chemotaxis. Proc.Nat. Acad. Sci. USA, 83 (1986), 8987–8991.
[198] L. A. Segel. A theoretical study of receptor mechanisms in bacterial chemotaxis. SIAMJournal on Applied Mathematics, 32 (1977), 653–665.
[199] T. Sekimura, A. Madzvamuse, A. Wathen, P. K. Maini. A model for colour pattern formationin the butterfly wing of Papilio dardanus. Proc. Biol. Sci., 267 (2000), 851–859.
76

H. G. Othmer et al. The intersection of theory and application in developmental biology
[200] M. Serpe, D. Umulis, A. Ralston, J. Chen, D. Olson, A. Avanesov, H. Othmer, M. O’Connor,S. Blair. The BMP-binding protein Crossveinless 2 is a short-range, concentration-dependent, biphasic modulator of BMP signaling in Drosophila. Dev. Cell, 14 (2008) 940–953.
[201] J. A. Shapiro. Thinking about bacterial populations as multicellular organisms. Ann RevMicrobiol, 52 (1998), 81–104.
[202] T. S. Shimizu, S. V. Aksenov, D. Bray. A spatially extended stochastic model of the bacterialchemotaxis signalling pathway. J. Mol. Biol., 329 (2003), 291–309.
[203] O. Shimmi, D. Umulis, H. G. Othmer, M. B. O’Connor. Facilitated transport of a Dpp/Scwheterodimer by Sog/Tsg leads to robust patterning of the Drosophila blastoderm embryo.Cell, 120 (2005), No. 6, 873–86.
[204] H. Shoji, Y. Iwasa, A. Mochizuki, S. Kondo. Directionality of stripes formed by anisotropicreaction-diffusion models. J. Theor. Biol., 214 (2002), 549–561.
[205] H. Shoji, A. Mochizuki, Y. Iwasa, M. Hirata, T. Watanabe, S. Hioki, S. Kondo. Origin ofdirectionality in the fish stripe pattern. Dev. Dyn., 226 (2003), 627–633.
[206] S. Y. Shvartsman, C. B. Muratov, D. A. Lauffenburger. Modeling and computational anal-ysis of EGF receptor-mediated cell communication in Drosophila oogenesis. Development,129 (2002), 2577–2589.
[207] S. Sick, S. Reinker, J. Timmer, T. Schlake. WNT and DKK determine hair follicle spacingthrough a reaction-diffusion mechanism. Science, 314 (2006), No. 5804, 1447–50.
[208] D. Silver, L. Hou, W. Pavan. The genetic regulation of pigment cell development. Adv. Exp.Med. Biol., 589 (2006), 155–169.
[209] R. Singh, D. Paul, R. K. Jain. Biofilms: implications in bioremediation. J. Math. Biol., 14(2006), No. 9, 389–97.
[210] P. A. Spiro, J. S. Parkinson, H. G. Othmer. A model of excitation and adaptation in bacterialchemotaxis. PNAS., 94 (1997), No. 14, 7263–7268.
[211] A. Spirov, K. Fahmy, M. Schneider, E. Frei, M. Noll, S. Baumgartner. Formation of thebicoid morphogen gradient: an mRNA gradient dictates the protein gradient. Development.,136 (2009), 605-614.
[212] M. Steinberg. Differential adhesion in morphogenesis: a modern view. Curr. Opin. Genet.Dev., 17 (2007), 281–286.
[213] F. Suffert. Die ausbildung des imaginalen flugelschnittes in der schmetterlingspuppe. Z.Morph. Okol. Tiere, 14 (1929), 338–359.
77

H. G. Othmer et al. The intersection of theory and application in developmental biology
[214] M. Sugimoto. Morphological colour changes in the medaka, oryzias latipes, after pro-longed background adaptation — i. changes in the population and morphology of themelanophores. Comp. Biochem. Physiol., 104A (1993), 513.
[215] M. Sugimoto. Morphological color changes in fish: regulation of pigment cell density andmorphology. Microsc. Res. Tech., 58 (2002) 496–503.
[216] K. Tosney. Long-distance cue from emerging dermis stimulates neural crest melanoblastmigration. Dev. Dyn., 229 (2004), 99–108.
[217] P. Trainor. Specification of neural crest cell formation and migration in mouse embryos.Semin. Cell Dev. Biol., 16 (2005), 683–693.
[218] L. Tsimring, H. Levine, I. Aranson, E. Ben-Jacob, I. Cohen, O. Shochet, W. N. Reynolds.Aggregation patterns in stressed bacteria. Phys. Rev. Letts, 75 (1995), No. 9, 1859–1862.
[219] A. M. Turing. The chemical basis of morphogenesis. Phil. Trans. R. Soc. London, 237(1952), 37–72.
[220] R. Tyson, S. Lubkin, J. Murray. Model and analysis of chemotactic bacterial patterns in aliquid medium. J Math Biol, 38 (1999), 359–375.
[221] R. Tyson, S. R. Lubkin, J. D. Murray. A minimal mechanism for bacterial pattern formation.Proc. R. Soc. Lond. B, 266 (1999), 299–304.
[222] R. Tyson, L. Stern, R. LeVeque. Fractional step methods applied to a chemotaxis model. J.Math. Biol., 41 (2000), 455–75.
[223] D. Umulis, M. O’Connor, H. Othmer. Robustness of embryonic spatial patterning inDrosophila melanogaster. Curr. Top. Dev. Biol., 81 (2008) 65–111.
[224] D. M. Umulis, M. Serpe, M. B. O’Connor, H. G. Othmer. Robust, bistable patterning of thedorsal surface of the Drosophila embryo. Proc Natl Acad Sci U S A, 103 (2006), No. 31,11613–8.
[225] C. Varea, J. L. Aragon, R. A. Barrio. Confined turing patterns in growing systems. Phys.Rev. E., 56 (1997), 1250–1253.
[226] B. J. Varnum-Finney, E. Voss, D. R. Soll. Frequency and orientation of pseudopod formationof Dictyostelium discoideum amebae chemotaxing in a spatial gradient: Further evidencefor a temporal mechanism. 8 (1987), No. 1, 18–26.
[227] G. von Dassow, E. Meir, E. M. Munro, G. M. Odell. The segment polarity network is arobust developmental module. Nature, 406 (2000), No. 6792, 188–92.
[228] G. H. Wadhams, J. P. Armitage. Making sense of it all: bacterial chemotaxis. Nat. Rev. Mol.Cell Biol., 5 (2004), No. 12, 1024–37.
78

H. G. Othmer et al. The intersection of theory and application in developmental biology
[229] M. Walters, V. Sperandio. Quorum sensing in Escherichia coli and Salmonella. Int J MedMicrobiol., 296 (2006), No. 2-3, 125–31.
[230] X. Wang, R. Harris, L. Bayston, H. Ashe. Type IV collagens regulate BMP signalling inDrosophila. Nature, 455 (2008), 72–77.
[231] Y. C. Wang, E. L. Ferguson. Spatial bistability of Dpp-receptor interactions duringDrosophila dorsal-ventral patterning. Nature, 434 (2005), No. 7030, 229–34.
[232] M. P. Weir, C. W. Lo. Gap-junctional communication. compartments in the Drosophilawing imaginal disc. Developmental Biology, 102 (1984) 130–146.
[233] L. Werdelin, L. Olsson. How the leopard got its spots: a phylogenetic view of the evolutionof felid coat patterns. Biol. J. Linn. Soc., 62 (1997) 383–400.
[234] N. A. Whitehead, A. M. Barnard, H. Slater, N. J. Simpson, G. P. Salmond. Quorum-sensingin gram-negative bacteria. FEMS Microbiol Rev., 25 (2001), No. 4, 365–404.
[235] L. Wolpert. Positional information and the spatial pattern of cellular differentiation. J.Theor. Biol., 25 (1969), No. 1, 1–67.
[236] L. Wolpert. Positional information and pattern formation. Curr. Topics in Dev. Biol., 6(1971), 183–224.
[237] D. E. Woodward, R. Tyson, M. R. Myerscough, J. D. Murray, E. O. Budrene, H. C. Berg.Spatio-temporal patterns generated by salmonella typhimurium. Biophys. J., 68 (1995),No. 5, 2181–2189.
[238] C. Xue. Mathematical models of taxis-driven bacterial pattern formation. Ph.D. thesis, Uni-versity of Minnesota 2008.
[239] C. Xue, H. G. Othmer. Radial and spiral streams formation in bacterium Proteus mirabiliscolonies 2009, preprint.
[240] C. Xue, H. G. Othmer. Multiscale models of taxis-driven patterning in bacterial populations.SIAM J. Appl. Math., to appear (2009).
[241] N. Yakoby, C. A. Bristow, I. Gouzman, M. P. Rossi, Y. Gogotsi, T. Schpbach, S. Y. Shvarts-man. Systems-level questions in Drosophila oogenesis. Syst Biol (Stevenage), 152 (2005),276–284.
[242] M. Yamaguchi, E. Yoshimoto, S. Kondo. Pattern regulation in the stripe of zebrafish sug-gests an underlying dynamic and autonomous mechanism. Proc. Natl. Acad. Sci. U.S.A.,104 (2007), 4790–4793.
[243] D. Young. A local activator-inhibitor model of vertebrate skin patterns. Math. Biosci., 72(1984), 51–58.
79

H. G. Othmer et al. The intersection of theory and application in developmental biology
[244] Y. Zhang, A. Lander, Q. Nie. Computational analysis of BMP gradients in dorsal-ventralpatterning of the zebrafish embryo. J. Theor. Biol., 248 (2007), 579–589.
80