the internet of - Glassbeam Glassbeam INTRODUCTION and OVERVIEW ThingWorx Machine communications and...
25
how strategic analytics alliances will drive innovation and new customer value the internet of things, machines and data analytics Joint research and perspective on the opportunity for machine data management, modeling and analytics tools in the Internet of Things arena
Transcript of the internet of - Glassbeam Glassbeam INTRODUCTION and OVERVIEW ThingWorx Machine communications and...

how strategic analytics alliances
will drive innovation and new customer value
the internet ofthings, machines and data analytics
Joint research and perspective on the opportunity for machine data management,
modeling and analytics tools in the Internet of Things arena

2
ThingWorxGlassbeam
The Internet of Things (IoT) and the new world of Smart Systems are ushering in an era where people, machines, devices, sensors, and businesses are all connected and able to interact with one another.
The convergence of networked computing and large-scale data management with real time machine intelligence is driving the integration of the physical and virtual worlds and creating unimagined new values. Data management, modeling and analytic tools are the core enablers of these new values. However, numerous hurdles have constrained growth in machine data and IoT analytics. A renewed focus on developing ecosystems and the critical relationships that will drive value are key to success. Glassbeam and ThingWorx are at the forefront of partner development for machine data management and analytics solutions.

3
ThingWorxGlassbeam
ABOUT HARBOR RESEARCH Founded in 1984, Harbor Research Inc. has more than twenty five years of experience in providing strategic consulting and re-search services that enable our clients to understand and capitalize on emergent and disruptive opportunities driven by informa-tion and communications technology. The firm has established a unique competence in developing business models and strategy for Smart Systems and the Internet of Things
04INTRODUCTION and OVERVIEW Overview of the scope of research and analysis as well as a summary of the key points on the growth oppor-tunities driven by machine data and analytics tools
10TRENDS, FORCES and FORECASTThis section highlights the critical trends, forces and impacts at work in the IoT and Smart Systems data man-agement and analytics arena. We examine competitive, technical and customer forces impacting market development
24
17STRATEGIC DATA ALLIANCEPerspective on the importance of strategic alliances in the IoT data management and analytics arena with a focus on the recently initiated alliance between ThingWorx and Glassbeam
MARKET DEVELOPMENT
Needs, requirements and challenges for new data modeling, management and analytics tools and applications for the Internet of Things
TABLE OF CONTENTS
4
ThingWorxGlassbeam INTRODUCTION and OVERVIEW
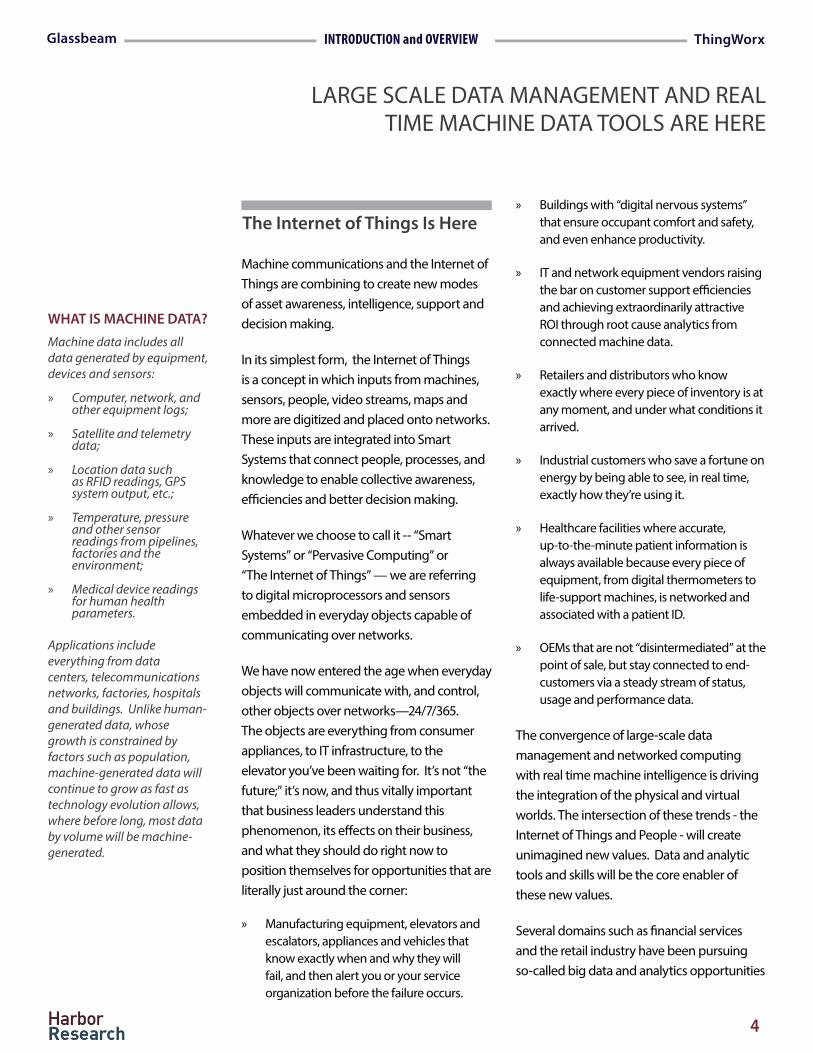
Machine communications and the Internet of Things are combining to create new modes of asset awareness, intelligence, support and decision making.
In its simplest form, the Internet of Things is a concept in which inputs from machines, sensors, people, video streams, maps and more are digitized and placed onto networks. These inputs are integrated into Smart Systems that connect people, processes, and knowledge to enable collective awareness, efficiencies and better decision making.
Whatever we choose to call it -- “Smart Systems” or “Pervasive Computing” or “The Internet of Things” — we are referring to digital microprocessors and sensors embedded in everyday objects capable of communicating over networks.
We have now entered the age when everyday objects will communicate with, and control, other objects over networks—24/7/365. The objects are everything from consumer appliances, to IT infrastructure, to the elevator you’ve been waiting for. It’s not “the future;” it’s now, and thus vitally important that business leaders understand this phenomenon, its effects on their business, and what they should do right now to position themselves for opportunities that are literally just around the corner:
» Manufacturing equipment, elevators and escalators, appliances and vehicles that know exactly when and why they will fail, and then alert you or your service organization before the failure occurs.
» Buildings with “digital nervous systems” that ensure occupant comfort and safety, and even enhance productivity.
» IT and network equipment vendors raising the bar on customer support efficiencies and achieving extraordinarily attractive ROI through root cause analytics from connected machine data.
» Retailers and distributors who know exactly where every piece of inventory is at any moment, and under what conditions it arrived.
» Industrial customers who save a fortune on energy by being able to see, in real time, exactly how they’re using it.
» Healthcare facilities where accurate, up-to-the-minute patient information is always available because every piece of equipment, from digital thermometers to life-support machines, is networked and associated with a patient ID.
» OEMs that are not “disintermediated” at the point of sale, but stay connected to end-customers via a steady stream of status, usage and performance data.
The convergence of large-scale data management and networked computing with real time machine intelligence is driving the integration of the physical and virtual worlds. The intersection of these trends - the Internet of Things and People - will create unimagined new values. Data and analytic tools and skills will be the core enabler of these new values.
Several domains such as financial services and the retail industry have been pursuing so-called big data and analytics opportunities
The Internet of Things Is Here
WHAT IS MACHINE DATA?
Machine data includes all data generated by equipment, devices and sensors:
» Computer, network, and other equipment logs;
» Satellite and telemetry data;
» Location data such as RFID readings, GPS system output, etc.;
» Temperature, pressure and other sensor readings from pipelines, factories and the environment;
» Medical device readings for human health parameters.
Applications include everything from data centers, telecommunications networks, factories, hospitals and buildings. Unlike human-generated data, whose growth is constrained by factors such as population, machine-generated data will continue to grow as fast as technology evolution allows, where before long, most data by volume will be machine-generated.
LARGE SCALE DATA MANAGEMENT AND REAL TIME MACHINE DATA TOOLS ARE HERE

5
ThingWorxGlassbeam INTRODUCTION and OVERVIEW
for some time. However, this opportunity is still quite emergent within the Smart Systems and Internet of Things arena. Sensors, machines and a wide range of devices will generate massive amounts of structured and unstructured data, requiring a whole new class of data modeling, management and analytics tools to uncover and capture value. In the hands of talented users, analysts and data scientists, these data can generate productivity improvements, uncover operational risks, signal anomalies, eliminate back-office cycles, and even drive enhanced security protocols. But the growing use of sensors isn’t limited to industrial equipment and complex systems. The Internet of Things also includes wearables, ranging from smart glasses to smart watches and more—devices that bring entertainment, health monitoring, safety and convenience to everyday life.
Analytics tools and techniques are already finding their way around the Smart Systems and the Internet of Things, but the integration of systems and tools is lagging. Both consumer and industrial applications could benefit from better organized end-to-end solutions that incorporate industry standards to help avoid the programming investments that would otherwise be required.
Diverse device-generated data, such as text, sensor readings and video are driving the need to deploy new data management tools. This is especially true with complex equipment and machines. Because sensor data tends to be noisy, analog, and high-velocity, there are major challenges that
Data & Analytics Will Drive Internet of Things Value
Figure 1: Which Domains Are Driving Analytics Opportunities?
Resources/Infrastructure
Energy
Industrial
Wholesale & Supply Chain
Mobility/Transportation
Buildings/Property Services
Retail/Commercial Services
Financial Services
Healthcare
Security/Emergency
Government & Public Services
Goo
ds
Serv
ices
Analytics Impact IT Infrastructure Data Availability
High Medium Low Key
IT Equipment & Network Services
CONSUMER and INDUSTRIAL USERS CAN BENEFIT
Source: Harbor Research

6
ThingWorxGlassbeam INTRODUCTION and OVERVIEW
related to the IoT. We’ve reached the tipping point where the Internet of Things is becoming commonplace where our ability to leverage device and machine data is readily accessible. Analytics capabilities are finally robust enough to be applied for direct value across many diverse applications. Achieving a higher level of integration between analytics systems and the many remote monitoring and data integration platforms now entering the market can help bring these insights within reach.
Data modeling, management and analytics can characterized along several dimensions with the dominant attributes being data volume and velocity. Data management and analytics, particularly in a sensor, equipment
traditional analytics tools, architectures and techniques don’t handle well. This is especially true if you want to integrate sensor data with historical structured data.
Impacts that sensors, IT systems and existing data sets have across different vertical markets varies widely. While all domains will have to overcome barriers to capture value from the use of data from sensors, devices and machines, barriers are structurally higher for some segments than for others. Domains such as retail may have relatively lower barriers to overcome versus many segments within industrial that have greater challenges.
There are opportunities for combiningand analyzing datasets across most domains
Figure 2: Analytics Applications Drive Diverse Opportunities
Semi-Structured
Real
-Tim
e
Structured Un-Structured
Data Types
Velo
city
Ba
tch
Credit and Market Risk in Financial Services
Fraud Protection and Crime Prevention In Financial Services
Event-Based Marketing In Financial Services and Telco Services
Product Placement Potential In Retail and Commercial Services
Transaction & Interaction Comparison On Product Roll Out In Retail
Preventative Maintenance In Industrial
Event-based Disease Spread Analysis In Healthcare
Measuring Sales Office Interactions With Customers
Event-based Disease Spread Analysis In Healthcare
Video Surveillance Analysis Across Several Domains
Demand Modeling for Smart Grid Apps
Social Network Analysis Across Several Domains
MACHINE DATA ENABLES DIVERSE APPLICATIONS AND OPPORTUNITIES
Source: Harbor Research

7
ThingWorxGlassbeam INTRODUCTION and OVERVIEW
These four main elements are as follows:
1. Data Aggregation and Storage: Data is aggregated, normalized and processed for real-time or long-term access. Systems often require significant historian capabilities to store large amounts of data and traceability capabilities; this element also includes hardware infrastructure required for storage functions;
2. Data Integration: Transformation, and integration of the collected data sets in a manner that organizes and normalizes the data sets for analysis; data management and data quality are included within this element;
3. Analytics Tools: Processing of the data by an analytics engine and the
and machine application environments, can become a very complex process, especially when large volumes of data come from multiple diverse sources. These data need to be aggregated and correlated in order to leverage the information values inherent in these systems and their data.
The Smart Systems and Internet of Things (IoT) data management and analytics opportunity consists of four basic technology elements: data aggregation and storage, data integration, analytics tools, and data presentation. In addition, they are often supported by various professional services; most prominantly data scientists.
Machine Data Analytics Elements and Segments
Figure 3: Data Types Across Analytics Opportunities
DIVERSE DATA TYPES WILL BE INTEGRATED INTO NEW APPLICATIONS
Source: Harbor Research
Resources/Infrastructure
Energy
Industrial
Wholesale & Supply Chain Goo
ds
Serv
ices
Text & Numbers Video/Image Audio
High Medium Low Key
IT & Network Services
Mobility/Transportation
Buildings/Property Services
Retail/Commercial Services
Financial Services
Healthcare
Security/Emergency
Government & Public Services
Machine/ Time Series

8
ThingWorxGlassbeam INTRODUCTION and OVERVIEW
route the anomaly and alternative courses of action to the right person to make a decision. The basic function of rules engines and work flow will stay constant — seismic leaps will be necessary in the data flow and analytical inputs in a world of vastly expanded real-time data and awareness.
The conversion of process applications to service-oriented architectures will allow these process apps to be adapted to business scenarios, with specific components pushed down to intelligent devices where they can execute a specified action. The Internet’s most profound potential lies in the integration of people, information systems AND smart machines. In a connected world of smart systems, not only people but all electronic and electro-mechanical products and machines will produce mountains of valuable information, all the time.
subsequent delivery of insights; all three forms of analysis (reactive and descriptive as well as predictive and prescriptive) are included;
4. Data Presentation: Presentation of the delivered analytical insights to the user in the form of visualizations, dashboards or reports.
“Real-time awareness” is driving vigorous interest in and deployment of analytic tools. Analyzing and storing the massive amounts of data that will be received is only possible with extensible and adaptable systems. Rules engines and work flow are the existing technologies for deciding which alternative courses to pursue, either automatically through the application of a rule that says “if this happens, do this,” or through human review based on work flow engines that
Simulation Rick Assessment Collaboration Planning Profitability Problem ID Scenarios and Predictions
Semi-Structured
Real
-Tim
e
Structured Un-Structured
Data Types
Velo
city
Ba
tch
Discovery/Ad-Hoc Analysis Operational metrics Root Cause Analysis Risk Management
Rule-Based Automation Patterns, Signatures and Exception ID Guided Navigation Real-time Monitoring & Event Analysis
Strategic
Operational
Event-Driven
Figure 4: Data Analytics Usage Types
DATA ATTRIBUTES
Volume: The quantity of data that is generated is very important; the volume of data determines the value and potential of the data under consideration.
Variety: Its important to segment and understand differing data types (i.e. structured, semi-structured and unstructured data) the volume and so-called velocity (i.e. is the data being processed in a “batch” or in real-time).
Velocity: The term ‘velocity’ in the context refers to the speed of generation of data and how fast the data needs to be processed to meet the demands or drive benefits.
Variability: This is a factor which can be a problem for those who analyse the data. This refers to the inconsistency which can be shown by the data at times which can hamper the interpretation of the data sets.
Veracity: The quality of the data being captured can vary greatly. Accuracy of analysis depends on the veracity of the source data.
HUGE BUSINESS and OPERATIONAL IMPACTS
Source: Harbor Research

9
ThingWorxGlassbeam INTRODUCTION and OVERVIEW
machines, equipment or infrastructure and the analysis of its operational (e.g., speeds, feeds, vibration, conditions, etc.) metrics in order to predict that a breakdown is likely to occur or that a certain type of support os required. The condition-based method can be complemented by circumstantial data (e.g., ambient states, operator metrics, etc.) to make the analysis more timely or accurate. Historically, maintenance has been a very ad-hoc function and labor-intensive activity, automating or optimizing has been difficult but has the potential for substantial cost savings.
Product Design and Development: As an analytics use case, product development aims at assessing the connected product’s quality and behavior, and then flagging
The primary use cases within machine data and analytics fall into a focused group of six categories, including:
Product Support Services: Enable the equipment vendor to deliver detailed and proactive information and services that are tailored to the unique needs of individual customers. Move beyond simply providing the minimum service required to attain customer satisfaction and utilizing analytics to create lasting and binding relations with customers.
Predictive Maintenance: Predictive maintenance refers to the enablement of sensors and remote monitoring of
Machine Data Use Cases
Opportunistic / evitciderP lanoitidnoC
Recurring (Preventative)
/ evitcaeRCorrective
ylsuounitnoCOn-going
Passive Predictive
Unpredictable events
Typically reactive and corrective
Associated w/ maintenance workflows
Efficiently address issues
Initiated by seemingly random events
Self-triggered
Additional work during unrelated activity
Capture and store information
Triggering events occur when inputs hit predetermined benchmarks
Tracking, analyzing, and storing event-based data
Based on predetermined recurring events (e.g. every 1000 hours, weekly)
Delay may exist between event and recognition
Typically tracking, analyzing, and storing data in real-time
No delay between triggering event and recognition
Notify relevant parties for additional action
Check for anomalies and track trends
Tracking, benchmarking, and notifications
Definition
Flexibility Accessibility Configurability Reliability Accuracy scitylanA
Value
yramirP tcudorP
Purpose
Proactive
Figure 5: Machine Data Analytics Use Cases - Moving From Passive to Predictive
MACHINE DATA INFORMS MANY USE CASES
Source: Harbor Research

10
ThingWorxGlassbeam INTRODUCTION and OVERVIEW
Systems and Context Awareness: Equipment and machines become more integrated with related data within the environment that the machine is being used and adjusts it bahavior based on these data. Systems awareness within the context in use is what will drive autonomous machines in factories, in the air and otherwise. Similarly, a connected lighting system can adjust its timer settings or lighting levels in response to whomever is in the room or in anticipation of required lighting levels based on weather or other data analysis.
The ability to detect patterns from large scale sensor and machine data aggregation is the holy grail of smart systems. Machine data analytics, often thought of as part of the evolving “big data” story, allows not only data patterns but a much higher order of intelligence to emerge from large collections of machine and device data.
features and functions for assessment. For instance, a machine manufacturer could study the usage patterns of a model in use in the field to determine better ways to improve maintenance.
Usage Analysis: Usage behavior tracking (or usage incentivization) refers to cases in which usage or consumption of a product or service are tracked and analyzed by taking advantage of connectivity and analysis of device data. Analysis of water consumption could be enabled to reveal waste and poor usage awareness on the part of consumers. This could be analysis and information integrated into customers’ bills as a means of communicating the need to preserve scarce resources. Similarly, automobile insurance carriers are instituting behavior and usage-based insurance schemes based on incentivizing better driving habits.
Operational Analysis: In operational analysis, the organization employing IoT analytics applies the data assets to monitor and optimize its internal operations. Notably, many of the applications in the transport and logistics segment can be best characterized as a form of operational analysis. For instance, a logistics group can analyze its delivery fleet to optimize routes and provide more accurate estimates on delivery times. Similarly, a retailer running connected vending machines can spot the bottlenecks and quiet zones within its network, and thereby optimize the machine sites.
MACHINE DATA IMPACTS » Connected devices on the
planet have surpassed the number of people - 7+ billion.
» A single large oil refinery produces more data in a day than both the New York Stock Exchange and AMEX combined.
» In a 200 turbine wind farm, each turbine has 50 sensors with 100 data points collected every 40 milliseconds, producing over 6,000 data points every second.
» Estimates of data produced by Smart Grid apps could reach 35 and 1000 petabytes/year.
» With 500,000 data centers in the world suffering an average of 2.5 outages/year with an average duration 134 minutes, translates to 2.84 million hours of annual downtime, at an estimated cost of $300,000/hour of downtime & $426B a year in losses.
THE ABILITY TO DETECT PATTERNS FROM MACHINE DATA AGGREGATION IS THE HOLY GRAIL OF SMART SYSTEMS

11
ThingWorxGlassbeam TRENDS, FORCES and FORECAST
To date, remote services and M2M systems have largely been focused on simple remote diagnostics and simple tracking/location services – in large part because of technical complexities and business model challenges (see Figure 6).
Existing technology has proven cumbersome and costly to apply with many conflicting protocols and incomplete component-based
solutions. The challenges of developing analytics applications and integrating diverse device data sources have been big adoption hurdles. The inability of today’s popular enterprise IT systems to interoperate with distributed heterogeneous device environments is an obstacle that we are finally overcoming.
Return from simple applications, while extremely valuable, is limited to the manufacturer’s service delivery efficiency. Contrary to what current market offerings depict, however, the value of connectivity
From Simple & Reactive To Compound & Predictive
Figure 6: Simple, Compound, Complex Applications For Smart Systems
Compound Applications and Analytics
Applications that involve multiple collaborating [peer-peer] devices or significant interactions between and among devices, systems and people.
• Multi-Party Equipment Support • Energy Demand Response • Maintenance Support & Collaboration
Energy Demand
Response
IT & Process Automation Integration
Connections
Time
Compound
• Integrated Automation & Condition Monitoring
• Asset Management Systems • Managed Security Services
Complex
• Predictive, Intelligent Systems • Crowd-Sourced Content for
Machine Troubleshooting • Brokerage / Auction for Spare
Parts or Sub-Contractors
Simple
• Equipment Monitoring • Maintenance Dispatch • Alerts &Alarms
Simple Applications and Data Usage
Applications tend to be remote support-driven applications that involve monitoring/upgrades of installed base of machines in the field – such as motors, instruments, machines, etc.
• Tracking • Product Support • Diagnostics / Monitoring
Equipment Monitoring
Field Force Dispatch Sensor Data
Fusion / Integration Collaboration
& Analytics
Complex Applications and Optimization
Applications that drive interactions between and among devices, systems and people and enable diverse collaboration and big data analytics
• Multi-Vendor Brokered Services • Integrated Real Time Pricing for Electricity • Multi-vendor Maintenance Collaboration
Value of Complex Machine Data Management and Analytics Rises Exponentially
MARKET NEEDS TO REACH FOR COMPOUND DATA VALUES
Source: Harbor Research

12
ThingWorxGlassbeam TRENDS, FORCES and FORECAST
does not have to end with just simple applications focused on a single class of device or machine.
As technologies mature and open standards become the norm, applications based on deeper, peer-to-peer interactions between devices, systems and people will drive more compound and dynamic value streams. This opens up new collaborative business model opportunities that have the potential to drive much greater value for the customer.
These new B2B business model opportunities are much closer in many respects to the consumer-driven models of an Apple or Google, which can provide many lessons for the “cloistered” equipment manufacturers in B2B arenas. The business benefits of large scale open collaboration in the B2B arena are just beginning to be recognized.
Moving from “Simple” to “Compound” applications involves multiple collaborating systems with significant interactions between and among devices, systems and people. No longer is the focus solely on the product supplier’s ability to deliver support for their product efficiently. Rather, value is brought to the customer through business process automation and optimization.
Consider any of the larger diversified industrial players that sell complex machines like GE or Siemens. In the power turbine business, for instance, major electric utility customers have good reason to hate equipment failures. At the least, any downtime creates huge opportunity costs for
these customers; often it means they have to pay hefty regulatory compliance fines.
To reduce that risk, players like GE and Siemens have invested heavily in monitoring and diagnostics so they can deploy a technician or engineer ahead of a failure (preemptively) as opposed to doing so according to a schedule based upon assumptions (proactively) or, even worse, after the power has gone off (reactively). For one thing, this has a dramatic effect on the profitability of these players maintenance services. Most manufacturers cannot charge more than $100 to $130 per hour for their technical support because of price and benefit pressures from local competitors. But because of efficient network-enabled services, leading players can charge $500 to $600 per hour for the same technician who has become a subject matter expert.
But, in the end, these are still examples of simple applications largely focused on the product manufacturer’s own value chain. They are simple “hub and spoke” remote support. While there is value in these models, there are significant untapped opportunities for providing new value for the users and customers.
Instead, Smart System’s true potential lies in the integration of diverse machines, information systems and people—its ability to connect billions upon billions of smart sensors, devices, and ordinary products into a “digital nervous system” that will smoothly interact with individuals and the physical world. The nature of compound and complex
WE EXPECT DEEPER, PEER-TO-PEER INTERACTIONS BETWEEN DEVICES, SYSTEMS AND PEOPLE

13
ThingWorxGlassbeam TRENDS, FORCES and FORECAST
systems applications is just beginning to be understood where the information value generated by these capabilities positions players to take on significant additional tasks for the customer in the future, such as:
» Managing and automating a customer’s spare parts inventory and service delivery chain for maintenance processes providing vastly improved levels of service and responsiveness;
» Providing the customer’s first line support staff, the machine builders’ service technicians and other third party support personnel with complete access to a unified machine maintenance record that captures all of the machine’s performance data, history and knowledge about the status of the equipment, enabling faster and more effective maintenance processes;
» Analyzing the history of the equipment in use against diverse data sources such as weather patterns and peak usage requirements to optimize its performance;
» Providing entirely new services to the customer, such as “security as a service,” where security and privacy for all devices, machines, networks and data is provided as a managed service enabled by network and analytics tools.
Customers are looking to equipment manufacturers not just for high-quality equipment, but also for help in optimizing their ability to supply consistent and
high-quality products and services to their customers. This evolution will allow manufacturers to tie their revenue and pricing models directly to the benefits they provide.
Taken one step further, applications that drive interactions between and among devices, sub-systems and people across enterprise and public sector systems will potentially allow extending and expanding values from third party collaboration and large scale data integration and analytics that, while complex, will drive the value from smart systems.
If up till now most of the discussions concerning machine data analytics and customer support automation have focused almost exclusively on simple monitored values such as alarms. New capabilities enabled by data management, modeling and analytics tools are the answer to unlocking the value of data from machine monitoring. So where are we in this evolution towards more machine data and analytics value? Here are some current trends that provide perspective on this:
Platform Players Are Expanding Into Analytics: Since most of the real value of smart connected systems is generated from data and analytics, players offering integration platforms are adding data and analytics capabilities. We expect this trend to continue for some time into the future.
Marketplace Trends and Forces
WHAT ARE THE CRITICAL MARKET FORCES

14
ThingWorxGlassbeam TRENDS, FORCES and FORECAST
Monitoring and Reactive Analytics Are Still Dominant: As described above, most users are still pursuing relatively simple applications of analytics tools. Users developing IoT analytics, or experimenting with new modeling, data management or visualization tools have, for the most part, not been able to deploy newer predictive capabilities. We believe this will require better end-to-end solutions from suppliers, increased understanding of how to analyze machine data and new organizational skills.
Predictive Analytics Requires New Tools: Since most of today’s business intelligence systems have provided only a retrospective view of operations, systems to analyze real-time complex events are still fairly emergent in nature and use. To perform equipment and systems monitoring and to support more state-based and real-time decision-agility, machine data analytics systems will need to become much more responsive. This generally means these tools will need to be embedded into machines and business processes to reduce the latency of analysis. We expect data and analytics tools to become better suited for state-based and complex real-time event processing over the next twelve months, as technologies that filter and process data at the network edge before ingesting it into the analytic back-end improve. This is critical, given the volume and velocity of time-series sensor data.
Big Data Warehouses Alone Will Not Work in Smart Systems and IoT: Historically, to gain meaning from operational data meant
building dedicated data warehouses and analytics applications is a major undertaking. A typical project might involve several months of effort and expensive infrastructure and software licenses. Data warehouses, lakes, etc. alone do not address a significant scope of IoT analytics needs. However, in most cases repositories may be needed as part of a wider architecture that addresses both real-time and long-term storage aspects.
Analytic Programming Languages and Standards Are Not Stabile: There is little to no evidence of any kind of standards for programming languages emerging for machine and device analytics. Players are continuing to utilize a wide variety of approaches from R to Spark, Storm or Python, as well as C++ and/or Java.
OT and IT Integration - Noise and Confusion: Within industrial and mission critical applications, so-called “convergence” between operational technology (OT) with IT is rapidly becoming a collection confused messages in the market. The convergence is, in essence, about virtualizing previously siloed OT systems (e.g., SCADA, PLC) and exposing data from them to new data management and analytic tools. Many players underestimate the life cycles of operational device, machine and equipment deployments and the integration challenges they pose for any retrofit programs. There are still many cultural obstacles in play.
PLAYERS and TOOLS WILL RAPIDLY MATURE NOW

15
ThingWorxGlassbeam TRENDS, FORCES and FORECAST
Smart Systems and IoT Analytics Is Enabled By New Players: During the last year or so, it has become evident that the large existing big data and BI players are not the defacto leaders in Smart Systems and IoT analytics. While the “traditional,” players may have a head start they are just not accustomed to the physical sensor and machine-based applications with the IoT arena. A growing number of relatively young companies are introducing products that have been purposely designed for IoT analytics.
Machine analytics applications are getting adopted in many sectors of the economy across diverse applications. Based on the research and consulting work we have
conducted in the marketplace, the primary applications for data management can be grouped into business analytics, operational analytics and “state-based” or real-time event-driven analytics. Further, use cases can be generalized into five distinct categories:
» Asset Management/Maintenance
» Customer [after-market] Support
» Behavior, Tracking and Usage
» Product Design and Realization
» Operations and Supply Chain
While many look to a future where it will become easier to enable predictive analytics few players in the market today really offer these types of capabilities.
“Real-time awareness” and complex event-based systems are driving vigorous interest in
Dimensioning The Opportunity
2015 2020
$34bn
$155bn
MachineAnalytics
$25bn
MachineAnalytics
$4.4bn
HOW LARGE IS THEMACHINE DATA OPPORTUNITY?
. HOW MUCH DATA INTENSITY?
IT Services
Industrial
Resources & Energy
Healthcare
Transportation
Ranking Of DataVolume Intensity
** TB per $ Million Annual Revenue
.08
.15
.29
.65
.72
Figure 7: Market for Machine Data Analytics and Visualization 2015-2020
HOW LARGE IS THE MARKET OPPORTUNITY?
Source: Harbor ResearchMachine Data As A Percentage of IoT Connectivity,
Integration and App Development

16
ThingWorxGlassbeam TRENDS, FORCES and FORECAST
and deployment of analytic tools. Analyzing and storing the massive amounts of data that will be received is only possible with extensible and adaptable systems organized in easy-to-use end-to-end solutions.
We expect to see a significant wave of growth in data integration, management, modeling and analytics between now and 2020. Harbor Research estimates that the market for machine monitoring and analytics is $4.5B today and is expected to grow to over $25B in 2020 at just under 30% CAGR.
As the tools and capabilities get better organized in the marketplace, we fully expect the growth and scale of the opportunity to significantly expand across diverse domains and applications.
The traditional approaches to data discovery and systems intelligence have three failings: 1) they can’t provide a holistic view of diverse data types; 2) the types of intelligence tools available to users are, at best, arcane and typically limited in use to “specialists;” and, 3) most analytics today are still developed in a “batched” warehouse not in real time.
Machine builders and users need new tools to liberate the intelligence in the world of connected things. Tools need to be able to conduct a search or query that acts on unstructured, transactional and real time
data simultaneously. This would allow users to determine where deeper analytics or the creation of an ad hoc business process can add value.
Given the immature state of today’s real-world systems, most people have trouble grasping the power and importance these capabilities enable. The ability to detect patterns in data is the holy grail of Smart Systems and IoT because it allows not only patterns but a whole higher order of intelligence to emerge from large collections of ordinary data. The implications are obviously immense.
The world needs an entirely new approach that avoids the confinements and limitations of the today’s differing data types and tools. That allows data to maintain their fundamental identity while bonding freely with other data. Facilitating discovery, based on data and information accessibility and cumulative systems intelligence.
The migration of traditional enterprise and process applications to cloud computing architectures will allow these apps to be adapted to business scenarios, with specific components pushed down to intelligent devices where they can execute a specified action. Big Data and new business intelligence tools will drive enormous productivity and efficiency gains.
A networked machine generates information value over its entire lifespan. Product manufacturers can know where the device is located, when it was installed, critical
Machine Data Analytics Requires New Tools
TRADITIONAL APPROACHES WILL NOT WORK FOR MACHINE DATA
17
ThingWorxGlassbeam TRENDS, FORCES and FORECAST
specifications, diagnostics, availability of spare parts, usage patterns, support status and so on.
Traditional customer relationship and product support programs yield only intermittent, uneven and incomplete windows into how customers interact with a product. Once a product is shipped to a customer, the manufacturer loses sight of who buys it, how it is configured, what its use is and what the customer experiences with it. When products become networked and support is automated, the environment in which they are utilized becomes more “aware” and responsive.
Eventually, this environment helps customers optimize their processes, save money, and become significantly more efficient.
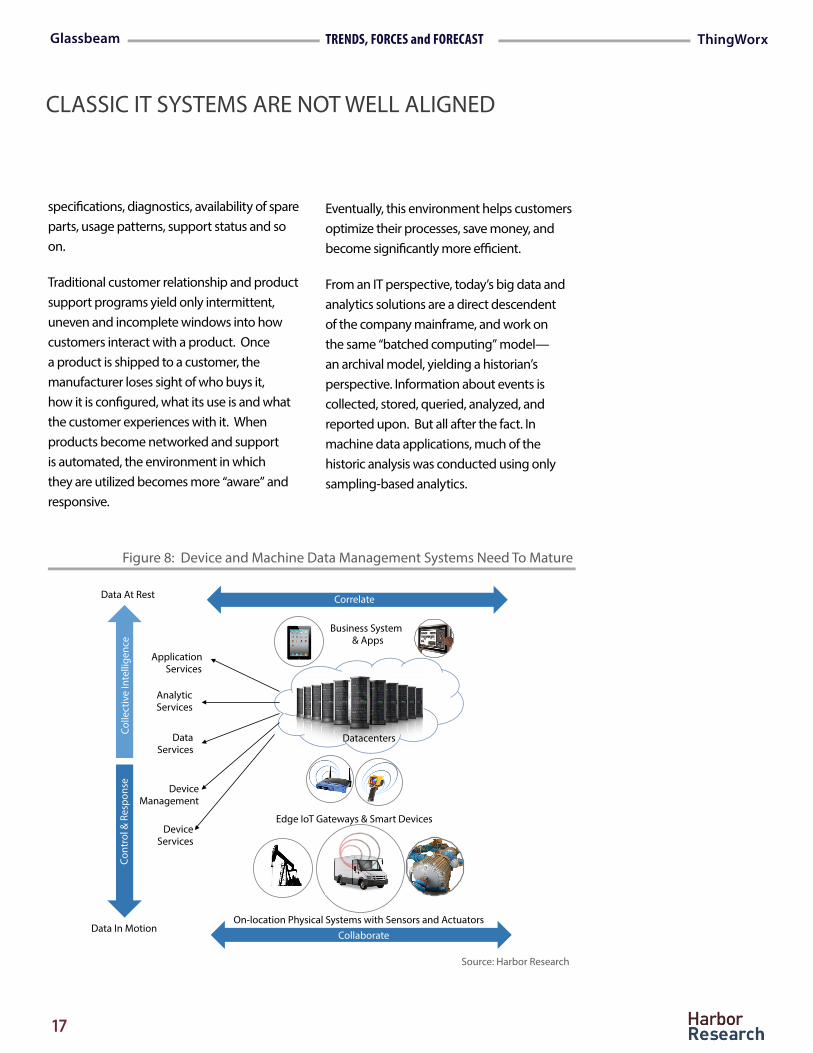
From an IT perspective, today’s big data and analytics solutions are a direct descendent of the company mainframe, and work on the same “batched computing” model—an archival model, yielding a historian’s perspective. Information about events is collected, stored, queried, analyzed, and reported upon. But all after the fact. In machine data applications, much of the historic analysis was conducted using only sampling-based analytics.
Edge IoT Gateways & Smart Devices
Business System & Apps
Datacenters
Data At Rest
Data In Motion
Colle
ctiv
e In
telli
genc
e Co
ntro
l & R
espo
nse
On-location Physical Systems with Sensors and Actuators Collaborate
Device Management
Data Services
Analytic Services
Application Services
Device Services
Correlate
Figure 8: Device and Machine Data Management Systems Need To Mature
CLASSIC IT SYSTEMS ARE NOT WELL ALIGNED
Source: Harbor Research

18
ThingWorxGlassbeam TRENDS, FORCES and FORECAST
That’s a very different thing from feeding the real-time inputs of billions of tiny “state machines” into systems that continually compare machine-state to sets of rules and then do something on that basis.
With today’s big data tools analysis can now essentially be conducted on “all the data” that can be collected. However, in the machine world, unlike say the consumer retail or financial services arena, the analysis has to be real [or near] time and state-based. In short, for machine data to mean anything in business, the prevailing corporate IT model
• Google • Microsoft Azure
New and Existing M2M and Smart Service Providers
Interoperability Required
Device Management Services
Data Services
Analytic Services
App & Business Integration Services
IoT Gateway Smart
Devices
Sensing Connectivity Access & Control Authenticity Confidentiality Integrity
Data quality processing Cleansing Filtering De-duplication Syntax transformation Format normalization Data normalization Semantic transformation Semantics assignment Context injection Governance Ownership assignment Anonymization Protection
Descriptive Analytics Aggregation view Time series Simple correlation CPE Predictive analytics Machine learning Graph analytics Prescriptive analytics Machine learning Graph analytics
Operation support Monitor & Alert Preventive Maintenance Automation Inventory management Fleet tracking Online business support Product recommendation Business strategy support Business insight
Data From Sensors Data Transformed Information Analyzed Decisions-Intelligence
• Carriers • MVNO/MVNE
• Amazon EC2 • Heroku
of “batched” big data analytics model has to change. New tools need to be developed.
The next cycle of technology and systems development in the smart connected systems arena is supposed to be setting the stage for a multi-year wave of growth based on the convergence of innovations in software architectures; back-room data center operations; wireless and broadband communications; and new analytics tools.
Figure 9: Need To Better Organize Data Aggregation, Usage and Management
WE NEED BETTER OPTIMIZATION AND PREDICTIVE TOOLS
Source: Harbor Research
19
ThingWorxGlassbeam TRENDS, FORCES and FORECAST
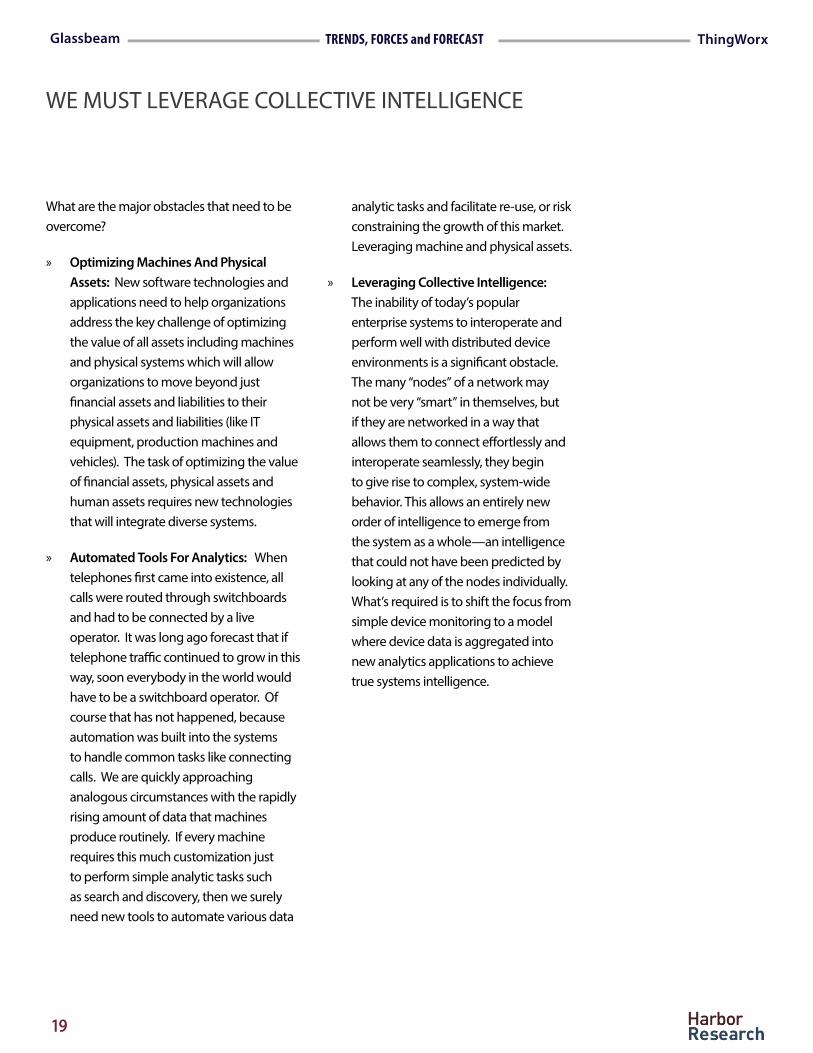
analytic tasks and facilitate re-use, or risk constraining the growth of this market. Leveraging machine and physical assets.
» Leveraging Collective Intelligence: The inability of today’s popular enterprise systems to interoperate and perform well with distributed device environments is a significant obstacle. The many “nodes” of a network may not be very “smart” in themselves, but if they are networked in a way that allows them to connect effortlessly and interoperate seamlessly, they begin to give rise to complex, system-wide behavior. This allows an entirely new order of intelligence to emerge from the system as a whole—an intelligence that could not have been predicted by looking at any of the nodes individually. What’s required is to shift the focus from simple device monitoring to a model where device data is aggregated into new analytics applications to achieve true systems intelligence.
What are the major obstacles that need to be overcome?
» Optimizing Machines And Physical Assets: New software technologies and applications need to help organizations address the key challenge of optimizing the value of all assets including machines and physical systems which will allow organizations to move beyond just financial assets and liabilities to their physical assets and liabilities (like IT equipment, production machines and vehicles). The task of optimizing the value of financial assets, physical assets and human assets requires new technologies that will integrate diverse systems.
» Automated Tools For Analytics: When telephones first came into existence, all calls were routed through switchboards and had to be connected by a live operator. It was long ago forecast that if telephone traffic continued to grow in this way, soon everybody in the world would have to be a switchboard operator. Of course that has not happened, because automation was built into the systems to handle common tasks like connecting calls. We are quickly approaching analogous circumstances with the rapidly rising amount of data that machines produce routinely. If every machine requires this much customization just to perform simple analytic tasks such as search and discovery, then we surely need new tools to automate various data
WE MUST LEVERAGE COLLECTIVE INTELLIGENCE

20
ThingWorxGlassbeam STRATEGIC DATA ALLIANCE
The fact that a rapidly expanding range of machines and devices have the capability to automatically transmit information about status, performance and usage and can interact with people and other systems anywhere in real time points to the increasing complexity of managing machines and systems. This only compounds when we consider the billions or more of networked devices that many observers are forecasting will be deployed.
The tools we are working with today to monitor and analyze “smart” machines on networks were not designed to handle the scope of data generated, the diversity of device data types and the massive volume of data-points and data sets generated from machine interactions.
These challenges are diluting the ability of organizations to efficiently and effectively manage machines and systems. The fragmented nature of analytics software offerings available today make it extremely difficult, if not impossible, to manage systems.
What is needed is a common means of deploying machine data analytics applications that can leverage tools across families of interrelated devices and diverse domains. What would this entail?
» Analytics tools and applications to address a broad range of machine data
MACHINE DATA WILL REQUIRE NEW TOOLS AND ALLIANCES
Creative Combinations For Machine Data Capabilities
types that move beyond just searching and indexing functions. Increasingly, customers will need a single, unified end-to-end framework to search, explore, analyze and predict machine and systems behaviors that can operate across diverse data environments and under widely differing usage scenarios;
» Analytic tools and applications that allow business and operations personnel - not IT specialists - to quickly build their own machine data analytics capabilities and applications with business and operations value. Users need to be able to quickly develop new applications for analytics that are easy to develop, use and collaborate with.
We are reaching a critical juncture in market development where organizations will soon be crying out for a completely new approach - one that moves beyond “first-level” search and indexing tools built for systems administrators to a new generation of tools that put the power of machine data analytics into the hands of operations and business users where the effort invested to develop new machine data applications can be quickly and easily be utilized again and again across an ever broader spectrum of machines and domains.
Customers expect evolving software tools to be functional, ubiquitous, and easy-to-use. Within this construct, however, the first two expectations run counter to the third. In order to achieve all three, a new approach is required -- but what kind of approach?

21
ThingWorxGlassbeam STRATEGIC DATA ALLIANCE
value. Technology advancements need to engender new system values and new analytics capabilities. The main objective of next generation computing and business intelligence technology is to be adaptive to change.
Smart Systems and IoT analytics will be enabled by a new generation of players. There have been signs of this beginning to emerge over the last two years. Today it has become evident that the large BI incumbents are not in the driving seat in this market, despite their recent dominance. A growing number of relatively young companies are introducing products that have been purposely designed for IoT data integrations and analytics. For providers of core device integration and management platforms for the Internet of Things, developing partnerships to extend the platform’s reach beyond simple monitoring to machine data analytics capabilities is a prime example of an opportunity to gain share and really differentiate.
The convergence of device data collection, aggregation and analytics will drive big opportunities. However, partner and alliance innovation in the IoT platform business will need to extend beyond just simple ideas about new function and service extensions. To successfully develop this market, core platform providers will need to think and act
The bit, the byte, and later the packet made possible the entire enterprise of digital computing and global networking. Until the world agreed upon these basic concepts, it was not possible to move forward. The next great step in IT—completely fluid information and fully interoperating devices, people and systems—requires an equally simple, flexible, and universal abstraction that will make information itself truly portable in both physical and information space, and among any conceivable information devices.
Operational and real-time intelligence requires the use multiple data sources including time series, structured as well as semi- and unstructured data sources as well as the ability to fuse them easily. Schema-free relationships between heterogenous datasets are no longer manageable by a traditional relational database approaches - new tools are required:
» Tools need to be organized around the user’s experience to interactively discover hidden relationships, trends and patterns and to create new information and relate it with external data sources; and,
» Real-time visibility of what is happening now - analytics must be used in the complex event streams of real time business operations.
As lower cost, easier to apply technologies continue to move into the market new operations intelligence models and machine data analytics are required to deliver their
New Players and Relationships Are Needed
CUSTOMERS EXPECT EVOLVING SOFTWARE TOOLS TO BE FUNCTIONAL, UBIQUITOUS, AND EASY-TO-USE

22
ThingWorxGlassbeam STRATEGIC DATA ALLIANCE
differently. A renewed focus on developing alliances and ecosystems around machine data analytics and the critical relationships that will drive value for OEMs and end customers are keys to success.
Given all of the aspects that must be addressed to provide a full end-to-end data management and analytics solution, alliances between platform suppliers and a new breed of IoT analytics solution partners represent the best available means to address these market development challenges.
GLASSBEAM THINGWORX ARE CREATING A TRUE END-TO-END SOLUTION
Strategic Platform and Data Analytics Partnerships
Glassbeam and ThingWorx are at the forefront of alliance development with complex machine data managent and analytics solutions - the two companies are pioneering the convergence of application development tools and complex machine data analytics. By partnering with ThingWorx, Glassbeam can leverage the significant new capabilities informed by IoT integration and application development platforms and avoid the significant challenges of trying to offer these capabilities on their own.
The Glassbeam and ThingWorx partnership will significantly expand direct applied customer value with complex machine data analytics capabilities enabling:
Figure 10: Creative Combinations of Capabilties Drives New Values
World Class M2M, Data modeling, Rapid App Development Platform for IoT market
Machine Data Analytics
Proven Big Data Analytics Powered By Complex Rules Engine And Machine
Learning For IoT Market
Customer Benefits and Values • Higher value, more differentiated
services and higher service levels;
• Develop and capture new annuity revenue streams;
• Reduce a vendor’s own product support and customer support costs;
• Utilize customer configuration, usage and problem data to design better, more highly targeted products and systems for their customers;
• Tailor marketing campaigns and sales efforts around highly customized value propositions.

ThingWorxGlassbeam MARKET DEVELOPMENT
23
» Higher value, differentiated services;
» Develop and capture new revenue streams;
» Reduce a vendor’s own product support and customer support costs;
» Utilize customer configuration, usage and problem data to design better, more highly targeted products and systems for their customers;
» Tailor marketing campaigns and sales efforts around highly customized value propositions.
The trend to expand the field of IoT analytics beyond historical BI and data warehousing is now in force. Traditional BI applications predominantly have used historic data from large repositories. These applications are constrained by the limited service-level capabilities of static data. The latency in-herent to static data implies that there is no real-time connection between the data and its operational sources. The goal of the tran-sition to real-time, state-based analytics is to reduce latency. IoT and machine data an-alytics extends the definition of BI beyond the traditional data warehouse and query tools to include complex event streams and
WHAT NEEDS MUST BE MET FOR THE MARKET TO DEVELOP QUICKLY
processing. The challenge is to turn re-al-time data into actionable information to enhance operational decision-making.
As new data management and analytics tools become a part of operational deci-sion-making, IoT intelligence must also embrace closed-loop performance man-agement. New applications will emerge by embedding analytics in business processes. What is needed is real-time visibility of per-formance (“what is happening now ? “). Busi-ness metrics enable operational business intelligence. A zero-latency environment is created that offers closed-loop processing by rules that feedback the outputs of tools into front-line operational processes, either on-demand or event-driven.
A new generation of data management and analytics tools must incorporate real-time data from event streams and automated decisions built into processes. Complex event processing is in line with the revival of decision-centric business intelligence which means providing information to a wider audience of business users. Real-time reporting and alerts are a means for busi-ness activity monitoring. For example, per-formance metrics empower employees to track business metrics against organization-al goals. This enables corrective actions and faster reaction to business events, and thus the optimization of a variety of business activities (e.g. call center operations, supply chain tracing and tracking, fraud detection, claims processing, inventory management).
The Coming Machine Data Glut Challenge

ThingWorxGlassbeam MARKET DEVELOPMENT
24
Real-time information is displayed and de-ployed as a service.
In today’s rapidly changing business en-vironment, organizational agility not only depends on monitoring how the business is performing but also on the prediction of future outcomes which is critical for a sus-tainable competitive position.
Predictive analytics is aimed to shorten the distance between data and insights on the one hand and to close the gap between insights and action on the other hand. Therefore, predictive analytics implies the use of advanced techniques to extract insights from data (shorten “the knowledge gap”), with the main purpose to direct de-cisions (shorten “the execution gap”). From an analytical viewpoint, predictive modeling refers to the use of techniques to capture historical and real-time data to make pre-dictions about future events. Predictions rarely take the form of absolute statements and are expressed as the probability of an event or behavior to take place (or not) in the future. The analytic approaches used for “identifying valid, novel, potentially useful and ultimately understandable patterns in data” rely on data mining techniques. These techniques are based on traditional statis-tical analysis (e.g. regression analysis) and tools associated with artificial intelligence (e.g. neural networks).
We refer to predictive analytics as analytics that goes beyond data mining to guide decisions in the workflow. Predictive models
become part of business processes. For example, a predictive model might be built into a supply chain process to monitor stock levels. Based on historical demand patterns and real-time analysis of RFID data, pre-dictions can be made of product demand and replenishment rules can be applied to optimize inventories. In operational set-tings (e.g. call centers) real-time predictive analytics can identify clients at risk and guide agents automatically to the next best action. The insurance and bank sectors use predictive models to detect fraud and assist in risk management (e.g. credit scoring). Telecommunication and service providers apply the results of churn analysis in op-erational decision-making to assess which customers are likely to remain as subscrib-ers and which ones are likely to switch to a competitor.
For many use cases, that level of latency does not make a big difference in compar-ison to true real time; achieving near-real-time analyses is a big step forward. The situation is likely to advance fast over the next 12 months, as technologies that filter and process data at the network edge be-fore ingesting it into the analytic back-end improve. This is critical, given the volume and velocity of time-series sensor data, which characterizes IoT analytics.
Beyond new data management and refer-ence architecture, providing a capability to distribute algoritmns or system manage-ment and customer support software tools
“INVISIBLE” MACHINE INTELLIGENCE APPLICATIONS WILL BE MUCH MORE IMPORTANT TO CUSTOMER SUPPORT

ThingWorxGlassbeam MARKET DEVELOPMENT
25
will be a new opportunity -- autonomous software programs which observe and act upon device, equipment and systems behavior.
In the long run, “invisible” machine intel-ligence applications will be much more important to customer support than traditional “break-fix” and intrusive services that require human attention to deliver full value. Analytics are the beginning of a new generation of smart systems technology that will provide customers with elegant and unobtrusive—sometimes even invis-ible—portals into networked customer support services.
Systems and equipment intelligence that uses seamless computing and communica-tions to provide real-time information about critical assets and systems is paramount. The market requires an architecture and platform to drive the practice of continually monitoring system performance versus specified parameters, to ensure optimum
NEW PLATFORM TECHNOLOGY PLUS MACHINE ANALYTICS ENABLES THE ABILITY OF SYSTEMS TO AUTOMATICALLY
operating efficiency. This approach identi-fies operating anomalies allowing prompt correction thereby ensuring optimal use of energy, assets and people. New platform technology plus machine analytics enables the ability of systems to automatically learn from history; learning to detect hard-to-dis-cern patterns from installed equipment data that supports the development of algo-rithms that automates equipment repair and support.