The Internet Motion Sensor: A Distributed Blackhole...
13
The Internet Motion Sensor: A Distributed Blackhole Monitoring System Michael Bailey, * Evan Cooke, * Farnam Jahanian, *† Jose Nazario, † David Watson * * Electrical Engineering and Computer Science Department University of Michigan {mibailey, emcooke, farnam, dwatson}@umich.edu † Arbor Networks [email protected] Abstract As national infrastructure becomes intertwined with emerging global data networks, the stability and integrity of the two have become synonymous. This connection, while necessary, leaves network assets vulnerable to the rapidly moving threats of today’s Internet, including fast moving worms, distributed denial of service attacks, and routing exploits. This paper introduces the Internet Motion Sen- sor (IMS), a globally scoped Internet monitoring system whose goal is to measure, characterize, and track threats. The IMS architecture is based on three novel components. First, a Distributed Monitoring Infrastructure increases vis- ibility into global threats. Second, a Lightweight Active Responder provides enough interactivity that traffic on the same service can be differentiated independent of applica- tion semantics. Third, a Payload Signatures and Caching mechanism avoids recording duplicated payloads, reducing overhead and assisting in identifying new and unique pay- loads. We explore the architectural tradeoffs of this system in the context of a 3 year deployment across multiple dark address blocks ranging in size from /24s to a /8. These sen- sors represent a range of organizations and a diverse sam- ple of the routable IPv4 space including nine of all routable /8 address ranges. Data gathered from these deployments is used to demonstrate the ability of the IMS to capture and characterize several important Internet threats: the Blaster worm (August 2003), the Bagle backdoor scanning efforts (March 2004), and the SCO Denial of Service attacks (De- cember 2003). 1 Introduction As national infrastructure becomes intertwined with emerging global data networks, the stability and integrity of the two have become synonymous. This connection, while necessary, leaves network assets vulnerable to the rapidly moving threats of today’s Internet, including fast moving worms, distributed denial of service attacks, and routing ex- ploits. These threats share several key properties. First and foremost these threats are globally scoped, respecting no ge- ographic or topological boundaries. Complicating matters, they are sometimes zero-day threats, exploiting vulnerabil- ities for which no signature or patch has been developed, making detection and mitigation of these threats problem- atic. Third, these threats are evolutionary, with each worm or attack learning from previous failures, spawning an arms race between the network defenders and the attackers. Fi- nally, many of these threats are exceptionally virulent, prop- agating to the entire vulnerable population in the Internet in a matter of minutes, rendering human response impractical. Researchers are attempting to address these threats by in- vestigating new methods for monitoring and analysis. One promising method for investigating these threats is the monitoring of unused or dark address space [22, 11]. Because there are no legitimate hosts in an unused ad- dress block, traffic must be the result of misconfiguration, backscatter from spoofed source addresses, or scanning from worms and other probing. This pre-filtering provides an excellent method of studying Internet threats, however we believe there are two key design challenges that must be addressed when constructing a monitoring infrastructure based on this technique. The first issue is sensor coverage. Sensor coverage refers to the visibility of the system into Internet threats. One method to increase visibility is to monitor larger blocks of address space [13]. The problem is that the IPv4 space is limited and there are a small number of large unused ad- dress blocks available for instrumentation. In addition, it has been shown that address blocks in different networks see different threat traffic [7]. Thus, sensor size and topological
Transcript of The Internet Motion Sensor: A Distributed Blackhole...

The Internet Motion Sensor: A Distributed Blackhole Monitoring System
Michael Bailey,* Evan Cooke,* Farnam Jahanian,*† Jose Nazario,† David Watson*
* Electrical Engineering and Computer Science DepartmentUniversity of Michigan
{mibailey, emcooke, farnam, dwatson}@umich.edu
†Arbor [email protected]
Abstract
As national infrastructure becomes intertwined withemerging global data networks, the stability and integrity ofthe two have become synonymous. This connection, whilenecessary, leaves network assets vulnerable to the rapidlymoving threats of today’s Internet, including fast movingworms, distributed denial of service attacks, and routingexploits. This paper introduces the Internet Motion Sen-sor (IMS), a globally scoped Internet monitoring systemwhose goal is to measure, characterize, and track threats.The IMS architecture is based on three novel components.First, a Distributed Monitoring Infrastructureincreases vis-ibility into global threats. Second, aLightweight ActiveResponderprovides enough interactivity that traffic on thesame service can be differentiated independent of applica-tion semantics. Third, aPayload Signatures and Cachingmechanism avoids recording duplicated payloads, reducingoverhead and assisting in identifying new and unique pay-loads. We explore the architectural tradeoffs of this systemin the context of a 3 year deployment across multiple darkaddress blocks ranging in size from /24s to a /8. These sen-sors represent a range of organizations and a diverse sam-ple of the routable IPv4 space including nine of all routable/8 address ranges. Data gathered from these deploymentsis used to demonstrate the ability of the IMS to capture andcharacterize several important Internet threats: the Blasterworm (August 2003), the Bagle backdoor scanning efforts(March 2004), and the SCO Denial of Service attacks(De-cember 2003).
1 Introduction
As national infrastructure becomes intertwined withemerging global data networks, the stability and integrity of
the two have become synonymous. This connection, whilenecessary, leaves network assets vulnerable to the rapidlymoving threats of today’s Internet, including fast movingworms, distributed denial of service attacks, and routing ex-ploits. These threats share several key properties. First andforemost these threats are globally scoped, respecting no ge-ographic or topological boundaries. Complicating matters,they are sometimes zero-day threats, exploiting vulnerabil-ities for which no signature or patch has been developed,making detection and mitigation of these threats problem-atic. Third, these threats are evolutionary, with each wormor attack learning from previous failures, spawning an armsrace between the network defenders and the attackers. Fi-nally, many of these threats are exceptionally virulent, prop-agating to the entire vulnerable population in the Internet ina matter of minutes, rendering human response impractical.Researchers are attempting to address these threats by in-vestigating new methods for monitoring and analysis.
One promising method for investigating these threats isthe monitoring of unused or dark address space [22, 11].Because there are no legitimate hosts in an unused ad-dress block, traffic must be the result of misconfiguration,backscatter from spoofed source addresses, or scanningfrom worms and other probing. This pre-filtering providesan excellent method of studying Internet threats, howeverwe believe there are two key design challenges that mustbe addressed when constructing a monitoring infrastructurebased on this technique.
The first issue is sensor coverage. Sensor coverage refersto the visibility of the system into Internet threats. Onemethod to increase visibility is to monitor larger blocks ofaddress space [13]. The problem is that the IPv4 space islimited and there are a small number of large unused ad-dress blocks available for instrumentation. In addition, ithas been shown that address blocks in different networks seedifferent threat traffic [7]. Thus, sensor size and topological
location are important components of sensor coverage.The second issue is service emulation. If the sensors do
not directly involve live hosts then there is a question ofwhat services to emulate and at what level to emulate them.This is a difficult problem given the immense number ser-vices on the Internet today. An ideal system would repro-duce all current and future services with exactly the samebehavior as all possible end-hosts. Such a system is impos-sible, so there must a tradeoff.
The IMS is a distributed, globally scoped, Internet threatmonitoring system designed with these challenges in mind.The goal of the IMS is to measure, characterize, and tracka broad range of Internet threats. This means achievingthe maximum possible sensor coverage with enough fidelityto gather intelligence on specific services. The fundamen-tally distributed nature of this architecture allows the IMS tomonitor diverse addresses and topologies. In order get themost information possible given the scale of system, eachsensor passively collects all UDP and ICMP traffic and usesa lightweight responder to elicit the initial packet of eachTCP connection. This approach effectively emulates theestablishment of TCP transactions providing the maximumservice coverage without the need for maintenance-heavyservice emulation. This approach is used in conjunctionwith an innovative payload signature and caching technique.Observations have shown that many of the packets seen atthe sensors are duplicates, making this caching techniquehighly effective in managing the overhead of storing pay-loads.
The main contributions of this paper are:
• The design and implementation of a distributed,globally scoped, Internet threat monitoring system.The IMS architecture is based on three novel com-ponents. First, aDistributed Monitoring Infrastruc-ture increases visibility into global threats. Second, aLightweight Active Responderprovides enough inter-activity that traffic on the same service can be differ-entiated independent of application semantics. Third,a Payload Signatures and Cachingmechanism avoidsrecording duplicated payloads, reducing overhead andassisting in the identification of new payloads.
• The deployment and demonstration of the IMS onproduction networks. The current IMS deploymentconsists of 28 monitored blocks at 18 physical instal-lations. These deployments range in size from a /25 toa /8 and include major service providers, large enter-prises, academic networks, and broadband providers.These sensors represent a range of organizations anda diverse sample of routable IPv4 space. Data gath-ered from these deployments is used to demonstratethe ability of the IMS to capture and characterize sev-eral important Internet threats.
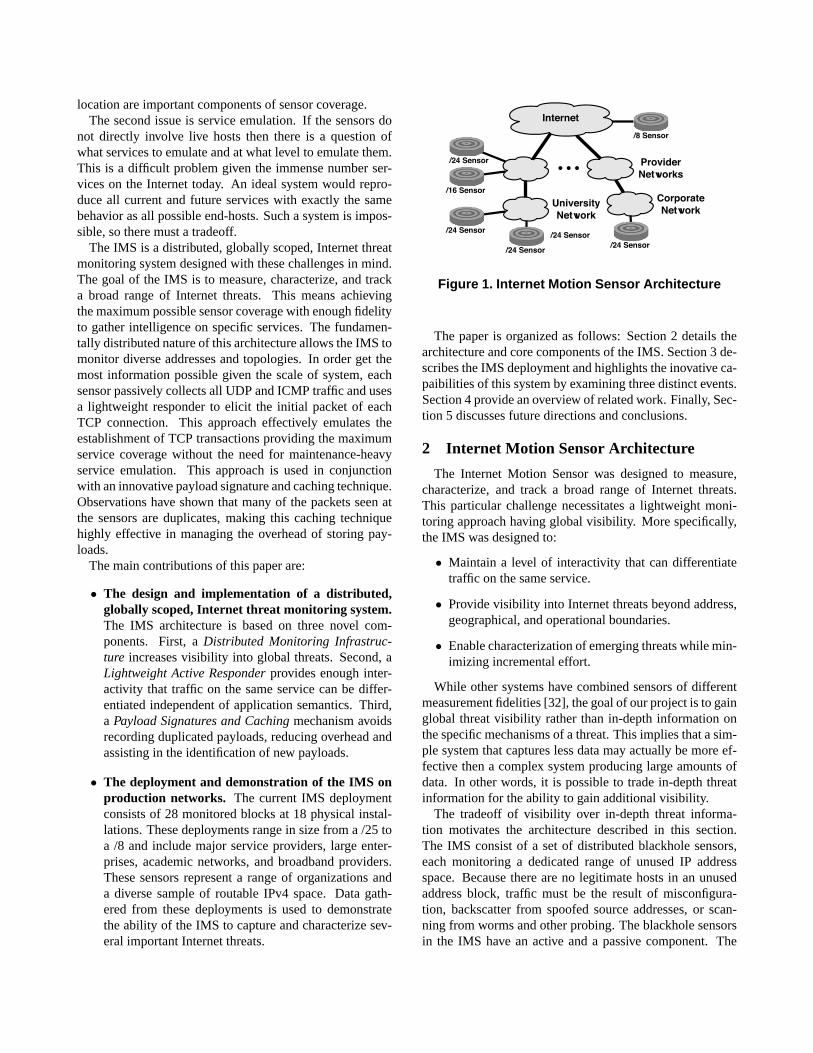
UniversityNetwork
ProviderNetworks
/16 Sensor
/24 Sensor
/24 Sensor
.../24 Sensor
/8 Sensor
Internet
CorporateNetwork
/24 Sensor/24 Sensor
Figure 1. Internet Motion Sensor Architecture
The paper is organized as follows: Section 2 details thearchitecture and core components of the IMS. Section 3 de-scribes the IMS deployment and highlights the inovative ca-paibilities of this system by examining three distinct events.Section 4 provide an overview of related work. Finally, Sec-tion 5 discusses future directions and conclusions.
2 Internet Motion Sensor Architecture
The Internet Motion Sensor was designed to measure,characterize, and track a broad range of Internet threats.This particular challenge necessitates a lightweight moni-toring approach having global visibility. More specifically,the IMS was designed to:
• Maintain a level of interactivity that can differentiatetraffic on the same service.
• Provide visibility into Internet threats beyond address,geographical, and operational boundaries.
• Enable characterization of emerging threats while min-imizing incremental effort.
While other systems have combined sensors of differentmeasurement fidelities [32], the goal of our project is to gainglobal threat visibility rather than in-depth information onthe specific mechanisms of a threat. This implies that a sim-ple system that captures less data may actually be more ef-fective then a complex system producing large amounts ofdata. In other words, it is possible to trade in-depth threatinformation for the ability to gain additional visibility.
The tradeoff of visibility over in-depth threat informa-tion motivates the architecture described in this section.The IMS consist of a set of distributed blackhole sensors,each monitoring a dedicated range of unused IP addressspace. Because there are no legitimate hosts in an unusedaddress block, traffic must be the result of misconfigura-tion, backscatter from spoofed source addresses, or scan-ning from worms and other probing. The blackhole sensorsin the IMS have an active and a passive component. The

passive component records packets sent to the sensor’s ad-dress space and the active component responds to specificpackets to elicit more data from the source.
The active component is designed to elicit the first pay-load of data across the major protocols (TCP, UDP, andICMP). UDP is a connectionless protocols so application-level data is sent without the receiver ever responding. Forexample, the Witty [21] and Slammer [12] worms werebased on UDP in which the entire worm payload was trans-mitted in the first packet. TCP, on the other hand, isa connection-oriented protocol and requires an active re-sponse to elicit any payload data. The IMS uses a simplelightweight active responder to establish a TCP connectionand capture payload data on TCP worms like Blaster [16]and Sasser [8]. ICMP data is passively collected.
Storing the full payload for every packet has significantspace requirements, so the IMS uses a novel payload stor-age approach. When a blackhole sensor receives a packetwith a payload, it first computes the MD5 checksum of thepayload (without network headers) and compares it againstthe checksum of all the other packets it has seen in the pastday. If the checksum (signature), has already been recorded,the capture component logs the signature but does not storethe payload. If the signature is new, the payload is storedand the signature is added to the database of signatures seenin that day.
This architecture offers three novel contribibutions:
• Distributed Monitoring Infrastructure: The IMS isdesigned from the ground up for distributed deploy-ment to increase visibility into global threats, includingthose that may illustrate targeting preferences.
• Lightweight Active Responder: The active responderis designed to maintain a level of interactivity that candifferentiate traffic on the same service independent ofapplication semantics. This enables IMS to character-ize threats on emergent ports and services without ad-ditional deployments or scripting.
• Payload Signatures and Caching:The IMS check-sums and caches commonly seen packets such thatonly new payloads need be stored. This saves signif-icant storage resources and enables a simple mecha-nism for identifying new payloads.
The following three subsections describe and validatethese novel components of the architecture by showing themin the context of a 28 address block, distributed IMS deploy-ment.
2.1 Distributed Blackhole Network
A key contribution of the IMS is the creation of a largedistributed sensor network built from address blocks of
Figure 2. Average packet rate (5 minute bins)as seen by ten IMS Blackhole sensors overone month, normalized by /24
various sizes and placed in a variety of topologically di-verse locations. While previous attempts at monitoring un-used address block have focused on three or fewer addressblocks [22, 11, 32, 17], our approach is to be widely dis-tributed. This architectural choice has two key advantages;greater visibility into distant events and broader coverage ofthreats.
Using the analogy of Astrometric Telescopes, Moore in[11] notes that the greater the size of a light telescope, thegreater the visibility into fainter, smaller, further and olderobjects. Moore notes that the more address space moni-tored (for random scanning events) the better the insightinto shorter lived or lower rate events. The conclusion isthat having large address blocks is important for monitoringglobally scoped events. In addition to wide address blocks,Moore also suggests distributed blocks as a method for in-creasing visibility.
Distributed sensors provide more addresses that increasevisibility and also another important benefit, broader cover-age of threats. Previous work [7] has noted the surprisingfinding that dark address monitors can see strikingly differ-ent behaviors, even when local-preference scanning is re-moved.
As an example, consider the packet rate observed by acollection of sensors. Figure 2 shows the amount of trafficover all protocols and services observed by ten blackholesensors. Packets are normalized by the size of a /24 so sen-sors covering different sized blocks can be compared. Nor-malization is performed such that the magnitude seen in a/23 would be divided by two and traffic in a /25 multipliedby two.
Figure 2 shows that the amount of traffic varies dramat-ically and can differ by more than two orders of magni-

Figure 3. Distribution of local preference ac-cross ten IMS blackhole sensors over onemonth
tude between sensors. The local target selection of ma-licious attackers or worms with local scanning preferencein their scanning algorithms[26], such as Code Red II [3],Nimda [2], and Blaster [16] are likely canidates for the dif-ference in magnitude. However, we show that this is not thecase.
Figure 3 shows the percentage of traffic to all protocolsand services from the same local /16 and local /8 as the sen-sor where the traffic was observed. There are two importantimplications of this graph. First, there are very differentrelative amounts of local /8 traffic seen at the various sen-sors. Second, although some sensors see a very significantamount of normalized local /8 traffic, those blocks do notalways correlate with the sensors with the greatest magni-tude of overall traffic. For example, C/24 observes by farthe greatest amount of traffic, but only approximately 10%of that traffic is from within the same /8 as the sensor. So,even though local traffic can be significant, the major traf-fic differences are not due to local preference. Additionalinsights into these differences are discussed in [7]. Thus,the important message in Figure 2 and Figure 3 is that dif-ferent blackholes observe different magnitudes and types oftraffic.
The distributed nature of IMS affords us additional vis-ibility into global threats. This comes from our ability toincrease address space beyond a single wide address blockas well as the topological and organizational diversity of theaddress blocks.
2.2 Lightweight Responder
Another novel aspect of this work is the construction ofa lightweight responder whose main responsibility it is toelicit payloads for TCP connections. Recall that because
TCP is a connection oriented protocol [27], no applicationdata is sent until after connection establishment. This hastwo major repercussions for any TCP based threats; threatsto the same port can not be distinguished from each other,and threats will not send the exploit payload if a connectioncan not be established.
As an illustration, consider the Blaster worm [16]. Theinfection and transmission method used by Blaster is rela-tively complicated compared to a single-packet worm likeSlammer [12]. A condensed diagram of the transactions in-volved in a Blaster infection is illustrated in Figure 4(a).The Blaster worm first opens a TCP connection to port 135and sends an RPC bind request. Next, an RPC request mes-sage is sent containing a buffer overflow and code to open abackdoor port on TCP port 4444. The newly infected hostthen sends a message via the new backdoor to download theworm payload and execute it.
Figure 4(b) depicts the transactions of the Blaster wormas captured by a blackhole sensor in the IMS. Observe howa single SYN-ACK on port 135 elicits not only the exploit,but also a SYN on the backdoor port. Since the IMS black-hole sensors respond to SYN packets on all ports, the wormconnects to port 4444 and sends commands to TFTP thepayload and start the worm binary. Compare the data cap-tured by the IMS to the data recorded by a passive black-hole monitor, shown in Figure 4(c). While a passive moni-tor might catch a single packet UDP worm like Sapphire, itwill only see SYN traffic from TCP worms like Blaster. TheBlaster example illustrates the two key contributions of thelightweight reposnder; the ability to elicit payloads to dif-ferentiate traffic and the ability to get responses across portswithout application semantic information. The followingsubsections explores these points in more depth.
2.2.1 Differentiate Services
An important illustration of the value in having more infor-mation is the extraction and classification of a new threatfor a highly trafficked service. The Sasser [8] worm utilizedTCP port 445, which is a used by many existing threats.Because the IMS was able to obtain and classify the Sasserpayload, it was able to identify the traffic specific to thisnew worm, shown in Figure 5. Figure 5(a) shows the trafficcaptured on port 445 over the period of 7 days. Figure 5(b)shows only the traffic of the signature associated with Sasserover that same time period. Thus, the IMS is able to iden-tify the presence of a new worm even in an extremely noisyservice by using payload signatures.
2.2.2 Service Agnostic
Another advantage of the lightweight responder is its ser-vice agnostic approach which enables insight into less pop-ular services. Consider, for example, a management appli-

(a) (b) (c)
Figure 4. Blaster infection attempt captured using three monitoring techniques
(a) (b)
Figure 5. The Sasser worm as recorded by an IMS /24 blackhole sensor

Figure 6. Change in activity on TCP portswithout well-known services
cation that may not be widely deployed. The populationdeploying this service might only be several thousand hostson the global Internet and the obscurity of the service maymean it is unmonitored. Another example of less well knowservices are backdoor ports on existing worms and viruses.New threats that exploit these obscure services can avoid de-tection by existing network monitoring tools because theydo not have the appropriate service modules. In contrast,the IMS can detect and gather significant information onthis kind of threat. Consider Figure 6, which shows trafficon TCP ports which do not have well known services. Thisfigure shows the top 20 ports which had significant changesin traffic levels over a five month period. Note in particular,ports 2745 and 3127, which represent services or backdoorsas discussed above.
2.2.3 Limitations
The service agnostic lightweight responder is an novelmethod of tracking emerging threats, however, it may pro-vide little or no information on the threats that depend on ap-plication level responses. For example, the NetBIOS servicewhich runs on Windows systems requires an RPCbind()before performing a RPCrequest()to execute many popu-lar operations. Thus, an IMS sensor may observe the RPCbind()but not the subsequent RPCrequest()because no ap-plication level response was ever sent. However, in somecases the threat will continue without waiting for the appli-cation level response. For example, the Blaster worm willsend the RPCbind() and RPCrequest()(containing the ex-ploit) without any application level response. In addition,many threats perform operations on multiple ports and it ispossible to track these threats by observing the pattern ofrequests across ports.
Figure 7. IMS and tcpdump log file sizes overa 16 day period
While responses across most or all ports provides insightsinto potentially unknown threats, we would be remiss if wedid not point out that this makes these sensors simple toidentify and fingerprint. One main advantage of this sys-tem is its focus on globally scoped threats over the activitesfor individual attackers. This translates into a threat modelwhereby our biggest concern is the encoding of the moni-tored network blocks in threat “no-hit-lists.” The large num-ber of distributed blocks of small to medium size makes thisproposition difficult. We have not seen any evidence to dateof this type of activity being encoded into self propgrat-ing threats. Nevertheless, we are exploring several ways ofdiscouraging fingerprinting including; sensor rotation (i.e.continuously moving the active responders to evade detec-tion), source squelching on individual sensors [17] or ac-cross the entire system (i.e. if we detect and respond at onesensor, we don’t have to send a response from other sen-sors), or building simulated hosts and topology (as in hon-eyd [19]) to mask the presence of a blackhole.
2.3 MD5 Checksuming and Caching of requestpayloads
The final novel aspect of this system is its method of stor-ing payloads. When a blackhole sensor receives a packetwith a payload it first computes the MD5 checksum of thepayload (without network headers) and compares it againstthe checksum of all the other packets it has seen. If thechecksum, or signature, has already been recorded, the pas-sive capture component logs the signature but does not storethe payload. If the signature is new, the payload is storedand the signature is added to the database of signatures seen.This approach offers a factor of two savings in disk (Fig-ure 7) and the hit rate on the signature cache typically tops96% (Figure 8). The implication is that a large number of
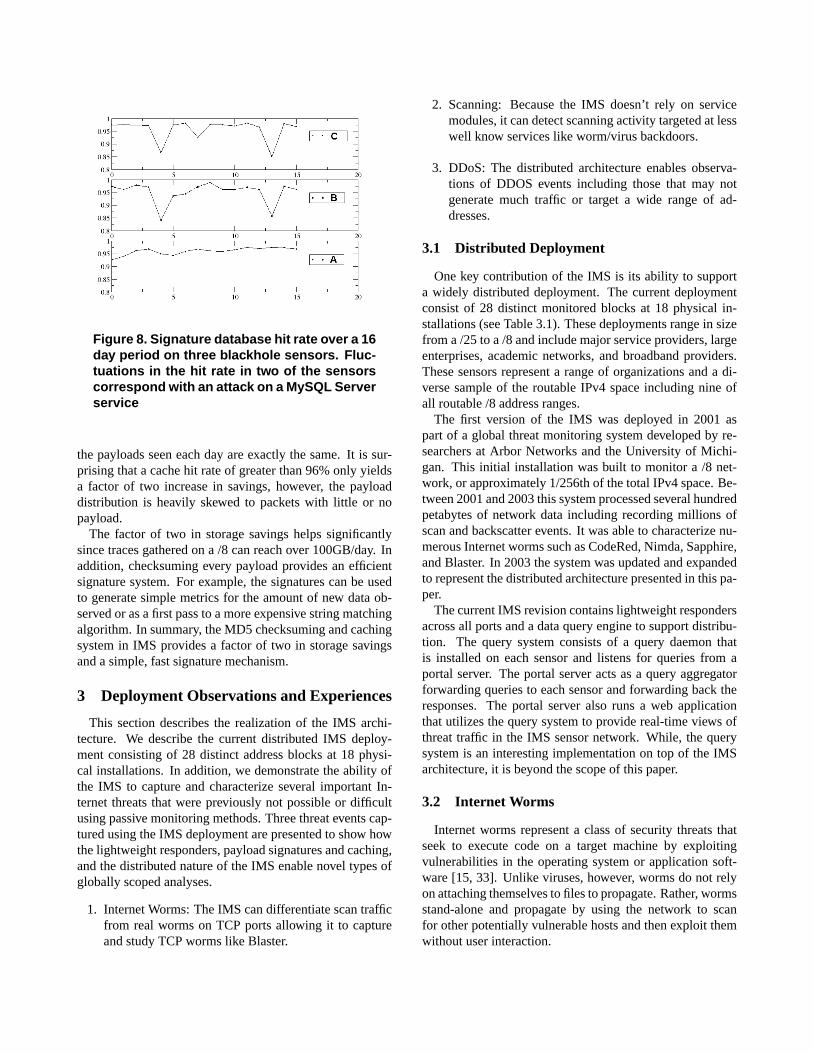
Figure 8. Signature database hit rate over a 16day period on three blackhole sensors. Fluc-tuations in the hit rate in two of the sensorscorrespond with an attack on a MySQL Serverservice
the payloads seen each day are exactly the same. It is sur-prising that a cache hit rate of greater than 96% only yieldsa factor of two increase in savings, however, the payloaddistribution is heavily skewed to packets with little or nopayload.
The factor of two in storage savings helps significantlysince traces gathered on a /8 can reach over 100GB/day. Inaddition, checksuming every payload provides an efficientsignature system. For example, the signatures can be usedto generate simple metrics for the amount of new data ob-served or as a first pass to a more expensive string matchingalgorithm. In summary, the MD5 checksuming and cachingsystem in IMS provides a factor of two in storage savingsand a simple, fast signature mechanism.
3 Deployment Observations and Experiences
This section describes the realization of the IMS archi-tecture. We describe the current distributed IMS deploy-ment consisting of 28 distinct address blocks at 18 physi-cal installations. In addition, we demonstrate the ability ofthe IMS to capture and characterize several important In-ternet threats that were previously not possible or difficultusing passive monitoring methods. Three threat events cap-tured using the IMS deployment are presented to show howthe lightweight responders, payload signatures and caching,and the distributed nature of the IMS enable novel types ofglobally scoped analyses.
1. Internet Worms: The IMS can differentiate scan trafficfrom real worms on TCP ports allowing it to captureand study TCP worms like Blaster.
2. Scanning: Because the IMS doesn’t rely on servicemodules, it can detect scanning activity targeted at lesswell know services like worm/virus backdoors.
3. DDoS: The distributed architecture enables observa-tions of DDOS events including those that may notgenerate much traffic or target a wide range of ad-dresses.
3.1 Distributed Deployment
One key contribution of the IMS is its ability to supporta widely distributed deployment. The current deploymentconsist of 28 distinct monitored blocks at 18 physical in-stallations (see Table 3.1). These deployments range in sizefrom a /25 to a /8 and include major service providers, largeenterprises, academic networks, and broadband providers.These sensors represent a range of organizations and a di-verse sample of the routable IPv4 space including nine ofall routable /8 address ranges.
The first version of the IMS was deployed in 2001 aspart of a global threat monitoring system developed by re-searchers at Arbor Networks and the University of Michi-gan. This initial installation was built to monitor a /8 net-work, or approximately 1/256th of the total IPv4 space. Be-tween 2001 and 2003 this system processed several hundredpetabytes of network data including recording millions ofscan and backscatter events. It was able to characterize nu-merous Internet worms such as CodeRed, Nimda, Sapphire,and Blaster. In 2003 the system was updated and expandedto represent the distributed architecture presented in this pa-per.
The current IMS revision contains lightweight respondersacross all ports and a data query engine to support distribu-tion. The query system consists of a query daemon thatis installed on each sensor and listens for queries from aportal server. The portal server acts as a query aggregatorforwarding queries to each sensor and forwarding back theresponses. The portal server also runs a web applicationthat utilizes the query system to provide real-time views ofthreat traffic in the IMS sensor network. While, the querysystem is an interesting implementation on top of the IMSarchitecture, it is beyond the scope of this paper.
3.2 Internet Worms
Internet worms represent a class of security threats thatseek to execute code on a target machine by exploitingvulnerabilities in the operating system or application soft-ware [15, 33]. Unlike viruses, however, worms do not relyon attaching themselves to files to propagate. Rather, wormsstand-alone and propagate by using the network to scanfor other potentially vulnerable hosts and then exploit themwithout user interaction.

Organization SizeAcademic Network /24, /24Academic Network /24Academic Network /24Academic Network /24Large Enterprise /18Tier 1 ISP /17Tier 1 ISP /18National ISP /20, /21, /22National ISP /24, /24, /24National ISP /24National ISP /24National ISP /24, /24Regional ISP /25, /24, /24Regional ISP /23, /22Regional ISP /8Regional ISP /24Broadband Provider /17, /18, /22Broadband Provider /24, /24
Table 1. IMS Deployments
Globally scoped network monitoring systems, such as theIMS, are helpful in characterizing, measuring and trackingthese threats. The IMS has been able to provide valuableinsight into a variety of worm behaviors, including:
• Worm Virulence . How much traffic resulted from thisworm? What routers or paths were most congested bythis worm?
• Worm Demographics. How many hosts were in-fected? Where are these hosts geographically, topolog-ically, and organizationally? What operating systemare the infected hosts running? What is their availablebandwidth?
• Worm Propagation. How does the worm select itsnext target?
• Community response. How quickly was policy em-ployed? Which organizations were affected quickestand who responded quickest? Who is still infected?
As an example of the type of analysis made possible bythe IMS, consider the following brief analysis of the Blasterworm. The Blaster worm affected Windows 2000 and XPsystems running DCOM RPC services and used a publi-cized buffer overflow vulnerability to run arbitrary code onthe target machine. The worm would generate an addressto infect (60% were randomly generated and 40% were lo-cated within the same host /16 network as the affected sys-tem). The worm would then sequentially scan from the cho-sen address. The IMS was able to measure the release and
2003-08-10 2003-08-12 2003-08-14 2003-08-16 2003-08-18Date
0
5000
10000
15000
20000
Bla
ster
Act
ivity
per
Hou
r (u
niqu
e IP
add
ress
es) Growth
DecayPersistance
Figure 9. A snapshot of Blaster worm showingthe three phases of the worm lifecycle
propagation of the Blaster worm as it attempted to infectrandom hosts.
The 7-day period of observations surrounding the releaseof the Blaster worm indicates a clear 3-phased cycle. Fig-ure 9 illustrates the three phases using the number SYNsto TCP port 135 on a /8 (the active responder was not yetoperational). The first worm phase is the growth phase inwhich the number of scans increased from a baseline rate tohundreds of thousands per hour. The second phase is the de-cay phase in which in the number of observed probes dropsas large-scale filtering was implemented to halt the worm’sspread and cleanup started. The third phase of worm activ-ity is the persistence phase which for the Blaster worm hascontinued through 2004.
In this one-week period of measurement, the IMS systemobserved over 286,000 unique IP addresses displaying thecharacteristics of Blaster activity. Inspection of the DNStop-level domains (TLD) from the reverse lookups showsthat the .net and .com domains were hit most heavily, with.jp as the third more popular unique TLD. Furthermore, ap-proximately 10% of the hosts observed were identifiable asdynamically assigned addresses.
At its highest pace, the Blaster worm was spreading witha doubling time of less than 2.3 hours. This value maybe overestimated due to the truncated propagation phase ofthe worm. Fitting a sigmoidal population growth equationto this phase of the data shows a maximal growth rate of40,000 hosts per hour. The second major phase of the datacollection monitored the containment of the Blaster worm.Starting within 8 hours of the worm’s initial outbreak, thenumber of unique hosts per-hour scanning for TCP port 135began to diminish. This loss of activity fits a simple ex-ponential decay model. The half-life of these observationsis approximately 10.4 hours and continued for five days,through the end of the workweek.
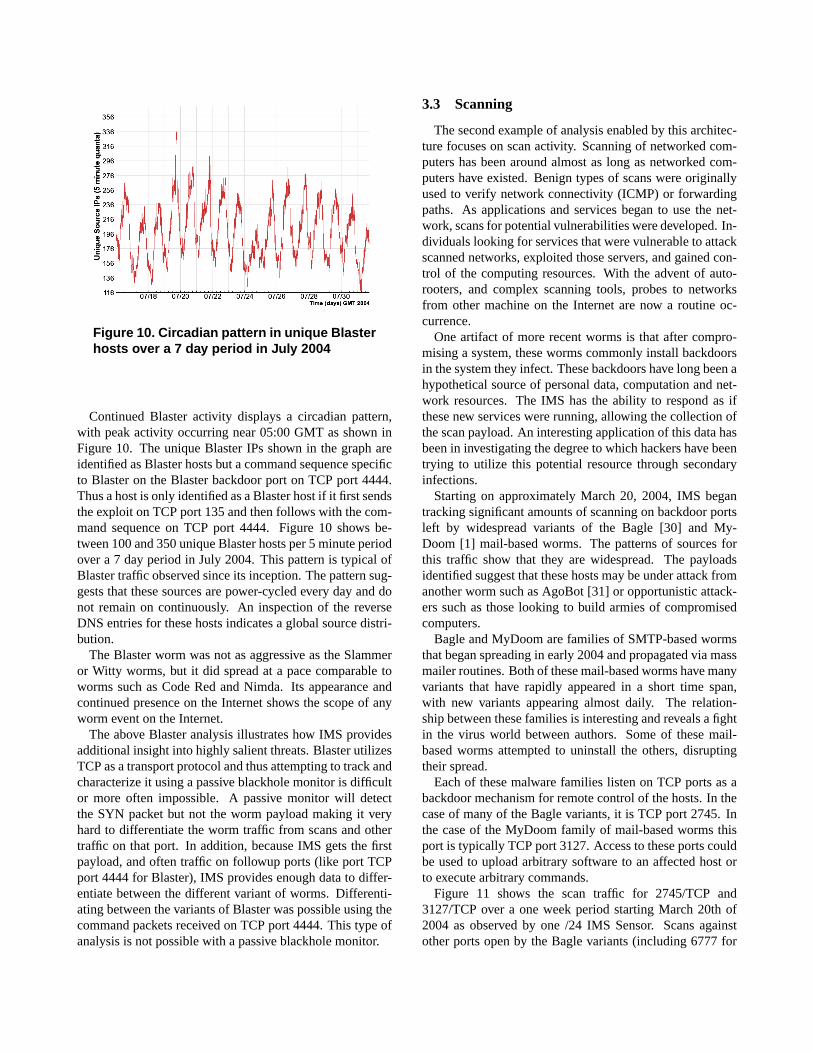
Figure 10. Circadian pattern in unique Blasterhosts over a 7 day period in July 2004
Continued Blaster activity displays a circadian pattern,with peak activity occurring near 05:00 GMT as shown inFigure 10. The unique Blaster IPs shown in the graph areidentified as Blaster hosts but a command sequence specificto Blaster on the Blaster backdoor port on TCP port 4444.Thus a host is only identified as a Blaster host if it first sendsthe exploit on TCP port 135 and then follows with the com-mand sequence on TCP port 4444. Figure 10 shows be-tween 100 and 350 unique Blaster hosts per 5 minute periodover a 7 day period in July 2004. This pattern is typical ofBlaster traffic observed since its inception. The pattern sug-gests that these sources are power-cycled every day and donot remain on continuously. An inspection of the reverseDNS entries for these hosts indicates a global source distri-bution.
The Blaster worm was not as aggressive as the Slammeror Witty worms, but it did spread at a pace comparable toworms such as Code Red and Nimda. Its appearance andcontinued presence on the Internet shows the scope of anyworm event on the Internet.
The above Blaster analysis illustrates how IMS providesadditional insight into highly salient threats. Blaster utilizesTCP as a transport protocol and thus attempting to track andcharacterize it using a passive blackhole monitor is difficultor more often impossible. A passive monitor will detectthe SYN packet but not the worm payload making it veryhard to differentiate the worm traffic from scans and othertraffic on that port. In addition, because IMS gets the firstpayload, and often traffic on followup ports (like port TCPport 4444 for Blaster), IMS provides enough data to differ-entiate between the different variant of worms. Differenti-ating between the variants of Blaster was possible using thecommand packets received on TCP port 4444. This type ofanalysis is not possible with a passive blackhole monitor.
3.3 Scanning
The second example of analysis enabled by this architec-ture focuses on scan activity. Scanning of networked com-puters has been around almost as long as networked com-puters have existed. Benign types of scans were originallyused to verify network connectivity (ICMP) or forwardingpaths. As applications and services began to use the net-work, scans for potential vulnerabilities were developed. In-dividuals looking for services that were vulnerable to attackscanned networks, exploited those servers, and gained con-trol of the computing resources. With the advent of auto-rooters, and complex scanning tools, probes to networksfrom other machine on the Internet are now a routine oc-currence.
One artifact of more recent worms is that after compro-mising a system, these worms commonly install backdoorsin the system they infect. These backdoors have long been ahypothetical source of personal data, computation and net-work resources. The IMS has the ability to respond as ifthese new services were running, allowing the collection ofthe scan payload. An interesting application of this data hasbeen in investigating the degree to which hackers have beentrying to utilize this potential resource through secondaryinfections.
Starting on approximately March 20, 2004, IMS begantracking significant amounts of scanning on backdoor portsleft by widespread variants of the Bagle [30] and My-Doom [1] mail-based worms. The patterns of sources forthis traffic show that they are widespread. The payloadsidentified suggest that these hosts may be under attack fromanother worm such as AgoBot [31] or opportunistic attack-ers such as those looking to build armies of compromisedcomputers.
Bagle and MyDoom are families of SMTP-based wormsthat began spreading in early 2004 and propagated via massmailer routines. Both of these mail-based worms have manyvariants that have rapidly appeared in a short time span,with new variants appearing almost daily. The relation-ship between these families is interesting and reveals a fightin the virus world between authors. Some of these mail-based worms attempted to uninstall the others, disruptingtheir spread.
Each of these malware families listen on TCP ports as abackdoor mechanism for remote control of the hosts. In thecase of many of the Bagle variants, it is TCP port 2745. Inthe case of the MyDoom family of mail-based worms thisport is typically TCP port 3127. Access to these ports couldbe used to upload arbitrary software to an affected host orto execute arbitrary commands.
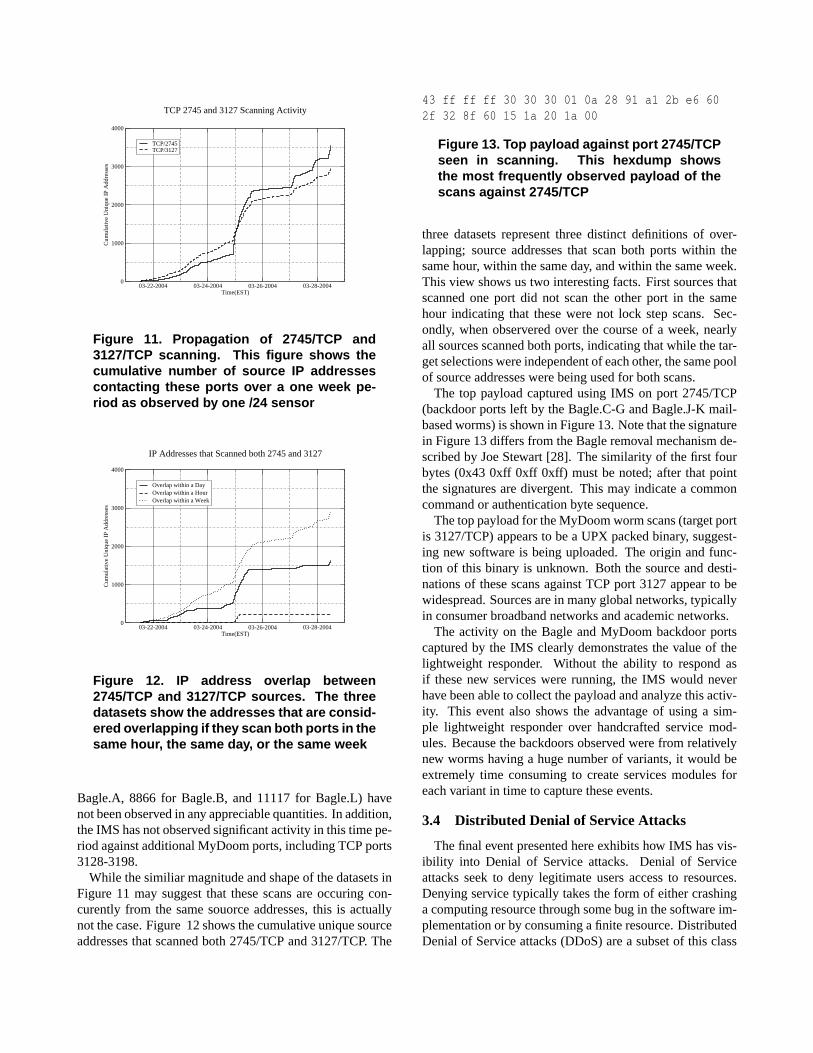
Figure 11 shows the scan traffic for 2745/TCP and3127/TCP over a one week period starting March 20th of2004 as observed by one /24 IMS Sensor. Scans againstother ports open by the Bagle variants (including 6777 for
03-22-2004 03-24-2004 03-26-2004 03-28-2004Time(EST)
0
1000
2000
3000
4000
Cum
ulat
ive
Uni
que
IP A
ddre
sses
TCP/2745TCP/3127
TCP 2745 and 3127 Scanning Activity
Figure 11. Propagation of 2745/TCP and3127/TCP scanning. This figure shows thecumulative number of source IP addressescontacting these ports over a one week pe-riod as observed by one /24 sensor
03-22-2004 03-24-2004 03-26-2004 03-28-2004Time(EST)
0
1000
2000
3000
4000
Cum
ulat
ive
Uni
que
IP A
ddre
sses
Overlap within a DayOverlap within a HourOverlap within a Week
IP Addresses that Scanned both 2745 and 3127
Figure 12. IP address overlap between2745/TCP and 3127/TCP sources. The threedatasets show the addresses that are consid-ered overlapping if they scan both ports in thesame hour, the same day, or the same week
Bagle.A, 8866 for Bagle.B, and 11117 for Bagle.L) havenot been observed in any appreciable quantities. In addition,the IMS has not observed significant activity in this time pe-riod against additional MyDoom ports, including TCP ports3128-3198.
While the similiar magnitude and shape of the datasets inFigure 11 may suggest that these scans are occuring con-curently from the same souorce addresses, this is actuallynot the case. Figure 12 shows the cumulative unique sourceaddresses that scanned both 2745/TCP and 3127/TCP. The
43 ff ff ff 30 30 30 01 0a 28 91 a1 2b e6 602f 32 8f 60 15 1a 20 1a 00
Figure 13. Top payload against port 2745/TCPseen in scanning. This hexdump showsthe most frequently observed payload of thescans against 2745/TCP
three datasets represent three distinct definitions of over-lapping; source addresses that scan both ports within thesame hour, within the same day, and within the same week.This view shows us two interesting facts. First sources thatscanned one port did not scan the other port in the samehour indicating that these were not lock step scans. Sec-ondly, when observered over the course of a week, nearlyall sources scanned both ports, indicating that while the tar-get selections were independent of each other, the same poolof source addresses were being used for both scans.
The top payload captured using IMS on port 2745/TCP(backdoor ports left by the Bagle.C-G and Bagle.J-K mail-based worms) is shown in Figure 13. Note that the signaturein Figure 13 differs from the Bagle removal mechanism de-scribed by Joe Stewart [28]. The similarity of the first fourbytes (0x43 0xff 0xff 0xff) must be noted; after that pointthe signatures are divergent. This may indicate a commoncommand or authentication byte sequence.
The top payload for the MyDoom worm scans (target portis 3127/TCP) appears to be a UPX packed binary, suggest-ing new software is being uploaded. The origin and func-tion of this binary is unknown. Both the source and desti-nations of these scans against TCP port 3127 appear to bewidespread. Sources are in many global networks, typicallyin consumer broadband networks and academic networks.
The activity on the Bagle and MyDoom backdoor portscaptured by the IMS clearly demonstrates the value of thelightweight responder. Without the ability to respond asif these new services were running, the IMS would neverhave been able to collect the payload and analyze this activ-ity. This event also shows the advantage of using a sim-ple lightweight responder over handcrafted service mod-ules. Because the backdoors observed were from relativelynew worms having a huge number of variants, it would beextremely time consuming to create services modules foreach variant in time to capture these events.
3.4 Distributed Denial of Service Attacks
The final event presented here exhibits how IMS has vis-ibility into Denial of Service attacks. Denial of Serviceattacks seek to deny legitimate users access to resources.Denying service typically takes the form of either crashinga computing resource through some bug in the software im-plementation or by consuming a finite resource. DistributedDenial of Service attacks (DDoS) are a subset of this class
00:00
:00
01:12
:00
02:24
:00
03:36
:00
04:48
:00
06:00
:00
07:12
:00
08:24
:00
09:36
:00
10:48
:00
12:00
:00
Time(EST)
0
5000
10000
15000
20000
Pack
ets
per
Min
ute
FTPHTTP
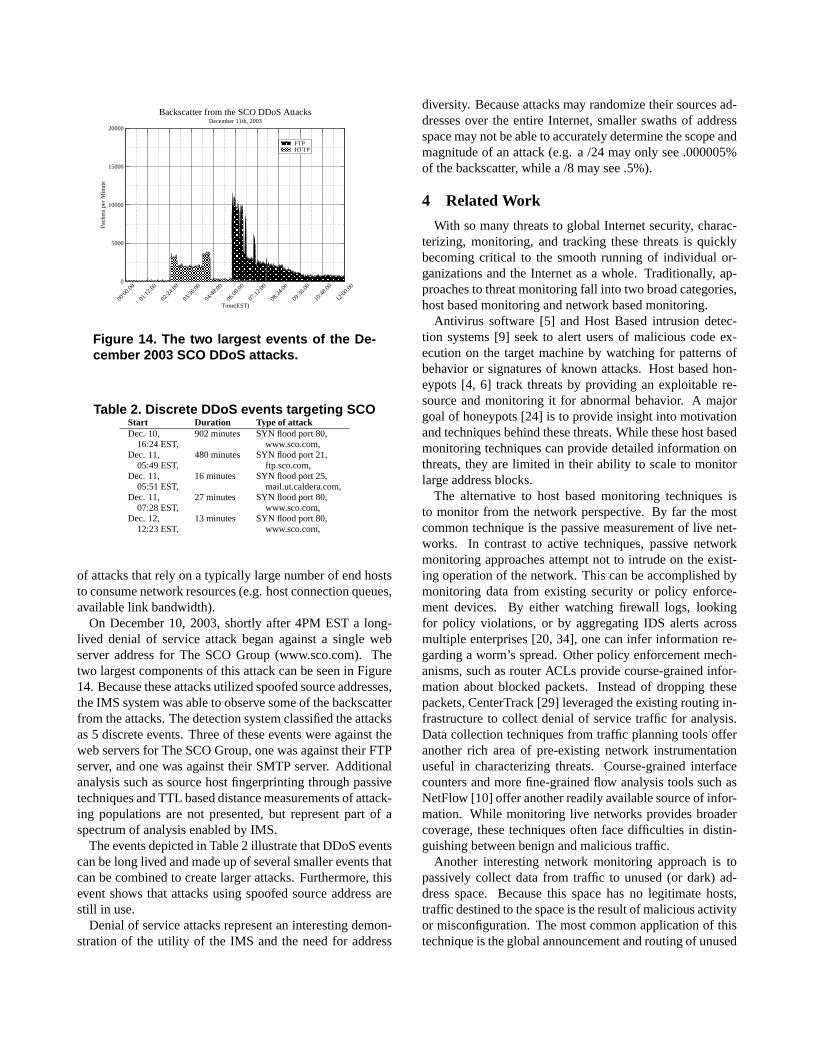
Backscatter from the SCO DDoS AttacksDecember 11th, 2003
Figure 14. The two largest events of the De-cember 2003 SCO DDoS attacks.
Table 2. Discrete DDoS events targeting SCOStart Duration Type of attackDec. 10, 902 minutes SYN flood port 80,
16:24 EST, www.sco.com,Dec. 11, 480 minutes SYN flood port 21,
05:49 EST, ftp.sco.com,Dec. 11, 16 minutes SYN flood port 25,
05:51 EST, mail.ut.caldera.com,Dec. 11, 27 minutes SYN flood port 80,
07:28 EST, www.sco.com,Dec. 12, 13 minutes SYN flood port 80,
12:23 EST, www.sco.com,
of attacks that rely on a typically large number of end hoststo consume network resources (e.g. host connection queues,available link bandwidth).
On December 10, 2003, shortly after 4PM EST a long-lived denial of service attack began against a single webserver address for The SCO Group (www.sco.com). Thetwo largest components of this attack can be seen in Figure14. Because these attacks utilized spoofed source addresses,the IMS system was able to observe some of the backscatterfrom the attacks. The detection system classified the attacksas 5 discrete events. Three of these events were against theweb servers for The SCO Group, one was against their FTPserver, and one was against their SMTP server. Additionalanalysis such as source host fingerprinting through passivetechniques and TTL based distance measurements of attack-ing populations are not presented, but represent part of aspectrum of analysis enabled by IMS.
The events depicted in Table 2 illustrate that DDoS eventscan be long lived and made up of several smaller events thatcan be combined to create larger attacks. Furthermore, thisevent shows that attacks using spoofed source address arestill in use.
Denial of service attacks represent an interesting demon-stration of the utility of the IMS and the need for address
diversity. Because attacks may randomize their sources ad-dresses over the entire Internet, smaller swaths of addressspace may not be able to accurately determine the scope andmagnitude of an attack (e.g. a /24 may only see .000005%of the backscatter, while a /8 may see .5%).
4 Related Work
With so many threats to global Internet security, charac-terizing, monitoring, and tracking these threats is quicklybecoming critical to the smooth running of individual or-ganizations and the Internet as a whole. Traditionally, ap-proaches to threat monitoring fall into two broad categories,host based monitoring and network based monitoring.
Antivirus software [5] and Host Based intrusion detec-tion systems [9] seek to alert users of malicious code ex-ecution on the target machine by watching for patterns ofbehavior or signatures of known attacks. Host based hon-eypots [4, 6] track threats by providing an exploitable re-source and monitoring it for abnormal behavior. A majorgoal of honeypots [24] is to provide insight into motivationand techniques behind these threats. While these host basedmonitoring techniques can provide detailed information onthreats, they are limited in their ability to scale to monitorlarge address blocks.
The alternative to host based monitoring techniques isto monitor from the network perspective. By far the mostcommon technique is the passive measurement of live net-works. In contrast to active techniques, passive networkmonitoring approaches attempt not to intrude on the exist-ing operation of the network. This can be accomplished bymonitoring data from existing security or policy enforce-ment devices. By either watching firewall logs, lookingfor policy violations, or by aggregating IDS alerts acrossmultiple enterprises [20, 34], one can infer information re-garding a worm’s spread. Other policy enforcement mech-anisms, such as router ACLs provide course-grained infor-mation about blocked packets. Instead of dropping thesepackets, CenterTrack [29] leveraged the existing routing in-frastructure to collect denial of service traffic for analysis.Data collection techniques from traffic planning tools offeranother rich area of pre-existing network instrumentationuseful in characterizing threats. Course-grained interfacecounters and more fine-grained flow analysis tools such asNetFlow [10] offer another readily available source of infor-mation. While monitoring live networks provides broadercoverage, these techniques often face difficulties in distin-guishing between benign and malicious traffic.
Another interesting network monitoring approach is topassively collect data from traffic to unused (or dark) ad-dress space. Because this space has no legitimate hosts,traffic destined to the space is the result of malicious activityor misconfiguration. The most common application of thistechnique is the global announcement and routing of unused

space to a collection infrastructure that records the incomingpackets [11, 14, 23]. In contrast to host based techniques,passively monitoring unused address space is able to scaleto very large address spaces at the expense of not gatheringdetails about specific events.
The final networked monitoring approach uses active net-work perturbation to determine the scope and propagationof threats. This is typically done to elicit a behavior thatis only visible by participating in a network or applicationsession. Projects like honeynet [25] and iSink [32], andsoftware like honeyd [19] are used to bring up networksof honeypots; places designed to capture information aboutintrusions in a controlled environments. These techniquesattempt to balance the scalability of dark address monitorswhile gathering more detailed information about threats.
The techniques described above provide varying amountsof intelligence regarding a threat. Some systems captureall the events involved in a particular incident while othersrecord only a connection attempt. Some systems only havevisibility into local events, while other are capable of mon-itoring globally scoped threats. These tradeoffs, which werefer to as depth and breadth, are bounded by their associ-ated costs.
Breadth refers to the ability of the system to detect threatsacross hosts and across operational and geographic bound-aries. At one extreme of the breadth axis is the threat viewof a single host while at the other is the view of all network-based threats on a global scale. One early approach toachieving globally scoped visibility was the measurementof wide address blocks [11, 32, 23]. This technique is at-tractive in that it can easily view a large percentage of thetotal IPv4 address space and has been effective at charac-terizing new threats [12, 21]. However, given the finite sizeof the IPv4 address space, it is important to explore newmethods of obtaining breadth. The IMS addresses the issueof breath by creating a distributed architecture consisting ofnumerous topologically diverse sensors.
Depth defines the extent to which a sensor emulates theservices and characteristic of a real host, similar to the in-teraction spectrum in honeypots [24]. At one extreme of thedepth axis is an instrumented live host while at the other isthe completely passive capture of packets. Multiple pointsin this spectrum can be utilized simultaneously, as shownby Barfordet al. [32]. The IMS, however, uses an extensionto passive techniques [11] that gains additional intelligencewithout emulating services to the extent of previous activemethods [25, 19].
5 Conclusion
This paper describe the Internet Motion Sensor, a dis-tributed, globally scoped, Internet threat monitoring sys-tem. With roots in wide, dark address monitoring, the IMSextends these techniques to include a distributed blackhole
network with a lightweight responder and a novel payloadsignature and caching mechanism. Together, these capabili-ties afford new insight into Internet worms, denial of serviceattacks, and malicious scan activity.
First, we presented the IMS architecture and highlightedthe innovative capacities of the system. The distributedblackhole network allows increased visability into more dis-tant events. The lightweight responder is designed to dif-ferentiate traffic services while remaining independent ofapplication semantics. Finally, the payload signature andcaching mechanism reduces the overhead associated withstoring request payloads.
We then presented this architecture in the context of a 28block, 18 organization distributed deployment. Highlight-ing the innovative capabilities of IMS, we examined threedistinct large-scale events including, the Blaster worm (Au-gust 2003), the Bagle backdoor scanning (March 2004), andthe SCO denial of service attacks (December 2003).
There remain several interesting issues that would en-hance the capabilities of the IMS. First, we are interestedin the issue of fingerprinting the blackhole sensor and inclu-sion in blacklists. We wish to examine several of the anti-fingerprinting techniques discussed in Section 2. Second,we wish to further explore the tradeoffs between breadthand depth of threat monitoring architectures. The mostpromising improvement being the creation of a hybrid sys-tem that combines host-based sensors with wide addressspace monitors. Finally, we hope to develop additional tech-niques for characterizing attackers. Techniques such as pas-sive OS fingerprinting [18] and firepower calculations willprovide additional information about the scope and impactof an ongoing attack.
Acknowledgments
This work was supported by the Advanced Researchand Development Activity (ARDA) under contract numberNBCHC030104.
The authors would like to thank all the IMS participantsfor their help and suggestions. We would also like to thankArbor Networks and Larry Blunk, Bert Rossi, and Man-ish Karir at Merit Network for their assistance and sup-port through this paper. The IMS project had its roots inan earlier system created by Dug Song, Robert Stone, andG. Robert Malan.
References
[1] CERT. Incident Note IN-2004-01: W32/Novarg.A Virus.http://www.cert.org/incident_notes/IN-2004-01.html, 2004.
[2] CERT Coordination Center. CERT Advisory CA-2001-26Nimda Worm. 2001.
[3] CERT Coordination Center. Code Red II: AnotherWorm Exploiting Buffer Overflow In IIS Indexing Ser-
vice DLL. Available athttp://www.cert.org/incident_notes/IN-2001-09.html, 2001.
[4] B. Cheswick. An evening with Berferd in which a crackeris lured, endured, and studied. InProceedings of the Winter1992 USENIX Conference: January 20 — January 24, 1992,San Francisco, California, pages 163–174, Berkeley, CA,USA, Winter 1992.
[5] F. Cohen.A Short Course on Computer Viruses. John Wiley& Sons, 2nd edition, April 1994.
[6] F. Cohen. The deception toolkit (DTK).http://www.all.net/dtk/dtk.html, June 2004.
[7] E. Cooke, M. Bailey, Z. M. Mao, D. Watson, and F. Jahanian.Toward understanding distributed blackhole placement. InProc of ACM CCS Workshop on Rapid Malcode, pages 54–64. ACM Press, October 2004.
[8] M. Corporation. What you should know about theSasser worm. http://www.microsoft.com/security/incident/sasser.mspx, May 2004.
[9] S. Forrest, S. A. Hofmeyr, A. Somayaji, and T. A. Longstaff.A sense of self for Unix processes. InProceedings ofthe IEEE Symposium on Research in Security and Privacy,pages 120–128, Oakland, CA, May 1996.
[10] C. S. Inc. Netflow services and applications. 2002.http://www.cisco.com/warp/public/cc/pd/iosw/ioft/neflct/tech/napps_wp.htm.
[11] D. Moore. Network telescopes: Observing small or distantsecurity events. In11th USENIX Security Symposium, In-vited talk, San Francisco, CA, Aug. 5–9 2002. Unpublished.
[12] D. Moore, V. Paxson, S. Savage, C. Shannon, S. Staniford,and N. Weaver. Inside the Slammer worm.IEEE Security &Privacy, 1(4):33–39, 2003.
[13] D. Moore, C. Shannon, G. M. Voelker, and S. Savage.Network telescopes.http://www.caida.org/outreach/papers/2004/tr-2004-04/, July 2004.
[14] D. Moore, G. M. Voelker, and S. Savage. Inferring In-ternet denial-of-service activity. InProceedings of theTenth USENIX Security Symposium, pages 9–22, Washing-ton, D.C., Aug. 13–17 2001.
[15] J. Nazario.Defense and detection strategies against Internetworms. Artech, 2004.
[16] J. Nazario, M. Bailey, and F. Jahanian. The spread of theBlaster worm. Submitted for publication.
[17] R. Pang, V. Yegneswaran, P. Barford, V. Paxson, andL. Peterson. Characteristics of internet background ra-diation. http://www.cs.princeton.edu/nsg/papers/telescope.pdf, June 2004.
[18] T. H. Project. Know Your Enemy: Passive Fingerprinting,Identifying remote hosts, without them knowing. 2002.
[19] N. Provos. Honeyd — A virtual honeypot daemon. In10thDFN-CERT Workshop, Hamburg, Germany, Feb. 2003.
[20] SANS. Sans - Internet storm center - cooperative cyberthreat monitor and alert system, June 2004.
[21] C. Shannon and D. Moore. The spread of the Wittyworm. http://www.caida.org/analysis/secuirty/witty/, June 2004.
[22] D. Song, R. Malan, and R. Stone. A snapshot of global Inter-net worm activity. FIRST Conference on Computer SecurityIncident Handling and Response 2002, June 2002.
[23] D. Song, R. Malan, and R. Stone. A snapshot of global In-ternet worm activity. Arbor Network Technical Report, June2002.
[24] L. Spitzner.Honeypots: Tracking Hackers. Addison-Wesley,2002.
[25] L. Spitzner et al. The honeynet project.http://project.honeynet.org/, June 2004.
[26] S. Staniford, V. Paxson, and N. Weaver. How to 0wn the In-ternet in your spare time. InProceedings of the 11th USENIXSecurity Symposium. USENIX, Aug. 2002.
[27] W. R. Stevens.TCP/IP Illustrated, Volume 1: The Protocols.Addison Wesley, 1994.
[28] J. Stewart. [full-disclosure] [fwd: [th-research] bagle re-mote uninstall].http://lists.netsys.com/pipermail/full-disclosure/2004-January/015970.html, Jan-uary 2004.
[29] R. Stone. CenterTrack: An IP overlay network for trackingDoS floods, 2000.
[30] Symantec. Security Response - W32.Beagle.A.http://securityresponse.symantec.com/avcenter/venc/data/[email protected], 2004.
[31] I. Trend Micro. WORM AGOBOT.GEN - Descriptionand solution. http://www.trendmicro.com/vinfo/virusencyclo/default5.asp?VName=WORM_AGOBOT.GEN, 2003.
[32] P. B. Vinod Yegneswaran and D. Plonka. On the design anduse of Internet sinks for network abuse monitoring. InRe-cent Advances in Intrusion Detection—Proceedings of the7th International Symposium (RAID 2004), Sophia Antipo-lis, French Riviera, France, Oct. 2004.
[33] N. Weaver, V. Paxson, S. Staniford, and R. Cunningham. ATaxonomy of Computer Worms. InProc of ACM CCS Work-shop on Rapid Malcode, pages 11–18. ACM Press, October2003.
[34] V. Yegneswaran, P. Barford, and S. Jha. Global intrusiondetection in the DOMINO overlay system. InProceedings ofNetwork and Distributed System Security Symposium (NDSS’04), San Diego, CA, February 2004.