The International Journal of Biostatistics - Wharton Statistics
22
The International Journal of Biostatistics Volume 6, Issue 2 2010 Article 4 C AUSAL I NFERENCE Evaluating the Efficacy of a Malaria Vaccine Dylan S. Small * Jing Cheng † Thomas R. Ten Have ‡ * University of Pennsylvania, [email protected] † University of Florida, [email protected]fl.edu ‡ University of Pennsylvania, [email protected] Copyright c 2010 The Berkeley Electronic Press. All rights reserved.
Transcript of The International Journal of Biostatistics - Wharton Statistics

The International Journal ofBiostatistics
Volume 6, Issue 2 2010 Article 4
CAUSAL INFERENCE
Evaluating the Efficacy of a Malaria Vaccine
Dylan S. Small∗ Jing Cheng†
Thomas R. Ten Have‡
∗University of Pennsylvania, [email protected]†University of Florida, [email protected]‡University of Pennsylvania, [email protected]
Copyright c©2010 The Berkeley Electronic Press. All rights reserved.

Evaluating the Efficacy of a Malaria Vaccine∗
Dylan S. Small, Jing Cheng, and Thomas R. Ten Have
Abstract
Malaria is a major public health problem. An effective vaccine against malaria is activelybeing sought. We formulate a potential outcomes definition of the efficacy of a malaria vaccine forpreventing fever. A challenge in estimating this efficacy is that there is no sure way to determinewhether a fever was caused by malaria. We study the properties of two approaches for estimatingefficacy: (1) use a deterministic case definition of a malaria caused fever as the conjunction offever and parasite density above a certain cutoff; (2) use a probabilistic case definition in whichthe probability that each fever was caused by malaria is estimated. We compare these approachesin a simulation study and find that both approaches can potentially have large biases. We suggesta strategy for choosing an estimator based on the investigator’s prior knowledge about the area inwhich the trial is being conducted and the range of vaccine efficacies over which the investigatorwould like the estimator to have good properties.
KEYWORDS: causal inference, case definition, attributable fraction
∗This work was supported by National Institute of Mental Health grant R01MH078016.

1 IntroductionMalaria is a giant killer of children (over one million deaths per year (World HealthOrganization, 2005)), imposes financial hardships on poor households and holdsback economic growth (World Health Organization, 1999). Symptoms of malariainclude fever, vomiting, shivering, anemia, retinal damage and coma (in severecases). Fever is the most common symptom of malaria and a vaccine that protectedagainst fever caused by malaria would be considered valuable for public health(Moorthy, Reed and Smith, 2007). In this paper, we consider the challenges ofevaluating the efficacy of a malaria vaccine for preventing fever and study the prop-erties of proposed approaches. An excellent reference for issues related to measur-ing malaria vaccine efficacy, which this paper builds on, is the WHO Study Groupon Measures of Malaria Vaccine Efficacy report (Moorthy et al., 2007).
For a vaccine against an infectious agent, vaccine efficacy is defined roughlyas the reduction in incidence of the disease due to the infectious agent if everyonetook the vaccine (as opposed to a placebo) compared to the incidence of the diseasedue to the infectious agent under the placebo (Hudgens, Gilbert and Self, 2004).We give a precise causal definition of vaccine efficacy in Section 2.
Lachenbruch (1998) showed that if some people who do not have the dis-ease due to the infectious agent are misclassified as having the disease due to theinfectious agent (i.e., specificity is less than 1), then vaccine efficacy estimates willbe biased downwards. This result poses challenges for estimating the efficacy ofa malaria vaccine. In settings in which the malaria parasite is endemic, it is diffi-cult to determine whether a child suffering from a fever is suffering from a fevercaused by malaria parasites or a fever caused by a different infectious agent (Smith,Schellenberg and Hayes, 1994). Fevers caused by malaria parasites often cannotbe distinguished on the basis of clinical features from fevers caused by other com-mon childhood infections such as the common cold, pneumonia, influenza, viralhepatitis or typhoid fever (Hommel, 2002; Koram and Molyneux, 2007). One aidto deciding whether a fever is caused by malaria parasites or some other infectionis to measure the density of malaria parasites in the child’s blood. However, in ar-eas where malaria is endemic, children can develop partial immunity to the toxiceffects of the parasites and can tolerate high parasite densities without developingfever (Marsh, 2002; Boutlis, Yeo and Antsey, 2006). Thus, even if a child has feverand has a high parasite density, the fever might still be caused by another infection.In summary, there is no current perfect case definition of a fever caused by malariathat has specificity 1 and sensitivity 1.
Two types of case definitions have been proposed for a fever caused bymalaria. One is an imperfect, but deterministic case definition. The WHO StudyGroup on Measures of Malaria Vaccine Efficacy (Moorthy et al., 2007) recommends
1
Small et al.: Evaluating the Efficacy of a Malaria Vaccine
Published by The Berkeley Electronic Press, 2010

using as a case definition the conjunction of fever and a parasite density above acertain cutoff. For example, Alonso et al. (2004) and Bejon et al. (2008) used acutoff of 2,500 parasites per µl. An alternative to an imperfect, deterministic casedefinition of a malaria caused fever is to estimate the probability that a fever wascaused by malaria and use a probabilistic case definition. Smith, Schellenberg andHayes (1994) proposed a logistic regression approach for estimating the probabilitythat a child’s fever is malaria caused based on the child’s parasite density.
We compare in a simulation study the two approaches of using an imperfect,deterministic case definition and a probabilistic case definition for estimating theefficacy of a malaria vaccine. Rogers et al. (2006) and Smith (2007) have alsocompared these two approaches. Our simulation study differs from theirs in thatwe include in the simulation study model the phenomenon that fever due to aninfectious agent other than malaria parasites can reduce malaria parasite density(Kwiatkowski, 1989; Long et al., 2001; Rooth and Bjorkman, 1992).
In Section 2, we provide a causal definition of vaccine efficacy in terms ofpotential outcomes. In Section 3, we provide a causal diagram for how a vaccineand other factors might affect fever. In Section 4, we discuss deterministic andprobabilistic case definitions of malaria caused fever and how they are used to esti-mate vaccine efficacy. In Section 5, we compare the two approaches in a simulationstudy. In Section 6, we provide discussion.
2 Potential Outcomes Definition of Vaccine EfficacyBefore defining vaccine efficacy, we first define what we mean by a fever that iscaused by malaria parasites. Let Y (p)
i be child i’s potential fever outcome under theplacebo, Y (p)
i = 1 if child i would have a fever if given the placebo and Y (p)i = 0 if
child i would not have a fever if given the placebo. Let Y (e)i be child i’s potential
fever outcome if malaria parasites were eradicated from the world. We say that achild i who has a fever (under the placebo) has a malaria caused fever if the feverwould be eliminated by eradicating malaria, i.e., child i has a malaria caused feverif Y (p)
i = 1,Y (e)i = 0.
Let Y (v)i denote child i’s potential fever outcome if the child would take
the vaccine. We define the vaccine efficacy in a population as the reduction in thenumber of children who would have fever if all children took the vaccine comparedto if all children took the placebo divided by the number of children who wouldhave a malaria caused fever if all children took the placebo:
V E =P(Y (p)
i = 1)−P(Y (v)i = 1)
P(Y (p)i = 1,Y (e)
i = 0). (1)
2
The International Journal of Biostatistics, Vol. 6 [2010], Iss. 2, Art. 4
http://www.bepress.com/ijb/vol6/iss2/4DOI: 10.2202/1557-4679.1201

V E ranges from (−∞,1] with a V E of 1 indicating that the vaccine is as effectiveas eradicating malaria, a V E greater than zero indicating that the vaccine is moreeffective than the placebo, V E equal to zero indicating that the vaccine is equivalentto the placebo and V E less than zero indicating that the vaccine is worse than theplacebo.
Another way to think about what V E is measuring is the following. Let RPbe the risk of fever under the placebo and RV be the risk of fever under the vaccine.Then,
V E =RP by all causes−RV by all causes
RP by malaria,
where “by all causes,” we mean fever due to any cause, not just malaria. Considerthe assumption that the vaccine does not affect the probability of a fever from causesother than malaria, i.e.,Assumption (A-1):
P(Y (p)i = 1,Y (e)
i = 1) = P(Y (v)i = 1,Y (e)
i = 1).
Under (A-1), V E is equal to the effect of the vaccine on preventing malaria causedfevers, which we denote by V E∗,
V E∗ =RP by malaria−RV by malaria
RP by malaria
=P(Y (p)
i = 1,Y (e)i = 0)−P(Y (v)
i = 1,Y (e)i = 0)
P(Y (p)i = 1,Y (e)
i = 0). (2)
The equivalence of V E and V E∗ under assumption (A-1) is illustrated in Figure 1.In Figure 1, V E = 0.7−0.5
0.5 = 0.4 and V E∗ = 0.5−0.30.5 = 0.4.
We prefer to use V E rather than than V E∗ as our definition of vaccine ef-ficacy because when assumption (A-1) fails and the vaccine affects the probabilityof a non-malaria caused fever, we would like to include this effect in the mea-sure of vaccine efficacy. A vaccine may cause fever by a variety of mechanisms(Follmann, Fay and Proschan, 2009): (a) some vaccines are live but weakenedpathogens and the weakened pathogen can produce an infection in a weakenedhost; (b) vaccine induced antibodies may enhance rather than reduce the chanceof disease (Burke, 1992); or (c) vaccines might induce an auto-immune reactionwhich could hamper the ability of the immune system to fight disease. As an ex-ample, consider a vaccine that prevents 10% of malaria caused fevers but causes10{RP by malaria/(1−RP by all causes)}% of the people without fevers under theplacebo to have a fever. Then V E = 0 but V E∗= 0.1. This vaccine is not preventing
3
Small et al.: Evaluating the Efficacy of a Malaria Vaccine
Published by The Berkeley Electronic Press, 2010

Placebo Vaccine
Treatment Groups
Pro
babi
lity
of F
ever
0.0
0.2
0.4
0.6
0.8
1.0
MalariaOthers
Figure 1: Illustration of equivalence of V E and V E∗ under assumption (A-1).
fevers so we think V E = 0 is a better measure of the overall public health benefit ofthe vaccine than V E∗ = 0.1.
A problem with both V E and V E∗ is that the denominator RP by malaria isnot identifiable without assumptions that go beyond just randomization of vaccineand placebo; we discuss this nonidentifiability in Section 4.2. A quantity that isidentifiable from a randomized trial without further assumptions is the proportionof all fevers that are prevented by the vaccine, which we denote by V E.All,
V E.All =RP by all causes−RV by all causes
RP by all causes=
P(Y (p)i = 1)−P(Y (v)
i = 1)
P(Y (p)i = 1)
.
V E.All measures the impact of the vaccine on the trial population and is hence ofconsiderable interest. However, V E.All does not address the following questionthat is addressed by V E: Is the vaccine preventing most malaria-caused fevers (V Eclose to 1) or is there considerable room for improving the vaccine? For example,suppose V E.All is 0.2. This could mean that the vaccine is not that effective andcould be considerably improved, or it could mean that the vaccine is very effec-tive, preventing most malaria caused fevers, but that most fevers in the area are notmalaria caused. Another question of interest that requires knowing both V E andV E.All is the following: What impact would we expect the vaccine to have on apopulation in which malaria accounts for a different proportion of fevers than in thetrial population? Thus, both V E and V E.All are important quantities in assessing avaccine.
4
The International Journal of Biostatistics, Vol. 6 [2010], Iss. 2, Art. 4
http://www.bepress.com/ijb/vol6/iss2/4DOI: 10.2202/1557-4679.1201

3 Causal Diagram for the Effect of a VaccineTo better understand the properties of different estimators of the efficacy of a malariavaccine, it is helpful to consider a causal diagram for how a vaccine and other causesaffect fever. Figure 2 depicts a causal diagram. The bottom row of the figure showshow malaria parasites cause fever. First, a person needs to be bitten by a mosquitocarrying malaria parasites. When the mosquito takes its blood meal, it injects theparasites into the person. The parasites then go to the person’s liver where theydevelop and replicate. While in the liver, the parasites do not cause any clinicalsymptoms. After several days, the parasites escape from the liver into the blood.The parasites attack red blood cells, replicate within the red blood cells, burst thered blood cells and attack further red blood cells. If uncontrolled, the parasiteswill keep multiplying and keep destroying red blood cells, eventually causing se-vere anemia. The parasite density measures the density of parasites in the blood ata given time. As the parasites replicate, they are thought to release toxins which,when built up enough, cause fever. For good discussion of the malaria parasite lifecycle and its effects on humans, see Warrell, Turner and Francis (2002) and Sindenand Gilles (2002).
There are several types of vaccines being developed that aim to interruptvarious parts of how malaria parasites cause fever and other symptoms. One type ofvaccine (pre-erythrocytic) aims to attack the parasites in the liver and prevent themfrom entering the blood. Another type of vaccine (erythrocytic) aims to reducethe multiplication of parasites once they have entered the blood. A third type ofvaccine (anti-toxic) does not aim to reduce the parasites but aims to reduces thetoxins created by the parasites.1 Vaccines are also being investigated that combinedifferent components of these three types of vaccines. Figure 2 depicts how thevaccine can affect the parasites’ development in the liver, the parasites’ replicationin the blood and the parasites’ release of toxins by the lines between the vaccine
1Some of the parasites in the blood move to a dormant stage. If a mosquito bites a person withthe parasites, the dormant parasite continue their life cycle in the mosquito and then can infect anew person when the mosquito bites a new person. A fourth type of vaccine (transmission blocking)targets the dormant parasites in the bloodstream. It does not help the person with malaria herself butaims to reduce transmission in the community.
and the boxes representing each of these three stages of parasite activity. For agood review of recent work on malaria vaccines, see Girard et al. (2007).
Other infections that causes fever, such as common cold, pneumonia, in-fluenza, viral hepatitis or typhoid fever, are depicted by the box on the top of Figure2 as non-malaria infections. There may be unmeasured common causes betweenthe non-malaria infections and any stage of parasite development. For example,there may be unmeasured socioeconomic variables that make a child more vulner-
5
Small et al.: Evaluating the Efficacy of a Malaria Vaccine
Published by The Berkeley Electronic Press, 2010

able to being bit by a mosquito carrying malaria parasites (e.g., a family with lowsocioeconomic status may be less likely to purchase a bed net) and more vulnerableto non-malaria infections.
As discussed in Section 2, it is possible that the vaccine causes non-malariainfections and non-malaria caused fevers. This is reflected in Figure 2 by the linesbetween the vaccine box and the non-malaria infections and fever boxes.
One additional causal relationship that is depicted in Figure 2 is that feveritself causes a reduction in parasite density; this is depicted by the line betweenthe fever box and the parasites replicate box. There is in vitro evidence that hightemperatures inhibit parasite growth (Kwiatkowski, 1989; Long et al., 2000) and invivo evidence that parasite density is suppressed during the febrile illnesses measlesand influenza (Rooth and Bjorkman, 1992).
4 Estimators of Vaccine EfficacyWe discuss the properties of the two currently used approaches to estimating vac-cine efficacy. Both consist of substituting estimates of RP by malaria and RV bymalaria into (2) for V E∗. Recall that under assumption (A-1), V E∗ is equal to V E.Both approaches estimate RP by malaria and RV by malaria by using a “case defini-tion” of a malaria caused fever: the first method uses a deterministic case definitionwhile the second method uses a probabilistic case definition.
4.1 Deterministic Case Definition
The most commonly used deterministic case definition of malaria caused fever is theconjunction of fever and a parasite density above a cutoff c. For example, Alonso etal. (2004) and Bejon et al. (2008) used a cutoff of 2,500 parasites per µl and Sagaraet al. (2009) used a cutoff of 3,000 parasites per µl. Because of variation in nat-ural and acquired immunity, there is considerable variation in children’s pyrogenicthresholds, the minimum parasite density at which the parasites will cause a childto have a fever (Marsh, 2002). Consequently a case definition of the conjunction
2Using the definition of malaria caused fever in Section 2, the child would only be a false negative
if she does not also have another fever causing infection.
of fever and parasite density above 2,500 µl will include some false positives, chil-dren who have a fever and a parasite density above 2,500 µl but who are toleratingthe parasites and only have a fever because of another infectious agent. The casedefinition will also miss some false negatives, children whose pyrogenic thresh-old and actual parasite density is below 2,500 but who have parasite densities thatare greater than their pyrogenic thresholds and thus have fevers that are caused bymalaria parasites.2
6
The International Journal of Biostatistics, Vol. 6 [2010], Iss. 2, Art. 4
http://www.bepress.com/ijb/vol6/iss2/4DOI: 10.2202/1557-4679.1201

Mosquito takes blood
meal(injects
parasites)
Parasites develop in
liver Parasites
Parasites enter blood and replicate(parasite density measures amount of
parasites)Parasites
Parasites in blood release toxins
Fever
Vaccine/Placebo
Non‐malariainfections
Measured and
unmeasured common causes
Figure 2: Causal Diagram of the Effects of Vaccine and Other Causes on Fever
Rogers et al. (2006) and Smith (2007) study the use of case definitions ofthe conjunction of fever and parasite density above a certain cutoff c for estimat-ing vaccine efficacy. Both papers show in simulation studies that estimated vaccineefficacies depend heavily on the cutoff. Here, we present a formula for the asymp-totic bias of the estimator ˆV E(c) that uses the deterministic case definition of theconjunction of fever and a parasite density above c. As the sample size from arandomized trial converges to ∞, ˆV E(c) converges in probability to
V E(c) = 1− P(Y (v) = 1,D(v) > c)P(Y (p) = 1,D(p) > c)
,
where D(v) and D(p) denote the potential parasite densities under the vaccine andplacebo respectively. Let SEP be the sensitivity of the cutoff c for detecting malaria-caused fevers under the placebo, SEP = P(D(p) > c|Y (p) = 1,Y (e) = 0); SPP be thespecificity of the cutoff c for detecting non-malaria caused fevers under the placebo,SPP = P(D(p) ≤ c|Y (p) = 1,Y (e) = 1); SEV be the sensitivity under the vaccine,
7
Small et al.: Evaluating the Efficacy of a Malaria Vaccine
Published by The Berkeley Electronic Press, 2010

SEV = P(D(v) > c|Y (v) = 1,Y (e) = 0); and SPV be the specificity under the vaccine,SPV = P(D(v) ≤ c|Y (v) = 1,Y (e) = 1). Then,
V E(c) =1−
P(Y (v) = 1,Y (e) = 0)+P(Y (v) = 1,Y (e) = 1,D(v) > c)−P(Y (v) = 1,Y (e) = 0,D(v) ≤ c)P(Y (p) = 1,Y (e) = 0)+P(Y (p) = 1,Y (e) = 1,D(p) > c)−P(Y (p) = 1,Y (e) = 0,D(p) ≤ c)
=
1− P(Y (v) = 1,Y (e) = 0)(SPV +SEV −1)+P(Y (v) = 1)(1−SPV )P(Y (p) = 1,Y (e) = 0)(SPP +SEP−1)+P(Y (p) = 1)(1−SPP)
.
Under assumption (A-1) that the vaccine does not cause fevers, the asymptotic biasof V E(c) is
V E(c)−V E =
P(Y (v) = 1,Y (e) = 0)P(Y (p) = 1,Y (e) = 0)
− P(Y (v) = 1,Y (e) = 0)(SPV +SEV −1)+P(Y (v) = 1)(1−SPV )P(Y (p) = 1,Y (e) = 0)(SPP +SEP−1)+P(Y (p) = 1)(1−SPP)
.
The WHO Study Group on Measures of Malaria Vaccine Efficacy (Moorthyet al., 2007) recommended choosing the cutoff c so that the specificity is at least 0.8.However, the asymptotic bias depends on the specificity and sensitivity under boththe placebo and vaccine arms. Furthermore, the variance of ˆV E(c) is a complicatedfunction of θ = (P(Y (v) = 1,Y (e) = 0), P(Y (p) = 1,Y (e) = 0), SPV , SEV , SPP,SEP).Therefore, we recommend that if a deterministic cutoff is used, it should be chosenbased on considering the estimated root mean squared error and power under apreliminary estimate(s) of θ . This is illustrated in Section 6 (see Figure 8).
4.2 Using Probabilistic Case Definitions to Estimate Vaccine Ef-ficacy
Rogers et al. (2006) and Smith (2007) suggest as an alternative to using an imper-fect, deterministic case definition of a malaria caused fever to instead estimate theprobability that a fever was caused by malaria and use these estimated probabilitiesto estimate RP and RV .
Smith, Schellenberg and Hayes (1994) proposed the following probabilisticcase definition of malaria caused fever: if child i on the placebo arm has a fever,then the probability that it is malaria caused is
pi =P(Y (p)
i = 1|D = Di,X = Xi)−P(Y (p)i = 1|D = 0,X = Xi)
P(Y (p)i = 1|D = Di,X = Xi)
, (3)
8
The International Journal of Biostatistics, Vol. 6 [2010], Iss. 2, Art. 4
http://www.bepress.com/ijb/vol6/iss2/4DOI: 10.2202/1557-4679.1201

where Xi are measured covariates such as age and season and Di is measured para-site density. The same case definition holds for the vaccine arm with Y (v)
i replacingY (p)
i in (3). The intuition behind (3) is the following: (a) all fevers for children withD = 0 are assumed to come from non-malaria fever causing infections; (b) if para-site densities Di are independent of non-malaria infections conditional on Xi, thenthe probability of a non-malaria fever causing infection for a child with D = Di isthe same as for a child with D = 0 and thus equals P(Y (p)
i = 1|D = 0,X = Xi); (c)thus, the difference between the probability of a fever given D = Di and the proba-bility of a fever given D = 0 represents the proportion of children with D = Di andX = Xi who have malaria caused fever. Small (2009) provides more discussion.
A key assumption for (3) to provide the correct probability of child i havinga malaria caused fever is that the parasite densities Di are independent of non-malaria fever causing infections conditional on Xi. However, Figure 2 suggests thatthis is not likely to be true. First, there is the problem of unmeasured commoncauses of parasite densities and non-malaria infections. Second, there is the prob-lem that fever due to any cause kills parasites. The consequence of parasites beingkilled by fever is that children with non-malaria fever causing infections tend tohave lower parasite density than children without non-malaria fever causing infec-tions.
5 Simulation StudyIn our simulation study, we will consider four important factors that may affect theperformance of estimators of vaccine efficacy:
1. Type of vaccine: The two most common types of vaccines that are being de-veloped are (1) pre-erythrocytic (pre-blood stage) vaccines that seek to pre-vent the malaria parasites from entering an infected person’s blood; (2) ery-throcytic (blood stage) vaccines that seek to slow the replication of malariaparasites after the parasites have entered the blood (Girard et al., 2007). Smith(2007) found that the type of vaccine affected the performance of differentestimators. Following Smith, we will consider one pre-erythrocytic stagevaccine and one erythrocytic vaccine:• Pre-erythrocytic (pre-blood stage) vaccine. This vaccine eliminates 50%
of malaria infections. For simplicity, this is assumed to be reflected in a50% reduction in the proportion of children who are infected across therange of parasite densities.• Erythrocytic (blood stage) vaccine. This vaccine reduces parasite densi-
ties by 50% but does not affect the number of children who are infected.
9
Small et al.: Evaluating the Efficacy of a Malaria Vaccine
Published by The Berkeley Electronic Press, 2010

2. Endemicity: Areas differ greatly in how endemic the malaria parasites are,i.e., how high the rate of infection with malaria parsites is. This could have asubstantial impact on various estimators, in particular the deterministic casedefinition estimators since the specificity and sensitivity of the case defini-tion varies with the endemicity. We consider three levels of endemicity:mesoendemic (low to moderate), hyperendemic (medium high) and holoen-demic (high). We define specifically the levels of endemicity we considerbelow.
3. Effect of fever on parasites: One reason that the probabilistic case definitionestimators of vaccine efficacy may be biased is that fever due to any causekills parasites, as discussed in Section 3. Although there is both in vitro andin vivo evidence for this phenomenon, as cited in Section 3, there are nodefinitive studies of the proportion of parasites that fever kills in field set-tings. Long et al. (2001) estimated that in vitro, parasite growth was reducedby 50% at 101.8◦F and 92% at 104◦F. We consider three ranges of effectof fever on parasites: large fever effect (fever kills approximately 90% ofparasites), moderate fever effect (fever kills approximately 50% of parasites)and no fever effect (fever kills no parasites). Although we do not think theno effect assumption is realistic, we include it for comparison because mostprevious work on malaria vaccine efficacy has assumed no effect.
4. Sample size: We consider two sample sizes, 1,000 children on each arm and10,000 children on each arm. Preliminary explorations indicated that the es-timators differed in their finite sample biases.
We conduct a 2× 3× 3× 2 factorial experiment to investigate the effect of thesefactors on the performance of different estimators of vaccine efficacy.
Figure 3 describes our simulation study in a causal diagram. Specifically,we generate the data as follows:
1. We randomly assign n children to the placebo and n children to the vaccinearm (either the pre-erythrocytic or erythrocytic vaccine), where n = 1,000 orn = 10,000.
2. A child can get fever through two sources: malaria infection (MI) or non-malaria infection (NMI). Let Y MI
i = 1 if child i has a malaria infection strongenough to cause a fever, 0 if not and Y NMI
i = 1 if child i has a non-malaria in-fection strong enough to cause a fever, 0 if not. The non-malaria and malariainfections are assumed to operate like parallel circuits in causing a fever sothat child i is observed to have a fever, Yi = 1, if and only if Y MI
i +Y NMIi ≥ 1.
3. Let Di be child i’s observed parasite density and DNo.NMIi be the parasite den-
sity that child i would have if the child did not have a non-malaria infection
10
The International Journal of Biostatistics, Vol. 6 [2010], Iss. 2, Art. 4
http://www.bepress.com/ijb/vol6/iss2/4DOI: 10.2202/1557-4679.1201

Vaccine/Placebo
Non-malaria infections
(NMI)
Parasite density(D)
Fever(Y)
Malaria infection(MI)
Erythrocytic
VaccinePre-erythrocytic
Vaccine
Figure 3: Causal diagram describing the simulation study.
strong enough to cause a fever. Di might not equal DNo.NMIi because fever can
kill parasites. We can think of DNo.NMIi as the parasitological challenge faced
by the child that arises from the amount that malaria-carrying mosquitoes bitethe child and the immune response of the child. We assume that Di = DNo.NMI
iunless Y NMI
i = 1,Y MIi = 0. This is because when Y NMI
i = 1,Y MIi = 1 or
Y NMIi = 0,Y MI
i = 1, then child i would have a fever even if she did not have anon-malaria infection and so the effect of fever killing parasites on the childwould be the same in a world without non-malaria infections as in the actualworld so that Di = DNo.NMI
i ; also, if Y NMIi = 0,Y MI
i = 0, then child i wouldnot have a fever in both a world without non-malaria infections and the actualworld so that fever killing parasites has no effect in either world and con-sequently Di = DNo.NMI
i . When Y NMIi = 1,Y MI
i = 0, then in the absence of anon-malaria infection, child i would not have a fever and then parasites wouldnot have been killed by the fever so that DNo.NMI
i might be greater than Di.The effect of fever on parasite density is represented by the arrow from feverto parasite density in Figure 3. We consider three magnitudes of effect offever on parasite density:• No fever effect: Di = DNo.NMI
i when Y NMIi = 1,Y MI
i = 0.• Moderate fever effect: Di = kiDNo.NMI
i when Y NMIi = 1,Y MI
i = 0 whereki ∼ Beta(5,5), i.e., on average, fever kills 50% of parasites.• Large fever effect: Di = kiDNo.NMI
i when Y NMIi = 1,Y MI
i = 0 where ki ∼Beta(1,9), i.e., on average, fever kills 90% of parasites.
4. The probability that DNMIi = 0 is determined by the endemicity level. We
consider three levels of endemicity:
11
Small et al.: Evaluating the Efficacy of a Malaria Vaccine
Published by The Berkeley Electronic Press, 2010

• Holoendemic: The probability that a child is infected with malaria par-asites in the placebo arm is 0.8.• Hyperendemic: The probability that a child is infected with malaria
parasites in the placebo arm is 0.5.• Mesoendemic: The probability that a child is infected with malaria par-
asites in the placebo arm is 0.2.For children infected with malaria parasites, we assume that the distributionof DNMI
i is that shown in Figure 4. This distribution was chosen to approxi-mate the distribution found in a study in the Kilombero District (Morogoro)Region of Tanzania that was analyzed in Smith, Schellenberg and Hayes(1994).
5. Based on the estimates of the probability of malaria caused fever in Smith,Schellenberg and Hayes (1994) for the study mentioned above in the Kilo-mbero District of Tanzania, we set P(Y NMI
i ) = 0.06 and
P(Y MIi |DNo.NMI
i ) =exp(.000027DNo.NMI
i )1+ exp(.000027DNo.NMI
i ).
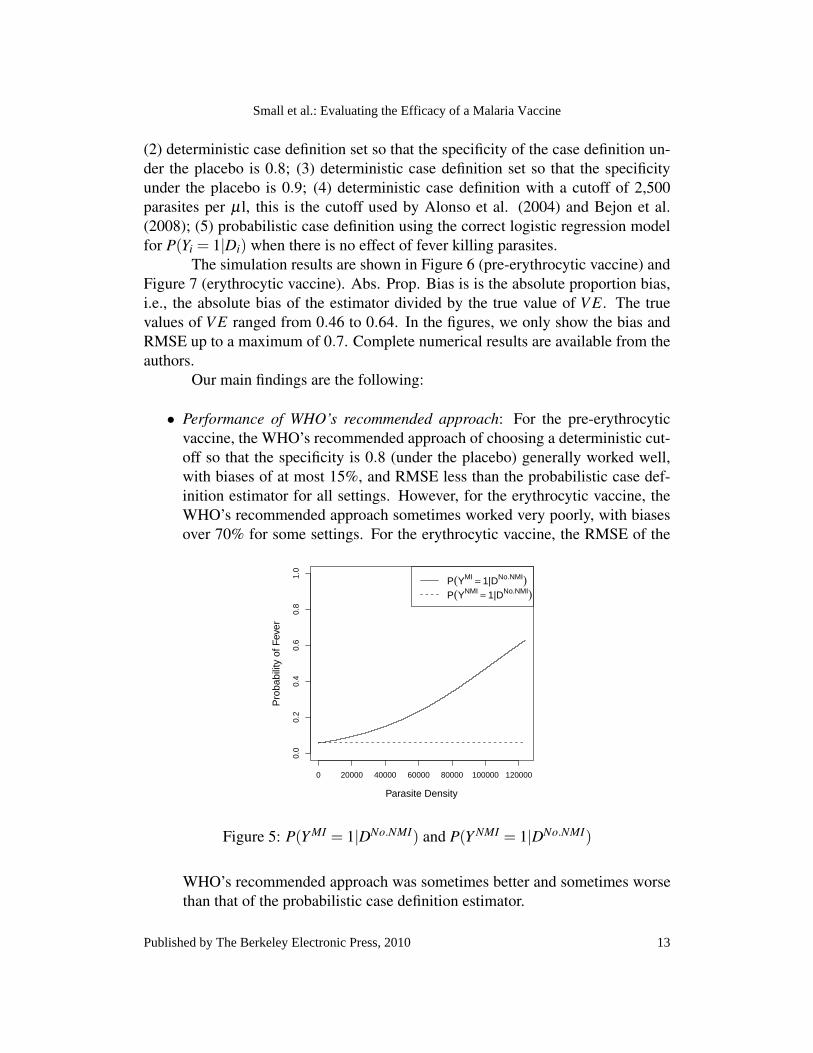
The P(Y MIi ) and P(Y NMI
i ) are plotted in Figure 5.
The R code for our simulation study is available from the authors.We consider five estimators of vaccine efficacy: (1) deterministic case def-
inition set so that the specificity of the case definition under the placebo is 0.7;
0 20000 40000 60000 80000 100000 120000
0e+
001e
−04
2e−
043e
−04
4e−
04
Parasite Density
Pro
babi
lity
Den
sity
Figure 4: Probability Density of DNMI conditional on a child being infected(DNMI > 0) under the placebo.
12
The International Journal of Biostatistics, Vol. 6 [2010], Iss. 2, Art. 4
http://www.bepress.com/ijb/vol6/iss2/4DOI: 10.2202/1557-4679.1201
(2) deterministic case definition set so that the specificity of the case definition un-der the placebo is 0.8; (3) deterministic case definition set so that the specificityunder the placebo is 0.9; (4) deterministic case definition with a cutoff of 2,500parasites per µl, this is the cutoff used by Alonso et al. (2004) and Bejon et al.(2008); (5) probabilistic case definition using the correct logistic regression modelfor P(Yi = 1|Di) when there is no effect of fever killing parasites.
The simulation results are shown in Figure 6 (pre-erythrocytic vaccine) andFigure 7 (erythrocytic vaccine). Abs. Prop. Bias is is the absolute proportion bias,i.e., the absolute bias of the estimator divided by the true value of V E. The truevalues of V E ranged from 0.46 to 0.64. In the figures, we only show the bias andRMSE up to a maximum of 0.7. Complete numerical results are available from theauthors.
Our main findings are the following:
• Performance of WHO’s recommended approach: For the pre-erythrocyticvaccine, the WHO’s recommended approach of choosing a deterministic cut-off so that the specificity is 0.8 (under the placebo) generally worked well,with biases of at most 15%, and RMSE less than the probabilistic case def-inition estimator for all settings. However, for the erythrocytic vaccine, theWHO’s recommended approach sometimes worked very poorly, with biasesover 70% for some settings. For the erythrocytic vaccine, the RMSE of the
0 20000 40000 60000 80000 100000 120000
0.0
0.2
0.4
0.6
0.8
1.0
Parasite Density
Pro
babi
lity
of F
ever
P(YMI = 1|DNo.NMI)P(YNMI = 1|DNo.NMI)
Figure 5: P(Y MI = 1|DNo.NMI) and P(Y NMI = 1|DNo.NMI)
WHO’s recommended approach was sometimes better and sometimes worsethan that of the probabilistic case definition estimator.
13
Small et al.: Evaluating the Efficacy of a Malaria Vaccine
Published by The Berkeley Electronic Press, 2010

• Comparison of deterministic case definitions of different specificities: Formost settings, the estimators based on deterministic case definitions set tohave specificities 0.7, 0.8 and 0.9 performed similarly. For the pre-erythrocyticvaccine in the mesoendemic setting with no or moderate fever effects andn = 1,000, the specificity 0.7 and 0.8 estimators were somewhat better thanthe specificity 0.9 estimator. However, for these same settings for the ery-throcytic vaccine, the specificity 0.9 estimator was somewhat better thanthe specificity 0.7 and 0.8 estimators (not only for n = 1,000 but also forn = 10,000). The specificity 0.9 estimator was also somewhat better thanthe 0.7 and 0.8 estimators for the erythrocytic vaccine in the hyperendemicsettings with n = 10,000.• Performance of cutoff of 2,500 parasites per µl: For the pre-erythrocytic
vaccine, the deterministic cutoff of 2,500 parasites per µl worked reasonablywell in the holoendemic and hyperendemic settings, but did not work well formesoendemic settings with sample size n = 1,000 per arm, especially whenthere was a large fever effect. For the erythrocytic vaccine, the determinis-tic cutoff of 2,500 also performed poorly in these settings. In addition, forthe erythrocytic vaccine, the deterministic cutoff of 2,500 was substantiallyworse than the WHO’s recommended approach for the holoendemic settingwith no fever effect for both n = 1,000 and n = 10,000 and for the holoen-demic setting with a moderate fever effect for n = 1,000.• Finite sample bias of probabilistic case definition estimator: The probabilis-
tic case definition estimator sometimes exhibited large finite sample biasesfor n = 1,000 that were reduced substantially for n = 10,000. When thereis no fever effect, the probabilistic case definition estimator is consistent; seeSection 4.2. The consistency is apparent for n = 10,000 for which the biasesof the probabilistic case definition estimator when there is no fever effect areall less than 5%. However, for n = 1,000, the biases were sometimes large,above 70% for the pre-erythrocytic vaccine in the mesoendemic setting andabove 10% for the pre-erythrocytic vaccine in the holoendemic and hyperen-demic settings and for the erythrocytic vaccine in the mesoendemic setting.
6 DiscussionWe have provided a potential outcomes definition of the efficacy of a malaria vac-cine and studied the properties of two methods for estimating the efficacy, (1) usingan imperfect deterministic case definition of the conjunction of fever and parasitedensity above a certain cutoff and (2) using a probabilistic case definition that aimsto estimate the probability that a child with fever has a malaria caused fever. Wehave shown that both methods potentially have large biases.
14
The International Journal of Biostatistics, Vol. 6 [2010], Iss. 2, Art. 4
http://www.bepress.com/ijb/vol6/iss2/4DOI: 10.2202/1557-4679.1201

Legend
Absolute Proportion Bias (n=1,000)
RMSE (n=1,000)
Absolute Proportion Bias (n=10,000)
RMSE (n=10,000)
Figure 6: Simulation results for pre-erythrocytic vaccine. Bias is the absolute pro-portion bias. If the bias or RMSE was above 0.7, only a maximum of 0.7 is shownin the plots.
15
Small et al.: Evaluating the Efficacy of a Malaria Vaccine
Published by The Berkeley Electronic Press, 2010

Legend
Absolute Proportion Bias (n=1,000)
RMSE (n=1,000)
Absolute Proportion Bias (n=10,000)
RMSE (n=10,000)
Figure 7: Simulation results for erythrocytic vaccine. Bias is the absolute propor-tion bias. If the bias or RMSE was above 0.7, only a maximum of 0.7 is shown inthe plots.
16
The International Journal of Biostatistics, Vol. 6 [2010], Iss. 2, Art. 4
http://www.bepress.com/ijb/vol6/iss2/4DOI: 10.2202/1557-4679.1201

0 5000 10000 15000 20000
0.1
0.3
0.5
0.7
RMSE for different cutoffs
Cutoff Parasite Density
RM
SE
Vaccine reduces parasite density by 20%Vaccine reduces parasite density by 50%Vaccine reduces parasite density by 80%
0 5000 10000 15000 20000
−0.
8−
0.4
0.0
Proportion Bias for different cutoffs
Cutoff Parasite Density
Pro
poor
tion
Bia
s
Vaccine reduces parasite density by 20%Vaccine reduces parasite density by 50%Vaccine reduces parasite density by 80%Zero Bias
Figure 8: RMSE and proportion biases for different cutoffs for erythrocytic vac-cines in a holoendemic area under the assumption of a moderate fever killing effectwith a sample size of n = 1,000 per arm.
To choose an estimator that will be used for the primary analysis in a clin-ical trial, we suggest that the performance of different estimators over a range ofa different vaccine efficacies be considered. For example, consider an erythrocyticvaccine for a holoendemic area under the assumption of a moderate fever killingeffect with a sample size of n = 1,000 per arm. Figure 8 plots the RMSEs and pro-portion bias of the the deterministic case definition estimators with cutoffs rangingfrom 100 to 10,000 parasites per µl for three vaccines of different efficacies: onevaccine reduces parasite density by 20%, another by 50% and another by 80%. For
17
Small et al.: Evaluating the Efficacy of a Malaria Vaccine
Published by The Berkeley Electronic Press, 2010

vaccines covering this range of efficacies, the cutoff of 2,500 is a reasonable choice– it has about the smallest RMSE over different cutoffs for the vaccines that reduceparasite density by 20% and 50%, and is only a little above the minimum RMSEfor the vaccine that reduces parasite density by 80%.
In addition to choosing one estimator for a primary analysis, a useful sec-ondary analysis is to conduct a sensitivity analysis that displays a range of efficacyestimates over a range of plausible assumptions about how unmeasured commoncauses affect parasite density and non-malaria infections and how much of an effectfever has on killing parasites. Further work needs to be done in developing suchsensitivity analyses
An additional important issue which we have not discussed in this paper ismeasurement error in parasite density. O’Meara, Hall and McKenzie (2007) discussthe difficulties created by measurement error.
7 ReferencesAlonso, P.L, Sacarlal, J., Aponte, J.J., Leach, A., Macete, E., Milman, J., Man-
domando, I., Spiessens, B., Guinovart, C., Espasa, M., Bassat, Q., Aide, P.,Ofori-Anyinam, O., Navia, M.M., Corachan, S., Ceuppens, M., Dubois, M.-C., Demotie, M.-A., Dubovsky, F., Menendez, C., Tornieporth, N., Ballou,W.R., Thompson, R. and Cohen, J. (2004), “Efficacy of the RTS,S/AS02Avaccine against Plasmodium falciparum infection and disease in young Africanchildren: randomised controlled trial, Lancet, 364: 1411-1420.
Bejon, P., Lusingu, J., Olotu, A., Leach, A., Lievens, M., Vekemans, J., Mshamu,S., Lang, T., Gould, J., Dubois, M., Demoitie, M.-A., Stallaert, J.-F., Vansa-dia, P., Carter, T., Njuguna, P., Awuondo, K.O., Malbeja, A., Abdul, O.,Gesase, S., Mturi, N., Drakeley, C.J., Savarese, B., Villafana, T., Ballou,W.R., Cohen, J., Riley, E.M., Lemnge, M.M., Marsh, K. and von Seidlein,L. (2008), “ Efficacy of RTS,S/AS01E Vaccine against Malaria in Children 5to 17 Months of Age,” New England Journal of Medicine, 359: 2521-2532.
Boutlis, C.S., Yeo, T.W. and Antsey, C.M. (2006), “Malaria Tolerance – ForWhom the Cell Tolls,” Trends in Parasitology, 22, 371-377.
Burke, D.S. (1992), “Human HIV vaccine trials: Does antibody dependent en-hancement pose a genuine risk?” Perspectives in Biology and Medicine, 35,511-530.
Follman, D., Fay, M.P. and Proschan, M. (2009), “Chop-lump tests for vaccinetrials,” Biometrics, 65, 885-893.
Girard, M.P., Reed, Z.H., Friede, M. and Kieny, M.P. (2007), “A review of humanvaccine research and development: Malaria,” Vaccine, 25, 1567-1580
18
The International Journal of Biostatistics, Vol. 6 [2010], Iss. 2, Art. 4
http://www.bepress.com/ijb/vol6/iss2/4DOI: 10.2202/1557-4679.1201

Gupta, S., Hill, A.V.S., Kwiatkowski, D., Greenwood, A.M., Greenwood, B.Mand Day, K.P. (1994), “Parasite virulence and disease patterns in Plasmodiumfalciparum malaria,” Proceedings of the National Academy of the Sciences,91, 3715-3719.
Hommel, M. (2002), “Diagnostic methods in malaria,” in Essential Malariology,D.A. Warrell and H.M. Gilles, eds., London: Arnold.
Hudgens, M.G., Gilbert, P.B. and Self, S.G. (2004), “Endpoints in vaccine trials,”Statistical Methods in Medical Research, 13: 89-114.
Koram, K.A. and Molyneux, M.E. (2007), “When is “Malaria” Malaria? TheDifferent Burdens of Malaria Infection, Malaria Disease and Malaria-LikeIllnesses,” American Journal of Tropical Medicine and Hygiene, 77, 1-5.
Kwiatkowski, D. (1989), “Febrile temperatures can synchronize the growth ofPlasmodium falciparum in vitro,” Journal of Experimental Medicine, 169,357-361.
Lachenbruch, P.A. (1998), “Sensitivity, specificity and vaccine efficacy,” Con-trolled Clinical Trials, 19, 569-574.
Long, H.Y., Lell, B., Dietz, K. and Kremsner, P.G. (2001), “Plasmodium falci-parum: in vitro growth inhibition by febrile temperatures,” ParasitologicalResearch, 87, 553-555.
Marsh, K. (2002), “Immunology of Malaria”, in Essential Malariology, D.A. War-rell and H.M. Gilles, eds., London: Arnold
Moorthy, V., Reed, Z. and Smith, P.G. (2007), “Measurement of malaria vaccineefficacy in phase III trials: Report of a WHO consultation Vaccine On behalfof the WHO Study Group on Measures of Malaria Vaccine Efficacy,” Vaccine,25: 5115-5123.
O’Meara WP, Hall BF, McKenzie FE (2007). Malaria vaccine efficacy: the diffi-culty of detecting and diagnosing malaria Malaria Journal 2007, 6:36.
Rogers WO, Atuguba F, Oduro AR, Hodgson A, Koram KA: Clinical case defini-tions and malaria vaccine efficacy. J Infect Dis 2006, 193:467-473.
Rooth, I.B. and Bjorkman, A. (1992), “Suppression of Plasmodium falciparuminfections during concomitant measles or influenza but not during pertussis”American Journal of Tropical Medicine and Hygiene, 47, 675-681.
Sagara, I., Dickoa, A., Ellis, R.D., Fay, M.P., Diawara, I.S., Assadou, M.H., Sis-soko, M.S., Konea, M., Dialloa, A.I., Sayea, R., Guindoa, M.A., Kantea,O., Niambelea, M.B., Miura, K., Mullen, G.E.D., Pierce, M., Martin, L.B.,Doloa, A., Dialloa, D.A., Doumboa, O.K., Miller, L.H., Saul, A. (2009), ”Arandomized controlled phase 2 trial of the blood stage AMA1-C1/Alhydrogelmalaria vaccine in children in Mali,” Vaccine, 27: 3090-3098.
Sinden, R.E. and Gilles, H.M. (2002), “The Malaria Parasites,” in Essential Malar-iology, D.A. Warrell and H.M. Gilles, eds., London: Arnold
19
Small et al.: Evaluating the Efficacy of a Malaria Vaccine
Published by The Berkeley Electronic Press, 2010

Small, D.S. (2009), “Prevalence of malaria attributable fever: definition, inferenceand sensitivity analysis,” working paper.
Smith, T.A. (2007), “Measures of clinical malaria in field trials of interventionsagainst Plasmodium falciparum,” Malaria Journal, 6: 53.
Smith, T.A., Schellenberg, J.A. and Hayes, R. (1994), “Attributable fraction esti-mates and case definitions for malaria in endemic areas,” Statistics in Medicine,13: 2345-2358.
Vountasou, P., Smith, T. and Smith, A.F.M. (1998), “Bayesian analysis of two-component mixture distributions applied to estimating malaria attributablefraction”, Applied Statistics, 47, 575-587.
Warrell, D.A., Turner, G.D.H. and Francis, N. (2002), “Pathology and pathophys-iology of human malaria”, in Essential Malariology, D.A. Warrell and H.M.Gilles, eds., London: Arnold.
World Health Organization (1999), The World Health Report 1999: Making aDifference, Geneva: World Health Organization.
World Health Organization (2005), World Malaria Report, Geneva: World HealthOrganization.
20
The International Journal of Biostatistics, Vol. 6 [2010], Iss. 2, Art. 4
http://www.bepress.com/ijb/vol6/iss2/4DOI: 10.2202/1557-4679.1201