THE INTERNATIONAL BACCALAUREATE CONTINUUM: STUDENT ... · THE INTERNATIONAL BACCALAUREATE...
144
THE INTERNATIONAL BACCALAUREATE CONTINUUM: STUDENT, TEACHER AND SCHOOL OUTCOMES Final Report Allan Walker Darren Bryant Moosung Lee The Joseph Lau Luen Hung Charitable Trust Asia Pacific Centre for Leadership and Change Hong Kong Institute of Education
Transcript of THE INTERNATIONAL BACCALAUREATE CONTINUUM: STUDENT ... · THE INTERNATIONAL BACCALAUREATE...

THE INTERNATIONAL BACCALAUREATE CONTINUUM: STUDENT, TEACHER AND SCHOOL OUTCOMES
Final Report
Allan Walker Darren Bryant Moosung Lee The Joseph Lau Luen Hung Charitable Trust Asia Pacific Centre for Leadership and Change Hong Kong Institute of Education

Table of Contents
LIST OF FIGURES .......................................................................................................................... I
LIST OF TABLES ........................................................................................................................... II
EXECUTIVE SUMMARY ............................................................................................................... 1
1 INTRODUCTION .................................................................................................................... 7 1-1 Project Aims ............................................................................................................................................. 7 1-2 Research Questions .................................................................................................................................. 7 1-3 Literature Review ..................................................................................................................................... 8
1-3-1 International Baccalaureate Schools ................................................................................................ 8 1-3-2 Leadership in IB Schools .................................................................................................................... 9 1-3-3 Learner Profile ................................................................................................................................. 10
1-4 Research Design...................................................................................................................................... 12 1-5 Structure of Report ................................................................................................................................. 14
2 QUANTITATIVE STUDY I INSTRUMENT DEVELOPMENT AND VALIDATION OF IB LEARNER PROFILE QUESTIONNAIRE ................................................................................................... 15 2-1 Two Delphi Studies ................................................................................................................................. 15 2-2 Construct Validity on the Pilot Study Survey ........................................................................................... 18 2-3 Construct Validity of the Main Study Survey ........................................................................................... 23 2-4 Summary of Findings .............................................................................................................................. 29
3 QUANTITATIVE STUDY I VALIDATION OF TEACHER SURVEY INSTRUMENT .......................... 30 3-1 Data Collection ....................................................................................................................................... 30 3-2 Analytical Strategies ............................................................................................................................... 31 3-3 Results .................................................................................................................................................... 32 3-4 Summary of Findings .............................................................................................................................. 42
4 QUANTITATIVE STUDY II LINKING SCHOOL CHARACTERISTICS TO TEACHER AND STUDENT OUTCOMES ........................................................................................................................ 43 4-1 Comparative Analyses of Teacher and Student Outcomes ...................................................................... 43
4-1-1 Group Comparisons by Type of IB Continuum ................................................................................. 45 4-2 Comparison by the Proportion of Local Students in IB Schools ............................................................... 50 4-3 Exploring the Effects of School Characteristics and Learner Profile on IB Examination Scores ................ 54
4-3-1 Data Sources and Measures ............................................................................................................ 54 4-3-2 Analytical Strategies ....................................................................................................................... 55 4-3-3 HLM Results .................................................................................................................................... 55 4-3-4 Limitation of the Analysis ................................................................................................................ 59
4-4 Summary of Findings .............................................................................................................................. 59

5 QUALITATIVE STUDY METHODOLOGY ................................................................................ 61 5-1 Methodology .......................................................................................................................................... 61
5-1-1 School Selection .............................................................................................................................. 61 5-1-2 Data Collection and Analysis ........................................................................................................... 62
6 SCHOOL I REPORT .............................................................................................................. 65 6-1 School Culture and Leadership ................................................................................................................ 65
6-1-1 Leadership Roles and Structures ..................................................................................................... 65 6-1-2 School Cohesion and Culture ........................................................................................................... 65
6-2 Student Learning .................................................................................................................................... 69 6-2-1 Coherent Learning Experiences ....................................................................................................... 73 6-2-2 Bottom-Up Curriculum Alignment................................................................................................... 76
6-3 Teacher Outcomes .................................................................................................................................. 76 6-3-1 Collaboration around School Policy ................................................................................................ 77 6-3-2 Collaboration around the Curriculum ............................................................................................. 77 6-3-3 Professional Learning ...................................................................................................................... 78
6-4 Summary of Findings .............................................................................................................................. 80
7 SCHOOL II REPORT ............................................................................................................. 82 7-1 School Culture and Leadership ................................................................................................................ 82
7-1-1 Leadership Roles and Structures ..................................................................................................... 82 7-1-2 School Cohesion .............................................................................................................................. 83 7-1-3 School Culture ................................................................................................................................. 85
7-2 Student Learning .................................................................................................................................... 87 7-2-1 Knowledgeable and Inquirers: The LP and the Narrowing of the Curriculum ................................. 87 7-2-2 Open-minded .................................................................................................................................. 89 7-2-3 Coherent Learning Experience ........................................................................................................ 89
7-3 Teacher Outcomes .................................................................................................................................. 92 7-3-1 Collaboration................................................................................................................................... 92 7-3-2 Curriculum Development Work ....................................................................................................... 92 7-3-3 Professional Learning ...................................................................................................................... 94
7-4 Summary of Findings .............................................................................................................................. 95
8 COMPARATIVE ANALYSIS ................................................................................................... 97 8-1 School Culture ........................................................................................................................................ 97 8-2 Language and Coherence ........................................................................................................................ 97 8-3 Curriculum Alignment and Learning ........................................................................................................ 98 8-4 The Continuum, Teaching, and Learning ................................................................................................. 98 8-5 Leadership structures ............................................................................................................................. 99 8-6 Summary of Findings ............................................................................................................................ 100

9 CONCLUSION ................................................................................................................... 103 9-1 Overview .............................................................................................................................................. 103 9-2 Products ............................................................................................................................................... 103 9-3 Summary of Quantitative Findings........................................................................................................ 104 9-4 Summary of Qualitative Findings .......................................................................................................... 105 9-5 Propositions.......................................................................................................................................... 107 9-6 Limitations and Areas of Further Research ........................................................................................... 112 9-7 Chapter Summary ................................................................................................................................. 112
REFERENCES ........................................................................................................................... 114
APPENDICES ........................................................................................................................... 121 Appendix 1: International Baccalaureate Learner Profile Questionnaire (IBLPQ) Used in Main Study ............ 121 Appendix 2: Valid Items in International Baccalaureate Learner Profile Questionnaire (IBLPQ) ...................... 125 Appendix 3: International School Leadership Questionnaire (ISLQ) Used in Main Study ................................. 126 Appendix 4: Valid Items in International School Leadership Questionnaire (ISLQ) .......................................... 132 Appendix 5: Key Interview Questions for Head of School ................................................................................ 134 Appendix 6: Key Interview Questions for Director of Learning ........................................................................ 135 Appendix 7: Key Interview Questions for Principals and IB Program Coordinators .......................................... 136 Appendix 8: Key Interview Questions for Teachers .......................................................................................... 137 Appendix 9: Key Interview Questions for Students .......................................................................................... 138
i
List of Figures
Figure 1-1 Learner Profile Attributes Grouped by Four Theoretical Constructs (Four selected attributes are in red) ..................................................................................................... 12
Figure 2-1 Nationality of DP students in East and South Asia .......................................................... 19
Figure 2-2 Nationality of DP students in Main Study ....................................................................... 25
Figure 3-1 A Framework of Leadership in IB Schools ....................................................................... 36
Figure 4-1 Analytical Strategies ........................................................................................................ 44
Figure 4-2 Two Learner Profile Attributes by Percentage of Local Students ................................... 51

ii
List of Tables
Table 1-1 Ten Attributes in Learner Profile and their Descriptions .................................................................................. 10
Table 1-2 Outline of Four Phases ..................................................................................................................................... 12
Table 2-1 Results of Ratings, Values of Aiken’s V and Score Confidence Interval (CI) ..................................................... 17
Table 2-2 IB Schools Participating in the Pilot Study and Response Rates ....................................................................... 18
Table 2-3 Descriptive Statistics of the Four Constructs in Pilot Study.............................................................................. 20
Table 2-4 Factor Loadings for IB Learner Profile Questionnaire in Pilot Study ................................................................ 21
Table 2-5 Correlation Matrix of the Four Constructs ....................................................................................................... 22
Table 2-6 IB Schools Participating in the Main Study (Student) and Response Rates ...................................................... 24
Table 2-7 Descriptive Statistics of the Four Constructs in Main Study............................................................................. 26
Table 2-8 Factor Loadings for IB Learner Profile Questionnaire in Main Study ............................................................... 27
Table 2-9 Correlation Matrix of the Four Factors ............................................................................................................. 28
Table 3-1 IB Schools Participating in the Main Study (Teacher) and Response Rates ..................................................... 32
Table 3-2 Demographics of the Participating Teachers.................................................................................................... 33
Table 3-3 Constructs from CFA Measurement Model ...................................................................................................... 34
Table 3-4 Descriptive Statistics of the Constructs in Teacher Survey .............................................................................. 38
Table 3-5 Factor Loadings for Teacher Survey Constructs ............................................................................................... 39
Table 3-6 Correlation Matrix among the Eleven Constructs ............................................................................................ 41
Table 4-1 Descriptive Statistics of Leadership Practices by Type of IB Schools ................................................................ 45
Table 4-2 Descriptive Statistics of Organizational Conditions and Teacher Professional Community by Type of IB Schools ...................................................................................................................................................... 46
Table 4-3 Descriptive Statistics of IB Examination Results by Type of IB Students .......................................................... 47
Table 4-4 Descriptive Statistics of IB Examination Results by Type of IB Students .......................................................... 47
Table 4-5 Post-hoc Test of IB Examination Results .......................................................................................................... 48
Table 4-6 Descriptive Statistics of the Learner Profile: Continuum vs. Non-continuum Students ................................... 49
Table 4-7 Descriptive Statistics of the Learner Profile: A Comparison of Three Groups .................................................. 50
Table 4-8 Two Learner Profile Attributes by Percentage of Local Students ..................................................................... 51
Table 4-9 Tests for Invariance .......................................................................................................................................... 52
Table 4-10 Latent mean comparison of the Learner Profile: Students in Low-Concentration Schools (Reference Group) vs. Students in High-Concentration Schools ................................................................................. 52
Table 4-11 Latent Mean Comparison of Learner Profile: Students in Mid-Concentration (Reference Group) vs. High-Concentration Schools ...................................................................................................................... 53
Table 4-12 Latent Mean Comparison of Learner Profile: Students in Low-Concentration (Reference Group) vs. Mid-Concentration Schools ....................................................................................................................... 53
Table 4-13 HLM Predicting DP Examination Scoresa ........................................................................................................ 56
Table 5-1 General Information about the Case Study Schools ......................................................................................... 62
Table 5-2 Interview Schedule for School I (with number of participants in bracket) ...................................................... 63
Table 5-3 Interview Schedule for School II (with number of participants in bracket) ..................................................... 63
Table 5-4 Key Themes for Qualitative Analysis ................................................................................................................ 64

Page | 1
Executive Summary
Overview
With the introduction of the Primary Years Program (PYP) in 1997, the IB established a continuum of international education based on a sequence of three programs—the PYP, the Middle Years Program (MYP, introduced in 1994) and the Diploma Program (DP, introduced in 1969). Together, these programs provided the prospect of a continuous international educational experience from early childhood to pre-university age. To enhance programmatic coherence, in 2006 the IB reconstituted the “PYP Student Profile” for application to all IB programs as the “Learner Profile” (LP). The ten attributes of the LP addressed values, attitudes, and behaviors pertaining to four theoretical constructs: cognitive/intellectual, affective/emotional, conative/personal, and cultural/social. As such, the LP provided a theoretically grounded framework to further support the articulation of pedagogy, curriculum, and assessment across the three-program continuum and among IB schools.
An exploration of the impact of the IB continuum is important given the rapid expansion of IB authorized schools internationally, within Asia in general and in Southeast Asia in particular. With limited research in these contexts, there is a need to assess how participation in the IB continuum affects schools, teachers, and students. Accordingly, this study asked four questions1:
• What is the impact of the IB continuum on student outcomes?
• What is the impact on teachers of implementing the IB continuum?
• What is the impact on schools of implementing the IB continuum?
• Do students experience unanticipated outcomes associated with implementing the IB continuum?
Methodology
We engaged in a mixed methods study to answer the research questions. The quantitative study utilized three instruments: (a) the IB Learner Profile Questionnaire (IBLPQ), which the researchers constructed and validated based on the four LP attributes selected from the four theoretical constructs noted above, and which was completed by 758 students from 29 schools; (b) a teacher survey on school leadership (the International School Leadership Questionnaire [ISLQ]), validated for this context and completed by 333 teachers from 29 schools; and (c) IB DP examination results for all students completing examinations in Southeast Asian DP-only and continuum schools (schools which offer all three IB programs) in May 2013. Through the use of demographic questions, the data pertaining to students who had experienced the IB continuum were compared to “multi-program” students who had experienced different configurations of the IB’s three academic programs (i.e. PYP+DP; MYP+DP), “DP-only” students (i.e. students who had
1 See Chapter 1 for subordinate research questions.

Page | 2
experienced the DP solely), and a composite category, “non-continuum students”, consisting of both multi-program and DP-only students. The school and student categories are presented below:
The teacher survey data from continuum schools was compared with that from DP-only schools. The analysis considered the effect of the continuum on the LP attributes, leadership constructs, and examination results. The qualitative study collected interview and documentary data through two in-depth case studies of continuum schools. The Heads of School, school principals, program coordinators, and selected teachers and students were interviewed. The quantitative and qualitative data were analyzed separately and then comparatively.
Quantitative Study Findings
Important findings from the quantitative data include:
IB DP Examination Outcomes
1. No significant differences in IB DP examination results were found when continuum students were compared with non-continuum students.
2. When comparing continuum, DP-only, and multi-program students, results indicated a significant difference between multi-program and DP-only students’ test results (with DP-only students performing better) but no significant difference between continuum and DP-only students.
Learner Profile Outcomes
3. Overall, the sample students (both continuum and non-continuum) showed moderately positive perceptions of their capacity on the LP attributes: means range from 4.57 to 4.87.
4. No significant difference was found between continuum and non-continuum students with regard to differences in the LP attributes knowledgeable, inquirers, and open-minded.
5. Non-continuum students showed a significantly higher rating than continuum students on the attribute of caring.

Page | 3
6. When comparing continuum, DP-only, and multi-program students, no significant group differences were found in the LP attributes knowledgeable, inquirers, and open-minded.
7. Multi-program students showed a higher rating, with a low effect size, of their own capacity on caring than other groups. DP-only students showed a significantly higher rating than continuum students on caring.
8. The proportion of local students in IB schools appeared to be associated with student development in the LP attributes knowledgeable and open-minded1.
Relationship of the Learner Profile to IB DP Examination Results
9. The LP attributes knowledgeable and inquirers showed a positive association on examination results for all students.
10. The LP attributes caring and open-minded showed negative and no significant association, respectively, on examination results.
Leadership Practices and Organizational Conditions Outcomes
11. Continuum or DP-only school status was not significantly associated with (a) key leadership practices that are intended to improve learning and teaching, and support programmatic alignment; (b) organizational conditions, such as school mission and learning opportunities, that shape school cultures; and (c) facets of teacher professional community that examine ways in which teachers work together2.
Relationship of Leadership Practices and Organizational Conditions Outcomes to IB DP Examination Results
12. Principals’ capacity to encourage dialogue among DP teachers about the DP program and to secure and allocate resources to improve learning and teaching were positively associated with examination results, although the statistical significance was at the borderline level.
13. Teachers’ engagement in co-teaching, peer observation and peer feedback were positively associated with IB examination scores.
14. Principals’ behavior related to classroom observation and the regular inspection of student work were negatively associated with examination results.
1 Please see Section 2 of Chapter 4 for a detailed illustration.
2 These three dimensions and the relationship to the constructs that inform key findings 11-14 are fully explained in Section 3 of Chapter 3.

Page | 4
Qualitative Study Findings
Data from the qualitative study identified a series of perspectives, practices and outcomes that were influenced by participation in the IB continuum. Both schools that participated in this component of the study were continuum schools.
School Outcomes
1. The Learner Profile supported coherence-making and program articulation by contributing to a common language of learning and teaching that forms a basis for reflection, dialogue, decision-making, and school cohesion across the continuum. The extent to which participants considered the Learner Profile robust enough for this purpose differed between the two schools.
2. Depending on school context, development, and mission, other tools may complement the Learner Profile to construct a school-wide language of learning and teaching. In School II, Harvard University’s Teaching for Understanding provided a key component of this language.
3. The schools operationalized the Learner Profile for cohesion purposes by using varying strategies that included: formally aligning the LP, school mission, values, and language to guide decision-making (School II); and explicitly referencing the LP to determine teacher recruitment and student selection (School I).
4. The schools differed in the centrality allocated to the IB mission and values (School I identifying as an “IB school” and School II as “more than an IB school”). However, in both cases, the continuum provided a touchstone to indicate the schools’ values pertaining to learning and teaching to stakeholders.
Student Outcomes
5. Students and teachers in both schools reported a narrowing of the curriculum as students progressed through the continuum, beginning in the final years of MYP. Both teachers and students viewed this progressive focusing towards cognitive domain attributes as a challenge. Typically, this programmatic shift was attributed to the disciplinary and examination focus of the DP.
6. The data suggest that there is a narrowing of the curriculum to subject-specific content and skills in the DP. This creates more content “gap” challenges for students moving from the MYP than for IGCSE students, whose intensive disciplinary preparation bridges the DP examination content. However, students and teachers explained that the MYP to DP “gap” is mitigated—at least with reference to coursework and school-based assessment—by the broader range of learning, assessment, and personal organization practices that continuum students have experienced.
7. Although participants noted curriculum discontinuity between the three programs that constitute the continuum, this viewpoint was moderated by suggestions that the “gaps” reflected each programs’ respective support for students’ stages of development.

Page | 5
Accordingly, teachers in both schools articulated concern that attempts to bridge MYP and DP should not come at the expense of each programs’ distinctive features.
8. Students and teachers in the two schools reported that a set of core skills developed in the PYP and the MYP helped to prepare students for facets of the DP pertaining to: inquiry-based learning, problem-solving, criterion-referenced assessment, organization and time management.
9. Teachers and students in School I reported a stronger tendency than in School II to use the language of LP attributes inside and outside of the classroom. However, students and teachers in both schools reported that students enacted the values of the Learner Profile even when it was not explicitly referred to.
10. Students and faculty members tended to articulate that participation in the continuum has a positive impact on the LP attribute of open-minded. However they also perceived this attribute to be influenced by contextual features such as a “community school” culture (School I), the governing body’s mission (School II) and the international composition of the student body (both schools).
11. Students and teachers in School I explained that the integrated approach of MYP subjects (e.g. integrated sciences, visual and performing arts) equipped students to make informed choices about DP subject selection.
Teacher Outcomes
12. In both schools, some faculty members reported that the provision of all three programs creates the potential to engage in on-site professional development and in opportunities to share practices across programs. The tendency for teachers to teach across the DP and the MYP programs further allows for increased understanding and articulation of the continuum.
13. A key area of teacher collaboration concerns efforts to understand the gaps between programs and to work on programmatic alignment. This effort occurred formally through articulation meetings and curriculum review; and informally as teachers who taught both the MYP and the DP took the initiative to introduce MYP students to DP-related content and skills. School II participants explained that work on alignment was facilitated by the development of a standards and benchmarks curriculum that articulated the Learner Profile in every subject area at each grade level.
Propositions
Taken together, the qualitative and quantitative data provide evidence for four propositions—as opposed to generalizations—which have scope for further inquiry.
Proposition 1: Engagement in the continuum provides a point of reference that schools use to define and disseminate values about instruction, assessment and curriculum; and to allocate resources accordingly.

Page | 6
Proposition 2: The disciplinary focus of DP courses and examinations leads to a narrowing of the curriculum with reference to LP attributes and assessment practices, leaving gaps or “jumps” between the MYP and the DP in particular. This has an impact on student experiences of the IB continuum.
Proposition 3: Effective continuum schools engage all faculty members in focused dialogue around matters of curriculum, instruction, and assessment, predicated on a culture of trust and the development of shared understanding. This dialogue is bolstered by rich, formal professional development opportunities. Participation in the IB continuum may encourage the school’s development by stimulating fuller understanding of other IB programs and networking with IB teachers in other schools.
Proposition 4: Strongly held school values, and the diversity of the student population impact the enactment of the Learner Profile attributes knowledgeable and open-minded.
N.B. An important proviso to the interpretation of the findings and propositions reported above is that this study was conducted prior to the introduction of MYP The Next Chapter. Participants in the qualitative study suggested that anticipated revisions to the MYP will better support the articulation of the curriculum and continuity of practice pertaining to instruction and assessment. There is potential for a study that analyzes the impact on the continuum following implementation of these initiatives. The present study provides a baseline for comparative purposes.
Page | 7
1 Introduction
The International Baccalaureate (IB) is a global leader in international education, encouraging students to be active learners, well-rounded individuals, and engaged world citizens. Having grown dramatically in recent years in response to the burgeoning demand for a high quality international curriculum, there is a need to document school practices associated with successful program implementation and positive student outcomes that result from the IB curriculum. Further, as IB schools in Southeast Asia have adopted various combinations of IB programs (e.g., the continuum, or Primary Years Program (PYP) and Diploma Program (DP), or the Middle Years Program (MYP) and DP), there is a need to understand whether or not participation in the IB continuum makes a difference to teachers, students and schools. The project is timely. The time elapsed since the introduction of PYP in 1997 has permitted cohorts of students to complete the continuum. Further, following the 2006 decision to adopt the Learner Profile (LP) across all programs, there is now a cohort of DP students who have experienced the continuum with the LP providing a coherent framework of student learning outcomes. This chapter sets the agenda for the report by outlining the project’s aims and research questions, providing a review of key research that informs the analysis, and outlining the methodological approach.
1-1 Project Aims
The purpose of this study is to explore and document the impact of the IB continuum (PYP, MYP and DP) on students, teachers and schools in five Southeast Asian societies. Four overarching questions supported by sub-questions guide the study.
1-2 Research Questions
1. What is the impact of the IB continuum on student outcomes?
a) To what extent does participation in the IB continuum impact on student academic achievement?
b) In what ways does student participation in the IB continuum contribute to affective learning outcomes, particularly those aligned to LP attributes?
c) To what degree does continuum participation provide a coherent learning experience for students?
d) What do students perceive the benefits of continuum participation to be?
2. What is the impact on teachers of implementing the full IB continuum? Does continuum implementation lead to:
a) changes in teacher collaboration?
b) changes in approaches to curriculum development?
c) a sense of professional learning and shared goals among teachers?
d) other changes in teacher practices?

Page | 8
3. What is the impact on schools of implementing the full IB continuum? Does continuum implementation lead to changes in:
a) school leadership structures?
b) school cohesion?
c) school culture?
4. Do students experience unanticipated outcomes associated with implementing the IB continuum?
To answer these questions, data were collected from international schools in Southeast Asia that offer all of the three IB programs as well as from single program schools offering the Diploma Program.
1-3 Literature Review
1-3-1 International Baccalaureate Schools
IB programs are spreading rapidly across Southeast Asia. Schools offering the IB programs, or IB schools, have been key players in the global market of international education for several decades. IB schools have developed a strong reputation for encouraging students to become active learners, well-rounded individuals and engaged world citizens (Hayden, 2006). Over the last decade, the number of IB programs adopted by schools around the world increased by almost 241%, from 1265 programs in 2003 to 4319 in 2012 (International Baccalaureate Organization [IBO], 2013). Moreover, the IB projects that there will be 10,000 authorized IB schools serving more than two million students by the year 2020 (IBO, 2009b). These statistics highlight not only the rapid growth of IB programs, but also the growing influence of the IB in the international education sector (Hayden, 2006).
Within the Asia-Pacific context, international schools in general, and IB schools in particular, have succeeded in creating a “brand” or widely recognized identity associated with their educational service. This brand is associated with an international curriculum, a multi-cultural student body, global portability of the degree and high-quality preparation for university entrance (Tarc, 2009). Brand recognition of IB in the Asia-Pacific region has been built on earlier penetration of the international education market in North America and Europe (Tarc, 2009). Indeed, a decade ago Gehring (2001) referred to the IB’s Diploma Program as the “Cadillac of College-Prep Programs” offered in the U.S. Here, we refer to IB adoption data to suggest that the IB brand is increasingly accepted by stakeholders in the Asia-Pacific region as a credible, internationally validated alternative to national public education systems (see also Doherty, 2009). In many Asia-Pacific countries, parents may find relatively few programs in the government school sector that include prerequisites for university entrance in other countries (Lee et al., 2014). While traditionally this was the concern of expatriate parents, in recent years, parents in Asian nations have sought similar opportunities for their children. Within this context, the IB’s Diploma Program has emerged as a key alternative for students in the international college entrance market, further boosting the IB brand (Lowe, 1999).

Page | 9
Many international schools in Southeast Asia have adopted one or more of the three IB programs designed to cover the “K–12 continuum”: the PYP, MYP and DP. The DP was the first program offered by the IB in the late 1960s, followed by the MYP in 1994 and the PYP in 1997. Although the three IB programs are intended to represent a “K–12 continuum”, they employ distinct pedagogical and curricular approaches. A major critique of the continuum concerns differences between the MYP and the DP (Stobie, 2007; Hallinger, Lee, & Walker, 2011). The DP was designed as a university preparatory program (Gehring, 2001). It entails inquiry-based learning that is accomplished through independent work focused on deep subject content (e.g. Extended Essay). In contrast, the MYP provides a framework based around eight learning areas which are delivered through applying five interdisciplinary themes in a student-centered approach to learning. Assessment is criterion referenced with no external examination. (We note that the MYP is currently in the final stages of a major revision.) In previous research, teachers and administrators from IB Schools indicated that these inherent differences between the DP and the MYP were an obstacle to achieving cross-program coherence (Hallinger et al., 2011). Given such challenges, and that schools offer different combinations of the three programs (e.g. PYP and DP; MYP and DP; DP-only; all three), what impact does the IB continuum have on student, teacher, and school outcomes? How does this differ from what occurs in DP-only and multi-program schools? This project seeks to answer these questions by focusing on continuum and non-continuum schools in five Southeast Asian countries.
1-3-2 Leadership in IB Schools
The study of leadership in IB schools has attracted scant but increasing scholarly attention over the past two decades. A number of studies document the challenges faced by IB school leaders in the Asia-Pacific region (Hawley, 1994, 1995; Gilliam, 1997; Biro, 2003; McGhee, 2003; Melton, 2003; Bunnell, 2008; Halicioglu, 2008; Hayden & Thompson, 2008; Riesbeck, 2008; Hall et al., 2009; Lee, Hallinger, & Walker, 2012a, 2012b; Walker & Cheng, 2009; Walker & Quong, 2010). Lee and colleagues (2012a) provide a detailed summary of leadership challenges in IB schools, classifying them into two major areas: external influences and organizational contexts.
1. Leadership challenges from external influences (including parents and external assessment). Such challenges include: a) conflict between IB’s student-centered philosophy and conventionally examination-
driven and teacher-centered educational norms found in Confucian heritage societies;
b) a tendency for IB schools to focus on DP outcomes due to the importance of DP examination results for university admissions.
2. Leadership challenges from the organizational context.
IB Schools in the Asia-Pacific region are typically well-resourced international schools that function with relative independence from local government. This places additional responsibility on schools for matters often attended to by ministries of education (e.g. curriculum, finances). Further, IB programs (particularly the MYP and the PYP), provide an instructional framework but not a full curriculum. These factors require IB schools to allocate additional work and leadership responsibilities to various senior and mid-level leaders, key staff, committees and project teams. This places additional pressure on senior teaching staff who tend to take up multiple areas of responsibility—a factor in high attrition rates (Hawley 1994, 1995; Benson, 2011). Hence, Heads of

Page | 10
Schools need to motivate and monitor a complex network of professionals through consciously working different connective pathways within and beyond the organization (Walker, 2012; Walker & Qian, 2012). Also, given the international status of most IB schools in the region, Heads of Schools need to navigate and rationalize the varied educational values and societal cultures of diverse stakeholders such as parents, members of the community and ministries of education (Walker, 2007).
Lee et al. (2012b) identified three sets of instructional practices adopted by school leaders in response to these challenges: curriculum articulation, cross-program activities, and strategic staffing (Lee, Hallinger, & Walker, 2012b; Walker & Cheng, 2009). These findings inform the research and analysis conducted in this project.
1-3-3 Learner Profile
The Learner Profile (LP) is a set of attributes and descriptors that students are expected to develop through the IB programs. It was originally developed for the PYP, and was named the “PYP Student Profile.” Ten attributes are used to describe the values, attitudes, and behaviors that the program intends to develop in its students (IBO, 2002). The value of the student profile to the PYP is recognized and is believed to be beneficial to student learning not only in the PYP but also in the MYP and DP (IBO, 2009a). In early 2006 the student profile was introduced to the MYP and DP and was renamed as the “IB Learner Profile” (LP), inheriting all ten attributes of the Student Profile; see Table 1-1 for the ten attributes and their descriptions.
Table 1-1 Ten Attributes in Learner Profile and their Descriptions
LP attributes Descriptions
Inquirers They develop their natural curiosity. They acquire the skills necessary to conduct inquiry and research and show independence in learning. They actively enjoy learning and this love of learning will be sustained throughout their lives.
Knowledgeable They explore concepts, ideas and issues that have local and global significance. In so doing, they acquire in-depth knowledge and develop understanding across a broad and balanced range of disciplines.
Thinkers They exercise initiative in applying thinking skills critically and creatively to recognize and approach complex problems, and make reasoned, ethical decisions.
Communicators They understand and express ideas and information confidently and creatively in more than one language and in a variety of modes of communication. They work effectively and willingly in collaboration with others.
Principled They act with integrity and honesty, with a strong sense of fairness, justice and respect for the dignity of the individual, groups and communities. They take responsibility for their own actions and the consequences that accompany them.

Page | 11
Table 1-1 Ten Attributes in Learner Profile and their Descriptions (continued)
LP attributes Descriptions
Open-minded They understand and appreciate their own cultures and personal histories, and are open to the perspectives, values and traditions of other individuals and communities. They are accustomed to seeking and evaluating a range of points of view, and are willing to grow from the experience.
Caring They show empathy, compassion and respect towards the needs and feelings of others. They have a personal commitment to service, and act to make a positive difference to the lives of others and to the environment.
Risk-takers They approach unfamiliar situations and uncertainty with courage and forethought, and have the independence of spirit to explore new roles, ideas and strategies. They are brave and articulate in defending their beliefs.
Balanced They understand the importance of intellectual, physical and emotional balance to achieve personal well-being for themselves and others.
Reflective They give thoughtful consideration to their own learning and experience. They are able to assess and understand their strengths and limitations in order to support their learning and personal development.
The LP provides an important linkage, or common language, between the three IB programs. It is “a clear and concise statement of the aims and values of the IB, and an embodiment of what the IB means by ‘international mindedness’” (quoted in IBO, 2008).
Although these ten attributes are the heart of the IB, the LP has been subject to some critique. In particular, the LP attributes were developed based on an extensive consultation with IB practitioners and other IB professionals. Its lack of theoretical base therefore forms the basis of criticism (Well, 2011).
Bullock’s (2011) systematic literature review serves to develop a theoretical rationale for the LP by connecting its attributes to learning and developmental theories. She groups the ten attributes into four learning themes: “cognitive/intellectual,” “conative/personal,” “affective/emotional,” and “cultural/social.” Bullock links “cognitive/intellectual” to the process of knowledge acquisition; “conative/personal” to motivational theory; “affective/emotional” to social development theory; and “cultural/social” to social constructivist theory. Figure 1-1 illustrates Bullock’s arrangement of the ten LP attributes into her theoretically based model. The model provides a basis for selecting the four attributes for examination in this study. These are as indicated in red.

Page | 12
Figure 1-1 Learner Profile Attributes Grouped by Four Theoretical Constructs (Four selected attributes are in red)
1-4 Research Design
The purpose of this project is to examine the impact of completing the IB continuum on student learning outcomes, teacher outcomes, and school improvement. To address the research questions, we developed a four-phase, multi-method research strategy. This sub-section provides a brief overview of the overall research design and summarizes the multiple activities carried out in each phase: 1) instrument development, 2) school surveys, and 3) interviews. Table 1-2 presents the details of the four phases. These phases are analytically separated but conceptually integrated. The mixed-method study employs an “expanded sequential explanatory” design (Creswell, Plano Clark, Gutmann, & Hanson, 2003). The chapters pertaining to the qualitative and quantitative portions of the study provide a more substantial overview of the research design.
Table 1-2 Outline of Four Phases
Phases Descriptions
Phase 1 Quantitative study I Instrument development and validation of IB Learner Profile; Validation of teacher survey instrument
Phase 2 Quantitative study II Main study (student and teacher survey) Phase 3 Qualitative study Case studies Phase 4 Integration Synthesis of key findings from the first three phases
Cognitive/Intellectual •Knowledgeable •Thinkers •Reflective
Affective/Emotional •Caring •Risk-takers •Balanced
Conative/Personal •Inquirers •Principled
Cultural/Social •Communicators •Open-minded
Page | 13
Phase One (February to March 2013)
As there was no existing validated instrument for measuring the LP, we designed and tested a questionnaire to systematically measure students’ perceptions of the impact of the LP on their educative experience. This phase included scrutinizing content validity by conducting a Delphi study that used qualitative and quantitative approaches to obtain feedback on the questionnaire items, analyze their content validity, and revise or eliminate items if necessary.
Phase Two (March to May 2013)
Phase two comprised our main study, in which we surveyed both students and teachers in continuum and DP-only schools in five countries (Cambodia, Indonesia, Singapore, Thailand and Vietnam). A teacher survey was administered to collect teachers’ perceptions regarding school leadership practices, organizational conditions, and teacher professional community. An online questionnaire collected students’ perceptions of the impact of the Learner Profile. Finally, the IB provided student academic data, particularly DP examination results. Demographic data collected in the student questionnaire permitted analyses pertaining to the relationship of examination results to continuum status and LP attributes.
Phase Three (February to June 2013)
In phase three we conducted a three-stage qualitative study. Stage one comprised a re-analysis of previous case studies of IB continuum schools (this was reported in an interim report provided to IB in May 2013, also see Lee, Hallinger, & Walker, 2012a and 2012b for more information). Stage two involved data collection through in-depth case studies in which students, teachers, and school leaders at two continuum schools were interviewed. Stage three comprised data analysis to identify emergent themes.
Phase Four (May to September 2013)
Phase four entailed comparing and integrating the quantitative and qualitative studies. Overlaps in time between phases two and three permitted iterative comparison of the quantitative and qualitative data as the collection and analyses progressed. In-depth comparisons were made once the full quantitative and qualitative reports were written.
Completing the four phases of research resulted in the development of the following products:
1. Construction and testing of an instrument aimed at assessing the LP attributes of students studying in IB schools.
2. Application of the IB Learner Profile Questionnaire (IBLPQ) to gain understanding of the impact of IB programs on affective development of students in continuum schools.
3. The compilation and validation for this context of a teacher survey on school leadership (the International School Leadership Questionnaire [ISLQ]).

Page | 14
4. Comparative analysis of student IB DP examination results from continuum and “DP-only” schools to gain insights into the differential impact of the IB continuum on students over time.
5. Preparation of two case study reports that analyze the qualitative data. 6. Construction of a series of propositions that compare qualitative and quantitative findings.
1-5 Structure of Report
This report is divided into nine chapters over three main sections. Chapters 2 to 4 detail the quantitative analysis. Chapter 2 provides an account of the development and validation of the IB Learner Profile questionnaire, used to solicit data from continuum, multi-program, and DP-only students pertaining to the four LP attributes. Chapter 3 explains the construction of the teacher questionnaire on leadership practices, its validation, and the resulting development of the IB Leadership Framework comprising eleven validated constructs. Chapter 4 provides a series of comparative analyses and a multilevel analysis that consider the impacts of the continuum on the LP, leadership constructs, and student academic outcomes using examination results as an indicator.
The following four chapters focus on the qualitative study. Chapter 5 explains the methodology. Chapters 6 and 7 comprise case reports of two continuum schools. They provide rich descriptions of the findings from each case. At the end of each case report, the findings are summarized with reference to the constructs derived from the quantitative study. Chapter 8 then presents a comparative analysis of the two case studies that synthesizes the findings, probes practices that are connected to participation in the continuum, and accounts for variations between the two schools that lead to different outcomes.
The report ends with a conclusion (Chapter 9) that compares the qualitative and quantitative findings to distil four propositions related to the impact of the IB continuum on students, teachers, and schools.
Page | 15
2 Quantitative Study I Instrument Development and Validation of IB Learner Profile
Questionnaire
In this section, we explain the development and validation of the IB Learner Profile Questionnaire (IBLPQ), an instrument designed to measure DP student perceptions of their achievement of four Learner Profile attributes. We present results from the following analyses:
1) two Delphi studies (qualitative and quantitative approaches); 2) a validation study based on the pilot study; and 3) a validation study based on the main study.
2-1 Two Delphi Studies
As a first stage in validating the questionnaire constructs, we conducted a qualitative Delphi study. We took a series of steps to secure content validity through the Delphi study as follows: 1) specifying domains of interest; 2) clarifying formats and number of items; 3) writing items with a panel of qualified experts in the content domain; and 4) assessing item matching with an expert group—i.e., IB educators in Asia Pacific (Crocker & Algina, 1986; Hambleton, 1980).
Based on the literature pertaining to the Learner Profile, we developed an initial questionnaire on four attributes of the Learner Profile: knowledgeable, inquirers, caring, and open-minded. We focused on these four LP attributes for two reasons. First, each represents a conceptually distinctive domain: knowledgeable (cognitive), inquirers (conative), caring (affective), and open-minded (cultural). Second, the International Baccalaureate highlights these four attributes clearly in its mission statement: “The International Baccalaureate aims to develop inquiring, knowledgeable and caring young people who help to create a better and more peaceful world through intercultural understanding and respect” (IBO 2011, p. 1).
Our initial draft included 32 questionnaire items (8 per each attribute) that were adjusted and revised based on feedback from IB professionals, i.e., 23 IB teachers and administrators, and a group of DP students in Asia Pacific countries.
Based on the revised questionnaire items, we invited 50 experienced IB teachers and administrators to rate the relevance of the revised items to the Learner Profile by scoring each item on a 5-point Likert scale. Of the 50 experts, 32 provided ratings, which were used to quantitatively investigate content validity—i.e., the degree to which the content of the questionnaire items represents or reflects the targeted attribute. We analyzed the dataset from the 32 IB educators by using three content validity indices1: Lawshe’s content validity ratio (CVR),
1 Content validity (also known as item content relevance) refers to “the degree to which elements of an assessment instrument are relevant to and representative of the targeted construct for a particular assessment purpose” (Haynes, Richard, & Kubany, 1995, p. 238).

Page | 16
Aiken’s V coefficient and Penfield’s interval scores1. Based on this investigation, we finalized the questionnaire items by further editing them.
Lawshe’s CVR refers to the degree to which experts find overlap or commonality between each questionnaire item and the examined content. It indicated that our revised questionnaire items have solid content validity as presented in Table 2-1. The CVR for each questionnaire item in the table was calculated by the following formula: CVR = [(E - (N / 2)) / (N / 2)] where E = number of experts rating the questionnaire item as essential and N = total number of experts (Lawshe, 1975). The cut-off value of CVR for our study was 0.32 (at p = 0.05) given that N = 32. As seen in the table, all of the questionnaire items across the four LP attributes were higher than the cut-off value.
To further ensure item content relevance, Aiken’s content-validity coefficient (Aiken, 1980, 1985) known as Aiken’s V and Penfield's (2003) Confidential Interval (CI) were examined. Given that n experts rate an item that reflects an objective on a 1 to c Likert-scale, Aiken’s V is calculated using the following formula:
𝑉 = S/[n ∗ (c − 1)] (Equation 1)
where S = the sum of s for the n raters, s = r – lo, r = the rating by an expert and lo = the lowest possible validity rating (usually, this is 1 on the Likert-scale). The range of V will be from 0 to 1.0. A higher value indicates higher content validity since a score of 1.0 is interpreted as all raters giving the item the highest possible rating. Aiken’s V is instrumental for making descriptive statements about the level of content validity of the item. However, the information regarding the actual unknown population value of V is limited. For example, the outcome only leads to a decision of whether or not Vp equals a particular value, while not providing information regarding what the value of Vp might actually be. To address this drawback, Penfield (2003) and Penfield & Giacobbi (2004) proposed the use of a confidence interval for Vp. Based on the statistic V computed using Equation 1 above, the lower (L) and upper (U) limits to a C% Score confidence interval for Vp can be obtained using the following formulas:
𝐿 = 2nkV + 𝑧2− 𝑧�4𝑛𝑘𝑉(1 − 𝑉) + 𝑧2
2(nk + 𝑧2) Equation (2)
𝑈 = 2nkV + 𝑧2 + 𝑧�4𝑛𝑘𝑉(1−𝑉) + 𝑧2
2(nk + 𝑧2) Equation (3)
where n = sample size (number of raters), k = highest possible scale point minus the lowest possible point, z = confidence value (z 90%=1.65; z 95% =1.96). The typical length of the 90% and 95% confidence intervals is used to evaluate the expected precision of V as an estimator of Vp, through comparing them with the criterion level of 0.30 (or more strictly, 0.20). Typical lengths of the score confidence intervals exceeding this suggests potential lack of content-relevance or insufficient number of raters.
1 We wish to note that there are a number of content validity indices such as Lawshe’s (1975) content validity ratio (CVR), Rovinelli and Hambleton’s index of item-objective congruence (1977), Aiken’s V content-validity coefficient (1985), and Penfield’s score interval (2003), to name a few. Given that each of these indices has its own strengths and limitations, we employed one classic index and two most contemporary indices in order to ensure solid content validity—i.e., Lawshe’s content validity ratio, Aiken’s coefficient and Penfield’s interval scores.
Page | 17
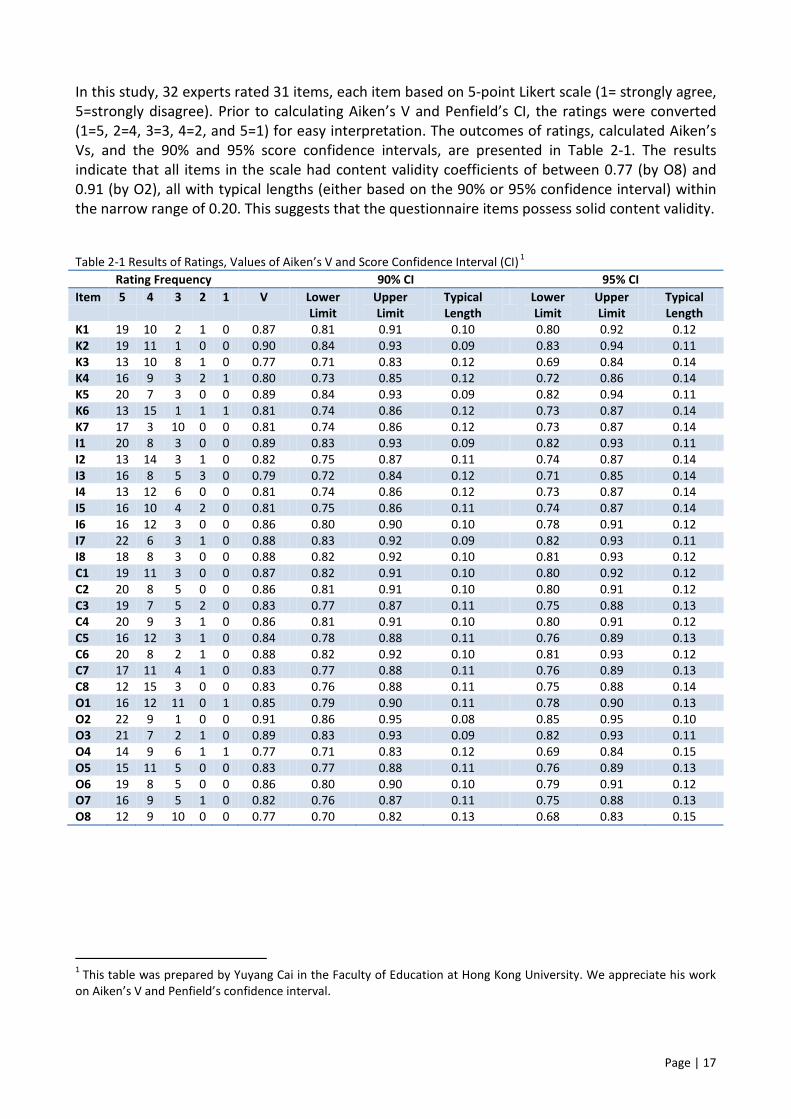
In this study, 32 experts rated 31 items, each item based on 5-point Likert scale (1= strongly agree, 5=strongly disagree). Prior to calculating Aiken’s V and Penfield’s CI, the ratings were converted (1=5, 2=4, 3=3, 4=2, and 5=1) for easy interpretation. The outcomes of ratings, calculated Aiken’s Vs, and the 90% and 95% score confidence intervals, are presented in Table 2-1. The results indicate that all items in the scale had content validity coefficients of between 0.77 (by O8) and 0.91 (by O2), all with typical lengths (either based on the 90% or 95% confidence interval) within the narrow range of 0.20. This suggests that the questionnaire items possess solid content validity.
Table 2-1 Results of Ratings, Values of Aiken’s V and Score Confidence Interval (CI) 1 Rating Frequency 90% CI 95% CI Item 5 4 3 2 1 V Lower
Limit Upper Limit
Typical Length
Lower Limit
Upper Limit
Typical Length
K1 19 10 2 1 0 0.87 0.81 0.91 0.10 0.80 0.92 0.12 K2 19 11 1 0 0 0.90 0.84 0.93 0.09 0.83 0.94 0.11 K3 13 10 8 1 0 0.77 0.71 0.83 0.12 0.69 0.84 0.14 K4 16 9 3 2 1 0.80 0.73 0.85 0.12 0.72 0.86 0.14 K5 20 7 3 0 0 0.89 0.84 0.93 0.09 0.82 0.94 0.11 K6 13 15 1 1 1 0.81 0.74 0.86 0.12 0.73 0.87 0.14 K7 17 3 10 0 0 0.81 0.74 0.86 0.12 0.73 0.87 0.14 I1 20 8 3 0 0 0.89 0.83 0.93 0.09 0.82 0.93 0.11 I2 13 14 3 1 0 0.82 0.75 0.87 0.11 0.74 0.87 0.14 I3 16 8 5 3 0 0.79 0.72 0.84 0.12 0.71 0.85 0.14 I4 13 12 6 0 0 0.81 0.74 0.86 0.12 0.73 0.87 0.14 I5 16 10 4 2 0 0.81 0.75 0.86 0.11 0.74 0.87 0.14 I6 16 12 3 0 0 0.86 0.80 0.90 0.10 0.78 0.91 0.12 I7 22 6 3 1 0 0.88 0.83 0.92 0.09 0.82 0.93 0.11 I8 18 8 3 0 0 0.88 0.82 0.92 0.10 0.81 0.93 0.12 C1 19 11 3 0 0 0.87 0.82 0.91 0.10 0.80 0.92 0.12 C2 20 8 5 0 0 0.86 0.81 0.91 0.10 0.80 0.91 0.12 C3 19 7 5 2 0 0.83 0.77 0.87 0.11 0.75 0.88 0.13 C4 20 9 3 1 0 0.86 0.81 0.91 0.10 0.80 0.91 0.12 C5 16 12 3 1 0 0.84 0.78 0.88 0.11 0.76 0.89 0.13 C6 20 8 2 1 0 0.88 0.82 0.92 0.10 0.81 0.93 0.12 C7 17 11 4 1 0 0.83 0.77 0.88 0.11 0.76 0.89 0.13 C8 12 15 3 0 0 0.83 0.76 0.88 0.11 0.75 0.88 0.14 O1 16 12 11 0 1 0.85 0.79 0.90 0.11 0.78 0.90 0.13 O2 22 9 1 0 0 0.91 0.86 0.95 0.08 0.85 0.95 0.10 O3 21 7 2 1 0 0.89 0.83 0.93 0.09 0.82 0.93 0.11 O4 14 9 6 1 1 0.77 0.71 0.83 0.12 0.69 0.84 0.15 O5 15 11 5 0 0 0.83 0.77 0.88 0.11 0.76 0.89 0.13 O6 19 8 5 0 0 0.86 0.80 0.90 0.10 0.79 0.91 0.12 O7 16 9 5 1 0 0.82 0.76 0.87 0.11 0.75 0.88 0.13 O8 12 9 10 0 0 0.77 0.70 0.82 0.13 0.68 0.83 0.15
1 This table was prepared by Yuyang Cai in the Faculty of Education at Hong Kong University. We appreciate his work on Aiken’s V and Penfield’s confidence interval.

Page | 18
2-2 Construct Validity on the Pilot Study Survey
Based on the solid content validity of the LP instrument, we conducted a pilot survey with DP students in IB schools in South and East Asian countries. We wish to note that we intentionally included IB schools in East Asian countries in the pilot study, whereas, in the following main study, we targeted IB schools in five South Asian countries, as required by IB in the project’s Request for Proposal document (RFP). Targeting somewhat different populations in the pilot and the main studies, respectively, was to secure cross-validation of the LP instrument with different populations. Following a similar logic, in the pilot study, we included both first-year DP students and final-year DP students, whereas, in the main study we targeted final-year DP students only.
We invited 77 IB schools to join the pilot study based on the following selection criteria: 1) located in Southeast Asia or two selected East Asian countries (China [Mainland China and Hong Kong] and South Korea); 2) having either first-year DP students or both first- and final-year DP students sitting for IB DP examinations in May or November 2013. As such, 1,530 students from 19 schools agreed to participate in the study (58 schools declined to participate or did not respond to the invitation). Students who agreed to participate in the study, but did not provide any single response to the LP survey were excluded. Thus, we obtained valid responses from 976 students in 18 schools in the seven societies located in either South or East Asia (i.e., China, Hong Kong, Indonesia, Laos People's Democratic Republic, Philippines, Singapore, and South Korea). Six of the schools were continuum schools, whereas, 12 schools were non-continuum schools (six DP-only schools and six schools offering either the PYP or the MYP, alongside the DP)1. The participating schools are presented in Table 2-2.
Table 2-2 IB Schools Participating in the Pilot Study and Response Rates
Country School Code Number of Valid Responses in Pilot Response Rate China Pilot School 15 67 48.20% Hong Kong Pilot School 1 50 81.97% Pilot School 3 25 10.00% Pilot School 5 31 20.67% Pilot School 6 52 94.55% Pilot School 7 239 59.75% Pilot School 8 58 23.48% Pilot School 9 78 30.00% Pilot School 11 77 57.04% Pilot School 12 113 37.17% Pilot School 14 5 8.93% Pilot School 16 22 31.88% Pilot School 18 77 57.04% Indonesia Pilot School 10 16 55.17% Lao People's Democratic Republic Pilot School 17 13 36.11% Philippines Pilot School 13 6 12.77% Singapore Pilot School 4 24 41.38% South Korea Pilot School 2 23 88.46% 18 976
1 Here non-continuum schools refer to IB schools that do not implement the three IB programs (the PYP, the MYP, and the DP) simultaneously.

Page | 19
Basic descriptive statistics indicate that 96.7% and 3.3% of students respectively were taking the IB Diploma and the IB Certificate. Slightly more than half of the students were female (54.3%). Approximately 10.7% of the sample students indicated that they participated in the PYP when they were in primary school, and 29.6% of the sample students reported their participation in the MYP prior to the DP. With respect to nationality, the sample students indicated 76 different nationalities from various continents (see Figure 2-1). The proportion of major nationalities was as follows: China (34.5% = Hong Kong 20.3% + Mainland China 14.2%), UK (12.8%), Canada (8.5%), India (6%), Australia (5.6%), South Korea (5.2%), and USA (5.1%). Notably, 35.4% and 4.3% of the sample students indicated two and three nationalities, respectively.
Figure 2-1 Nationality of DP students in East and South Asia
Note: Multiple counting was used.
There were no missing values in either the major demographic variables or variables related to the Learner Profile 1. Based on the identification of no missing values in the IBLPQ items, we scrutinized psychometric properties by investigating soundness of factor structure, reliability of factors (i.e., latent constructs), and construct validity (i.e., convergent and discriminant validity).
The soundness of factor structure was examined using confirmatory factor analysis (CFA), consisting of the four constructs: knowledgeable, inquirers, caring, and open-minded. The CFA measurement model indicated an acceptable overall model fit: comparative fit index (CFI) = 0.93,
1 However, we wish to note that 66% of the students’ IB DP examination results were missing. This is partly because some of them were first-year DP students. Since the survey did not include a question about whether they were first-year or final-year DP students, we do not know the exact percentage of missing values of IB examination results.

Page | 20
root mean square error of Approximation (RMSEA) = 0.07, sandardized root mean square residual (SRMR) = 0.04, and X2= 1964.2, df = 344 (Fan & Sivo, 2007; Hu & Bentler, 1999). Note that we relied more on standard cut-off recommendations (Hu & Bentler, 1999; Fan & Sivo, 2007) rather than the chi-square statistic, which is sensitive to sample size (Bentler, 1990)1.
In other words, the data fully supported the four-factor structure. We identified four items (two items from caring and two items from open-minded) that had serious cross-factor loadings in the process of CFA. These items were excluded in the CFA measurement model. Cronbach’s alphas also supported the reliability of the constructs: knowledgeable (0.92), inquirers (0.91), caring (0.94), and open-minded (0.92).
Table 2-3 presents descriptive statistics of the four constructs (after eliminating the four items). Given that the survey was based on a 6-point Likert scale, overall, the sample students showed moderately positive perceptions of their capacity on the following LP attributes: means range from 4.47 to 4.74.
Table 2-3 Descriptive Statistics of the Four Constructs in Pilot Study
Minimum Maximum Mean S.D.
Knowledgeable 1.00 6.00 4.74 0.85 Inquirers 1.00 6.00 4.55 0.95 Caring 1.00 6.00 4.50 1.10 Open-minded 1.00 6.00 4.47 1.06
Note: N = 976
As a major part of construct validity, convergent validity was first examined. This was tested by employing three multiple approaches in order to ensure the test results—i.e., 1) the degree of factor loadings and statistical significance, 2) average variance extracted (AVE), and 3) construct reliability.
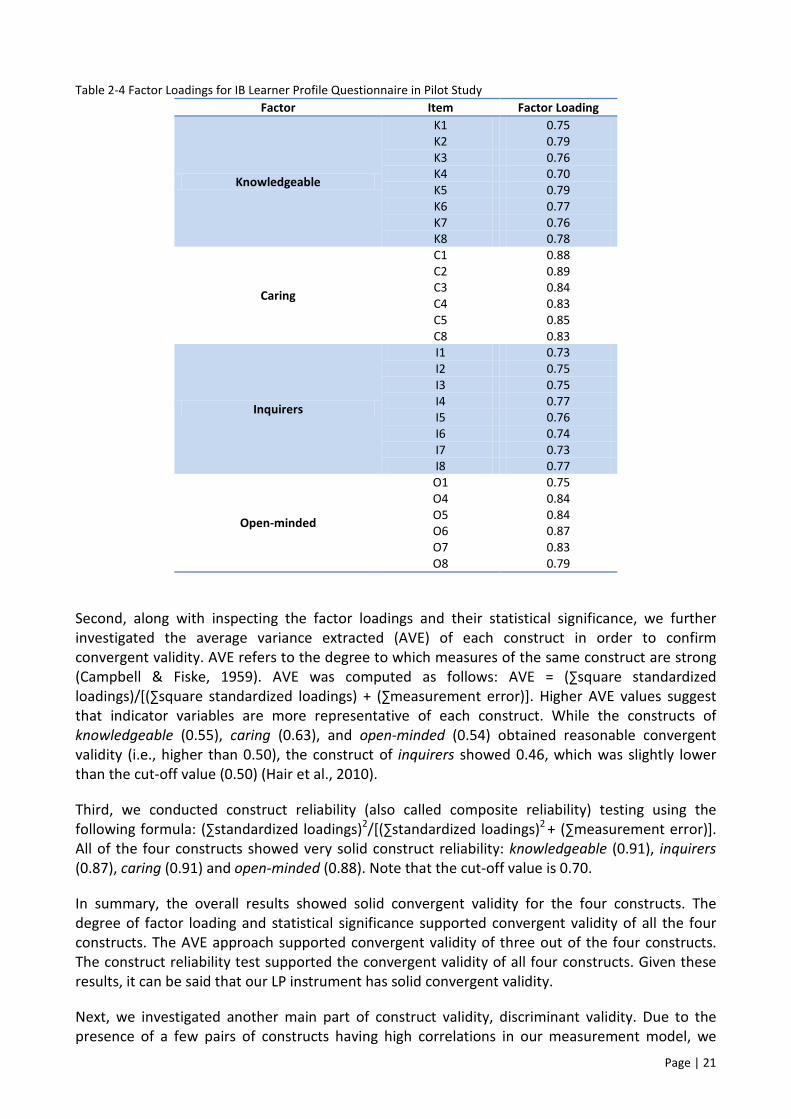
First, the degree of factor loadings (i.e., standardized regression weights) was substantial and statistically significant. As seen in Table 2-4 and Appendix 22, all of the indicator variables showed excellent factor loadings—i.e., higher than 0.70 (Tabachnick & Fidell, 2007).
1 For the SRMR and RMSEA, values less than 0.05 and 0.08 suggest a good model fit and an acceptable model fit, respectively. For the CFI values greater than 0.95 indicate goodness of fit and acceptable fit (Hu & Bentler, 1999; Fan & Sivo, 2007).
2 Please also refer to Appendix 2 for exact item wording.
Page | 21
Table 2-4 Factor Loadings for IB Learner Profile Questionnaire in Pilot Study Factor Item Factor Loading
Knowledgeable
K1 0.75 K2 0.79 K3 0.76 K4 0.70 K5 0.79 K6 0.77 K7 0.76 K8 0.78
Caring
C1 0.88 C2 0.89 C3 0.84 C4 0.83 C5 0.85 C8 0.83
Inquirers
I1 0.73 I2 0.75 I3 0.75 I4 0.77 I5 0.76 I6 0.74 I7 0.73 I8 0.77
Open-minded
O1 0.75 O4 0.84 O5 0.84 O6 0.87 O7 0.83 O8 0.79
Second, along with inspecting the factor loadings and their statistical significance, we further investigated the average variance extracted (AVE) of each construct in order to confirm convergent validity. AVE refers to the degree to which measures of the same construct are strong (Campbell & Fiske, 1959). AVE was computed as follows: AVE = (∑square standardized loadings)/[(∑square standardized loadings) + (∑measurement error)]. Higher AVE values suggest that indicator variables are more representative of each construct. While the constructs of knowledgeable (0.55), caring (0.63), and open-minded (0.54) obtained reasonable convergent validity (i.e., higher than 0.50), the construct of inquirers showed 0.46, which was slightly lower than the cut-off value (0.50) (Hair et al., 2010).
Third, we conducted construct reliability (also called composite reliability) testing using the following formula: (∑standardized loadings)2/[(∑standardized loadings)2 + (∑measurement error)]. All of the four constructs showed very solid construct reliability: knowledgeable (0.91), inquirers (0.87), caring (0.91) and open-minded (0.88). Note that the cut-off value is 0.70.
In summary, the overall results showed solid convergent validity for the four constructs. The degree of factor loading and statistical significance supported convergent validity of all the four constructs. The AVE approach supported convergent validity of three out of the four constructs. The construct reliability test supported the convergent validity of all four constructs. Given these results, it can be said that our LP instrument has solid convergent validity.
Next, we investigated another main part of construct validity, discriminant validity. Due to the presence of a few pairs of constructs having high correlations in our measurement model, we
Page | 22
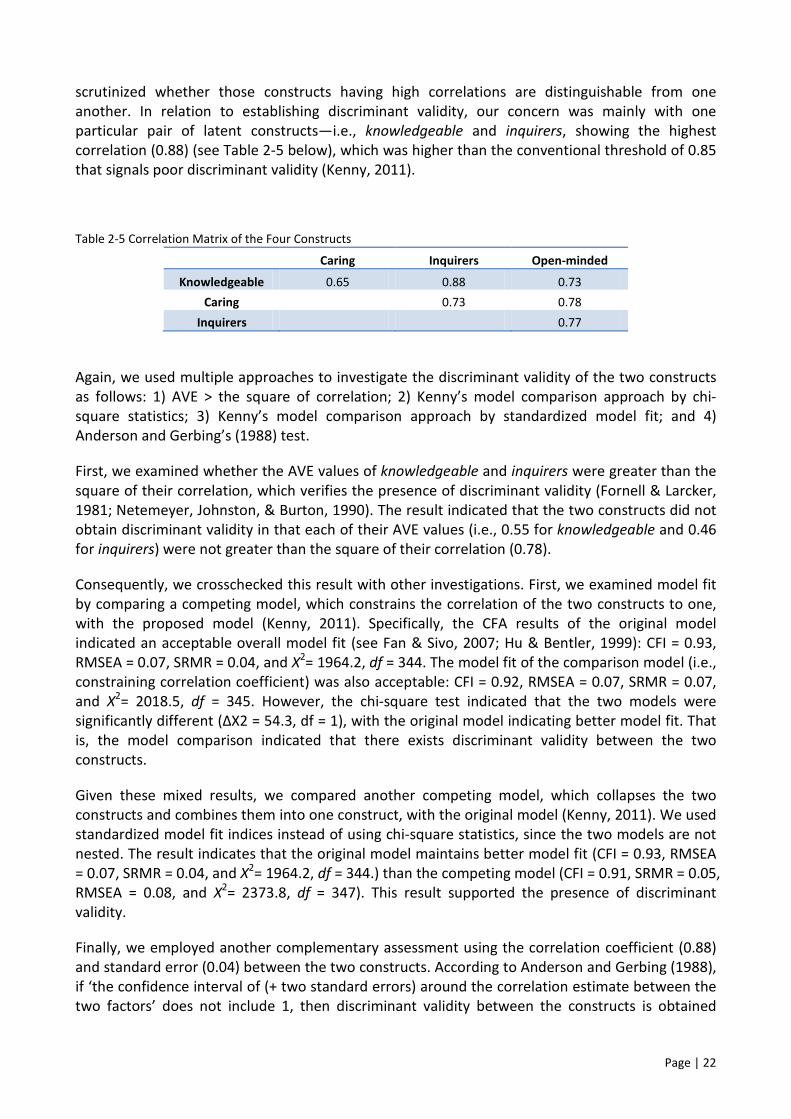
scrutinized whether those constructs having high correlations are distinguishable from one another. In relation to establishing discriminant validity, our concern was mainly with one particular pair of latent constructs—i.e., knowledgeable and inquirers, showing the highest correlation (0.88) (see Table 2-5 below), which was higher than the conventional threshold of 0.85 that signals poor discriminant validity (Kenny, 2011).
Table 2-5 Correlation Matrix of the Four Constructs
Caring Inquirers Open-minded
Knowledgeable 0.65 0.88 0.73 Caring 0.73 0.78
Inquirers 0.77
Again, we used multiple approaches to investigate the discriminant validity of the two constructs as follows: 1) AVE > the square of correlation; 2) Kenny’s model comparison approach by chi-square statistics; 3) Kenny’s model comparison approach by standardized model fit; and 4) Anderson and Gerbing’s (1988) test.
First, we examined whether the AVE values of knowledgeable and inquirers were greater than the square of their correlation, which verifies the presence of discriminant validity (Fornell & Larcker, 1981; Netemeyer, Johnston, & Burton, 1990). The result indicated that the two constructs did not obtain discriminant validity in that each of their AVE values (i.e., 0.55 for knowledgeable and 0.46 for inquirers) were not greater than the square of their correlation (0.78).
Consequently, we crosschecked this result with other investigations. First, we examined model fit by comparing a competing model, which constrains the correlation of the two constructs to one, with the proposed model (Kenny, 2011). Specifically, the CFA results of the original model indicated an acceptable overall model fit (see Fan & Sivo, 2007; Hu & Bentler, 1999): CFI = 0.93, RMSEA = 0.07, SRMR = 0.04, and X2= 1964.2, df = 344. The model fit of the comparison model (i.e., constraining correlation coefficient) was also acceptable: CFI = 0.92, RMSEA = 0.07, SRMR = 0.07, and X2= 2018.5, df = 345. However, the chi-square test indicated that the two models were significantly different (ΔX2 = 54.3, df = 1), with the original model indicating better model fit. That is, the model comparison indicated that there exists discriminant validity between the two constructs.
Given these mixed results, we compared another competing model, which collapses the two constructs and combines them into one construct, with the original model (Kenny, 2011). We used standardized model fit indices instead of using chi-square statistics, since the two models are not nested. The result indicates that the original model maintains better model fit (CFI = 0.93, RMSEA = 0.07, SRMR = 0.04, and X2= 1964.2, df = 344.) than the competing model (CFI = 0.91, SRMR = 0.05, RMSEA = 0.08, and X2= 2373.8, df = 347). This result supported the presence of discriminant validity.
Finally, we employed another complementary assessment using the correlation coefficient (0.88) and standard error (0.04) between the two constructs. According to Anderson and Gerbing (1988), if ‘the confidence interval of (+ two standard errors) around the correlation estimate between the two factors’ does not include 1, then discriminant validity between the constructs is obtained

Page | 23
since the two constructs are not the same (p. 416). The result suggested that discriminant validity exists between the two constructs: [0.88 + 2 x 0.04 = 0.87~0.89].
Given that three out of the four tests for discriminant validity supported the distinctive psychometric property between knowledgeable and inquirers, we believe that the IBLPQ has good discriminant validity1.
In conclusion, the IBLPQ showed strong and solid psychometric properties related to construct validity (i.e., convergent and discriminant validity) and measurement reliability. Given that we achieved “content validity” from Delphi studies as well, we believe that the IBLPQ is a well-designed and reliable survey questionnaire for measuring the four LP attributes.
2-3 Construct Validity of the Main Study Survey
Based on the solid construct validity of the IBLPQ with the pilot study sample students, we conducted the main survey with DP students in IB schools in Southeast Asian countries for the purpose of cross-validation of the instrument. Consistent with the RFP, our sampling focused on the following five countries in Southeast Asia: Cambodia, Indonesia, Singapore, Thailand, and Vietnam. The second criterion for sampling was whether schools had students sitting for the IB DP examination in May 2013. As a result, we identified 56 IB schools. Of them, 20 schools were continuum schools and 36 schools were DP-only schools. With the collaboration of administrators and teachers, we invited students in the 56 schools to complete the LP survey using an online platform. Through this process, 13 continuum and 17 DP-only schools agreed to participate in the survey. Although they were not randomly sampled, due to the nature of voluntary participation in the study, we obtained slightly more than half of the target schools (i.e., 30 out of the 56 schools).
Specifically, 1,047 DP students from 30 schools participated in our LP survey. However, while agreeing to participate in the survey, students who did not provide any single response to the LP survey were excluded. Based on the valid responses, the final analysis included 758 DP students from 29 schools in four different countries in Southeast Asia (i.e., Indonesia, Singapore, Thailand, and Vietnam) as presented in Table 2-6.
Basic descriptive statistics indicates that 90.4% and 9.6% students were taking the IB Diploma and the IB Certificate, respectively. Slightly more than half of the students were female (57.0%). The pattern of these descriptive statistics was similar to that of the pilot study sample students. However, students in the main study reported approximately double the percentage of participation in both the PYP and MYP than did their peers in the pilot study.
Specifically, 24.1% of the main study sample students indicated that they participated in the PYP when they were in primary school, whereas 46.8% of the sample students reported their participation in the MYP prior to the DP.
1 Additionally, given the consistently positive correlations among the four constructs in Table 2-5 above, it can be said that our LP instrument has nomological validity as well, a part of construct validity.

Page | 24
Table 2-6 IB Schools Participating in the Main Study (Student) and Response Rates Country School Code Number of Valid Responses in Student Survey Response Rate
Indonesia School 4 14 23.33% School 10 15 17.86%
School 12 38 21.11% School 21 9 45.00% School 22 84 77.06% School 23 2 18.18% School 26 24 82.76% School 29 24 58.54%
Singapore School 2 29 74.36% School 6 10 37.04%
School 9 10 35.71% School 11 7 8.97% School 16 8 72.73% School 17 88 40.55% School 25 76 51.35% School 27 27 62.79%
Thailand School 5 8 17.02% School 7 8 34.78%
School 8 8 44.44% School 13 16 57.14% School 15 82 87.23% School 18 15 38.46% School 19 19 17.59% School 28 5 19.23% School 31 9 6.34%
Vietnam School 1 4 28.57% School 3 52 85.25%
School 20 50 75.76% School 30 17 33.33%
Total 29 758 Note: School I and II also participated in our qualitative study.
With respect to nationality, the sample students in Southeast Asia indicated 52 different nationalities from various continents (see Figure 2-2). While diverse, they were less diverse than the pilot student samples from 76 different societies. Notably, 19.0% and 1.7% of the sample students indicated two and three nationalities, respectively. These were lower percentages, compared to students from the pilot study (i.e., 35.4% and 4.3%, respectively). The proportion of major nationalities was as follows: Indonesia (19.4%), Thailand (11.1%), Singapore (10.1%), India (7.5%), UK (6.5%), Vietnam (6.1%), South Korea (5.5%), USA (4.6%), and Australia (4.4%). Given that the IB schools were located in the four countries (i.e., Indonesia, Thailand, Singapore, and Vietnam), the result is not surprising. Despite this difference, a similarity between the main study samples and the pilot study samples in terms of nationality proportion is that Indian and South Korean were major student groups in both studies. The proportion of main study students with British, American, and Australian nationalities is lower than their counterparts in the pilot study, suggesting that relatively high proportions of these student groups tend to study in East Asia rather than Southeast Asia.

Page | 25
Figure 2-2 Nationality of DP students in Main Study
Note: Multiple counting was used.
There was no missing value in either major demographic variable or variables related to the LP. However, approximately 18% missing values were identified in the IB DP examination results1. Based on the identification of no missing values in the IBLPQ items, we scrutinized psychometric properties by investigating soundness of factor structure, reliability of factors (i.e., latent constructs), and construct validity (i.e., convergent and discriminant validity).
The soundness of factor structure was examined by using confirmatory factor analysis, consisting of the four constructs: knowledgeable, inquirers, caring, and open-minded. The CFA measurement model indicated an acceptable overall model fit: CFI = 0.90, RMSEA = 0.07, SRMR = 0.04, and X2= 1770.2, df = 344 (Fan & Sivo, 2007; Hu & Bentler, 1999). In other words, the data supported the four-factor structure. Consistent with the result from the pilot study, we identified four items (two items from caring and two items from open-minded) that had serious cross-factor loadings in the process of CFA. As such, they were excluded in the CFA measurement model. Cronbach’s alphas
1 Specifically, 125 students’ IB DP examination results were either missing or invalid values. Of them, 109 students who indicated that they take the IB DP did not provide a corresponding IB DP examination score. A further inspection showed that 94.5% of them were enrolled at two particular schools. That is, for some unknown reasons, all of the student samples from the two schools did not provide their IB scores whereas they responded to other survey items. The remaining 16 students’ IB DP scores were invalid values, which were deleted before the main analysis. In addition to these missing or invalid values, there were 73 students who participated in the IB certificate program. Given that they did not take the IB DP, they were treated as legitimate missing values and therefore they were not included in the missing value percentage noted above. However, invalid responses were counted as missing values.

Page | 26
also supported the reliability of the constructs: knowledgeable (0.92), inquirers (0.91), caring (0.94), and open-minded (0.91).
Table 2-7 presents descriptive statistics of the four constructs (after eliminating the four items). Given that the questionnaire was based on a 6-point Likert scale, overall the sample students showed moderately positive perceptions of their capacity on the LP attributes: means range from 4.57 to 4.87. Also, these statistics were slightly higher than the means of the LP attributes reported by students in the pilot study.
Table 2-7 Descriptive Statistics of the Four Constructs in Main Study Minimum Maximum Mean S.D. Knowledgeable 1.00 6.00 4.87 0.72 Inquirers 1.00 6.00 4.69 0.82 Caring 1.00 6.00 4.67 1.07 Open-minded 1.00 6.00 4.57 1.00
Note: N = 758
As a major part of construct validity, convergent validity was examined. This was tested by employing three multiple approaches in order to ensure the test results—i.e., 1) the degree of factor loadings and statistical significance, 2) average variance extracted (AVE), and 3) construct reliability.
The degree of factor loadings (i.e., standardized regression weights) was substantial and statistically significant. As seen in Table 2-8, all of the indicator variables showed either excellent (i.e., higher than 0.70) or good (i.e., higher than 0.50) factor loadings (Tabachnick & Fidell, 2007).

Page | 27
Table 2-8 Factor Loadings for IB Learner Profile Questionnaire in Main Study Factor Item Factor Loading
Knowledgeable
K1 0.71 K2 0.71 K3 0.71 K4 0.68 K5 0.70 K6 0.73 K7 0.70 K8 0.67
Caring
C1 0.89 C2 0.89 C3 0.84 C4 0.83 C5 0.86 C8 0.81
Inquirers
I1 0.68 I2 0.60 I3 0.67 I4 0.73 I5 0.71 I6 0.72 I7 0.65 I8 0.67
Open-minded
O1 0.71 O4 0.79 O5 0.82 O6 0.86 O7 0.83 O8 0.79
Along with inspecting the factor loadings and their statistical significance, we further investigated the average variance extracted (AVE) of each construct in order to confirm convergent validity. AVE was computed as follow: AVE = (∑square standardized loadings)/[(∑square standardized loadings) + (∑measurement error)]. Higher AVE values suggest that indicator variables are more representative of each construct. While the constructs of knowledgeable (0.51), caring (0.65), and open-minded (0.56) obtained reasonable convergent validity (i.e., higher than 0.50), the construct of inquirers showed 0.40, which was slightly lower than the cut-off value (0.50). The result of AVE was very similar as that of the pilot study.
We conducted construct reliability (also called composite reliability) testing using the following formula: (∑standardized loadings)2/[(∑standardized loadings)2 + (∑measurement error)]. All of the four constructs showed very solid construct reliability: knowledgeable (0.89), inquirers (0.84), caring (0.92) and open-minded (0.88). Note that the cut-off value is 0.70 (Nunnally & Bernstein, 1994).
In summary, the overall results show solid convergent validity for the four constructs. The degree of factor loadings and statistical significance supported convergent validity of all four constructs. The AVE approach supported convergent validity of three out of the four constructs. Finally, the construct reliability test supported the convergent validity for all four constructs. Given these results, the IBLPQ has solid convergent validity.
Next, we investigated another main part of construct validity, discriminant validity. Due to the presence of a few pairs of constructs having high correlations in our measurement model, we
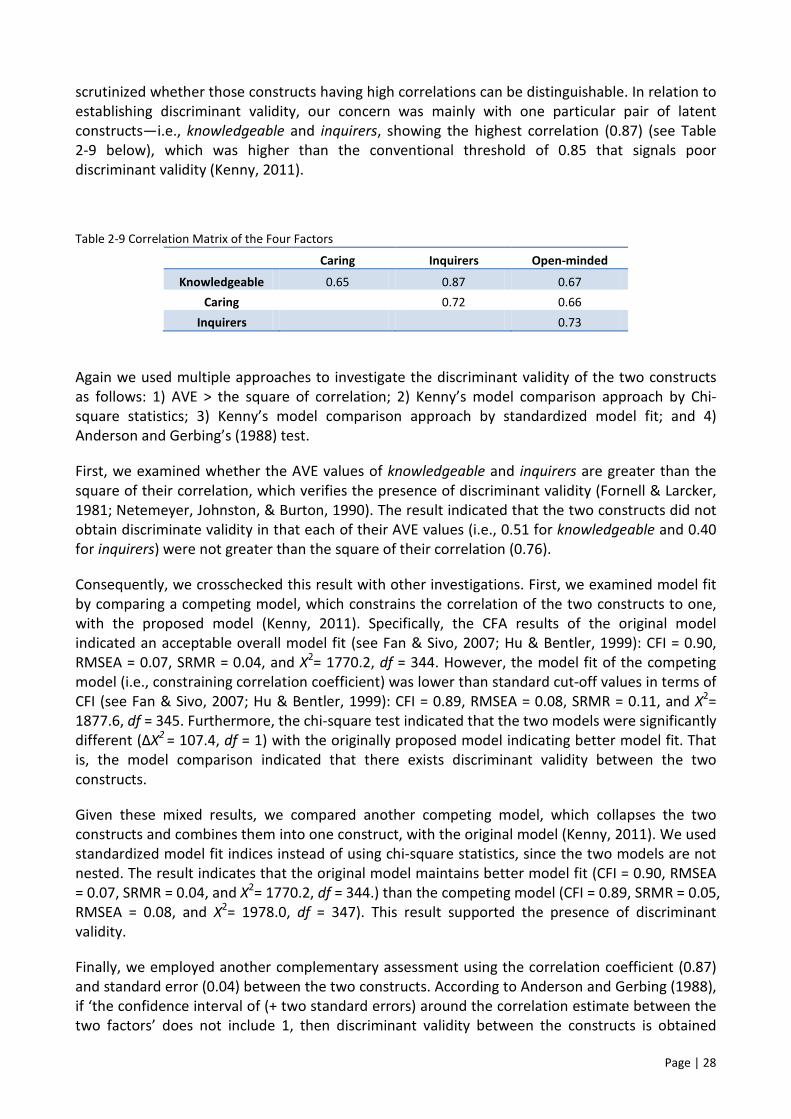
Page | 28
scrutinized whether those constructs having high correlations can be distinguishable. In relation to establishing discriminant validity, our concern was mainly with one particular pair of latent constructs—i.e., knowledgeable and inquirers, showing the highest correlation (0.87) (see Table 2-9 below), which was higher than the conventional threshold of 0.85 that signals poor discriminant validity (Kenny, 2011).
Table 2-9 Correlation Matrix of the Four Factors
Caring Inquirers Open-minded
Knowledgeable 0.65 0.87 0.67 Caring 0.72 0.66
Inquirers 0.73
Again we used multiple approaches to investigate the discriminant validity of the two constructs as follows: 1) AVE > the square of correlation; 2) Kenny’s model comparison approach by Chi-square statistics; 3) Kenny’s model comparison approach by standardized model fit; and 4) Anderson and Gerbing’s (1988) test.
First, we examined whether the AVE values of knowledgeable and inquirers are greater than the square of their correlation, which verifies the presence of discriminant validity (Fornell & Larcker, 1981; Netemeyer, Johnston, & Burton, 1990). The result indicated that the two constructs did not obtain discriminate validity in that each of their AVE values (i.e., 0.51 for knowledgeable and 0.40 for inquirers) were not greater than the square of their correlation (0.76).
Consequently, we crosschecked this result with other investigations. First, we examined model fit by comparing a competing model, which constrains the correlation of the two constructs to one, with the proposed model (Kenny, 2011). Specifically, the CFA results of the original model indicated an acceptable overall model fit (see Fan & Sivo, 2007; Hu & Bentler, 1999): CFI = 0.90, RMSEA = 0.07, SRMR = 0.04, and X2= 1770.2, df = 344. However, the model fit of the competing model (i.e., constraining correlation coefficient) was lower than standard cut-off values in terms of CFI (see Fan & Sivo, 2007; Hu & Bentler, 1999): CFI = 0.89, RMSEA = 0.08, SRMR = 0.11, and X2= 1877.6, df = 345. Furthermore, the chi-square test indicated that the two models were significantly different (ΔX2 = 107.4, df = 1) with the originally proposed model indicating better model fit. That is, the model comparison indicated that there exists discriminant validity between the two constructs.
Given these mixed results, we compared another competing model, which collapses the two constructs and combines them into one construct, with the original model (Kenny, 2011). We used standardized model fit indices instead of using chi-square statistics, since the two models are not nested. The result indicates that the original model maintains better model fit (CFI = 0.90, RMSEA = 0.07, SRMR = 0.04, and X2= 1770.2, df = 344.) than the competing model (CFI = 0.89, SRMR = 0.05, RMSEA = 0.08, and X2= 1978.0, df = 347). This result supported the presence of discriminant validity.
Finally, we employed another complementary assessment using the correlation coefficient (0.87) and standard error (0.04) between the two constructs. According to Anderson and Gerbing (1988), if ‘the confidence interval of (+ two standard errors) around the correlation estimate between the two factors’ does not include 1, then discriminant validity between the constructs is obtained

Page | 29
since the two constructs are not the same (p. 416). The result suggested that discriminant validity exists between the two constructs: [0.87 + 2 x 0.04 = 0.80~0.94].
Given that three out of the four tests for discriminant validity supported the distinctive psychological property between knowledgeable and inquirers, we believe that the IBLPQ has good discriminant validity.
2-4 Summary of Findings
• In the qualitative part of the Delphi study, 23 IB professionals and a group of DP students were invited to comment on each item of the initial IB Learner Profile Questionnaire (IBLPQ). Based on their comments we modified the initial draft of the IBLPQ. The revised IBLPQ contained 32 items, 8 in each LP attribute.
• In the quantitative part of the Delphi study, we analyzed ratings of content relevance from 32 IB experts. We first computed the content validity ratio (CVR). The CVRs of all the items indicated solid content validity. This was reaffirmed by more sophisticated approaches such as Aiken’s V and Penfield’s confidential interval.
• The finalized IBLPQ with content validity was piloted with 976 DP students from 18 IB schools in East and Southeast Asian countries. Using multiple approaches to testing construct validity, we obtained sound psychometric properties of the IBLPQ and solid construct validity. The same IBLPQ was further validated with our target population—i.e., 758 DP students from 29 schools in four Southeast Asian countries. From this main study sample, we confirmed 1) soundness of factor structure; 2) construct validity (i.e., convergent and discriminant validity); and 3) measurement reliability.
• In sum, based on the validation analyses of pilot and main study data, the IBLPQ showed strong and solid psychometric properties related to construct validity and measurement reliability. Given that we achieved “content validity” from Delphi studies and cross-validation with different samples as well, we believe that the IBLPQ is a well-designed and reliable survey questionnaire for measuring the four LP attributes.

Page | 30
3 Quantitative Study I Validation of Teacher Survey Instrument
In this chapter, we provide the results of the validation study of existing survey instruments used for this research project. Unlike the IBLPQ, which was developed by the research team, the teacher survey applied in this project adopted widely used survey instruments.
The teacher survey comprised three main parts. First, teachers’ assessment of leadership practices included survey items on strategic resourcing (cf. Caldwell, 1998; Kwan, 2009; Walker & Kwan, 2009; Walker, Lee, & Bryant, forthcoming), learning focus (cf. Lee, Walker, & Chui, 2012; Louis et al., 2010; Robinson, Lloyd & Rowe, 2008), classroom monitoring (cf. Lee, Walker, & Chui, 2012; Walker & Ko, 2011), and alignment and articulation (cf. Gronn, 2002; Lee, Hallinger, & Walker, 2012a; Spillane, 2006). Second, survey items measuring teachers’ perceptions of colleagues’ involvement in professional community included shared responsibility, reflective dialogue, and de-privatized practice (cf. Lee, Louis, & Anderson, 2012; Louis & Lee, 2012; Louis et al., 2010). Finally, survey items measuring teachers’ perceptions of organizational conditions included mission focused (cf. Ko, Hallinger, & Walker, 2012; Walker & Ko, 2011; Walker & Kwan, 2009) and learning support (cf. Louis & Lee, 2012; Newmann, Smith, Allensworth, & Bryk, 2001; Walker & Ko, 2011). Given that these survey items were originally developed from either western school contexts or Hong Kong school systems targeting mostly public or government schools, the validity of using those survey items for international schools in Southeast Asia was essential before moving onto the major statistical analysis of this project.
3-1 Data Collection
The same data collection procedure for the IBLPQ was used for the collection of teacher survey data (see the previous section of the main study). We used the International School Leadership Questionnaire (ISLQ) to collect quantitative survey data from teachers in 29 out of the 56 IB schools implementing the DP in four Southeast Asian countries: Indonesia, Thailand, Singapore, and Vietnam (i.e., the same schools and countries for the IBLPQ). The teacher survey data were collected through an online system accessed through the internet (i.e., Survey Monkey), because our research experience in international and local schools suggests that online surveys with teachers provides a better response rate than using an on-site paper survey. In total, the teacher survey data included 333 teachers from the 29 schools1.
The survey focused on three dimensions: leadership practices, organizational conditions, and teacher professional community as a key part of school culture.2 As noted above, we utilized existing validated survey instruments. More specifically, for teachers’ assessment of leadership practices and organizational conditions, we used Walker and colleagues’ survey instrument (e.g., Lee, Walker, & Chui, 2012; Walker & Ko, 2011; Walker & Kwan, 2012), which has been widely used
1 Originally, 474 teachers from 30 schools from four countries agreed to participate in the survey. However, 141 teachers who logged into our online survey platform did not respond to any single response to key questions on leadership practices, organizational conditions, and teacher professional community. As such, they were excluded.
2 A detailed description of the three dimensions is provided in Section 3 of this chapter.

Page | 31
in the Asia Pacific region. To measure teacher professional community, we employed an internationally validated survey, developed by Louis, Leithwood, Walhstrom, and Anderson (2010). Even though the instruments have been used internationally, we investigated the validity of the survey instruments given that the IB school context would be different from the context of studies previously using the surveys.
Finally, we also collected information about certain teacher attributes (e.g., gender, ethnicity, and years of teaching) through the survey and archival data about school contexts (e.g., size and number of years delivering IB programs) to inform our subsequent analysis.
3-2 Analytical Strategies
We employed confirmatory factor analysis (CFA) in order to validate our measures with survey data gathered from 333 teachers in 29 schools in four countries: Indonesia, Singapore, Thailand, and Vietnam. Through CFA, we sought to test our measurement model, including the constructs of leadership practices, organizational conditions, and teacher professional community. Specifically, we examined the psychometric properties and construct validity of measures used in our model. To validate the measures, we focused on convergent validity, discriminant validity, reliability analysis (Cronbach’s alpha and construct reliability) and the overall model fit of the measurement model.
The key indices used to assess model fit included comparative fit index (CFI), Tucker Lewis index (TLI), and root mean square error of approximation (RMSEA). To interpret the results, we referenced the standard cut-off recommendations (Hu & Bentler, 1999; Fan & Sivo, 2007)1.
Before these analyses, our initial inspection of the survey data indicated that missing values for the three dimensions, including leadership practices, organizational conditions, and teacher professional community, were less than 10%; on average, 2.6% of values were missing2. Regarding demographic variables, we noted that on average less than 0.1 % of values were missing3. To address these missing values properly, we used full-information maximum-likelihood (FIML) estimation, which has been identified to be less biased than listwise deletion and pairwise deletion (Little & Rubin, 1989; Schafer & Olsen, 1998; Muthen, Kaplan, & Hollis, 1987).
1 For the CFI and TLI, values greater than 0.95 and 0.90 indicate goodness of fit and acceptable fit, respectively. For the RMSEA, values less than 0.08 suggest an acceptable model fit (Hu & Bentler, 1999; Fan & Sivo, 2007).
2 Given that the three dimensions are constructed through CFA, the three dimensions are interchangeably referred to as latent constructs throughout this report.
3 The percentage of the missing values here does not include legitimate missing values. In the survey, some demographic variables included legitimate missing values. For example, teachers were allowed to skip certain questions if those questions were not relevant to them. For example, DP teachers without having teaching experiences of the PYP or the MYP could skip questions asking whether they had such teaching experiences.

Page | 32
3-3 Results
The sample of the teacher survey data included 333 teachers from 29 schools in the four countries. As presented in Table 3-1, the majority of the teachers were from IB schools in Singapore (36%). This was followed by teachers from IB schools in Indonesia and Thailand (27.3%, respectively). The smallest group of teachers in the survey were from IB schools in Vietnam, accounting for 9.3% (see Table 3-1 for details about participating teachers from 29 schools). Of the 33 teachers, 159 teachers (47.7%) were from 13 continuum schools and 174 teachers (52.3%) were from DP-only schools.
Table 3-1 IB Schools Participating in the Main Study (Teacher) and Response Rates Country Name School Code Number of Valid Responses in Teacher Survey Response Rate
Indonesia School 4 9 16.00% School 10 13 Not available School 12 18 26.67% School 14 2 Not available School 21 6 40.00% School 22 16 45.71% School 23 6 35.29% School 26 14 Not available School 29 7 53.85% Singapore School 2 4 6.67% School 6 7 37.50% School 9 5 29.41% School 11 15 53.57% School 16 8 100.00% School 17 33 Not available School 25 28 53.85% School 27 20 54.29% Thailand School 5 12 Not available School 7 16 Not available School 13 11 68.75% School 15 26 44.44% School 18 7 38.89% School 19 12 31.58% School 24 1 7.69% School 28 6 25.00% Vietnam School 1 8 57.14% School 3 4 Not available School 20 10 83.33% School 30 9 32.14% Total 29 333
Notes: 1) Some schools did not provide the number of teachers who taught IB DP examination candidates in May 2013, therefore the response rates of these schools were not available. 2) Two of the above schools also participated in our qualitative study.

Page | 33
In terms of teacher demographics, 54.4% of the participating teachers were male teachers. A majority of the teachers had a master’s degree (52.6%). About one third of the teachers had multiple positions, including both teaching and administrative positions. This pattern is consistent with the finding of the recent IB studies in Asia (cf. Lee, Hallinger, & Walker, 2012a). About 74% of the teachers were from western countries including the United States, Canada, the United Kingdom, Australia and New Zealand. On average, the participating teachers had about 16 years of teaching experience and have been working in their current schools for five years.
Table 3-2 Demographics of the Participating Teachers
Frequency Percentage Gender Male 181 54.4
Female 152 45.6 Qualification Bachelor Degree 142 42.3
Master’s Degree 175 52.6 Doctoral Degree 16 4.8
Position Single Position 220 66.0 Two Positions 92 27.6 Three Positions 21 6.3
Nationality Western Countries 246 73.9 Asian Countries 79 23.7 African/South America 2 0.6 Mixed 6 1.8
Min. Max. Mean S.D. Teaching Experiences
Years of Teaching (Total) 1 45 16.25 8.69 Years of Teaching (Current School) 1 30 5.01 4.44
We investigated the soundness of factor structure and the psychological properties of measures by using CFA. The CFA measurement model consists of eleven latent constructs to reflect key cultural features of school culture: six latent constructs of leadership practices, two latent constructs of organizational conditions and three latent constructs of teacher professional community. Notably, the CFA measurement model indicated a number of cross-factor loadings among the 50 items in our instrument. As such, of the 50 items, 16 items were excluded because serious cross-factor readings reduced discriminant validity. The CFA model excluding the items with serious factor loadings indicated an acceptable overall model fit (see Fan & Sivo, 2007; Hu & Bentler, 1999): CFI = 0.92, TLI = 0.90, RMSEA = 0.06, and X2= 1329.9, df = 574. In other words, the eleven-factor structure was supported by the data, presented in Table 3-3.

Page | 34
Table 3-3 Constructs from CFA Measurement Model
Dimension Sub-dimension Construct Item α
Leadership practices
Learning and Teaching
Strategic Resourcing
Allocates resources strategically based on student needs 0.91 Demonstrates an ability to secure additional resources for the school Utilizes support (auxiliary) staff for the benefit of student learning Provides or locates resources to help staff improve their teaching
Classroom Monitoring
After observing classroom activities, works with teachers to improve their teaching 0.92 Regularly observes classroom activities Regularly inspects student work
Learning Focus Encourages staff to consider new ideas for their teaching 0.81 Designs strategies to improve student learning Articulates high expectations for student academic achievement
Alignment and Articulation
Within-program Interaction
Share ideas about effective teaching with other DP teachers in this school 0.92 Share teaching materials or learning activities with other DP teachers in this school Discuss the DP program standards and assessment with other DP teachers in this school Share what I learned at workshops or conferences with other DP teachers in this school Discuss the educational philosophy and values embedded in the Learner Profile with other DP teachers in this school
Cross-program Interaction
School leaders purposively schedule time for teachers to work together 0.83 School leaders purposively schedule time for teachers across programs to work together School leaders provide enough resources to support teachers to work effectively across programs
Coherence Building
School leaders and/or Program Coordinators in this school teach classes 0.77 School leaders encourage a common language of teaching and assessment across school programs School leaders provide clear guidelines and documentation to support curriculum implementation

Page | 35
Table 3-3 Constructs from CFA Measurement Model (continued) Dimension Sub-dimension Construct Item α
Organizational Conditions
N/A Mission Focused Our strategies are formulated around our school purpose 0.88 Our annual plan aligns with our school vision We know the priorities that our school wants to achieve
Learning Support The atmosphere in our school encourages students to learn 0.68 Our school provides after school academic support activities for students Our school provides a broad range of extracurricular activities for students
Teacher Professional Community
N/A Shared Responsibility
Teachers in this school help maintain discipline across this school, not just their own classroom 0.86 Teachers in this school take responsibility for improving the school beyond their own class Teachers in this school feel responsible for helping each other to teach better
Reflective Dialogue
Teachers in this school talk to each other about what helps students learn best 0.90 Teachers in this school work together to develop new curriculum Teachers in this school work together to develop or improve curriculum materials
De-privatized Practice
Teachers in this school visit each other’s classes to observe teaching 0.87 Teachers in this school give each other meaningful feedback on their performance Colleagues regularly observe my teaching I regularly invite colleagues to help me teach in my classroom

Page | 36
Based on the CFA measurement model, we confirmed that the following constructs were embedded in the responses of the sample teachers: strategic resourcing, classroom monitoring, learning focus, within-program interaction (within the DP), cross-program interaction, coherence building, mission focused, learning support, shared responsibility, reflective dialogue, and de-privatized practice. It should be noted that the construct of cross-program interaction should be interpreted with two nuanced differences. As noted earlier, 13 out of the 29 schools were continuum schools. Thus, cross-program interaction in these school contexts means teachers’ interaction across the PYP, the MYP, and the DP for learning and teaching. For the 16 DP-only schools, the construct of cross-program means DP teachers’ interactions with teachers in other building levels such as lower secondary or primary sections, which do not necessarily implement IB programs.
Figure 3-1 illustrates the grouping of constructs of Leadership in IB Schools embedded within the dimensions of leadership practices, organizational conditions, and teacher professional community. The figure is intended to illustrate the grouping of constructs and not to imply hierarchy or relationships among them. The specific items associated with each construct are displayed on Table 3-3.
Figure 3-1 A Framework of Leadership in IB Schools
Leadership Practices
The constructs under leadership practices are arranged within two sub-dimensions. The first sub-dimension focuses on what principals do to improve learning and teaching in the school. The second comprises activities that principals promote to support the alignment and articulation of the instructional program.
Leadership in IB Schools
Leadership Practices
Learning & Teaching
Strategic Resourcing
Classrooom Monitoring
Learning Focus
Alignment & Articulation
Within-program Interaction
Cross-program Interaction
Coherence Building
Orgnizational Conditions
Mission Focused
Learning Support
Teacher Professional Community
Shared Responsibility
Reflective Dialogue
De-privatized Practice

Page | 37
Learning and Teaching
The three constructs grouped under the label learning and teaching consider strategies that principals enact to improve learning and teaching. Strategic resourcing pertains to principals’ capacity to secure resources and allocate them to improve learning and teaching. Classroom monitoring concerns principals’ direct interventions in classroom in the learning and teaching process through conducting observations, providing feedback to teachers, and monitoring student work. Learning focus reflects ways that principals stimulate improvement in learning and teaching by setting high expectations and encouraging innovative teaching.
Alignment and Articulation
The second sub-dimension, alignment and articulation, considers strategies that principals promote to encourage dialogue among DP teachers about facets of the DP program, to stimulate teachers to engage in work across the programs, and to build school-wide coherence with regard to teaching, learning, assessment and the curriculum.
Organizational Conditions
Two constructs embedded within the organizational conditions dimension relate to facets of school culture. Mission focused considers the extent to which values and vision are galvanized to set and communicate school strategies, priorities and planning. Learning support pertains to the learning atmosphere and the provision of opportunities beyond the classroom to support student achievement.
Teacher Professional Community
The dimension of teacher professional community draws together ways in which teachers work together. This includes shared responsibility for discipline, teaching and school improvement; reflective dialogue around curriculum and instruction; and engagement in co-teaching, peer-observation, feedback, termed de-privatized practice.

Page | 38
Table 3-4 presents descriptive statistics based on the factor structure identified from the CFA measurement model. Given that each survey item was based on a 6-point Likert scale, on average the participating teachers indicated slightly positive ratings of their principals’ (or leaders’) practices on strategic resourcing (4.57), classroom monitoring (4.33), within-program interaction (4.21) and coherence building (4.46). Also, the teachers showed positive perceptions of their organizational conditions (i.e., mission focused, learning support) and teacher professional community (i.e., shared responsibility, reflective dialogue). However, de-privatized practice (3.16) did not seem to be salient in the participating schools, given that 3.00 on the Likert scale indicates “slightly disagree”.
Table 3-4 Descriptive Statistics of the Constructs in Teacher Survey
Min. Max. Mean S.D.
Strategic Resourcing 1.00 6.00 4.57 1.16 Classroom Monitoring 1.00 6.00 3.42 1.50 Learning Focus 1.00 6.00 4.33 1.23 Within-program Interaction 1.00 6.00 4.21 1.24 Cross-program Interaction 1.00 6.00 3.56 1.37 Coherence Building 1.00 6.00 4.46 1.17 Mission Focused 1.00 6.00 4.51 1.25 Learning Support 1.00 6.00 5.05 0.94 Shared Responsibility 1.00 6.00 4.51 1.09 Reflective Dialogue 1.00 6.00 4.61 1.14 De-privatized Practice 1.00 6.00 3.16 1.25
Note: N = 333
Based on the CFA model, we investigated construct validity and reliability. To examine construct validity, we focused on convergent validity and discriminant validity. To check reliability, we used Cronbach’s alpha.
We first checked the factor loadings of all the indicator variables to inspect convergent validity. As Table 3-5 shows, all the indicator variables loaded significantly on their respective factors. Five indicator variables showed good factor loadings (i.e., higher than 0.50) and the other 31 indicator variables showed excellent factor loadings (i.e., higher than 0.70) (Tabachnick & Fidell, 2007).

Page | 39
Table 3-5 Factor Loadings for Teacher Survey Constructs Construct Item Estimate
Strategic Resourcing
RM1 0.87 RM2 0.89 RM3 0.80 RM4 0.85
Classroom Monitoring QA1 0.87 QA2 0.90 QA3 0.90
Learning Focus TL1 0.82 TL2 0.89 TL3 0.64
Within-program Interaction
WTI1 0.91 WTI2 0.92 WTI3 0.89 WTI4 0.75 WTI5 0.75
Cross-program Interaction CTI1 0.87 CTI2 0.85 CTI3 0.68
Coherence Building Art1 0.53 Art2 0.82 Art3 0.87
Mission Focused AC1 0.90 AC2 0.89 AC3 0.75
Learning Support SS1 0.50 SS2 0.63 SS3 0.80
Shared Responsibility SR1 0.76 SR2 0.81 SR3 0.89
Reflective Dialogue RD1 0.84 RD2 0.86 RD3 0.89
De-privatized Practice
DP1 0.90 DP2 0.91 DP3 0.82 DP4 0.50

Page | 40
To further ensure convergent validity, we used two approaches: average variance extracted (AVE) and construct reliability. AVE refers to the degree to which measures of the same construct are strong (Campbell & Fiske, 1959). Higher AVE values suggest that indicator variables are more representative of each construct. AVE is computed as follow: AVE = (∑square standardized loadings)/[(∑square standardized loadings) + (∑measurement error)].
The convergent validity of the following six constructs were obtained, at a cut-off value of 0.50: strategic resourcing (0.60), classroom monitoring (0.59), mission focused (0.57), shared responsibility (0.58), reflective dialogue (0.66), and within-program interaction (0.55). The convergent validity of the other 7 constructs was lower than the cut-off value: learning focus (0.45), de-privatized practice (0.46), cross-program interaction (0.43), coherence building (0.40), and learning support (0.35). Given this, overall the convergent validity of those measures was partially obtained.
Construct reliability (also called composite reliability) tests were calculated by (∑standardized loadings)2/[(∑standardized loadings)2 + (∑measurement error)]. Eight out of the eleven constructs showed solid construct reliability (Nunnally & Bernstein, 1994): resource management (0.86), classroom monitoring (0.81), learning focus (0.71), mission focused (0.80), shared responsibility (0.80), reflective dialogue (0.85), de-privatized practice (0.76), within-program interaction (0.86). Note that the cut-off value is 0.70. However, three constructs were slightly lower than the cut-off value: cross-program interaction (0.69), coherence building (0.65), and learning support (0.61).
The overall results show that we have convergent validity for most of the constructs. The degree of factor loadings and statistical significance supported convergent validity of all constructs. Additionally, based on the results from AVE, and construct reliability, we believe that most of the latent constructs have solid construct validity. However, there is a need for further investigation of constructs such as coherence building and learning support.
Next, we investigated discriminant validity. Due to the presence of a few pairs of constructs having high correlations (i.e., higher than 0.80) in our measurement model, we scrutinized whether those constructs having high correlations can be distinguishable. The pairs of constructs include: 1) shared responsibility and reflective dialogue (0.84); 2) classroom monitoring and learning focus (0.82); and 3) learning support and mission focused (0.83). To some extent, such high correlations are understandable because each pair of factors can be a part of a second-order factor: for example, shared responsibility and reflective dialogue as a part of “teacher professional community” (Lee, Louis, & Anderson, 2012), learning support and mission focused as a part of “organizational conditions” (Walker & Ko, 2012). Nonetheless, in order to ensure discriminant validity, our concern was particularly with the pair of shared responsibility and reflective dialogue, showing the highest correlation (0.84) (see Table 3-6 below), although the highest correlation between the two constructs was lower than a conventional threshold of 0.85, which may signal poor discriminant validity (Kenny, 2011).

Page | 41
Table 3-6 Correlation Matrix among the Eleven Constructs (1) (2) (3) (4) (5) (6) (7) (8) (9) (10) (11) (1) Learning Support 1.00 0.70 0.48 0.70 0.83 0.70 0.61 0.48 0.64 0.42 0.66 (2) Resource
Management 1.00 0.66 0.80 0.71 0.53 0.58 0.47 0.56 0.54 0.59
(3) Classroom Monitoring 1.00 0.82 0.53 0.53 0.54 0.52 0.58 0.61 0.56 (4) Learning Focus 1.00 0.72 0.60 0.63 0.55 0.71 0.64 0.66 (5) Mission Focused 1.00 0.63 0.59 0.47 0.61 0.52 0.71 (6) Shared Responsibility 1.00 0.84 0.64 0.71 0.55 0.71 (7) Reflective Dialogue 1.00 0.68 0.77 0.59 0.68 (8) De-Privatized Practice 1.00 0.61 0.52 0.54 (9) Within-program
Interaction 1.00 0.66 0.70
(10) Cross-program Interaction 1.00 0.66
(11) Coherence Building 1.00 Note: p<.001
We used two different approaches to investigate the discriminant validity of the two constructs as follows: 1) AVE > the square of correlation; and 2) Kenny’s model comparison approach by standardized model fit. First, we examined whether the AVE values of shared responsibility and reflective dialogue are greater than the square of their correlation, which verifies the presence of discriminant validity (Fornell & Larcker, 1981; Netemeyer, Johnston, & Burton, 1990). The result indicated that the two constructs did not obtain discriminate validity in that each of their AVE values (i.e., 0.58 for shared responsibility and 0.66 for reflective dialogue) were not greater than the square of their correlation (0.70).
Second, we compared the CFA measurement model with a competing model, which collapses the two constructs and combine them into one construct, with the original model (Kenny, 2011). We used standardized model fit indices instead of using chi-square statistics, since the two models are not nested. The result indicates that the original model maintains better model fit (CFI = 0.92, TLI = 0.90, RMSEA = 0.06, and X2= 1329.9, df = 574) than the competing model (CFI = 0.91, TLI = 0.89, RMSEA = 0.07, and X2= 1420.5, df = 584). This result supported the presence of discriminant validity.
In addition, Cronbach’s alphas for all of the constructs indicated that solid reliability was obtained (see Table 3-3 above). While the reliability coefficient of learning support was 0.68, it is still acceptable given that Cronbach’s alpha is not just a function of internal consistency but also is determined by the number of measured items (Cronbach, 1951). That is, it can be artificially deflated when there are a fewer number of items (McIver & Carmines, 1981).

Page | 42
3-4 Summary of Findings
• Survey data collected from 333 teachers who taught students sitting the IB DP examination in May 2013 were analyzed. Confirmatory factor analysis (CFA) was employed to test our measurement model that includes three dimensions: leadership practices, organizational conditions, and teacher professional community.
• Based on the CFA measurement model, an eleven-factor structure model was identified among 50 items in our survey instrument. As such, of the 50 items, 16 items were excluded because serious cross-factor readings reduced discriminant validity.
• The eleven factors (leadership constructs) embedded in the model are: strategic resourcing, classroom monitoring, learning focus, within-program interaction (within the DP), cross-program interaction, coherence building, mission focused, learning support, shared responsibility, reflective dialogue, and de-privatized practice. They were grouped within three dimensions entitled leadership practices, organizational conditions, and teacher professional community.
• To examine the psychometric properties, we focused on construct validity (convergent validity and discriminant validity), reliability analysis (construct reliability and Cronbach’s alpha) and the overall model fit of the measurement model. The construct validity and reliability results indicated solid convergent validity for most of the constructs. The degree of factor loadings and statistical significance supported convergent validity of all the constructs. Additionally based on the results from average variance extracted (AVE) and construct reliability, we believe that most of the latent constructs have solid construct validity. However, there is a need for further investigation of constructs such as coherence building and learning support.
• In conclusion, the teacher survey instrument showed reasonably solid psychometric properties related to construct validity (i.e., convergent and discriminant validity) and measurement reliability.

Page | 43
4 Quantitative Study II Linking School Characteristics to Teacher and Student Outcomes
In line with the study’s focus on the effect of the IB continuum on student learning (academic and Learner Profile) and the influence of the IB continuum implementation on school leadership practices, organizational conditions, and the teacher professional community, we conducted group difference analysis, latent mean analysis (LMS), and multilevel analysis. First, we looked for group differences in teacher ratings of leadership practices and organizational conditions in IB schools grouped by (1) continuum schools (2) DP-only schools. Second, we investigated group differences in student perceptions of Learner Profile attributes and students’ IB DP examination scores. For these comparisons, we grouped students into continuum students and their counterparts (i.e., multi-program students and DP-only students) based on years of their IB learning experiences. Third, we compared student Learner Profile scores according to the proportion of local students in the school. Finally, we conducted a multilevel analysis focusing on IB DP examination results.
4-1 Comparative Analyses of Teacher and Student Outcomes
To detect group differences in organizational outcomes by type of school (continuum vs. DP-only schools) and type of student (continuum, multi-program, and DP-only students), we initially explored a number of group comparisons using descriptive statistics and t-tests. Specifically, the analysis of this section aims to address Research Questions 1 and 3 (Chapter 1)1 . Figure 4-1 shows the four different combinations of groups, referred to as “Analytical Strategies”, and briefly defines their composition. Once the group differences were detected, we undertook more sophisticated analyses such as latent mean analysis.
1 At the same time, however, since the analysis is based on a group comparison without control variables, we admit that the section partially addresses the research questions. A more comprehensive analysis for examining the research questions is presented in Section 3 of this chapter.

Page | 44
Figure 4-1 Analytical Strategies

Page | 45
4-1-1 Group Comparisons by Type of IB Continuum
Comparing Leadership in IB Schools
Table 4-1 presents descriptive statistics for leadership practices by type of IB continuum (See Chapter 3 for details about measurement). A follow-up t-test for each construct found no significant differences between school types (at the level of p<0.05)1.
Table 4-1 Descriptive Statistics of Leadership Practices by Type of IB Schools
1 = Continuum Schools
2 = DP-only Schools N Mean S.D.
Strategic Resourcing 1.00 175 4.51 1.19 2.00 158 4.63 1.13
Classroom Monitoring 1.00 175 3.50 1.41 2.00 158 3.33 1.60
Learning Focus 1.00 175 4.22 1.25 2.00 158 4.45 1.20
Within-program Interaction 1.00 167 4.12 1.25 2.00 150 4.32 1.23
Cross-program Interaction 1.00 167 3.59 1.34 2.00 150 3.53 1.41
Coherence Building 1.00 167 4.52 1.08 2.00 150 4.40 1.27
Table 4-2 presents descriptive statistics of constructs pertaining to organizational conditions and the teacher professional community by type of schools (continuum vs. DP-only schools). A follow-up t-test for each dimension found no significant differences between school types (at the level of p<0.05)2.
1 The t-test results are not presented as no significant differences were found.
2 The t-test results are not presented because there were no significant differences.
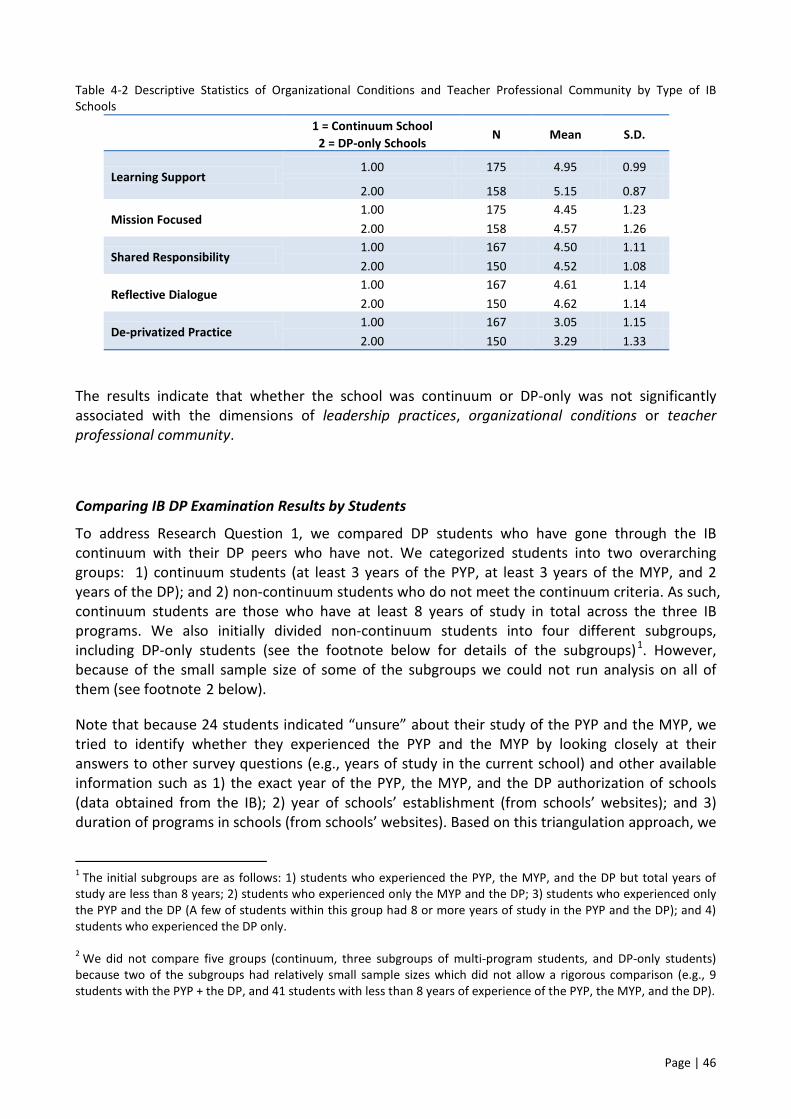
Page | 46
Table 4-2 Descriptive Statistics of Organizational Conditions and Teacher Professional Community by Type of IB Schools
1 = Continuum School
2 = DP-only Schools N Mean S.D.
Learning Support 1.00 175 4.95 0.99
2.00 158 5.15 0.87
Mission Focused 1.00 175 4.45 1.23 2.00 158 4.57 1.26
Shared Responsibility 1.00 167 4.50 1.11 2.00 150 4.52 1.08
Reflective Dialogue 1.00 167 4.61 1.14 2.00 150 4.62 1.14
De-privatized Practice 1.00 167 3.05 1.15 2.00 150 3.29 1.33
The results indicate that whether the school was continuum or DP-only was not significantly associated with the dimensions of leadership practices, organizational conditions or teacher professional community.
Comparing IB DP Examination Results by Students
To address Research Question 1, we compared DP students who have gone through the IB continuum with their DP peers who have not. We categorized students into two overarching groups: 1) continuum students (at least 3 years of the PYP, at least 3 years of the MYP, and 2 years of the DP); and 2) non-continuum students who do not meet the continuum criteria. As such, continuum students are those who have at least 8 years of study in total across the three IB programs. We also initially divided non-continuum students into four different subgroups, including DP-only students (see the footnote below for details of the subgroups)1. However, because of the small sample size of some of the subgroups we could not run analysis on all of them (see footnote 2 below).
Note that because 24 students indicated “unsure” about their study of the PYP and the MYP, we tried to identify whether they experienced the PYP and the MYP by looking closely at their answers to other survey questions (e.g., years of study in the current school) and other available information such as 1) the exact year of the PYP, the MYP, and the DP authorization of schools (data obtained from the IB); 2) year of schools’ establishment (from schools’ websites); and 3) duration of programs in schools (from schools’ websites). Based on this triangulation approach, we
1 The initial subgroups are as follows: 1) students who experienced the PYP, the MYP, and the DP but total years of study are less than 8 years; 2) students who experienced only the MYP and the DP; 3) students who experienced only the PYP and the DP (A few of students within this group had 8 or more years of study in the PYP and the DP); and 4) students who experienced the DP only.
2 We did not compare five groups (continuum, three subgroups of multi-program students, and DP-only students) because two of the subgroups had relatively small sample sizes which did not allow a rigorous comparison (e.g., 9 students with the PYP + the DP, and 41 students with less than 8 years of experience of the PYP, the MYP, and the DP).

Page | 47
categorized some students with “unsure” answers into either one of the two continuum categories. Through this approach, we identified 18 out of the 24 students’ IB experience in terms of the aforementioned two categories. Of the 18 students, we could also assign 5 students to more detailed groups such as the continuum group, multi-program group, and DP-only group, whereas the other 13 students could be assigned to only either continuum or the composite non-continuum group. Hence, we examined two datasets with slightly different Ns: N = 560 (continuum and non-continuum); and N = 547 (continuum, three different subgroups of multi-program students, and DP-only students).
Results indicate that no significant differences were found between student groups with regards to IB DP examination results. The average IB examination score of continuum students was 32.93 whereas that of their non-continuum counterparts was 33.35: t(202.048) = -0.861, p=0.3911.
Table 4-3 Descriptive Statistics of IB Examination Results by Type of IB Students
Group N Mean S.D.
IB Examination Results (2013) Continuum Students 108 32.93 4.35
Non--continuum Students 452 33.35 5.62 N = 560
Using another dataset (N = 547), we further investigated whether there would be differences among three groups: continuum, multi-program, and DP-only students. As presented in Table 4-4 below, on average, DP-only students showed a slightly higher IB examination score (34.17) than continuum (32.93) and multi-program students (32.46). An ANOVA test indicated that there was a significant group difference in IB examination results: F(2,544) = 5.83, p = 0.003. However, the effect size was very low: ω= 0.122.
Table 4-4 Descriptive Statistics of IB Examination Results by Type of IB Students
Group N Mean S.D.
IB Examination Results (2013) Continuum Students 108 32.93 4.35
Multi-program Students 192 32.46 5.50 DP-only Students 247 34.17 5.69
N = 547
We further scrutinized this result by conducting a post-hoc test. We used Hochberg’s GT2 (given that the sample size of each group were quite different) and the Games-Howell procedure (given
1 Note that the Levene’s test of equality of variances was not met (p <.001). Thus, we used t-statistics of when equal variances are not assumed.
2 ω is computed by degree of freedom and F statistics from ANOVA. In general, the interpretation of ω is as follows: 0.1, 0.3, and 0.5 represent small, medium and large effect sizes, respectively (Field, 2005; Hair et al., 1998).

Page | 48
that the population variances are not equal; Levene’s statistics was 5.15, p<0.006). The post-hoc results are reported in Table 4-5. Both Hochberg’s GT2 and Games-Howell approaches consistently indicate that there was a significant difference in IB results between multi-program students and DP-only students. DP-only students outperformed multi-program students in IB examination results. However, there was no significant difference between continuum students and DP-only students. While the group comparison was rigorously done, caution should be exercised in interpreting the results, since neither t test nor ANOVA control for a number of important student and school variables that may influence IB examination scores; this will be addressed in our multilevel analysis later in this chapter.
Table 4-5 Post-hoc Test of IB Examination Results
Post-hoc Tests Reference Group (1) Comparison Groups (2) Mean Difference (1) – (2) S.E. Sig.
Hochberg Continuum Students
Multi-program Students 0.462 0.648 0.855 DP-only Students -1.248 0.621 0.129
Multi-program Students Continuum Students -0.462 0.648 0.855 DP-only Students -1.711* 0.518 0.003
DP-only Students Continuum Students 1.248 0.621 0.129 Multi-program Students 1.711* 0.518 0.003
Games-Howell Continuum Students
Multi-program Students 0.462 0.577 0.702 DP-only Students -1.248 0.553 0.064
Multi-program Students Continuum Students -0.462 0.577 0.702 DP-only Students -1.711* 0.537 0.004
DP-only Students Continuum Students 1.248 0.553 0.064 Multi-program Students 1.711* 0.537 0.004
Note: * indicates a statistically significant difference between the two groups. See p-values in the last column.
Comparing Learner Profile Scores by Students
Additionally, we compared student perceptions of their own capacity on the four attributes of the LP, with students grouped into (1) continuum and (2) non-continuum students. The primary purpose of this comparison was to examine Research Question 1-b specifically (See Chapter 1): “In what ways does student participation in the IB continuum contribute to affective learning outcomes, particularly those aligned to LP attributes?” This comparison included 126 continuum students and 606 of their non-continuum counterparts. The descriptive statistics show that overall both continuum and non-continuum students responded “slightly agree to moderately agree” to the survey questions on their capacity on the four LP attributes; note that the measures were based on a 6-point Likert scale and their average responses to the four LP attributes ranged from 4.41 to 4.88.
In terms of group differences in the LP attributes, non-continuum students appeared to indicate slightly higher scores across the four LP attributes than continuum students. However, the differences were minor. T-tests confirmed that there were no significant group differences in the scores obtained for the knowledgeable, inquirers, and open-minded attributes1. At the same time, 1 Knowledgeable: t(730) = -.921, p = .357. Inquirers: t(730) = -.208, p = .835. Open-minded: t(730) = -1.82, p = .069.

Page | 49
a significant group difference was identified in “caring”. On average, non-continuum students had higher ratings on caring than the DP-only students: t(730) = 2.61, p = 0.009. Further qualitative investigations on this group difference could be relevant.
Table 4-6 Descriptive Statistics of the Learner Profile: Continuum vs. Non-continuum Students LP Attributes Groups N Mean S.D.
Knowledgeable Continuum Students 126 4.82 0.71 Non-continuum Students 606 4.88 0.73
Inquirers Continuum Students 126 4.67 0.77 Non-continuum Students 606 4.69 0.84
Caring Continuum Students 126 4.44 1.07 Non-continuum Students 606 4.71 1.06
Open-minded Continuum Students 126 4.41 0.92 Non-continuum Students 606 4.59 1.02
N = 732
We further investigated whether there would be differences when we categorized students into three groups: continuum, multi-program, and DP-only students. In this group comparison, we could not allocate 16 students into one of the three groups due to the lack of information about their experience of IB programs. Thus, the total sample was slightly reduced: N = 716.
As presented in Table 4-7, on average, DP-only students consistently showed a slightly higher rating across the four LP attributes than both continuum and multi-program students. However, the differences were very minor. ANOVA tests confirmed that there were no significant group differences in the scores on knowledgeable, inquirers, and open-minded attributes1.
At the same time, a significant group difference was identified for the caring attribute. On average, multi-program students showed a higher rating of their own capacity on caring than their counterparts, although the effect size was very low: ω = 0.15: F(2,713) = 5.62, p = 0.004. A follow-up post-hoc test using Hochberg’s GT2 indicated that there was a significant difference between DP-only students and continuum students: mean difference = 0.34, S.E. = 0.11, p = 0.005.2 In sum, the results of the comparison of the three groups were very similar to those of the comparison of the two groups.
1 Knowledgeable: F(2,713) = .88, p = .414. Inquirers: F(2,713) = 2.58, p = .077. Open-minded: t(2,713) = 1.90, p = .151.
2 Apart from the individual ANOVA test for each LP attribute, we also conducted a MANOVA test including the four LP attributes simultaneously, given their correlations with one another. P-values of both Pillai’s Trace and Wilks’ Lambda were .008.

Page | 50
Table 4-7 Descriptive Statistics of the Learner Profile: A Comparison of Three Groups LP Attributes Groups N Mean S.D. Knowledgeable Continuum Students 126 4.82 0.71
Multi-program Students 229 4.84 0.67 DP-only Students 361 4.90 0.76 Total 716 4.87 0.73
Inquirers Continuum Students 126 4.67 0.77 Multi-program Students 229 4.59 0.83 DP-only Students 361 4.75 0.85 Total 716 4.69 0.83
Caring Continuum Students 126 4.44 1.07 Multi-program students 229 4.60 1.05 DP-only Students 361 4.79 1.05 Total 716 4.67 1.06
Open-minded Continuum Students 126 4.41 0.92 Multi-program Students 229 4.54 0.97 DP-only Students 361 4.61 1.06 Total 716 4.56 1.01
4-2 Comparison by the Proportion of Local Students in IB Schools
Comparing Students Learner Profile Scores
As the comparison of the type of IB continuum students turned out to be insignificant for 3 out of the 4 LP attributes, we sought to examine school-level characteristic that may influence Learner Profile attributes1. We thus examined whether the percentage of local students in IB schools influenced the development of LP attributes such as open-minded. This hypothesis was in line with emphasis in the literature that student body composition, particularly diversity of race/ethnicity, affects student learning outcomes (e.g., Antonio, 2003; Harker & Tymms, 2004; Lee & Madyun, 2008; Rumberger & Palardy, 2005).
We combined the pilot survey data and the main student data to increase sample size for a more rigorous comparison. As a result, 424 students from 15 schools were included in the analysis2. We sought to examine whether different patterns of LP outcomes as rated by DP students from different schools varied according to the percentage of local students in the student body.
We established three categories based on the proportion of local students: (1) low-concentration schools with 0% to 33% local students, (2) mid-concentration schools with 34% to 66% local
1 The analysis of this section is not directly linked to the research questions in Chapter 1. This is because the analysis was run to further scrutinize unexpected findings (i.e., linkage between proportion of local students and LP). Despite this, we believe that the analysis is informative because it also touches upon Research Question 4 (see Chapter 1)—i.e., “Do students experience unanticipated outcomes associated with implementing the IB continuum?”
2 Since the percentage of local students was available from only 15 participating schools, students in other schools were excluded from the analysis.

Page | 51
students, and (3) high-concentration schools with 67% to 99% local students 1. Using the descriptive statistics presented in Table 4-8 and Figure 4-2 below, we initially detected possible LP differences between schools with different percentages of local students.
Table 4-8 Two Learner Profile Attributes by Percentage of Local Students
N Minimum Maximum Mean S.D.
Open-minded
Low 268 1.00 6.00 4.68 0.95 Mid 102 1.17 6.00 4.61 0.95 High 54 1.00 6.00 4.17 1.00 Total 424 1.00 6.00 4.60 0.97
Knowledgeable
Low 268 1.00 6.00 4.88 0.75 Mid 102 3.63 6.00 5.03 0.58 High 54 1.50 5.75 4.65 0.84
Total 424 1.00 6.00 4.88 0.73 Note: Low = 6 schools, Mid = 4 schools, High = 5 schools
Figure 4-2 Two Learner Profile Attributes by Percentage of Local Students
Multi-group Latent Mean Analysis
To confirm the group differences statistically, we used multi-group latent mean analysis, a form of structural equation modeling, which is better able to take into account measurement error than MANOVA (Aiken, Stein, & Bentler, 1994; Cole, Maxwell, Arvey, & Salsa, 1993; Hancock, 1997).
Before attempting latent mean analysis, we first tested configural, metric, and scalar invariance across the three categories of local student concentration (Hong, Malik, & Lee, 2003). Effect sizes using Cohen’s d were calculated to compare the learner profiles. Missing data were imputed using full-information maximum likelihood (FIML).
1 The information was obtained from statistics available on school websites, annual reports and directly from the schools.

Page | 52
As mentioned, we investigated two LP attributes, knowledgeable and open-minded, for several reasons. First, the inclusion of all four attributes was not supported by invariance tests. Second, we selected the two LP attributes that represent cognitive and non-cognitive themes, respectively. Third, the meaning of open-minded appears conceptually related to the percentage of local students.
A CFA measurement model (two-factor model) was established with an acceptable fit: CFI = 0.94, TLI = 0.93, RMSEA = 0.08, and X2 = 982.06, df = 76. Configural, metric, scalar, and factor-variance invariance tests were conducted in sequence. Results indicated that the requirements were met for configural and metric invariance, but only partially for scalar invariance by constraining approximately half of the randomly selected intercepts (see Table 4-9). Based on this, we proceeded with factor-variance invariance testing and latent mean analysis.
Table 4-9 Tests for Invariance
d.f. TLI RMSEA CFI
Model 1: Configural Invariance (Baseline) 560.3 228 0.88 0.06 0.90 Model 2: Configural & Metric Invariance 625.7 280 0.90 0.05 0.90
Model 3: Configural, Metric & Partial Scalar Invariance 603.1 264 0.90 0.06 0.90 Note: N = 424 students from 15 schools
As presented in Table 4-10, the latent mean analysis indicates that DP students in schools with low concentrations of local students show stronger scores on knowledgeable than their counterparts in high-concentration schools (−0.24, p = 0.08) at the statistically borderline level, and stronger scores on open-minded than students in high-concentration schools (−0.55, p = 0.00). The effect sizes (Cohen’s d) in Table 4-10 further confirm this substantial difference between low- and high-concentration schools on both knowledgeable (−0.50) and open-minded (−0.53) attributes.
Table 4-10 Latent mean comparison of the Learner Profile: Students in Low-Concentration Schools (Reference Group) vs. Students in High-Concentration Schools
Estimate SE Sig. Effect Size (Cohen’s d)
Knowledgeable −0.24 0.14 0.08 −0.50 Open-minded −0.55 0.17 0.00 −0.53
A similar pattern of significant and substantial differences was identified between mid- and high-concentration schools. The results in Table 4-11 indicate stronger scores for DP students in mid-concentration schools on both knowledgeable (−0.36, p = 0.01) and open-minded (−0.50, p = 0.009) than their counterparts in high-concentration schools. The effect sizes shown in Table 4-11 (Cohen’s d of −0.73 and −0.47, respectively) further reinforce this significant and substantial difference between mid- and high-concentration schools on both attributes.

Page | 53
Table 4-11 Latent Mean Comparison of Learner Profile: Students in Mid-Concentration (Reference Group) vs. High-Concentration Schools
Estimate SE Sig. Effect Size (Cohen’s d)
Knowledgeable −0.36 0.14 0.01 −0.73 Open-minded −0.50 0.19 0.01 −0.47
As seen in Table 4-12, however, there was no significant difference between low- and mid-concentration schools.
Table 4-12 Latent Mean Comparison of Learner Profile: Students in Low-Concentration (Reference Group) vs. Mid-Concentration Schools
Estimate SE Sig. Effect Size (Cohen’s d)
Knowledgeable 0.12 0.08 0.16 0.24 Open-minded −0.05 0.13 0.70 −0.05
Results suggest that the proportion of local students in IB schools is an important characteristic associated with the development of certain attributes of the LP such as knowledgeable and open-minded. The inverse relationship identified between the proportion of local students and students’ scores on open-minded is understandable. If the student body composition is highly homogenous and dominated by one particular student group, such as local students, the students are less likely to have opportunities to examine their personal and cultural values and beliefs through learning how people from other ethnic and cultural backgrounds think and act.
Students in mid-concentration schools rated higher on knowledgeable than their peers in either low- or high-concentration schools, although the comparison between low- and mid-concentration schools was not statistically significant. The results suggest that the proportion of local students has a linear relationship with open-minded and a non-linear relationship with knowledgeable. That is, there could be an optimal proportion of local and non-local students (34% to 66%) to facilitate the knowledgeable attribute, and a student body that is predominantly local or too diverse may not be ideal to develop this attribute. For example, students at schools with predominantly local students may have less chance to “build on others’ ideas to form your own opinion” (Question 7 of knowledgeable) or “apply familiar ideas and concepts in new ways in order to defend your own opinion” (Question 8 of knowledgeable). They may be more likely to accept the ideas of fellow local students uncritically and not necessarily “appreciate the strengths and weaknesses of other peoples’ ideas” (Question 3 of knowledgeable). In such schools the scope for students to explore and get new ideas or information is also more limited. Conversely, a low proportion of local students in IB schools might result in ignoring the local or host society’s resources to tap the knowledgeable attribute and isolating these schools from the local community or macro-societal context, so that students are less able to 1) explore local people’s ideas; and 2) appreciate the strengths and weaknesses of local ideas, which form part of the knowledgeable attribute.
However, the explanations noted above require further investigation through in-depth qualitative studies. At the same time, we acknowledge the limitations of our analysis, as the relationships

Page | 54
identified above are correlations without controlling other variables that may influence the relationships.
4-3 Exploring the Effects of School Characteristics and Learner Profile on IB Examination Scores
To extend and elaborate the previous group comparisons, we further examined student-level and school-level characteristics that may influence the learning outcome of DP students in Southeast Asia. This section provides a series of quantitative analyses of the student and teacher surveys in the main study. We conducted a multilevel analysis focusing on IB DP examination results. In examining student-level and school-level characteristics that may influence the learning outcome of DP students in Southeast Asia, we focused on the following four questions:
1) Do leadership practices impact students’ IB DP examination scores?
2) Does teacher professional community influence students’ DP examination scores?
3) Do student perceptions of the Learner Profile influence DP examination scores?
4) Does student completion of the IB continuum influence DP examination scores?
4-3-1 Data Sources and Measures
Both the main student survey and teacher survey data were used to link 533 students to 25 different schools (those with missing DP examination score data were excluded from the final analysis). The study included two broad categories of independent variables: student-level characteristics and school-level characteristics, and the IB DP examination scores formed the dependent variable.
Student-level characteristics (level-1): Student self-ratings of their capacity on the four attributes of the LP, knowledgeable, inquirers, caring, and open-minded, comprised the independent variables. As reported earlier, all these measures showed content and construct validity and reliability. Composite variables (i.e., means) were used in the analysis. Gender was included as another independent variable. Additionally, we included the variable of student type by the IB continuum students vs. non-continuum students. Our survey did not include conventionally important student-level variables such as socio-economic status (SES); nonetheless, we assume that the majority of students in IB schools in Southeast Asia would have quite homogeneous family SES (i.e., upper middle class families), given that these schools are privately funded (Lee, Hallinger, & Walker, 2012a); thus SES variation among students would be much smaller than in public schools.
School-level characteristics (level-2): There were three reasons for assigning schools as level-2 in this analysis. First, this is consistent with our research questions. Second, due to missing links between teachers and students (i.e., missing information about the connection between student examination scores and specific teachers), schools were the only upper-level unit we could use. Third, given that DP students learn from multiple DP teachers, it was not possible to link one particular teacher directly to his or her students. To address this, alternatively, we considered using cross-classified multilevel analysis, but it was not feasible to incorporate cross-classified

Page | 55
nested structures in the multilevel analysis, given that we did not have exact information about which teachers teach which students. School-level characteristics comprised variables that described both leadership practices and teacher professional community that closely reflect key characteristics of IB schools. Note that our investigation was exploratory. Given that our sample comprised only 25 schools, we took an exploratory approach to identifying the variables that make the greatest contribution to IB examination scores. That is, we tried to maintain a parsimonious model in terms of school-level variables. As such, in the final model we included three leadership practices variables (strategic resourcing, classroom monitoring, and within-program interaction) and one variable of teacher professional community (de-privatized practice). These variables are described on Chapter 3.
4-3-2 Analytical Strategies
Because the dataset incorporated a unit of analysis (students) nested within a larger unit (schools), we employed a two-level hierarchical linear model (Raudenbush & Bryk, 2002). By setting up a random-effects ANOVA model, we identified an intra-class correlation coefficient (ICC) for each dependent variable. We then built models by adding level-1 (student characteristics) and level-2 (school-level characteristics) variables in sequence. Given the order of model building, all level-1 variables (i.e., student-level variables) served as control variables. The final HLM model was constructed using a random-intercept model (Raudenbush & Bryk, 2002). We used this approach for three reasons. First, some level-1 slopes did not vary significantly across the countries. Second, the deviance statistic indicated that allowing these slopes to vary across the countries did not fit the data significantly better than specifying them as fixed. Finally, significant cross-level interaction was not identified. We used robust standard errors for the estimation of fixed effects. We applied restricted maximum likelihood (REML) given the relatively small number of level-2 units (i.e., N = 25).
4-3-3 HLM Results
A random-effects ANOVA model (null model or Model 1 in Table 4-13) showed that the average DP examination score varied significantly across the 25 schools. The associated intra-class correlation coefficient of 0.167 [= 5.09/(5.09+25.38)] means that 16.7% of the variance in the mean examination score of DP students lay between the 25 schools. Based on this dependency, we built explanatory models by adding level-1 (student characteristics, Model 2 in Table 4-13) and level-2 variables (school characteristics, Model 3 in Table 4-13).

Page | 56
Table 4-13 HLM Predicting DP Examination Scoresa Fixed effects Model 1 Model 2 Model 3 Effect (S.E.) Effect (S.E.) Effect (S.E.) For adjusted grand mean 33.24 (0.53)*** 29.45 (1.27)*** 29.39 (1.10)*** TPC: De-privatized practice 1.05 (0.48)** Leadership: Strategic resourcing 1.61 (0.83)† Leadership: Classroom monitoring -0.89 (0.39)* Leadership: Within-program interaction 1.85 (1.05) † Gender 2.30 (0.43)*** 2.27 (0.42)*** Learner Profile: Knowledgeable 0.79 (0.32)* 0.76 (0.31)* Learner Profile: Inquirers 0.70 (0.25)** 0.71 (0.26)** Learner Profile: Caring −0.68 (0.17)*** −0.69 (0.17)*** Learner Profile: Open-minded 0.02 (0.19) 0.02 (0.20) Continuum vs. Non-continuum 0.05 (0.62) 0.04 (0.64) Random effects v.c. df p-value v.c. df p-value v.c. df p-value
Mean 5.09 24 0.00 4.68 24 0.00 2.62 20 0.00 Level-1 effect 25.38 23.70 23.70 Variance between schools explained (%) 8.05 48.5 Variance within schools explained (%) 6.62 6.62 Total variance explained (%) 6.86 13.62 Intra-class correlation coefficient (ICC) 0.167 Notes: 1) 533 students from 25 schools, effect = coefficient; S.E. = robust standard error; †p<.01, *p<.05. **p<.01. ***p<.001, v.c. = variance component, d.f. = degree of freedom, p.v. = p-value. 2) For Model 2, we compared another alternative model, which has the same fixed parts and differs only in the random effects, by using a deviance test. The chi-square statistic value was 11.67, df = 27, p >.500. As such, we adopted the current model in the table.
00γ
20γ
30γ
40γ
01γ
02γ
03γ
04γ
50γ
60γ
10γ
ju0
ijr

Page | 57
Association of the Learner Profile with IB DP Examination Scores
Table 4-13 presents the HLM results from the null model to the final model (a random-intercept model) for the dependent variable of IB examination scores. The association of the Learner Profile with IB examination scores presents a mixed picture: 1) positive associations of knowledgeable and inquirers; 2) a negative association of caring; and 3) no significant association of open-minded.
There are some likely explanations for this mixed result. First, it is understandable that knowledgeable and inquirers attributes are positively associated with IB examination scores, because both have a strong cognitive focus. Second, although the negative association of caring with IB examination scores requires further investigation, a recent IB project conducted in China (Lee et al., forthcoming) offers a likely explanation. The project, which targeted five high-performing IB DP-only schools in China, found that due to the binary pass/fail nature of the assessment criteria, students in the results-oriented culture of these schools (cf. Lee, Hallinger, & Walker, 2012a) often did not prioritize “Creativity, Action, Service” (CAS). In addition, there were challenges in incorporating non-cognitive theme of the Learner Profile such as caring into day-to-day pedagogical practices and curriculum implementation because of a lack of guidance from the IB. Teachers and administrators noted that the Learner Profile consequently took a ‘backseat’ for many IB DP students relative to the assessed parts of the program. Moreover, the implication of this finding needs to be linked to the finding that on average, DP-only students tended to show a higher score of caring than continuum students (see previous sections). Finally, the open-minded attribute may lack any significant relationship with IB examination results because its focus is non-cognitive. However, further investigation is needed.
Association of Student Continuum Status with IB Examination Scores
Consistent with the analyses of t-test and ANOVA in the previous section, there was no association between student types (continuum vs. non-continuum) and IB examination scores. Note that we undertook another separate analysis by using an alternative variable—i.e., cumulated years of IB experience. We did not present the results when we used this continuous variable instead of using the binary variable (continuum vs. non-continuum) because results based on the continuous variable were almost the same as when we used the binary variable. Another reason why we favored the binary variable was that although the continuous variable indicates exact years of IB learning experiences, there were some student cases having more years of IB learning experiences but do not fall within the continuum student category, defined in the previous section. In sum, completion of the continuum was not significantly associated with IB examination scores. A further study is needed to explore this finding.1
1 A likely explanation of this finding can be drawn from a study by Hallinger et al. (2010) on challenges and issues embedded in the MYP–DP transition in IB schools adopting the MYP and the DP concurrently. In this study, both students and teachers expressed concerns about differences or inconsistencies between the MYP and DP in terms of depth (or difficulty) of subject content, assessment style, pedagogical approach, etc. This appeared to hinder first-year DP students from the MYP in adapting to different approaches to teaching and learning. Indeed, Hallinger et al. (2011) found that 28.6% of IB program coordinators from 175 schools worldwide felt the transition either “needed improvement“ or “demonstrated no connection”. This suggests that program transition was a salient issue for these IB schools. Aside from this likely explanation, we admit that the non-continuum group included a significant portion that had also done the MYP. As such, the lack of an association between student types and IB scores still needs a fuller explanation.

Page | 58
Association of Leadership Practices with IB DP Examination Scores
The association of leadership practices variables with IB DP examination scores also presented a mixed picture: 1) both strategic resourcing and within-program interaction were positively associated with IB examination scores; but 2) classroom monitoring was negatively associated with IB examination scores.
First, the positive association of strategic resourcing is understandable and in line with the leadership literature1. For example, teachers in U.S. schools who perceived their principals to be good resource managers were more likely to regard them as instructionally focused and to approach them for instructional advice (Horng & Loeb, 2010). In England, resource allocation by principals was reported to be among the five most influential practices for improving learning outcomes (Sammons et al., 2011). Resource allocation by school principals has also been an important issue in school improvement in Asia. For instance, Kwan and Walker (2008) found that principal development programs over-emphasized academic areas and neglected resource allocation.
Second, the positive association of within-program interaction with IB examination scores is understandable2, given that the construct of within-program interaction is based on measures of school leaders’ support for teachers to 1) share ideas and materials about effective teaching; 2) share what teachers’ learn from workshops or conferences with other teachers; and 3) discuss IB program standards, assessment, and philosophy. The finding also supports the qualitative narratives from our previous IB project (Hallinger, Walker, & Lee, 2010). In this study of five IB schools in Asia, teachers’ interaction within the DP program for sharing ideas on teaching and instruction was facilitated by supportive leadership behaviors. In other words, within-program interaction seems to function as a tool through which instructional leaders exerted their legitimate influence on curriculum and instruction.
Finally, the negative effect of classroom monitoring is consistent with the findings of previous studies in different schooling contexts. For example, Lee and Dimmock (1999) found that when principals in Hong Kong schools focused too strongly on implementing classroom monitoring, this increased the pressure on teachers. Over a decade later, Walker and Ko (2011) also reported that working in a demanding accountability environment had a negative impact on school conditions. Similarly, Lee et al. (2012c) identified a negative link in Hong Kong public schools between a principal’s focus on classroom monitoring and student learning outcomes. Studies in U.S. public schools found that a principal’s emphasis on targets and on data-based decision-making and school development planning had a negative effect on teacher instructions, which in turn negatively influenced student learning outcomes (Lee, Louis, & Anderson, 2012).
1 Note that the p-value of strategic resourcing was 0.067. Although it was significant at the borderline level, we interpret this as significance, given the relatively small sample size of the level-2 unit (N = 25).
2 Note that the p-value of strategic resourcing was 0.091. Although it was significant at the borderline level, again we interpret this as significance, given the relatively small sample size of the level-2 unit (N = 25).

Page | 59
Association of Teacher Professional Community (TPC) with IB DP Examination Scores
Empirical studies have conceptualized that TPC can be partitioned into three conceptually interdependent dimensions: shared responsibility, de-privatized practice and reflective dialogue (Lee, Louis, & Anderson, 2012; Louis, Leithwood, Wahlstrom, & Anderson, 2010). Results from our multi-level analysis indicate that de-privatized practice, one of the TPC components, was positively associated with IB examination scores. One likely explanation about the positive link between teachers’ de-privatized practice (i.e., the open sharing of classroom management, pedagogical approaches and teaching practices through (in)formal invitations of colleague teachers) and IB examination scores is that de-privatized practice contributes to moulding “common understandings and expectations for practice, and promotes coherent practices” within and across the formal structure of school organization (McLaughlin & Talbert, 2006, p. 7). That is, by opening classroom teaching and management to fellow teachers, teachers in IB schools seem to forge common understandings or standards of how to implement the IB programs, which in turn appears to contribute to student learning outcomes.
This finding resonates with the linkage between the aforementioned leadership variables and IB examination scores. As noted above, school leaders’ close and regular observations of classroom teaching (i.e., classroom monitoring) were not positively associated with IB examination scores. However, school leaders’ practices that promote sharing ideas among teachers (i.e., within-program interaction) were positively associated with IB examination results. In a similar vein, teachers’ de-privatized practice to obtain feedback from colleague teachers (not directly from principals) was positively associated with IB examination scores, when we controlled for the other variables. The message here is that teachers’ interactions with colleagues for sharing ideas and seeking feedback work better for student learning outcomes than principals’ direct involvement in teaching and instructions such as regular classroom observation and inspection of student work.
4-3-4 Limitation of the Analysis
The final model explained about 49% of the variance between the schools and about 14% of the variance in DP examination scores. This suggests that some important variables, especially student-level variables, need to be included. Given the limited student-level variables in our dataset, a further study with a more comprehensive analytical model is needed.
4-4 Summary of Findings
• A series of exploratory t-tests showed that continuum and DP-only school status was not significantly associated with leadership practices, organizational conditions and the teacher professional community.
• Another t-test (continuum vs. non-continuum students) and ANOVA (continuum vs. non-continuum students) indicated that there was no significant group difference in IB examination scores when we grouped students by their experience of the IB continuum.
• In a similar vein, there was no significant difference in three Learner Profile attributes (i.e., knowledgeable, inquirers, and open-minded) when we categorized students by their experience of the IB continuum (continuum vs. non-continuum). However, there was a significant difference between continuum students’ and DP-only students’ scores on caring. On average, DP-only students tended to show a higher score than their

Page | 60
counterparts. Multi-group latent mean analysis (LMS) results suggested that the proportion of local students in IB schools was an important school characteristic influencing the development of certain attributes of the Learner Profile, such as knowledgeable and open-minded.
• An inverse relationship between the concentration of local students in a school and student capacity on open-minded was identified. Students in mid-concentration schools showed higher scores on knowledgeable than their peers in either low- or high-concentration schools, although the comparison between low- and mid-concentration schools was not statistically significant. Although we provide likely explanations for these findings, further investigation is required.
• A multilevel analysis of student and school characteristics that may influence the learning outcomes of students in Southeast Asia showed mixed relationships between the selected Learner Profile attributes and IB examination scores: 1) positive associations of knowledgeable and inquirers; 2) negative association of caring; and 3) no significant effect of open-minded. Relationships of leadership practices variables with IB examination results also presented a mixed picture: strategic resourcing and within-program interaction were positively associated with IB examination scores whereas classroom monitoring was negatively associated with IB examination scores. Echoing the association of leadership practices variables with IB examination scores, de-privatized practice, one of the main components of teacher professional community, was positively associated with IB examination scores.

Page | 61
5 Qualitative Study Methodology
In the third phase of our research, two in-depth case studies were conducted with the aim of fulfilling the following purposes:
1. to provide an in-depth picture of normative practice and school cultures that foster effective implementation of the IB continuum across grade levels and programs; and
2. to identify underlying factors that impact on the enactment of the IB Learner Profile attributes that the validation study and teacher surveys identified as significant.
This chapter provides an overview of the case study methods, including the approach taken to qualitative analysis. The next two chapters comprise case reports of the two continuum schools. They provide rich descriptions of the findings from each case. At the end of each case report, the findings are summarized with reference to school, student, and teacher outcomes, which are the foci of the research questions. Finally, Chapter 8 presents a comparative analysis that elucidates the key practices of the continuum schools.
5-1 Methodology
5-1-1 School Selection
Two schools were selected as sites for data collection. Several important criteria were employed. First, consistent with the study’s aim of uncovering the impact on student, teacher, and organizational outcomes of schools’ participation in the IB continuum, both selected schools offer all of the three IB programs (PYP, MYP, and DP). Second, to uncover examples of good practice, we selected schools in which students score well in examination results and which have reputations for excellence. Third, leaders in both schools have expressed their commitment to implementing the IB continuum and dedicate resources accordingly. Fourth, the schools brought diversity to the study in terms of national setting, size, number of years since achieving the IB continuum authorization (one school having received full authorization in 1998 and the another in 2008), and governance (one receiving its mission from a founding agency and the other acting autonomously in that regard). The variation in the IB continuum authorization reflects the different growth patterns of the two schools, with School I gradually adding on programs as the school expanded and School II receiving authorization almost simultaneously for pre-existing school levels. Table 5-1 provides an overview of the two selected schools.

Page | 62
Table 5-1 General Information about the Case Study Schools
School I School II
Year founded 1990s 1980s IB Program Authorization Years PYP: 2000
MYP: 2007 DP: 2008
PYP: 1998 MYP: 1997 DP: 1998
Years of the Continuum Status 5.4 years 15.0 years School Size (by student number) 530 1059
Faculty Size 75 263 Number of Student Nationalities 47 60 Local Student Proportion 54% 16% Average DP Examination Score All students: 23.5
Students participated in LP survey: 26.2 All students: 29.7
Students participated in LP survey: 31.0 Notes: 1) To ensure participating schools remain anonymous, details including location and local student nationality are not presented in the table, and the exact year each school was founded is not provided. 2) The average DP examination scores around the world based on the May 2013 IB Diploma Program examination was 29.8.
5-1-2 Data Collection and Analysis
Primarily, data were collected in the form of interviews with administrators, teachers, and students. These were supplemented by documentary data pertaining to school structure and curriculum. In each school, teachers representing a range of tenure were identified. This permitted data to be collected pertaining to both long-term and recent initiatives from participants, who carry organizational memory, as well as those relatively new to their respective schools.
Individual interviews were conducted with the Heads of School. Principals, vice-principals and program coordinators were interviewed, either individually or as leadership teams responsible for a program. This was determined by their availability as arranged by the school. Staff members at each school were interviewed in two focus groups representing PYP teachers and MYP/DP teachers. The later combination reflected the tendency in the schools for DP teachers to also have MYP teaching assignments. Students were also interviewed in focus groups. Focus group interviews aim to encourage participants to report common experiences and for responses from one participant to stimulate discussion among the others. We aimed to interview the students in two groups: DP students who had participated in the continuum; and DP students who had transferred into the school. This proved unfeasible in the case of School II. However, we were able to distinguish comments from continuum and non-continuum students in the transcription and analysis process. Table 5-2 and Table 5-3 indicate the position of participants, the format, and the duration of each interview.

Page | 63
Table 5-2 Interview Schedule for School I (with number of participants in bracket) Position Format and Duration • Head of School (1) 1 hour individual • Primary and Secondary School Principals (2) • Primary and Secondary School Vice Principals (2) • IB Program Coordinators (3)
1 hour individual/group interview
• DP teachers (4) • MYP teachers (2) • PYP teachers (2)
45 minute group interview
• DP continuum students (8) • DP non-continuum students (7)
30 minute group interview
Note: In this school, the Secondary School Vice Principal also serves as DP coordinator.
Table 5-3 Interview Schedule for School II (with number of participants in bracket) Position Format and Duration • Head of School (1) 1 hour individual • Primary and Secondary School Principals (2) • Primary and Secondary School Vice Principals (2) • Director of Learning (1) • IB Program Coordinators (3)
1 hour individual/group interview
• DP teachers (5) • MYP teachers (2) • PYP teachers (2)
45 minute group interview
• Mixed group of continuum and non-continuum DP students – group 1 (10) • Mixed group of continuum and non-continuum DP students - group 2 (9)
30 minute group interview
The interviews were conducted following a semi-structured format in which a topic guide was employed that highlighted major themes that the researchers intended to explore. However, a degree of flexibility was permitted in practice to explore and probe informant ideas and perspectives. While all topics were covered, the nature of the semi-structured interviews led to varying degrees of data saturation of the topics between the two schools. The interview topic guides were organized around the three major areas of focus: school, teacher, and student outcomes.
School outcome questions explored factors pertaining to school cohesion, shared goals, culture, and leadership. Teacher outcome questions examined opportunities for professional development, collaboration, and curriculum work. Student outcome questions focused on students’ experience of the continuum in relationship to the impact on their learning achievement and their experience of a coherent learning experience. Questions pertaining to all three outcomes were asked of administrative and faculty interviewees. Students were interviewed about organizational impact features (e.g., a shared language) and student learning.
The qualitative study was conducted in three stages. The first stage comprised a re-analysis of previously conducted case studies of continuum schools (this was reported in an interim report provided to IB in May, 2013, also see Lee, Hallinger & Walker, 2012a and 2012b for more information) to explore the themes of the current study. The data included interviews with principals, IB coordinators, and senior teachers. Subsequently, three interviews were conducted with principals of DP-only schools to pilot the interview questions and to explore emerging themes.

Page | 64
The results of these interviews, and the re-analysis of previously conducted case studies, then informed the further development of the interview protocols.
The second stage comprised the main qualitative study, which consisted of in-depth data collection at two schools over two full days. Data analyzed for this report were drawn primarily from the data collected in the second stage. All interviews were recorded, and fully transcribed and entered into NVivo to support the pattern coding of emergent themes.
The third stage involved the data analysis. The data were coded in overarching themes that reflected those identified in the topic guide and from emergent issues. In total, thirteen key themes emerged that were related to the perceived impacts of the continuum on the three main areas of research: school, teacher, and student outcomes. The themes and their descriptions are provided in Table 5-4.
Table 5-4 Key Themes for Qualitative Analysis Themes Definitions
Scho
ols
Culture Participants’ perceptions on shared norms, values, beliefs, and principles that shape interactions.
Organizational Structure Perceptions and comments related to hierarchies of leadership, inclusive of committees and teams.
Language The working vocabulary about teaching, learning, assessment, and curriculum that binds the school together. This connects to values but is built on tangible constructs (e.g. LP) that provide a common terminology.
Leadership Roles Practices and behaviors that leaders use to engage faculty and accomplish goals.
Teac
hers
Professional Learning Community Participants’ activities and perspectives pertaining to formal and informal collegial activities that aim collectively to improve teaching, learning and capacity.
Professional Development Formal training engaged with inside or outside the school that is intended to improve individual and collective capacity.
Shared Goals Shared aims and targets for student learning and teacher capacity. These emerge from or are closely tied to school vision and mission. This theme considers the extent to which teacher “buy-in” has been achieved.
Collaboration Participants working closely together on planning for instruction and assessment. Particular focus on within- and cross-program interactions and collaborations.
Stud
ents
Coherent Learning Experiences Evidences the extent to which the K-12 continuum provides a logical progression of learning experiences for students that is understood by students and teachers.
Fragmented Learning Experiences Indicates challenges to providing a coherent continuum experience for students.
Open-minded Perspectives pertaining to the LP attribute - open-minded. Caring Perspectives pertaining to the LP attribute - caring. Inquirers & Knowledgeable Perspectives pertaining to the LP attributes – inquirers and
knowledgeable. Finally, following the preparation of the case study reports, the qualitative and quantitative data were compared. Tables were created to demonstrate relationships identified across the findings. The comparative analyses were framed as propositions pertaining to IB practices at continuum schools. These are presented in the concluding chapter.

Page | 65
6 SCHOOL I REPORT
This chapter presents the findings of the case study of School I. As noted in Chapter 5, data were collected by 1) interviewing the senior leadership team (SLT); 2) undertaking group interviews with selected PYP and MYP/DP teachers; and 3) holding focus group interviews with selected DP students who had variously experienced one or two IB programs, and those who had experienced the IB continuum. Below we report the results of the case study according to three major areas: school culture and leadership, student learning, and teacher outcomes.
6-1 School Culture and Leadership
6-1-1 Leadership Roles and Structures
Briefly, the formal leadership structure at School I comprises a Head of School, a Primary Principal, a Primary Vice-Principal, a PYP Coordinator, a Secondary Principal, a Secondary Vice-Principal (who is also the DP Coordinator), and a MYP Coordinator. Together, they comprise the school’s Senior Leadership Team (SLT). A key focus of the SLT’s work is policy alignment. In monthly meetings, the SLT considers how shared values can inform policies and procedures; these are then adjusted in consultation with teachers to meet program-specific and student needs. Despite the formal hierarchical structure, leadership distributions appear relatively flat, as principals and coordinators work closely together. However, although program coordinators tend to have responsibility for mentoring in pedagogy, curriculum development, and some in-service professional development (PD), the principals are more closely involved in teacher appraisals.
6-1-2 School Cohesion and Culture
At School I, the researchers noted a deliberate effort on the part of administrators and teachers to use the LP and IB program frameworks to inform the school’s language of learning and teaching, and to guide decision-making. The language of the LP is used frequently in classroom teaching, informs formal and informal discussion among members of the school faculty, and is referenced in hiring practices, teacher appraisals, and student admissions.
As the following quotations illustrate, teachers, administrators, and students reported that the LP provides a shared vocabulary and forms the basis for reflection, dialogue, and action within classrooms and across the school.
We always use the profile words. So I think that will help with the values and all of the ethics of what’s appropriate to do and what’s not because we all have a common language. So, when [students] have that foundation of language to work with, a cluster of ATL [Approaches to Learning] skills, a cluster of profile words, I think that helps them to move along further. (DP Teacher 3)
Some teachers will actually use [the Learner Profile] in the units and in the reflections: “What Learner Profile characteristics do you show in this unit?” … I’m grading some essays… the vocabulary slips in there, like, “I think people should just be more open-minded”. (MYP Coordinator)
Even as teachers, we would say, “Fine, we need to be more open-minded”… I think that it’s just a common language and you can cut to the chase really quickly. (DP Teacher 3)
The goal is finishing the IB, and all these profile words would gradually come up, caring, principled, balanced, all of these would be used to help each other go through it. (DP Student 1)
Page | 66
Although a number of teachers and students explained that in the higher years the LP might be referenced less directly or less frequently, both teachers and students noted that students exhibited and understood LP attributes, even if they were not explicitly discussed.
If they’re not explicitly using those words they say things like, you know, the world might be a better place if they take the different perspectives of different people… and so, these seem to be more inherent characteristics that have just developed over a long time. (MYP Coordinator)
If the teachers say, for example, we have to reflect on ourselves, and I’m a communicator. If you think of it, in the past I was a communicator, I’ve done this, I don’t have to reflect on it because I’m doing it. You don’t even think about it, but you’re doing it. It’s actually happening because of this whole primary years, middle years ... (DP Student 4)
Thus, the operationalization of the LP appears to become a part of the “habitual” or “inherent” behavior of staff and students. As the Head of School remarked,
I think it just sort of becomes ingrained because it becomes part of your vocabulary. (Head of School)
A unique feature of School I is its very deliberate effort to position the school overtly as an “IB school”. To do this, the school has rewritten its mission statement to champion IB values and uses the IB LP as a mechanism to develop the school’s language of learning and teaching.
We revised our mission and we said that the Learner Profile was in there implicitly but what we wanted to do was potentially rework our mission statement so that our Learner Profile was more explicit. (Head of School)
One of the things we looked at is adjusting our actual mission statement to include, if not all of the Learner Profile words, at least acknowledgement of the Learner Profile as part of this school community. That’s how strong it is for us. (Primary School Principal)
Moreover, the LP plays a crucial role in shaping a cohesive school culture through its explicit use in teacher recruitment, student selection, and classroom discourse.
One of the things I do appreciate about this school is that we really do believe in the IB mission and the IB values as people, because those are just people values. So it’s not dogmatic—it’s not catechism. (Secondary School Vice-Principal/DP Coordinator)
The Learner Profile plays quite a big role for us as an IB school, and not just at the student level. We look at it with teachers and parents. (Head of School)
It’s very embedded in what we do: it’s embedded in our hiring policies, it’s embedded in all of our curriculum areas. We use the language in general conversation. So, I think it’s part of who we are now. It’s very much embedded in the school culture. (Primary School Principal)
So I think if it’s a Venn Diagram, it’s [IB and School I philosophy] almost completely matched. (MYP Coordinator)

Page | 67
As an SLT member explained, the close connection between the LP and the school’s mission reflects the school’s planned and steady growth from a PYP to a continuum school.
This school grew up sort of organically from PYP and MYP and so I think that’s another reason that those kinds of Learner Profile and, like, IB values are really strong. (Secondary School Vice-Principal/DP Coordinator)
Teacher Recruitment
Teachers recruited to School I must demonstrate enthusiasm for the approaches to learning espoused by the IB through its mission, frameworks, and the LP. In practical terms, this means that valuing holistic education, instructional strategies such as inquiry-based learning, collaborative learning, co-teaching and problem-solving, and professional practices such as collaborative planning and co-teaching are assigned a greater priority in the recruitment of teachers than having prior experience of teaching in IB schools. This prioritization is echoed in the appraisal processes.
In interviewing for recruitment, we definitely would focus on the Learner Profile in terms of the expectations, appraisal and how it would affect the teachers. I think if somebody was not aligned with the profile, we would probably use the profile to tell them that they weren’t. This is what we’re expecting of the students; this is what we expect of the community too. I think that would be the difference between an inquiry-based model in a non-IB school and one that’s set in an IB school. (Head of School)
We do our recruiting in a way that puts an emphasis on the fact that we’re a community school and puts an emphasis on the fact that we’re an IB school. And we’re looking for certain types of characteristics and values and other things like that. You’re hiring a teacher who you think best represents those values in terms of the Learner Profile…and ideally is also well-prepared to deliver those IB diploma level courses in terms of their subject-area expertise as well as in terms of understanding how to get kids from point A to point B. (Secondary School Principal)
I’ve got to have people who are flexible, who are collaborative, who are willing to negotiate, who are not frightened of being watched, who are not frightened of giving advice, taking advice. You know, that’s what an open classroom is. That again comes down to the profile itself and because of the team-teaching model and the fact that everybody has to be collaborative. I can’t hire a teacher that’s not open-minded, that’s not a risk taker, that’s not caring. They have to be all those things to be able to team teach. (Primary School Principal)
The Head of School and the people that set up this school really embraced the IB mission and then built the school based around it, so they’re looking for people that also embrace that. So I don’t think it’s a coincidence that people like me and people we meet here have those shared values that the IB has. (Secondary School Vice-Principal/DP Coordinator)
Student Selection
The LP also plays a key role in student selection. The school expects prospective students and their parents to understand and support the school’s values. This is accomplished through explicit reference to the LP, which forms the basis of an agreement with families regarding expectations for school practices. If parents do not support the values of the LP, their children are unlikely to be admitted.
If we are having a meeting with parents, if parents are being awkward, we throw out the profile. You say, “You chose our school [based on your agreement with the profile. Therefore], let’s see a

Page | 68
little bit more communication, let’s be a little bit more open-minded.” If I have a prospective parent come in [to the office to apply to the school], who in my view did not show any commitment to the Learner Profile, we probably wouldn’t give the child a place. (Head of School)
Further, the Head of School and the Secondary Principal reported that when students transfer from non-IB schools to complete the DP, only those students viewed as most likely to succeed are admitted. The view is that the selected students are more likely to succeed academically because their strong academic background increases the likelihood that they will successfully adopt the school’s approach to IB/LP-informed instructional practices—thus serving to maintain school cohesion. For this reason, it is possible that non-continuum students at this school may have perspectives that differ from non-continuum students that join other continuum schools.
Community School
A core aspect that brings cohesion to the school is that its constituents perceive it as a community school. Participants defined community as including a sense of family; all of the faculty members, staff, and students know each other, and there is an openness that allows students to approach teachers with personal concerns.
Other schools are really big. So there’s not much personal contact between students and departments; whereas here, it’s more focused. So we get to know everybody: teachers, even the guards. We get to know the guards too. I play soccer with the guards sometimes. (DP Student 11)
Everyone feels like family here ... because it’s a small school, that’s the advantage. [Students] know that they can run to anyone in the school and talk about how they feel. (DP Teacher 1)
You have a very small tight group of community together. Each and every student knows every person in every single grade. And we feel a lot of friendship for each other. And I think that’s one special thing about the school. (DP Student 1)
And the relationships between the students and the teachers are so close that you can go and talk to them. You don’t need to always talk about the course. You could also talk about your personal life. (DP Student 3)
This concept of community is evidently a function of the small school size and the establishment of shared educational values.
We want to be a place that people have an emotional attachment to, an emotional connection to…taking pride in, having a sense of ownership and a strong bond and a sense of connection, having a community of people who believe in the same types of things in terms of the values of the school and the mission statement of the school. (Secondary School Principal)
Further, not only did students report having a strong sense of trust in their teachers, the teachers also articulated that the sense of community was based on a sense of trust and opportunity made possible by the school leadership.
I do think that from the top-down [the school] is very open-minded. And I think that the respect for our judgment is really valuable. (DP Teacher 3)

Page | 69
We don’t really have people telling us what to do. And I think that is a lot. Maybe because we’re a small school, as we’ve grown we’re expected to know our jobs. And [the school leaders] will say, “You know better than me.” (DP Teacher 3)
The school respects the teachers really well. (DP Teacher 2)
This concept of community, predicated on trust, shared vision, and school size, is seen as an important factor in shaping students, according to the school mission.
I think that we build whole students that are whole in all areas—social life, academic life. We give them all the skills they need to be good people. (DP Teacher 4)
With a community-based school, it kind of helps us with being a balanced person. [Laughter.] Learner profile word. (DP Student 4)
The students’ observations that the community values support the achievement of the LP is echoed in data presented later in this chapter.
The notion of being a community school is essential to the operationalization of the school’s values, which the school and its board protect by capping school size at 650 students.
6-2 Student Learning
This section reports the data pertaining to student learning. It considers the areas of achievement related to the LP attributes knowledgeable, inquirers, and open-minded (Please note: the learner profile attribute caring was most frequently discussed with reference to CAS and is analyzed as part of the section on programmatic coherence, below).
Students and staff alike reported that participating in the IB continuum benefited students in terms of mastery of the LP attributes. This belief extended to DP examination success: staff and students thought that participation in the continuum shapes how assessment is understood and implemented. The students and staff at this school exhibited remarkable consistency in affirming this viewpoint, which was also shared by non-continuum students who joined School I only for the DP.
Students who transferred to School I from IGCSE schools generally reported that while they felt they were prepared to face the focused and intensive content taught in the DP, the IGCSE schools had left them somewhat unprepared for aspects of the LP, specifically issues related to knowledge construction, such as methods of inquiry-based learning, problem-solving, and assessment practices. Teachers echoed this perspective, observing that new transfer students initially found it difficult to think independently. These perceptions indicate areas of continuity from PYP and MYP to DP.
Knowledgeable
Although students and teachers articulated the viewpoint that continuum students were more prepared to face the learning and school-based assessment challenges, several students who had

Page | 70
transferred from IGCSE schools felt that the rigorous content expectations of the IGSCE meant they were better equipped to master the content of the DP.
In math class—[we completed the] IGCSE—[the content is] something that we already know. But for the MYP people, it’s something really new. I think it took them a bit more time to get used to DP. (DP Student 11)
I feel like I already know a lot of the Standard Level material, because I did it in IGCSE. In English, for example, I saw a lot of people in my Literature class have trouble with analysis because in the MYP they didn’t really focus on analysis. But in IGCSE, with the two years of really hardcore analysis and really going really deep into the books, when I came into DP Literature, it was easier for me. (DP Student 13)
A teacher related a similar viewpoint.
The IGCSE kids when they come into Science, they come in and like, “wow.” You think they know everything because you ask questions at the beginning of the class and they know them all. (DP Teacher 4)
As the following quotations reveal, continuum students felt that the narrower disciplinary focus of the DP provided them with new challenges, particularly pertaining to a gap in content knowledge between MYP and DP. Moreover, this perspective was shared by their teachers.
When you move up to—move to DP—it’s a totally different level of Chemistry that we need to deal with, like kinetics and it’s all that organic stuff. So when you move up to DP, you have to cram all that stuff into two years. You’re gonna need a little bit of skill and you need a little bit of patience in doing that. (DP Student 6)
Although it [MYP] prepares us well for DP, but still, I feel that there might be a bit of a gap for some specific subjects. As sometimes we’re actually studying a new subject completely and we might not have enough background to understand that specific subject. (DP Student 2)
The longer the time the kids stay in PYP and MYP, you feel like there’s thinking patterns. Automatically the thinking is more liberal, like it’s not limited and they are very used to open-ended tasks. But usually when they go to DP, they get a little bit frustrated very quickly or they need a little bit transition time. (DP Teacher 2)
The kids that we see who are coping in MYP and struggling in DP, you can actually see them getting it towards the end of 12th grade when it’s too late. And I think that’s the problem. You can’t take the DP further back because it’s already advanced. (DP Teacher 3)
On the other hand, continuum students also reported that the broader-based MYP curriculum had helped them to make informed choices about the specific disciplinary focus they wished to pursue in the DP.
[In the MYP] we had to choose between this specific Math course which you do right before you do the extended Math. And so it helped us figure out if we were gonna do well in Higher Level Math or not. So in some situations the way that they structure the years before the DP helped us to choose what we were going to do. (DP Student 5)
The above viewpoint was reinforced by a student who explained that the MYP’s broad visual and performing arts curriculum assisted her in the selection of specific arts subjects for the DP.

Page | 71
You have to take [visual and performing arts] when you’re in Grade 10. So basically, when you move up to the DP course [the experience helps you to] choose between the two. (DP Student 6)
Problem-solving and Inquiry Skills
Although teachers acknowledged the IGCSE students’ strong preparation in terms of content, they nonetheless described how MYP students demonstrated better preparation for the cognitive skills that are required to be successful in DP instruction, and in particular skills related to inquiry modes of learning and teaching.
[The IGSCE students] have the right answers. [But when] you ask them to go out and do this experiment and suddenly the long-term [MYP] kids are out doing stuff and our new kids are like, “Huh? What’s this stuff? How do I use a graduated cylinder?” They can’t critically think and they don’t have the kinetic lab skills that [full-continuum students] have. (DP Teacher 4)
We notice that they want a lot more—they want to know what we want as opposed to whatever they want. So they’re like, “What does the teacher want? What’s the right answer here?” They’re always, like, “How wide does my imagination have to be? Which side do I put the data on?” The lack of limitation is a little bit of a different culture for them to get used to. (DP Teacher 3)
I find that, when we get a lot of new students, those are the three things that we really notice: a lack of critical thinking, the lack of confidence, and just not being aware of what learning skills and strengths would help them succeed. (MYP coordinator)
Interestingly, several DP students who had entered the DP from programs other than the MYP also expressed this view.
What was difficult is that we get confused about which method we should use [in solving problems]. The method that I already know? The new method? Kinda can be confusing. (DP Student 7)
Yeah. We didn’t know how to do it in different ways. So basically, we [now have] multiple ways of looking at a problem and choosing the best. (DP Student 8)
I think we should’ve come [to the school] a couple of years earlier. Cause then we’d be more used to the systems. Like, for example, writing lab reports, we never did that before. (DP Student 8)
We didn’t do any experiments. (DP Student 7)
In contrast, continuum students perceived continuity in terms of MYP learning approaches. Specifically, students reported that PYP and MYP experiences, in terms of balancing the workload, using inquiry-based learning, and having familiarity with the LP, helped to prepare them for the expectations of the DP.
Also from the PYP to the MYP, what we keep learning is our approaches—we kept on getting advice from teachers on time management, organization, what you should prioritize first, and that has really helped me in the DP program. You gotta prioritize first at the beginning. So that’s what the whole process has taught you. (DP Student 4)
When you look at the MYP and DP, the workload is like, at like the same pattern. So when you move to DP, even though the workload is increasing, you somehow adapt a little bit quicker [than non-MYP peers] with the IB profile words and the Areas of Interaction. (DP Student 1)

Page | 72
[The Areas of Interaction] definitely helped us prepare for the DP, rather than, you know, coming in fresh from something else into the DP. Cause we seem to be a little bit more prepared (DP Student 1).
A further advantage in terms of preparation pertained to students’ understanding of assessment practices, in particular their understanding of criterion-referenced assessment and approaches to examination preparation.
They have to get used to the new assessment criteria. It’s a completely different culture that a lot of kids struggle with. “Okay, here’s the assessment rubric, read it before you do the assignment.” That’s all new. They don’t get that there’s no hidden tracks for everything. All they want to do is keep saying, “What do you want me to do?” (DP Teacher 3)
We found that the students who have come from the IGCSE program approached the mock [examinations] entirely different to our students. Quite a high percentage of them, what they did was they went back to old papers and they revised from the old papers assuming that those questions were going to be in the paper because their goal was “We are going to get the best marks.” Whereas we see mocks as don’t revise previous questions because they are not going to come up. The goal there is not to get the best marks for your mock. The goal is to do a set of studies to prepare yourself for the mocks and use that as an assessment of where you are doing appropriate studies and of where you are answering questions appropriately so you know what to adjust for the final exams. IGCSE students didn’t see that at all. Old habits come up. (Head of School)
Students who had participated in the continuum were therefore perceived as having the skills and understanding of instruction and assessment practices that could be brought to bear in the DP. This finding is important, as it suggests that the content expectations “gap” between the MYP and the DP may be counterbalanced somewhat by sound preparation in inquiry skills.
Open-minded
During the case study interviews, we asked participants to share their views about the effect that participation in the continuum had on students’ understanding of other perspectives and viewpoints, with particular reference to cross-cultural understanding. Students and faculty members frequently stated that the continuum has a positive effect on this LP attribute.
It’s a fantastic skill that you get. Like, you know, you can have the principles and it prevents you from plagiarism and stuff. And for the open-minded, it helps you to get along with new people and in new places. Like, for some of us who are moving to the United States, or going to China, or the United Kingdom, we can use those skills that we learn from the MYP to be able to blend into new places. And at the same time, these skills, like we said before, we just don’t say it, we use it. In your mind, you ought to realize you’re using it. It’s always there with you. (DP Student 6)
And it actually shapes us in becoming global citizen and I think that’s the key for today’s world where people are actually, like, learning more globally. And these are words that have actually helped us in becoming better persons--better people for the world. (DP Student 2)
Page | 73
6-2-1 Coherent Learning Experiences
Programmatic Coherence
In the section above, students and teachers expressed their thoughts regarding the perceived coherence and incoherence of the IB programs. Teachers and students felt that the IB continuum provided students with the skills necessary to approach the DP curriculum, but that challenges remained with regard to content preparation in some disciplines. However, some teachers and school leaders noted that the gap is a logical one that reflects learners’ developmental stages. Students and teachers at School I commented on the variations between the PYP, MYP, and DP instructional programs. Although they observed some discontinuities, a frequent assessment was that changes in the structure of the programs served to support students’ different developmental stages and to prepare students to make informed choices when selecting DP subjects.
Basically, for the primary, everything is collaborative. Kids do things together with the unit of inquiry so at the end of their primary they have the exhibition within the whole class. That kind of helps [with] team-building—like a skill or attitude. Content [is covered] a little bit, but it is enquiry-based. Then, for the MYP, it’s kind of go deep into the subject. But on the other hand, you still have some interdisciplinary units that you can link and transfer of knowledge between the classes. And once you move into DP, it is really in-depth but students can still transfer their knowledge as well. So I think it’s kind of for building a team and then kind of getting in-depth into the subject that interested them at the end. I think this is the way that the system works here. (DP Teacher 1)
PYP teachers are turning out great kids for us, for the MYP. They don’t need to have a lot of science knowledge. They just have to have a love of science and a love of inquiry and a little bit of group work. I can take that. And in the MYP context, you let them write like crazy and inquire and allow them a great deal of freedom. Then they can prioritize for themselves and understand how to organize themselves. And then we send them into the DP and it’s like, “Go, go, go! Use what you’ve got.” (DP Teacher 4)
There are obviously differences in pedagogical approach but the fact is that they are each age-appropriate for the different programs. Like, what an 8-year old student is capable of doing vs. what a 13 year old student is capable of doing vs. a 17 year-old. The age appropriateness allows for greater learning to meet the student where they are. I’ve always taken the PYP as being where we teach them to love learning, whereas the MYP is where we teach them how to learn and the DP is when we finally teach them what to learn. That’s when the content becomes important. You’re meeting students at different points in the development process. So I think those things do carry on. The three programs say, “What you do now is different from what you should be doing later.” By building the student up to their best potential, at that point, that’s what carries on. (MYP Teacher 1)
I think it changes for the positive…it [progresses] through the process of trans-disciplinary to inter-disciplinary to disciplinary programs in a way that the kids can keep up with. (Primary School Principal)
I like the break from the MYP and the DP. You’re here but you’re coming from a child becoming an adult. Everybody has to go through it. But there’s no road map to becoming an adult. You have to flounder and figure it out. And if you push the DP into the MYP you’re not giving the kids the chance to work it out themselves. (DP Teacher 4)
The whole program is about inquiry, a scientific process if you like. And the whole thing is about questioning and research and building all of those skills from a really young age and learning to apply it later on. (Primary School Principal)
Whereas the content may not be as rigid or defined in the primary school, the skills that they learn allow them to learn the content or at least, you know, have opinions and be thinkers, as they

Page | 74
move through the school. So, it does all work together really, really well, in my opinion. (Primary School Principal)
Further, students observed that while affective attributes of the LP were discussed more explicitly in the MYP than in the DP, all of these attributes were articulated in the outcomes across programs, although they might be conveyed differently. This is illustrated in the following short exchange among students in a focus group interview.
[The LP is] mostly mentioned during the MYP program. It’s mostly based on, you know, where you’re best in each of the profiles. (DP Student 12)
But I think the Learner Profile converts to CAS, like CAS outcomes. (DP Student 9)
It’s the same concept in CAS. When you do, like, consideration or, like, importance and ethical implication that kind of stuff in MYP, it’ll be like caring or principled, so it’s related but not called the same. (DP Student 9)
Well, if the teachers say, like for example, I have to reflect on myself and I feel like a communicator, and, okay, I feel kind of stupid doing this. [Laughter.] If you think of it in the past, I was a communicator. I’ve done this. I don’t have to reflect on it. Because you’re currently doing it. So you’re—you don’t even think about it when you’re doing it. You have to be open-minded, inquirers. You don’t realize it, but it’s actually happening because of this whole primary years, middle years. (DP Student 4)
Things like CAS [at first] seemed like add-ons, like extras, like, “Oh, I don’t have to do this,” But then you see that it’s really useful,[that] it’s not just an add-on, that it’s really required, that A-level people are missing out on [it]. (DP Student 13)
The student comments above demonstrate that the LP attributes learnt in the PYP and the MYP may be found in the CAS. Perhaps more importantly, they show that implementing the LP becomes somewhat natural and more valued over time. Such engagement with CAS activities appears authentic, in particular, as measured by the extent to which this engagement carries on beyond graduation.
It’s been something that I’ve really enjoyed seeing in terms of keeping in touch with the kids and those were some of our outcomes that I think are most important: that we, that our kids, are active citizens; that when they’re off at university, they’re doing volunteering. (Secondary School Principal)
They’re not necessarily, like, buying into something philosophically… like maybe it’s gonna give them a competitive advantage. When we’ve had kids in the school for a longer period of time, I think that they absorb and they sort of take on some of those values at a higher rate. They start to do things like CAS in a way that’s sort of intrinsically motivated and not so extrinsically motivated. (Secondary School Principal)

Page | 75
Top-Down Curriculum Alignment
Although teachers and students reported that skills learnt in the PYP and the MYP were transferable to the DP and served to prepare them for the challenges of the program, both groups observed a gap between these programs and the DP in terms of content knowledge expectations. This shift, to some extent, drives and changes the focus that teachers explicitly place on the LP.
There’s a lot of pressure on the diploma teachers. They’ve got [Internal Assessments] and these have to be done in a certain way and submitted by a certain date and they’ve got exams and you know those exams are based on a really, really rigorous syllabi. And so I think there is a bit of tension there and you’d probably see. For our school, that at the Diploma level, probably I still think we’re doing a bit better job with the Learner Profile type stuff than the average school but I would say probably we do it best in the primary years and then it’s second-best in the MYP. [But] it’s still there. It’s a part of what we’re doing. (Secondary School Principal)
Even though inquiry is such a fundamental concept of MYP pedagogy, the DP teachers, even though they would be interested in it—don’t see the application as much as they might if they were an MYP teacher. (MYP Coordinator)
The transition of School 1 from offering the PYP-MYP to providing the full IB continuum required a change in pedagogical practices for some teachers taking up DP teaching. For several faculty members, the new teaching assignment was accompanied by perceived constraints on their practice and even a sense of loss.
Our school, as we’ve brought the [Diploma] program on, there’s been a real sense of emotional loss in some of our teachers because I think that, frankly, they feel that the pedagogy that is associated with the MYP is better and that, because of the restrictions and the time constraints of things like that of the diploma program, that it’s more difficult to-to teach in the way that they want to teach. I think that there is still a lot of really good teaching going on and there is really good practice but there definitely is, you know, a sense of a loss of freedom or a sense of a loss of you know, flexibility to a certain extent. (Secondary School Principal)
I guess I hear a lot more feedback from the teachers how they sometimes prefer to be just MYP because they like the creativity with the curriculum. Whereas with the DP, there’s no room to move around the curriculum. (MYP Coordinator)
Teachers and students reported that introducing the DP entailed the need to carefully consider the articulation of the MYP and the DP and to adjust the curriculum to meet the expectations of the DP. In some cases, issues of PYP to MYP alignment were also reported.
Our Math program used to be fully integrated through the trans-disciplinary structure of the PYP and we just were finding that, you know, we couldn’t--we weren’t able to do it as effectively as we thought we needed to and kids were coming up in Grades Six and Seven and there were just more gaps in the Math than we wanted to deal with and so they’ve created standard Math. It’s still Math being delivered through the AOI [Areas of Interaction] but there’s always Standard Math being done. That’s probably less PYP but that’s something that we needed to do for our students and something that we needed to do, you know, for our school. We definitely have those tensions. (Secondary School Principal)
We now have more DP programs here [than previously]. Okay, now we gotta look at Grade Nine and Ten for Science It’s kind of new here. But I’ve noticed there’s discussion now going on about test results. Going back to the content. There’s a little problem there between the three programs. (MYP teacher 2)

Page | 76
There’s tension between what we want the students to be able to do when they come in at Grade Six and the idea of maintaining the integrity of the PYP program.
The idea of using the lower years for the explicit purpose of DP preparation sometimes was problematic. This was because not all students elected to take specific subjects that require certain discipline-specific skills. Moreover, they noted that the content of the DP is intended for older students.
This is not pre-DP. A third of the kids will take Bio, but only a third. And if I give them prep for the DP then I’m just giving a third of the kids good prep for the DP and I’m giving two-thirds of the kids’ stuff about Bio instead of giving them a holistic MYP experience. And every time the science teacher wants to turn it into something DP-like. I mean, only a third of the kids will be taking this class. (DP Teacher 4)
It has to be age-appropriate. Some schools try to pre-teach in Grade Ten for some of the DP courses, but the kids are not ready and you can see the kids are so frustrated and mentally stressed out. They’re like, “Why can’t I do this? I used to be able to do this.” I think they are not ready but the teachers want to give them success in the examination—it’s very examination-driven—they increase the stress in the students. (DP Teacher 1)
6-2-2 Bottom-Up Curriculum Alignment
A plausible explanation for the perception among School I respondents that continuum students may be better prepared in terms of inquiry skills relates to the school’s historical development. The school began as a PYP school that gradually added on the MYP and the DP, as students advanced through the year levels or grades. Correspondingly, some teachers have moved from PYP to MYP and from MYP to DP. The data presented above relating to student preparedness for the DP also provided some evidence that DP teachers (most of whom also teach MYP courses) carry PYP and MYP practices (such as an concentration on inquiry-based teaching and use of LP terminology) along the continuum into the DP. This finding was corroborated by the school’s Secondary Principal.
Most of our teachers are cross-level teachers [i.e., DP and MYP] and I think some of them—some of them are skilled in understanding the benefits of bringing those things in [to DP] and using them as sort of constructivists tools, whether you’re talking about pure education courses or more like pastoral care. (Secondary School Principal)
6-3 Teacher Outcomes
This section reports on the data pertaining to the effects of the continuum on teachers’ practices. The findings indicate that teachers collaborate in the development of policies needed to enact the continuum (along with other facets of learning and teaching) and in rich professional development opportunities.

Page | 77
6-3-1 Collaboration around School Policy
The SLT works with the school staff to develop consistent, school-wide policies, such as language and assessment policies. These are, in turn, operationalized within the primary and secondary schools.
Part of the process entails the development of “essential agreements”1 in which the SLT examines practices in other schools and proposes adaptations. These are then put to the staff for feedback and then formalized as program-appropriate practices.
So that’s what we always do with our policies. Language policy—we’ve reviewed that as a senior leadership team / academic leadership team. We’ll now take it to the staff. They’ll be able to add any bits and pieces or change it and then we’ll say, “Okay, let’s look at how it looks like in our language.” Essentially, what does it look like taking policy to practice? (Primary School Principal)
6-3-2 Collaboration around the Curriculum
The primary school has a legacy of team teaching, in which all of the teachers plan and teach classes with colleagues at the same level. The strategy serves to embed collaboration and mentoring into teaching, and these are reinforced by the expectations set out in the “essential agreements”1.
If you feel like you belong to somewhere and if you feel like you’ve got ownership, then you feel empowered. You feel empowered as teachers. I think one of the real benefits for us still though is also the fact that we are a team-teaching school. And so that collaboration and that mentoring and all those things are just naturally built in there. (Primary School Principal)
In the secondary school, there is more effort made to align required DP discipline-specific skills with the MYP.
In terms of the curriculum, we’re actually now starting to look at the DP and work the curriculum backwards, because some teachers say [that students] don’t have the skills to thrive in DP. So we had a meeting to look to see where we can put more focus on literary analysis, or visual interpretation. And, so bringing in those requirement for the DP and making sure they’re seen in the MYP as well in certain units. (MYP Coordinator)
A new practice is for all of the MYP teachers to get together periodically to make connections across the curriculum through grade-level meetings.
I started having grade-level meetings—it was the first time—we sat down, wrote it and then talked about where we can make some connections. There was some discussion: ‘Oh I see you’re doing this thing here, we can make some connections’. But we don’t have a structure yet. It will happen when we continue to do these grade level meetings next year. (MYP Coordinator)
1 Essential agreements at School I constitute statements that delineate how key practices are to be operationalized in the school’s programs. Staff members who are most directly impacted by essential agreements contribute to their framing and periodic revision.

Page | 78
We’ve started having more department meetings this year, so these had members within the departments doing a lot more communication; so no teachers are in isolation. We try and make a connection where it fits. And sometimes we have teachers that overlap. They are the Math and Science teachers, so they’ll do a unit together. Sometimes, it just depends on the individual teachers involved. Last year, we had really good teachers. There’s three of us that did a unit together: Science, Humanities, Languages and English. And so that just really worked because of the personalities of the three of us and our understanding of the MYP and just our willingness to actually just play around with the curriculum with our other classes. So yeah, the inter-disciplinary nature doesn’t happen as much as it should here in the MYP. But, with the next chapter changes and things connecting through concepts rather than the AOIs, I feel positive that there will be more connections. (MYP Coordinator)
6-3-3 Professional Learning
The school places a high priority on the professional development of its teachers. Opportunities include those provided through the IB; those offered within the school, which reflect participation in the continuum; and those delivered by non-IB providers.
Official IB Opportunities
As the school is well established with a relatively stable teaching staff, IB-provided PD has shifted away from teachers as “learners” in IB workshops to teachers expanding their own leadership skills and their experience with the IB, by engaging with the organization as moderators and examiners. This is viewed as a strategy “that builds the professional development” (DP Teacher 2) of teachers.
In this school, it’s a powerhouse of workshop leaders and moderators. We have people out all the time doing workshops and stuff. (Secondary School Vice-Principal/DP Coordinator)
We’re all workshop leaders, so we all have external opportunities for PD as well. We can go and lead workshops and meet educationalists from other schools. Getting experience in that way. So that’s really beneficial for me. (PYP Teacher 2)
A tension with this model of PD is that the opportunity for rich PD appears to diminish for teachers who have participated in IB programs over the long term. In other words, experienced IB teachers need to seek advanced formal PD beyond that which is offered by the IB.
When you come into an IB school new, you’re on a learning curve, there’s a lot of opportunity. The longer you’ve been here, the less opportunity there is. You end up going to professional development groups and not actually learning, but teaching. Within the IB structure, once you’ve done the training you’re done with the workshop training. Where do we go? (DP Teacher 3)
When you’re a school that’s been operating for 14 years with PYP, you have to make sure that what you’re doing for your staff… Certainly, looking at the regional workshops, they’re geared towards schools that have just been developing PYP. So it’s hard to get that level of PD for staff. We’re doing a lot of internal stuff. But as far as IB-recognized PD, that’s a challenge for schools that have been doing it for a long time. (Primary School Vice Principal)

Page | 79
Conversely, teachers commented that the school and the IB provide a great deal of support and opportunity for new teachers. This places some pressure on the school to identify higher-level PD opportunities.
Five years ago it was brand new for me, the IB program. It immediately clicked with me and, looking at things conceptually…I think it was a really big shift in my thinking; it was something that I immediately connected to. And I think it’s definitely helped me grow. (PYP Teacher 1)
Opportunities within the School
IB continuum participation offers some clear benefits for PD that is offered within the school. Having the full range of programs available permits teaching faculty and staff members to participate in cross-program PD, which supports the development of cross-program understanding. Participants also described how valuable PD opportunities often occur informally as part of the job, for example, through program coordinators working with teachers and peer-to-peer professional development.
You’re in a better position to be able to share when it’s under the same umbrella. So when we’ve had opportunities for people to go do PD in different sections of the school; that definitely has benefits and there’s definitely shared understanding. So this year we changed our professional development framework a little bit. It’s actually whole school. Admin also have professional development day on the same day that we have it. And when we put together what we are doing for PD, it’s possible that some of our finance people can go to PYP workshops if they want to learn more about that. Life-long learning for administrative staff as well. (Head of school)
Program coordinators do a lot of professional development within the program. (DP Teacher 3)
The good thing about this school is that we have the opportunity to be diverse. We’re not so pigeon-holed. There’s a lot more opportunity to change X. For example, [indicated name of teacher] teaches humanities and she just started teaching visual art. That’s the freedom this school allows us to have. (DP Teacher 3)
When I can, I give short professional development mini-workshops about how to do proper concept statements or how to ask a good question. But it’s more facilitating teachers in training each other about strategies that work in an MYP classroom. (MYP Coordinator)
Opportunities outside IB
Finally, the school provides teachers with PD and growth opportunities that go beyond IB programs. This includes freeing teachers up to engage in activities that support other educational organizations and schools and to attend non-IB workshops.
I can go beyond being an IB teacher. I take part in the Ministry of Education to create curriculum. I was one of the visiting team members for accrediting an international school as well. (DP Teacher 1)
We’re looking at sending out key people or new staff to different workshops and then bringing back new life. There’s always something new that’s happening in the workshops, and that’s the ideal for change, whether it is just to make sure that we’re looking at what teachers need, what staff need. (Primary School Vice Principal)

Page | 80
The overall picture is that PD is multifaceted and often integrated in an organic fashion with the professional work of teachers. Participation in the continuum brings benefits when coordinators and teachers can share practice across programs.
6-4 Summary of Findings
This chapter describes the implementation of the continuum at a mid-sized international school by examining interview and focus group data pertaining to the school, student, and teacher outcomes.
School Outcomes
The school is highly committed to the values and pedagogies espoused by the IB through its mission, program frameworks, and the Learner Profile. Indeed, the school leadership and staff view the school as an “IB school”—one in which the IB is the driver of teaching, learning and mission. The school conscientiously works to establish and maintain a culture that values difference and community—factors that seem to influence the implementation of the continuum.
A clear result of the continuum participation is its effect on the language of learning and teaching. The LP provides a core vocabulary that is used and understood by students, teachers, and administrators. It is implemented through various mechanisms including teacher recruitment and appraisal, student selection, discourse among teachers and between teachers and students, and students’ reflections on their learning. This language is used formally and informally within the classroom and across the school. Further, the school’s “community school” culture serves to support key LP attributes, such as open-minded and caring. This is accomplished by maintaining small class sizes and developing strong relationships among staff, teachers, and students—apparent outcomes of the school’s steady but well-planned growth.
Student Outcomes
In interviews, administrators, teachers, and students consistently identified the effects of the continuum on student learning outcomes, especially regarding mastery of content, approaches to learning and assessment, and the affective Learner Profile attributes.
A key challenge for students and faculty members is rationalizing the content and disciplinary skills focus of the DP examination with the more integrative and holistic MYP and PYP programs. The data suggest that there is a narrowing of the curriculum to subject-specific content and skills in the DP. This creates more content “gap” challenges for students moving from the MYP than for IGCSE students, whose intensive disciplinary preparation bridges the DP examination content. However, students and teachers explained that the MYP to DP “gap” is mitigated—at least with reference to coursework and school-based assessment—by the broader range of learning, assessment, and personal organization practices that continuum students have experienced. These include skills around inquiry-based learning, problem-solving, independent thinking, understanding criterion-referenced assessment, and time management. Such skills are core to the LP and are important continuum outcomes, whether or not they are directly examined. Furthermore, teachers and student reported that the broad-based MYP program (e.g., integrated science and arts) provided students with a range of experiences allowing them to make informed choices about DP course

Page | 81
options. With the perceived benefits of the continuum in mind, concern was expressed that an emphasis on treating MYP as a DP-prep program could diminish these aspects. As many participants related, the existing “gaps”, although they affect the taught curriculum, seem appropriate to the students’ developmental stages.
Teacher Outcomes
Participation in the continuum provides the school with unique PD opportunities. In addition to school-initiated PD and normative IB program training, IB continuum status permits faculty and staff members to join in cross-program PD that can be provided on-site or by program coordinators. This serves to broaden the understanding of cross-program connections and instructional methods. A noted challenge related to IB-provided PD is that the opportunity for rich and unique PD experiences appears to diminish over time for teachers who have participated in IB programs for several years, as their familiarity and understanding of IB programs develop.

Page | 82
7 SCHOOL II REPORT
This chapter presents the findings of the School II case study. As with School I, our analysis focused primarily on interview and focus group data obtained from the senior leadership team (SLT), the PYP and the MYP/DP teachers, students who had experienced only the DP, and students who participated in the continuum. We focused our discussions in three major areas: school culture and leadership, student learning, and teacher outcomes.
7-1 School Culture and Leadership
School II provides a study of leaders who engage stakeholders in their efforts to build curriculum coherence, with the aim of developing a well-articulated and aligned Discovery (age 3) to Year 12 (D-12) curriculum. The IB continuum provides the backbone for this alignment. Efforts to achieve this object entail a distribution of curriculum leadership among the Head of School, Director of Learning, Principals, and Program Coordinators. Additionally, school-wide curriculum review teams and a curriculum leadership team have been developed. The new position of Director of Learning and curriculum teams serve to provide cohesive leadership and faculty involvement in the alignment process. This effort and leadership distribution is viewed as necessary, because the curriculum (prior to the introduction of MYP The Next Chapter) has been perceived as lacking the components that the school needs to ensure a coherent curriculum. In this section, we detail measures that the SLT has put into place to address this concern.
7-1-1 Leadership Roles and Structures
Under the initiative of the Head of School, several new leadership positions and structures have been implemented over the past three years. First, the position of “Director of Learning” (DL) has been created. The DL is a “curriculum and professional development coordinator” (Head of School) who has responsibility for guiding the alignment of the curriculum across the school. The DL reports directly to the Head of School and is responsible for guiding curriculum alignment by working directly with the three program coordinators to create a team that focuses on curriculum development. The Head of School’s vision for the team is that it will focus on pedagogy: “What are the outcomes? What are the goals? What do we want to accomplish with kids?” (Head of School). The team works to “interpret the [continuum] for our program and kids” (Head of School).
It is [the Head of School’s] vision that he wants a D-12 school. So I think it’s his vision and the infrastructure of the curriculum teams, the program coordinators’ meetings. There’s probably been a lot of changes since 2010. (Primary School Principal)
Getting the core coordinators more involved we think…makes sense because [the continuum] is a pedagogical framework and helps us interpret it for our program and kids. (Head of School)
Program coordinators serve as intermediaries between the school-wide curriculum team and the leadership teams (principals and vice-principals) of the different school levels who together “decide as a team” about implementation concerns. The program coordinators work “hands-on with the staff, guiding them through the planning process” (Primary School Principal) in a consultative manner.

Page | 83
I’m regularly coming back [to the elementary school] and asking for input. I don’t make decisions for the [elementary] school. (PYP Coordinator)
Additionally, D-12 curriculum review teams have been established. These teams work to examine the vertical alignment of the curriculum through a curriculum review process. As part of this process, program coordinators work with department heads and teachers to consider how the curriculum “makes sense within the [program] framework. For example, how do [the benchmarks] align with the objectives we’re trying to achieve from an MYP perspective?” (MYP Coordinator). School principals work to ensure that the necessary structures are in place to enable “collaborative planning” with the full involvement of D-12 team members. As this is a large school, the Heads of Department in turn play an important role in the leadership structure by working with subject-area teams in the curriculum articulation process.
7-1-2 School Cohesion
Members of the school articulated a variety of perspectives with regard to the effect of a continuum school on school cohesion. Much of the discussion with participants focused on the extent to which being a continuum school serves to develop a common language related to learning and teaching. The interviews revealed a pre-existing disconnection across the three programs. This led the school to attempt to remedy the situation by introducing a cross-program planner. Early design efforts revealed that a common language or vocabulary of learning and teaching needed to be developed before such a tool could be used effectively. Two components to creating this language emerged as crucial; the first concerns adopting the LP across all of the programs and the second drawing on other resources to fill in perceived gaps.
Key school leaders, and several faculty members, articulated the view that the continuum lacked overall coherence; moreover, the LP was seen as insufficient for instilling a common language about learning and teaching. At issue was a perceived lack of connectivity across the three programs, which prompted the school to look beyond the LP to develop inter-program coherence.
We’re very proud of [having all three programs]. And we also take very seriously what we do with our students. In fact there are some good well-researched pedagogical approaches in ways to set up organizations that ... make it more possible to have a continuous program. And, I have to be honest, the IB has been a problem. Because if the programs are developed independently and vocabularies have not matched up well…students learn one sort of vocabulary and then move to another program and they have to learn a whole different one. So, even though the IB has been very clear that PYP and MYP are pedagogical frameworks, they are not curriculums. They are very clear about that; we understand that. Unfortunately, it’s been really difficult for us to have a continuous program. (Head of School)
The Head of School discussed challenges with IB program cohesion including the lack of a common instructional planner and variation across programs in the terminology pertaining to instruction and assessment. To develop cohesion across programs, the SLT initiated the adoption of Harvard University’s Teaching for Understanding (TFU) and Visible Thinking frameworks to provide a more precise lexicon around which learning and teaching discussions could take place.
We have had to come up with our own structures because up until now the programs did not hang together, and so we had to go outside. We have taken on, for example, the Teaching for

Page | 84
Understanding, Harvard Project Zero model—TFU they call it, and we use it as a protocol for curriculum work but also with the common vocabulary. And again our only frustration with the IB is that we couldn’t get a coherent D-12 because each of these programs is developed independently. So we adopted the Teaching for Understanding model for curriculum work and for a lot of our D-12 vocabulary and thinking. (Head of School)
Other staff members commented that the TFU framework supports the development of coherence across the continuum, but they also indicated that the continuum itself provides a common set of instructional values that inform the language, which the TFU framework supports.
The Continuum gives us a common language and the common language is one of the things that help us connect between the different sections of the school. But also not just the common language, but a common way of thinking about education. I’m not saying that everyone’s absolutely on the same page on that. But we are going in a direction. Working with the TFU framework is something that supports that. We’re all moving in the same direction; and the direction is why we actually select certain content for our kids to learn—and what I’m seeing is that they’re becoming critical learners. (MYP Coordinator)
We have been using the TFU language and, you know, we’ve been trying to work towards—in our departments and PYP, and MYP, and DP—understanding each other’s programs, because it’s not natural. You have to work at that. And the Learner Profile is not enough to use as glue. (MYP Teacher 3)
Developing a common language that draws on both the LP and TFU is viewed as a priority by the school, but is also perceived as being a complex undertaking for program coordinators and teachers to operationalize across all programs.
I think that language is an issue, from my point of view. I don’t think we’ve agreed on our language, for a start. Can I say this? [Laughter.] I mean, I think that with TFU, for example, if we’re a TFU school, what does that mean? We haven’t agreed what that means. I think we need to if we are TFU. And if we’re a Visible Thinking school, what does that mean? (PYP Coordinator)
I don’t think there is an embedded common language across this school—I don’t think they’ve been intertwined enough to be embedded. (PYP Teacher 4)
But the link between PYP and the TFU, where we started this conversation, is maybe not clear to all members. Those who’ve done it [TFU professional development] probably get it. (Primary School Principal)
They [TFU and PYP] might have the same philosophy but there are differences. For example, the number of understanding goals you have, things like through-lines, which are from TFU, don’t appear in the PYP. So, these things. You have to ask yourself, which bits of TFU are we taking, and agree on it, in order to be a TFU-PYP-ish school, you know? (PYP Coordinator)
To address such concerns, a new initiative involving curriculum mapping will use the TFU vocabulary to connect similar concepts across the programs. It is anticipated that the development of curriculum maps will allow teachers and leaders to assess the actual cross-program continuity of content and skills.
In our curriculum mapping system, what we have done is we have three layers of it, so in PYP it’s central idea, now in MYP we’ve put in the new terminology, which will soon be approved, which would be the statement of inquiry. And then in DP, we would use the term from TFU, which is the

Page | 85
term our DP teachers are familiar with. So what we’ve done is, we have a unified name, so that we have one name we were using. (Director of Learning)
Additionally, forthcoming changes to the MYP, associated with the introduction of the MYP Next Chapter in 2014, may offer further support in developing a coherent language around learning and teaching.
And ultimately, the new MYP planner is going quite a lot into that direction anyhow. Very much TFU. Plus, the conceptual piece that is in PYP of looking at related concepts. So with that, it’s actually very easy to make that happen across MYP and DP and it again gives us more common language in the planning. (Director of Learning)
7-1-3 School Culture
Aligning School Values
The SLT regards School II as “more than an IB school” and promotes it as a Discovery (age 3) through Year 12 (D-12) school supported by the IB continuum. This aim requires the development of explicit programmatic coherence across all levels, based on the school’s values. Although IB values and the LP have a place in the development and implementation of the school’s curriculum, the mission and values articulated by its governing body are the primary driver; the continuum supports this mission through an overarching pedagogical framework that serves as a touchstone for the school’s values with regard to learning and teaching.
We like having these programs [i.e., the continuum] because to me it does set the pedagogical tone. It’s good to build and hire people and say that this is the framework we’ve adopted; you can’t come in and do it your own way. We like the model as a pedagogical framework; there’s a lot of good things about it. We do like having a common planner, and thinking about inquiry. But, it’s just not enough. It’s back to the old thing of we’re not an IB school, we are school that is taking on pedagogical approaches of this program that we like, but we are more than an IB school. (Head of School)
Participants in the study reported that the continuum and the school mission help the school to develop coherence by using these as “filters” to guide decision-making about curriculum and hiring decisions. In this way, the school has worked to instill its values across the continuum.
Although teachers and leaders work conscientiously to implement the three IB programs, the continuum itself and the values espoused in the LP are not necessarily viewed as the prime drivers of programmatic coherence, nor as being sufficient to drive programmatic coherence. Accordingly, the school has recently engaged its stakeholders in a process of explicitly identifying and defining the school’s values and cross-referencing these with the LP, TFU, and governing body principles.
So in one aspect we use the Learner Profile, which would be something that we would look at and say, “Across all three programs, this is one piece that the IB gives us that connects the programs.” But to be honest, for our teachers, I don’t think that gives them enough meat to say, “Well okay I understand now how this makes me as a Math teacher in a higher level diploma class connected to a grade three teacher.” Sure, to be honest, for us the IB Learner Profile is so much a part of our mission and our vision and our beliefs and values. I mean we just had a task force that was creating the beliefs and values [statements] of the school through a whole series of case studies and focus groups. And then we cross-referenced them with the IB Learner Profile. We cross-

Page | 86
referenced with some of the values behind the Teaching for Understanding framework, which is one of the other pieces that we used to support that common language across the school. We also filtered it through the [governing body] principles. And, to be honest, each of those pieces supports one another. So the IB Learner Profile is one piece that we always uses as a filter, but each of these filters is so strongly embedded in our beliefs, our missions, and our vision, that none of them stands on their own, and we don’t need any single one of them to say this is who we are. (Director of Learning)
What’s interesting at the moment is there’s a board committee looking at the values and the beliefs of the school because we have the mission, we have the vision, we have the tagline, but we’ve never explicitly articulated our values so all this year we’ve been spending time gathering data from teachers and kids and parents and alumni and board members: “What do you think the values are?” Once we had that data we aligned that with the Learner Profile and looked at what we are as an IB school. So we’ve done that. We’ve got all the data about the values and we’ve aligned it with the [governing body’s] mission and principles. We’ve aligned it with the Learner Profile and now we’re aligning it with the TFU, visible thinking, just to make sure that, whatever we come up with, our values actually knit everything together. And so we’re marrying it at the foundation level. (Primary School Vice Principal 2)
This structure demonstrates how, as a continuum school, the LP has become one component of a school-wide decision-making filter that has been used to examine curriculum options in light of the school’s values.
You want [teachers] to be committed to their division of the school. And we’re thinking about what’s the best for the middle school or high school students and learning in the middle school or high school. But as a three programs D-12 school, it also has to make sense from that filter. So, we have been having this discussion about adding additional courses in the middle school or high school. And we had to bring it to this meeting, this leadership for learning team that we have every Thursday morning. And I said, “Look, these are the filters that it has to go through: What’s our philosophy? Why are we doing this? How does this fit with what we have said we want for our students from our beliefs, our values, our mission, our vision, Learner Profile, our IB frameworks?” (Director of Learning)
Implicit LP Alignment
To determine the effect of the LP on the school’s planning, we asked participants whether or not the LP explicitly drives school-wide planning, and how the school’s aims for students would differ if the school did not offer the IB continuum. The following responses suggest that in addition to explicit reference to the LP in the alignment of the school’s values, attributes of the LP are seen as being embodied informally in teacher and student behaviors and in the implementation of the curriculum.
If you go through our strategic management plan, all of the objectives, it’s the Learner Profile if you want to call it that—we don’t. But, if you wanted to, if you look at Goal 1, it’s all about the students developing academic, personal, emotional, aesthetic [abilities]—all these kind of the holistic attributes. Goal 2 is all about recognizing their responsibilities to others, their responsibilities to themselves. So it’s all embedded there. Everything we do, is actually in support of the IB Learner Profile, it’s not a separate piece. And so I don’t think necessarily, for good or for bad, that our teachers see it as this explicit other thing that we have. (Director of Learning)
It’s not always as extrovertly seen everywhere as it should be. But intrinsically you could always see the Learner Profile in action and you could always claim that from a pragmatic point of view.

Page | 87
Truthfully, we could put it a little more upfront, to make it the driver and not just the accomplishment. (DP Teacher 7)
All our Grade Eleven students are going to go through training on leadership, so that they can then run some of our service programs. Okay, have we once used one of the words in the Learner Profile? No. But when you look at the leadership training that they’re gonna have, they’re…being independent, being responsible, being caring, being communicators, risk taking. (Director of Learning)
Some faculty members contend that although the LP and the continuum serve as a construct to help the school achieve its goals for students, the school’s intended outcomes for students could potentially be similar even if it were not a continuum school.
It doesn’t really matter, because the Learner Profile are the things you just want people to be. The [governing body’s] principles are things you want people to be. So I don’t see them as different. They may use different words but the theme, the ethos, is the same. (Secondary School Principal)
I don’t think the school’s mission statement was written with the IB in mind. It’s meant to just serve the kids; we are interested in the kids. So, if we changed our programs then, I imagine, we need not change a lot of our mission statement. (DP Teacher 7)
I don’t know if it would be very different if we didn’t have MYP, PYP, and DP. We would still teach them open-mindedness, because it’s very much in our school’s mission statement. (DP Teacher 9)
7-2 Student Learning
7-2-1 Knowledgeable and Inquirers: The LP and the Narrowing of the Curriculum
As reported above, the school has engaged in a project to develop a coherent language of learning built around the LP and TFU. Students reported that the LP was important in the DP, predominately in formal activities such as the granting of awards near the end of the school year. However, teachers and students shared the view that as they progressed through the continuum, the use of the LP for discussing their learning became less overt. Reasons for this include a perception that elements of the profile become less crucial to success in DP courses, which focus on areas in the cognitive domain that support academic preparation.
It’s present in the classrooms and the teachers use the adjectives every now and again, but not as intentionally as they use them lower down. (MYP Coordinator)
The Learner Profile is pretty alive and well in the MYP, varying from teachers, their level of experience, and how long they have been here. I think the Learner Profile takes some very serious blows to the head once you get to the IB diploma. If you are a risk taker, it doesn’t matter when you write the exam. (DP Coordinator)
It depends on the teacher. But actually after we enter DP, even though we have the Learner Profile, we didn’t use it. (DP Student 15)
It’s more emphasized in MYP. I feel that in IB it’s, “Get as a high score as you can.” It’s not really becoming a worldly person and stuff; it’s just about passing. (DP Student 10)
In PYP and MYP it’s more involved in discussion and talking about world issues. And the problem about DP is that it is more academic. (DP Student 15)

Page | 88
You do what’s on the syllabus and you don’t want to do anything else because you already have so much in the syllabus. (DP Student 10)
In the DP, it’s really crammed for time. There’s more emphasis on the academics and teachers are kinda just trying to get through teaching you things rather than trying to be a risk-taker or trying to be principled. But I feel like in the younger years they emphasize that more because they don’t really emphasize what you learn but more on how you behave. (DP Student 10)
I think, especially in elementary and maybe the younger grades, it’s helpful to know about [the Learner Profile]. It’s helpful to be raised knowing about it and trying to embody the profile. (DP Student 13)
The DP Coordinator and DP teachers also highlighted that particular challenges come with applying the LP in DP classrooms, including the DP’s focus on discipline-specific skills and knowledge, and a lack of explicit guidance from the IB on transitioning between the MYP and the DP.
But I’m trying to get at the basic sets of diploma skills as a practical matter for the teacher in the room. You have to have a little bit of sympathy for the teacher because their [the IBO’s] guidance for the two programs’ [articulation] is limited. (DP Coordinator)
However, faculty at School II nonetheless felt that the focus on inquiry within all of the IB programs provided continuity to the curriculum.
The transition is definitely made a lot easier by the commonality in the way we use inquiry-based teaching and learning. That is definitely a good thing for the transition from PYP to MYP, and sometimes, MYP to DP. I think the difficulty comes in when—because of the way different people teach, or because of the way the different school levels structure their curriculum—they might have more emphasis in some areas than others. We might have those units they emphasize a lot more in Ninth and Tenth Grade with a view of not having much emphasis on them in Eleven and Twelve. (DP Teacher 7)
In contrast, participants expressed their concern that students who joined the school near the end of the MYP might not have sufficient experience in the approaches to learning that are valued by the school.
We try not to do lip service; we try [to develop the LP attributes] well. Then you look up and go, “Well teacher turn over,” then you look at kid turn over. So all those skills in sixth and seventh grade may not actually apply to half of your ninth grade population because there’ve come in new in ninth and tenth grade. (DP Coordinator)
The fact that [non-continuum DP students] in most cases have not experienced the type of thinking that we expect, they’re often just, okay, right answer, wrong answer and that’s it. So their process of schooling has socialized them in such a different way. Depending on where they’re coming from, again, that will vary again. If you get someone out of a Korean state school, it’ll be quite a different picture than someone who comes out of a school that’s just done another international type of curriculum. But even kids who come out of an IGCSE school, they think differently from the kids we’re working with here and it’s really challenging for them. (MYP Coordinator 2)

Page | 89
7-2-2 Open-minded
To study the LP attribute open-minded students and teachers were asked how participation in the continuum contributes to developing appreciation of other cultures. For both constituent groups, socio-cultural open-mindedness was viewed as a value inherent in the school, as a result of both the governing body’s articulated mission and values, and of the international culture of the school. Learning and teaching in an intercultural environment was perceived as requiring respect for other cultures.
I think it’s not specifically an IB thing. I think it’s more of an international thing because you have to learn to accept other people’s cultures and because there’s a large chance that you won’t find people that are from the same place you are. So if you want to have friends, you need to be accepting and you need to be able to be open-minded. (DP Student 22)
I have gained more knowledge about the world around me. The school focuses more on the academics, but it kind of gives you another perspective. (DP Student 16)
We all include multi-cultural literature all the way through our syllabus. In Grade Six, we do it anyway; it’s the spirit of the place. (DP Teacher 5)
However, it was also noted that a greater emphasis on open-minded throughout the continuum would be particularly important to support student awareness in contexts that are less multicultural.
The continuum makes it easier to teach to a student body that is not international. I think that those are the reasons that make it manageable for the schools that are in North America and Australia, where you don’t have such an international student body. For us, it’s easy because they’re right there, in front of us. But it must be more difficult to teach international-mindedness in Nebraska. (DP Teacher 6)
7-2-3 Coherent Learning Experience
A key challenge expressed by teachers and students was the changing approaches to learning and teaching as the students progressed through the continuum. Some teachers expressed a preference for the MYP’s interdisciplinary and skills-based approach to learning and teaching, but argued that it was not appropriate for the more discipline-specific focus of the DP. A concerted effort is made at School II to develop strategies to align aspects of the continuum that are perceived to be incoherent. This involves identifying content and skills and the year levels at which they should be introduced and taught, and determining where in the secondary curriculum teachers should explicitly begin to prepare students for the rigors of the DP program. At the same time, some comments offered by teachers show that the continuum applies the IB philosophy to learning and teaching, and this contributes to a coherent student learning experience.
By having a full-continuum, it gives us greater commitment to IB philosophy and teaching international mindedness. We’ve looked at the fundamentals of the MYP and holistic learning and communication and international-mindedness. That [emphasis] could easily go away if we took on IGCSEs, wouldn’t it? (DP Teacher 6)

Page | 90
Perspectives on Programmatic Coherence
A key strategy used by MYP-DP teachers to develop programmatic coherence was anticipating the skill sets and assessment strategies needed in the DP and gradually introducing them in the later years of the MYP. By design, the MYP spans the middle school (years 6–8) and high school (years 9–12) programs. Consequently, DP teachers also teach MYP students in years 9–10. Under this system, the process of alignment has developed somewhat organically, as teachers work to anticipate the transition to the DP. For some classes, the final year of the MYP focuses more concretely on DP preparation.
If you got kids that go through a whole school, if you got that focus on building up their experiences, building up their exploring: What does it feel like to be in that situation? How would you react? What are the differences? As they get up to a more skill base level that they’re talking about in MYP, the background that they’ve had in being inquirers in those situations is supported through the Learner Profile. (Director of Learning)
The teachers in Seven and Eight try to run a pretty true MYP program with the MYP ideals of inquiry, discovery, and all of those big ideas. As it get up to Nine and Ten, we still assess with the MYP criteria, the Learner Profile is still present. There is still an effort to be MYP. But at the same time you’ve got a teacher that is a Math teacher going, “All right, I need to be MYP. The basic set of skills needed for Math standard level and Math higher level are here. So I’ve got to find the way to blend the requirements of being MYP with the rigor that is required of the DP.” (DP Coordinator)
You know, for me, I teach from Grade Eight to Twelve, so I see the students’ progress. When they are at lower level, I tend to focus on MYP. But once they move to the end of Grade Nine, I start to wonder about the DP. By Grade Ten, I start to conduct assessments that are more DP—just to get them prepared. (DP Teacher 8)
A lot of people who are teaching MYP are the same people teaching in the DP. So when we’re teaching these kids in Grade Nine and Ten, we’re actually looking forward to having them in the DP, so we plan towards that. (DP Teacher 7)
Influence of Assessment Practices
Both teachers and students reported that as students progressed through the continuum there was a narrowing of the curriculum to the cognitive, academic-oriented LP attributes. This was ascribed to the influence of DP assessment practices that concentrate on the knowledgeable attribute. Teachers pointed out the DP’s intensive focus on content.
In MYP, we find that about 80% of their grade is based on something else other than their knowledge or their understanding. And then they get into DP and it’s flipped. Now 80% is actually their knowledge and understanding. I wish there was a little bit more harmony between the two. (DP Teacher 7)
So the assessment in MYP is, you know, it’s about conceptual understanding. But then they go to DP, where really they just need to know what they need to know. (Director of Learning)
I feel that for the MYP level I emphasize the LP a lot. Maybe it’s also the nature of assessment in MYP. But in DP you assess on content. (DP Teacher 8)
When you do assessment, it caters more to the Learner Profile in MYP than in the DP, ‘cause there’s so much content. (DP Teacher 9)

Page | 91
Students shared similar perspectives about the effect of assessment on the narrowing of the curriculum with reference to the LP.
The mark scheme definitely limits you from answering other perspectives, and other branches of knowledge. It’s having double standards in some sense. That definitely limits students in becoming better inquirers. (DP Student 20)
[In DP Music] they do three hours of musical theory, theoretical music exams. I think that’s totally different from what I’ve learned from MYP. I did a lot of performance-based education when it comes to music. I think that [the DP is] rather too different from what MYP teaches. (DP Student 20)
However, the continuum appeared to better prepare continuum students for assessment practices pertaining to mastering criterion-referenced assessment. This finding was shown in the DP-only students’ responses to questions about what they found most challenging upon entering the DP.
Getting used to what the IB wanted, like the criteria and what was needed to be written and how it needed to be written to get the marks for it, that was kind of [difficult]. (DP Student 22)
This whole idea of criterions, and mark schemes was just “Boom.” And to me it was rather new. And now I’m finally just getting used to it. (DP Student 23)
But I found, when writing in English, it was the same [as my previous school], because it’s pretty much the same criteria. But for Math and Science, it was like completely different. (DP Student 24)
Time Management, Community Service, and CAS Alignment
As noted elsewhere, a key factor for student success in the DP is the alignment of elements of the DP with those in the MYP. For most students, the expectations of the MYP (including community service and personal project expectations) helped to prepare them for the intensive expectations of the DP, in particular the ability to prioritize and manage their time. With reference to time management, students reported that the MYP was helpful.
When I first came here [near the end of the MYP], I was so stressed ‘cause suddenly it’s just like, “Wow, there’s so much to do apart from academics!” That’s how MYP helped me, in some sense, to get a glimpse of the stress that you’ll get in DP. (DP Student 20) Yeah, I think so because we need to be organized to know what to review and what to work towards and set our goals. So if we’re not organized, we cannot work towards the goals and exams and stuff, probably. (DP Student 14)
I think MYP is the same as the DP in terms of preparing for stress. (DP Student 20)
Participants also reported that the personal project and community service activities that were part of the MYP helped to prepare them for the extended essay and CAS portfolio.
The MYP requires you to do the personal project and community service, which is similar to the extended essay and CAS portfolio that DP requires you to do. So, I guess in that sense [full-continuum] students are more prepared than other students. (DP Student 20)
In the MYP we have the community service program. And we’re encouraged to do after-school activities in these service programs, and in DP we have to do it. So, I think it’s really good. (DP Student 14)

Page | 92
They do a lot of project work and group work; the methodology is very similar to PYP. And project work, and creativity work, and all these kinds of things go on in PYP; and children standing up, talking about what they’re doing and this kind of confidence that comes through all the work, and so this all then goes up. I think there’s a lot of similarity. (DP Teacher 5)
7-3 Teacher Outcomes
7-3-1 Collaboration
Teachers and principals reported an ethos of collaboration in the school that is supported through formal structures and the opportunity for professional development. In line with these efforts, the school has recently implemented three key practices.
1. Working across the school to set the agenda for D-12 meetings.
In order to get staff meeting planned for the next year, we have to meet as a D-12 with everyone having their input. (Primary School Vice Principal)
2. The establishment of D-12 curriculum review teams.
…that have representation across all three programs. (Director of Learning)
3. The creation of cross-school peer-coaching groups that allow teachers to observe and provide feedback for learning and teaching in other levels of the school.
The school’s been trying to push peer coaching. So with the teachers, if they’re looking at differentiation, that is the cross-school cohort and the professional learning cohort, whatever you call them. And so those people might organize to go into each other’s classrooms cross-school. So that’s something that the school has been trying to encourage so that people don’t just stay within their schools. (Primary School Vice Principal)
7-3-2 Curriculum Development Work
Developing Standards and Benchmarks
A key area of staff collaboration has been the in-progress development of a curriculum based on standards and benchmarks. The establishment of such a framework is intended to provide a basis for monitoring curriculum implementation and also to facilitate the D-12 articulation of the LP in every subject area.
What does the third grade risk taker look like? What should we be shooting for in terms of eight-year outcomes for knowledge? So we’re going to set a benchmark curriculum, because we have to. That’s our responsibility. (Head of School)
The process involves selecting, in each subject area, high-quality standards and benchmarks that have been developed in other school systems (e.g., “The science people ended up choosing the very latest Australian Standards of Science” [Head of School]), adapting the standards to fit the school context, (“because the Australian doesn’t quite fit us 100%” [Head of School]), and aligning them with the LP and IB program frameworks (“thinking of the IB, keeping them in mind” [Head of School]).

Page | 93
The groups are composed so that there is sufficient representation of each program because one of the tasks is to look at the extent to which the standards and the benchmarks they are choosing to adopt actually work within the conceptual frameworks of PYP and MYP and to evaluate to what extent they then support learning. This is another big question—how do they actually fit into DP? (MYP Coordinator)
Administrators and faculty members reported that the work of the D-12 teams has led to rich conversations about the curriculum.
Immediately people have pretty in-depth conversations about curriculum and standards and benchmarks. It’s a work in progress but it’s definitely moving in that direction with a very strong D-12. (Primary School Principal)
Interviewees also described how these conversations had produced at least three major outcomes.
1. Fostering discussions about backward planning (i.e., planning with DP outcomes in mind) that cultivate an awareness of the entire continuum.
We actually planned backwards. This is the skill set that we need in the DP. How best we can teach that throughout MYP? And now we’ve looked at the scope and sequence. So, in Grade Six, we’re gonna do this; Seven and Eight, this is what they need. So you build up the skills. In Grade Six, we do it on a lower level, obviously, than we would be expecting in Grade Ten. But in Grade Ten they should be quite nearly on the DP level. So when they get into the DP, they are able to have these skills. (DP Teacher 14)
We sat down with the other humanities teachers in the elementary school and said, “What are we teaching? What do we expect?” (DP Teacher 14)
In just the three years I’ve been here, there’s a lot more progression going from one [program] to another because there’s a lot more discussion. (Primary School Vice Principal)
2. Aligning the top-down requirements of the DP with the distinctive elements of the PYP and the MYP.
We’ll [PYP faculty members] say you need to teach the kids from where they are at. From the upper school, of course they’ll say no, we need to teach them from where they need to go. So there is that dilemma. That’s why we have the curriculum teams looking at the standards and benchmarks, which I think will help with that. (Primary School Vice Principal)
If you look at the continuum aspect of the IB, what we’re working on now is to strengthen that aspect. The DP is not necessarily just a content-based syllabus for all the subjects. The DP is a highly conceptual program but it provides content whereas the MYP provides you the conceptual framework. It’s your responsibility as a school to make sense of that by filling it with appropriate content in your context. For us, that exercise of working through the curriculum review is part of that making sense process. (MYP Coordinator)
3. Providing opportunities for staff to engage in rich professional development.
I think it does open things up for them to be creative, to be designers. (Head of School)
Looking forward, the school has begun to put into place a curriculum mapping system that will engage teachers in recording and analyzing the continuum. The curriculum mapping system is

Page | 94
intended to support the documentation of the implemented curriculum and curriculum decision-making.
So I have been spending time looking at how this curriculum mapping system can really document and map all the things we say we are doing: from a disciplinary level, from an approaches to learning level, from a Learner Profile level. How can all those pieces be in this system? How can this system be meaningful and useful to the teachers, so that it’s not onerous, so that it’s not something that they just check on the box and they never look at it again? And so that, if we had teachers that want to make adaptations and changes to curriculum, it is done through one central system and is done through a process. (Director of Learning)
7-3-3 Professional Learning
The school sets aside substantial resources to support the professional development of faculty members. This includes support for members to attend workshops and conferences and to bring consultants into the school.
A key advantage of the continuum is that it permits teachers and program coordinators to engage in cross-program training. This facilitates the development of in-depth knowledge about the continuum.
I’ve been invited to go to MYP training next year by the MYP Coordinator. So to learn about each other’s program is great. And once you know, then you can start preparing—you can have those conversations with your own teachers. That didn’t happen in my last school. (PYP Coordinator)
The school works to ensure that PD is provided to support the development of the school’s language of learning and instruction. In particular, administrators have received training in Leading for Understanding (the leadership modules of TFU) and all staff have received support to complete TFU through the Harvard School of Education.
We’ve all had PD in making thinking visible and many of us have had PD either directly or informally. Because I’ve done it, I’ve passed it on to other people—so we’ve all got fantastic understanding. (PYP Coordinator)
Further, the school provides opportunities for teachers to explore areas of personal interest. This includes the provision of PD funding and the allocation of time in the teaching schedule for teachers to explore areas of development related to learning and teaching.
The school makes time to support teachers in developing their areas of instructional development There’s more time now on Wednesday. So you can concentrate on what you want to concentrate on. For example, you’re interested in blogging for students– you can dedicate that time to it. (DP Teacher 14)

Page | 95
7-4 Summary of Findings
This chapter has reported administrator, teacher, and student experiences and perspectives on the implementation of the continuum at a large international school. Below, we summarize the major findings.
School Outcomes
A key finding in the School II case study is that the development of a language of learning and teaching serves as the “glue” that binds all three programs together; it informs a common understanding of pedagogy, instruction, assessment, and curriculum. Leaders and teachers shared a perception that the three IB programs had discontinuities strong enough that the school needed to look elsewhere to develop coherence. The school has been working to address this concern by adopting Harvard University’s Teaching for Understanding (TFU) and Visible Thinking frameworks to provide a more precise lexicon. TFU, together with the Learner Profile and the school’s commitment to the continuum, inform its developing language. Some staff members observed that MYP The Next Chapter should support further coherence building across the programs.
A second school outcome is the effect of the continuum on school culture, as articulated in its values and mission. For School II, a general consensus emerged that the continuum, as expressed in the LP attributes, aligns with the values of the governing body, whose mission is the primary driver. The continuum serves the purpose of meeting the school mission rather than determining the mission. The continuum provides an overarching pedagogical framework and a key filter, in combination with the mission, delineated values, and TFU; decisions about curriculum and instruction are examined through these lenses. Thus, at School II, the continuum works in tandem with and in response to other values and initiatives determined by the school.
Student Outcomes
The study examined the effect of the continuum on student cognitive and affective domain outcomes. A key finding was that teachers and students alike perceived that the progression from the MYP to the DP led to a narrowing of the taught curriculum to the knowledgeable and inquirers attributes. As students completed their last two years of the MYP, teachers began to prepare students for the DP by ensuring disciplinary skills and knowledge that were introduced prior to the DP program. This occurs through formal planning in departments and at the initiative of teachers who teach across the MYP and the DP programs. Students and teachers attribute the cause of this narrowing of focus to the intensive disciplinary content and skills that are needed for DP examination success. This is exacerbated by a perceived lack of direction from the IB in bridging the gap between the two programs.
Two important corollaries emerged. First, participation in the IB continuum was understood to prepare students (more so than their DP-only peers) for the DP program by providing them with understanding of criterion-based assessment, developing their capacities to organize their workloads, and equipping them with the required inquiry skills. In particular, the MYP personal project and community service activities directly prepared students for the extended essay and CAS requirements. Second, although explicit reference to the LP appears to diminish as students proceed into the DP program, teachers and students continue to address the conative and affective domain attributes implicitly. Issues of intercultural understanding (open-minded) and

Page | 96
community service (caring) remain a priority through to the end of the DP program, although they may not always be discussed using the language of the LP. An explanation is that these attributes are also core school values articulated in the school mission. Although the school could address these values with or without the continuum, as indicated above, the continuum supports and aligns with them. Because the school is driven by its mission, the continuum serves a facilitating or supporting role in the realization of these attributes, rather than being the sole cause.
Teachers Outcomes
The main work of teachers has been to engage in professional activities that support the alignment of the curriculum. As indicated in the school outcomes summary, teachers have been working in D-12 departmental teams to review the curriculum and align it across the continuum. Typically, articulation discussions occur in conjunction with the formal curriculum review cycle in which vertical and horizontal curriculum alignments are addressed, and curriculum standards and benchmarks are developed. The continuum is addressed as teachers examine the articulation of the LP in each subject area, at every program level. Hence, participation in the continuum promotes discourse that informs all teachers about the uniqueness of each program. Accordingly, an important focus of articulation discussions concerns how to prepare students for DP success while valuing and upholding the core features of each program. Balancing meeting students “where they are at” with “where they need to be” is evidently an essential point of discussion in this continuum school. An advantage of the IB continuum is that teachers and program coordinators can engage in on-site professional development in different IB programs. This promotes further understanding of the IB continuum and of connections between programs.

Page | 97
8 Comparative Analysis
In this chapter, we consider the two case studies collectively and make explicit reference to practices that are connected to participation in the continuum.
It is important to reiterate that the case study schools were well-resourced and committed to implementing the IB continuum. Both aim to recruit highly qualified and experienced teachers and leaders who subscribe enthusiastically to the values of the respective schools. The teachers and students interviewed had positive perceptions of learning and teaching and expressed support for the three IB programs that comprise the continuum. Any critical comments about the continuum should not, therefore, be interpreted as a lack of commitment to the IB programs. Using this as a starting point, we have attempted to tease out during the interviews the different practices and perceptions that have bearing on the continuum. Comparisons made between the two schools are not intended to advocate one set of practices over the other.
8-1 School Culture
Each case study school has worked hard to align learning and teaching with the school’s core values. In School I, the core values are driven by its explicitly articulated identity as an “IB school” and as a “community school”. The school recently re-wrote its mission and vision statements to reinforce its alignment with IB values. This contrasts somewhat with School II, where the school leadership has delineated a core set of school values that it has mapped against those of the IB, to demonstrate areas of alignment. It is clear that the school leadership considers the school to be “more than an IB school”, driven by the mission and values delineated by its governing body—values that fit harmoniously with those of the IB. A key theme is that effective schools work to develop coherence across the school by aligning practice with values. In both cases, IB values form a key component of this alignment and support decision-making across the continuum.
Interviewees gave examples of ways in which core values and a shared language of learning and teaching shape decision-making practices. The continuum provides a clear reference point for the schools’ philosophies of learning and teaching. Although prospective teachers do not have to have IB experience, school values inclusive of those articulated in the LP form the basis for hiring decisions. School I reported that this is done explicitly during interviews, when candidates are evaluated on the basis of the LP and the values of a community school. This practice carries over to teacher appraisals and student admission processes. Such practices serve to ensure that members of the school community (teachers, students, families) understand the school’s values and are held accountable. School I, in particular, reported that the language of the LP would be used deliberately to achieve these purposes.
8-2 Language and Coherence
A key practice in the case study schools involves the deliberate shaping of a language of learning and teaching to form a “glue” to bind the programs together. The two schools have taken different approaches to this enterprise, which partially reflects their history and aims. School I’s gradual development saw IB programs being introduced progressively in tandem with school expansion. School II, in contrast, took on all three programs when they became available to the school in the 1990s. For School I, as new year levels were added some teachers transferred from the PYP to the

Page | 98
MYP and later from the MYP to the DP. These teachers carried at least some instruction and assessment strategies from lower years to higher years, informing some practices and shaping the language of learning and teaching across the school. In School II, an early adopter of the continuum, concerns about the three programs’ different pedagogies and language of learning and teaching pushed the school leadership to introduce a research-informed set of practices, and the language that goes with them, to bring about cross-program coherence. This is a relatively recent initiative and the language is still being embedded across the programs. The case studies illustrate that participation in the continuum necessitates and stimulates the development of a coherent language of learning and teaching, although this may result from a perceived “gap” in the three programs’ frameworks.
8-3 Curriculum Alignment and Learning
Schools, teachers and students reported that the LP became less prominent in the instructional lexicon as students progressed along the continuum to DP. This was related to factors such as individual teacher’s practices, student development—to some DP students, the use of LP language seemed “uncool”, —and the more discipline-specific focus of DP courses. DP courses were perceived as being focused on skill sets covered in DP examinations, which meant that some areas of the LP might not be referenced during classes. At the two schools, students and teachers reported that even if they did not use the LP language explicitly, the DP students could reflect on ways in which they were using the LP values in practice. They could perceive connections between the affective attributes of the LP and the involvement in CAS activities. Finally, school context was also seen as making a difference in the use of the LP. The school communities studied were international so it is difficult to distinguish the effect of the LP in terms of international and cross-cultural awareness from the influence of the context in which it operates.
Each of the schools deliberately shaped the curriculum to fit the LP. At School I, the school leadership team works in consultation with teachers to shape school-wide policy. The policy is implemented differently at each level of the school, as is appropriate, to suit the different curricula and student needs. In the primary school, a system of “essential agreements” constitutes a core strategy for articulating how policy is operationalized in a manner consistent with school values and the IB Learner Profile. At School II, a new initiative of curriculum mapping aims to articulate the curriculum with school-wide values and core practices that include the school’s mission and vision, the IB Learner Profile and program frameworks, and the Teaching for Understanding initiative. Curriculum maps, as they develop, are intended to demonstrate this alignment and function as a tool for teachers and leaders to analyze coherence across the continuum. Furthermore, the articulation of values serves as a filter for curriculum and instruction decision-making. Proposed changes to the curriculum will be analyzed through this filter, ensuring that future decisions are aligned with school values.
8-4 The Continuum, Teaching, and Learning
Leaders and teachers at the case study schools reported challenges in aligning the DP with the MYP due to differing approaches to disciplinary focus, subject rigor, and assessment practices. Teachers and leaders discussed tensions associated with being true to the uniqueness of each program, while ensuring that students were adequately prepared for the subsequent program. Interviewees noted that the different program approaches are developmentally appropriate for

Page | 99
students, but differences in terminology, curriculum scope, and assessment practices necessitated clearer transitions. Participants at each school reported that academic leaders and teachers were looking for ways to introduce some DP practices into the MYP. As DP teachers in both schools tend to teach the later-year MYP students, part of the transition happens organically. In other instances, these transitions are carefully planned. In School I, this effort was aimed at preparing students for subjects such as mathematics and literature. In School II, examining and articulating this alignment is part of the curriculum review cycle. Some teachers at the two case study sites expressed the need to be cautious about the MYP becoming a DP-preparation program. Clearly, articulating programs while maintaining their valued distinctions is a challenge.
There appears to be a slight difference in approach to this articulation at the two schools. At School II, the alignment appears to be driven from the DP down, as the last two years of the MYP begin to look increasingly like the DP in terms of formally introducing DP practices. However, the school is currently working on developing standards and benchmarks for the continuum so that a formal articulation may be developed that accounts for the needs of all of the programs. At School I, there appears to be DP-down pressure coupled with a significant PYP/MYP-up pressure that teachers work to rationalize. The bottom-up factor seems to emerge from the prolonged engagement of teachers and students with the continuum. Unlike many international schools, School I has a relatively stable core staff, many of whom teach across the MYP and the DP or have migrated in their teaching duties from the PYP to the MYP and from the MYP to the DP. This has meant that many DP teachers bring with them a strong affinity for and expertise in the MYP practices which they include in the DP. This includes referencing the language of the LP and inquiry approaches to learning.
Although students were challenged by some aspects of the transition to standard-level DP courses, students and teachers could articulate specific ways in which participation in the continuum served to prepare students for these challenges. This included a developed skill set in problem-solving and inquiry approaches to learning, familiarity with the particular school’s language of learning and teaching, assessment practices, meta-cognitive thinking strategies, a sense of confidence, and ability to cope with the DP workload.
In both schools, participation in the IB programs seems to encourage teacher collaboration around program implementation and curriculum development. Teachers collaborate through formal articulation discussions in order to build program coherence. Additionally, participation in the continuum allows teachers and leaders the opportunity to learn about other IB programs through participation in school-based in-service.
8-5 Leadership structures
Leadership structures in the two schools reflect IB criteria, the schools’ values and their different contexts. These contextual factors led each school to develop slightly different leadership structures. In the case of School II, the need to ensure that the values and the language of learning are embedded across the school led to the establishment of the position of Director of Learning to work with administrators and IB program coordinators to ensure cross-program coherence. The schools showed broad but relatively flat leadership distributions with a high degree of collaboration among school principals, vice-principals, program coordinators, and teachers, all of whom are involved in making decisions about the curriculum and instruction.

Page | 100
8-6 Summary of Findings
The case studies reveal a set of beliefs and practices that are influenced by the schools’ participation in the continuum, we now summarize them below.
School Outcomes
Both continuum schools: • work to identify respective core values and align them with IB values as expressed in the
LP. - essential agreements (School I) - values maps (School II)
• use their respective school values, the LP, and identification as a continuum school to guide them in areas such as curriculum and instruction decision-making, faculty recruitment and appraisal, and student admissions.
• use the LP to build program coherence, albeit to different degrees. This is exemplified in each school’s development of a language of learning and teaching as a “glue” to bind programs together. School I explicitly uses the LP to promote school cohesion in its teacher and student selection procedures. School II combines the LP with other sources, e.g., Teaching for Understanding, to fill perceived gaps in the lexicon used across programs.
Student Outcomes
• Continuum students in both schools appear to understand the LP better than DP-only students, and can identify LP attributes in their learning and behaviors. However, to varying degrees DP students and faculty members view acting “inherently” or naturally in a manner consistent with the LP, as more authentic than acting with deliberate reference to the LP.
• The context and values of the particular school make a difference to student achievement of the LP attributes, as these drive areas of emphasis. An example is the prioritizing of community or intercultural understanding in formally articulated mission statements.
• Participation in the continuum may better prepare DP students to understand and apply the particular school’s language of learning and the approaches to learning advocated by the IB, such as inquiry-based and problem-based learning strategies.
• Participation in the continuum may provide coherent learning experiences with reference to approaches to interaction and formative assessment practices.
• Participation in the continuum may provide coherence in developing personal organization and time management skills.
• Although the discipline-specific focus of the DP may serve to narrow the curriculum in a manner that marginalizes (or at least does not test) the application of some attributes of the LP, continuum students reflect that at least some affective domain attributes are implemented through CAS.

Page | 101
Teacher Outcomes
• The perceived discontinuity in terms of content knowledge between the MYP and the DP has led faculty members and school leaders to develop strategies to prepare students for the DP. - introducing standard-level mathematics, literary criticism, and specific science
subjects in the MYP; - focusing on alignment by introducing DP skills and content during the last two years
of the MYP; - assigning teachers to teach across programs; - introducing test preparation strategies into the MYP; - curriculum mapping; and - devising curricula based on standards and benchmarks.
• The continuum was seen as supporting engagement in the process of program alignment in a number of ways. - documenting and refining the implementation of continuum policies at each level; - clarifying school values with reference to the IB Learner Profile and program
frameworks; - working formally in vertical teams to review the curriculum and to develop standards
and benchmarks with which to articulate the curriculum; - working formally and informally in horizontal teams to identify themes for integrated
approaches to learning and teaching; and - providing the LP and program frameworks as structures for continuum articulation
discussions.
• These continuum schools supported teacher professional development in a number of ways. - providing opportunities to acquire the skills of inquiry-based teaching across all
programs; - providing opportunities for teacher participation in IB-sponsored PD, first as learners
and then as facilitators; - extending PD opportunities beyond the IB, bringing new knowledge to the school and
contextualizing it; and - providing opportunities for learning about other IB programs in the continuum by
allowing teachers and program coordinators to engage in cross-program training. This facilitates the development of in-depth knowledge about the continuum.
Key Variations
In the above summary, we have synthesized the findings from two case studies, pointing out areas of strong similarities and indicating areas of differences. To clarify the observation that different schools may enact the IB continuum differently, we reiterate the following key variations between the two schools that effect continuum implementation.
• The schools differed with regard to the centrality of the IB mission to the school mission.

Page | 102
School I stressed IB values in its mission. In contrast, School II’s mission was set by a governing body. In the latter case, the IB continuum served to support the school in achieving its goals.
• School I’s positioning as an “IB school” placed the LP as a key driver of coherence, whereas School II’s standing as “more than an IB school” validated looking outside the IB for strategies to develop coherence.
• The schools showed some variation in the way they approached curriculum coherence. Participants in both schools observed top-down pressure to align the MYP curriculum with DP outcomes. However School I’s teachers in particular transferred some MYP pedagogies to the DP, an apparent result of the school having gradually adopted the three programs in sequence, allowing MYP teachers to migrate to DP teaching assignments.
• As a result of School I’s concentration on the LP throughout the continuum, students and teachers appeared to incorporate the language of the LP in formal and informal discourse. In contrast, School II is in the process of incorporating Teaching for Understanding into its language of learning and teaching.

Page | 103
9 Conclusion
9-1 Overview
With the introduction of the PYP in 1997, it became possible for cohorts of students to proceed through the continuum of IB programs. In 2006, the IB expanded the application of the Learner Profile to all programs in the PYP–MYP–DP continuum. Consequently, several schools in Southeast Asia have graduated students who have experienced the continuum and, more recently, the Learner Profile in all IB programs.
This study examined the impact of participation in the IB continuum on school, teacher, and student outcomes. Data were collected through quantitative and qualitative research studies. The quantitative study utilized student questionnaires and DP examination results to analyze and compare the impact of continuum and non-continuum participation on examination results and Learner Profile outcomes. Likewise, a teacher questionnaire facilitated the comparison of leadership practices, organizational conditions, and teacher professional community at continuum and non-continuum schools. Leaders, teachers, and students from two case study schools were interviewed to obtain data pertaining to the impact of the continuum on the three areas of study: school, teacher, and student outcomes.
In this concluding chapter, we first review the major products and findings of this study in relation to the developed instrumentation and the analysis of the resulting data. Second, we recap key findings related to school, teacher, and student outcomes. We do this by developing a series of propositions to summarize the key findings. Finally, we articulate the limitations of the research and suggest ways forward.
9-2 Products
A key product of this study is the development of a validated IB Learner Profile Questionnaire (IBLPQ) targeting student respondents. The IBLPQ tests four LP attributes: knowledgeable, caring, inquirers, and open-minded. Construct validity was ensured through a two-stage Delphi study in which 1) professionals and students commented on questions and, after revision; and 2) professionals were surveyed on the relevance of the survey items. Through piloting and the main study, the soundness of factor structure, construct validity, and measurement reliability were tested. The results indicate a well-designed and reliable questionnaire. The development of the survey is explained in detail in Chapter 2.
A second product is the development of a Framework of Leadership in IB Schools, validated through the analysis of survey data completed by 333 teachers from 29 schools in Singapore, Thailand, Indonesia, and Vietnam. The framework comprises eleven constructs grouped into three dimensions: leadership practices, organizational conditions and teacher professional community. Questionnaire data were analyzed to assess model fit using the chi-square, root mean square error of approximation, comparative fit index, and Tucker-Lewis index. The validation of the framework and descriptions of its eleven constructs are found in Chapter 3.

Page | 104
9-3 Summary of Quantitative Findings
In addition to administering the above questionnaires, May 2013 IB DP examination results were collected and analyzed. Differences in teachers’ ratings of leadership dimensions in IB schools, student Learner Profile scores, and IB DP examination scores were analyzed. Teacher ratings of leadership practices and organizational conditions in IB schools were analyzed by grouping schools as continuum and DP-only. Group differences in student perceptions of outcomes pertaining to Learner Profile attributes and differences in students’ IB DP examination scores were analyzed by grouping students into continuum (students who participated in the PYP, the MYP and the DP for 8 years or more), multi-program, and DP-only categories. We also compared student Learner Profile scores by the proportion of local students in schools. Finally, a multi-level analysis was conducted to examine the impact of school characteristics and the Learner Profile on IB DP examination results. The analysis is presented in Chapter 4. Here we summarize the key findings as follows:
IB DP Examination Outcomes
1. No significant differences in IB DP examination results were found when continuum students were compared with non-continuum students.
2. When comparing continuum, DP-only, and multi-program students, results indicated a significant difference between multi-program and DP-only students’ test results (with DP-only students performing better) but no significant difference between continuum and DP-only students.
Learner Profile Outcomes
3. Overall, the sample students (both continuum and non-continuum) showed moderately positive perceptions of their capacity on the LP attributes: means range from 4.57 to 4.87.
4. No significant difference was found between continuum and non-continuum students with regard to differences in the LP attributes knowledgeable, inquirers, and open-minded.
5. Non-continuum students showed a significantly higher rating than continuum students on the attribute of caring.
6. When comparing continuum, DP-only, and multi-program students, no significant group differences were found in the LP attributes knowledgeable, inquirers, and open-minded.
7. Multi-program students showed a higher rating, with a low effect size, of their own capacity on caring than other groups. DP-only students showed a significantly higher rating than continuum students on caring.

Page | 105
8. The proportion of local students in IB schools appeared to be associated with student development in the LP attributes knowledgeable and open-minded1.
Relationship of the Learner Profile to IB DP Examination Results
9. The LP attributes knowledgeable and inquirers showed a positive association on examination results for all students.
10. The LP attributes caring and open-minded showed negative and no significant association, respectively, on examination results.
Leadership Practices and Organizational Conditions Outcomes
11. Continuum or DP-only school status was not significantly associated with (a) key leadership practices that are intended to improve learning and teaching, and support programmatic alignment; (b) organizational conditions, such as school mission and learning opportunities, that shape school cultures; and (c) facets of teacher professional community that examine ways in which teachers work together2.
Relationship of Leadership Practices and Organizational Conditions Outcomes to IB DP Examination Results
12. Principals’ capacity to encourage dialogue among DP teachers about the DP program and to secure and allocate resources to improve learning and teaching were positively associated with examination results, although the statistical significance was at the borderline level.
13. Teachers’ engagement in co-teaching, peer observation and peer feedback were positively associated with IB examination scores.
14. Principals’ behavior related to classroom observation and the regular inspection of student work were negatively associated with examination results.
9-4 Summary of Qualitative Findings
Two case studies were conducted at schools located in two different Southeast Asian countries. Both schools demonstrated firm commitment to offering the IB continuum. Variations in the two schools were noted with regard to school size, faculty attrition, and mission (School I highlighted community and IB values and School II prioritized its governing body’s mission). Data were 1 Please see Section 2 of Chapter 4 for a detailed illustration.
2 These three dimensions and the relationship to the constructs that inform key findings 11-14 are fully explained in Section 3 of Chapter 3.

Page | 106
collected primarily through interviews with school leaders, teachers, and students. The findings were analyzed and reported as school, student, and teacher outcomes. While the findings should not be generalized to all schools in all contexts, they have implications for practice and further inquiry. Key findings pertaining to the impact of the continuum are as follows:
School Outcomes
1. The Learner Profile supported coherence-making and program articulation by contributing to a common language of learning and teaching that forms a basis for reflection, dialogue, decision-making, and school cohesion across the continuum. The extent to which participants considered the Learner Profile robust enough for this purpose differed between the two schools.
2. Depending on school context, development, and mission, other tools may complement the Learner Profile to construct a school-wide language of learning and teaching. In School II, Harvard University’s Teaching for Understanding provided a key component of this language.
3. The schools operationalized the Learner Profile for cohesion purposes by using varying strategies that included: formally aligning the LP, school mission, values, and language to guide decision-making (School II); and explicitly referencing the LP to determine teacher recruitment and student selection (School I).
4. The schools differed in the centrality allocated to the IB mission and values (School I identifying as an “IB school” and School II as “more than an IB school”). However, in both cases, the continuum provided a touchstone to indicate the schools’ values pertaining to learning and teaching to stakeholders.
Student Outcomes
5. Students and teachers in both schools reported a narrowing of the curriculum as students progressed through the continuum, beginning in the final years of MYP. Both teachers and students viewed this progressive focusing towards cognitive domain attributes as a challenge. Typically, this programmatic shift was attributed to the disciplinary and examination focus of the DP.
6. The data suggest that there is a narrowing of the curriculum to subject-specific content and skills in the DP. This creates more content “gap” challenges for students moving from the MYP than for IGCSE students, whose intensive disciplinary preparation bridges the DP examination content. However, students and teachers explained that the MYP to DP “gap” is mitigated—at least with reference to coursework and school-based assessment—by the broader range of learning, assessment, and personal organization practices that continuum students have experienced.
7. Although participants noted curriculum discontinuity between the three programs that constitute the continuum, this viewpoint was moderated by suggestions that the “gaps” reflected each programs’ respective support for students’ stages of development.

Page | 107
Accordingly, teachers in both schools articulated concern that attempts to bridge MYP and DP should not come at the expense of each programs’ distinctive features.
8. Students and teachers in the two schools reported that a set of core skills developed in the PYP and the MYP helped to prepare students for facets of the DP pertaining to: inquiry-based learning, problem-solving, criterion-referenced assessment, organization and time management.
9. Teachers and students in School I reported a stronger tendency than in School II to use the language of LP attributes inside and outside of the classroom. However, students and teachers in both schools reported that students enacted the values of the Learner Profile even when it was not explicitly referred to.
10. Students and faculty members tended to articulate that participation in the continuum has a positive impact on the LP attribute of open-minded. However they also perceived this attribute to be influenced by contextual features such as a “community school” culture (School I), the governing body’s mission (School II) and the international composition of the student body (both schools).
11. Students and teachers in School I explained that the integrated approach of MYP subjects (e.g. integrated sciences, visual and performing arts) equipped students to make informed choices about DP subject selection.
Teacher Outcomes
12. In both schools, some faculty members reported that the provision of all three programs creates the potential to engage in on-site professional development and in opportunities to share practices across programs. The tendency for teachers to teach across the DP and the MYP programs further allows for increased understanding and articulation of the continuum.
13. A key area of teacher collaboration concerns efforts to understand the gaps between programs and to work on programmatic alignment. This effort occurred formally through articulation meetings and curriculum review; and informally as teachers who taught both the MYP and the DP took the initiative to introduce MYP students to DP-related content and skills. School II participants explained that work on alignment was facilitated by the development of a standards and benchmarks curriculum that articulated the Learner Profile in every subject area at each grade level.
9-5 Propositions
In the remainder of this section, we summarize key findings that are supported by the qualitative and quantitative data as a series of four propositions. For each proposition, we present four tables summarizing the key evidence and offer brief analysis. We then explain the study’s limitations and suggest areas for further inquiry.

Page | 108
Proposition 1
Engagement in the continuum provides a point of reference that schools use to define and disseminate values about instruction, assessment and curriculum; and to allocate resources accordingly.
Quantitative Data Case Study I Case Study II
- Strategic resourcing is positively associated with IB examination results.
- Revision of mission statement to highlight LP and IB values.
- Identification as a community school.
- Allocation of resources for IB related PD.
- Utilization of LP for teacher recruitment and student/family admissions.
- Identification of school-wide values.
- Decision-making framework based on above articulation utilized for decision-making.
- IB values / LP attributes embedded in strategic plans.
Continuum schools may more vigorously apply the values of the IB and the attributes of the LP by using it as a basis for policies, procedures, decision-making, and resource allocation. For instance, the LP may influence hiring processes across the continuum by serving as a banner for school pedagogy, or it may serve as a tool for assessing student admission. School missions may show alignment to IB values and the LP, which in turn drive strategic decision-making and resource allocation in ways that impact the continuum. For instance, School I prioritizes “community” as part of its mission statement—this helps shape decisions about its preferred size. School II utilizes its stated values to guide decision-making across the school.

Page | 109
Proposition 2
The disciplinary focus of DP courses and examinations leads to a narrowing of the curriculum with reference to LP attributes and assessment practices, leaving gaps or “jumps” between the MYP and the DP in particular. This has an impact on student experiences of the IB continuum.
Quantitative Data Case Study I Case Study II
- DP-only students in Southeast Asia tend to outperform multi-program students in the IB DP examinations.
- No significant difference in examination results was found between continuum and DP-only students.
- Positive association of knowledgeable and inquirers attributes with IB examination results.
- Negative association of caring with examination results.
- No significant association of open-minded attribute with examination results.
- Strong understanding and philosophical continuity of continuum.
- Top-down pressure on teachers and students by DP examinations in some subject areas.
- DP affects the learning and teaching culture.
- Bottom-up pressure to preserve program distinctions.
- Definite focus on inquiry based-learning across the continuum.
- Strong emphasis on criterion referenced assessment.
- Continued application of LP-informed language across continuum.
- CAS as valued because of continuum preparation.
- MYP students are prepared for inquiry, assessment, time management.
- IGCSE students are prepared for content and disciplinary skills.
- Top-down pressure of DP examinations in some subject areas.
- DP narrows the curriculum focus to disciplinary content and skills.
- DP narrows the LP focus in learning areas to inquirers and knowledgeable.
- Continuum as preparation for inquiry, criterion-based assessment, time management, and skills pertaining to Extended Essay.
- Concentration of LP affective domains in CAS.
The finding that there is no significant difference between continuum and DP-only students’ examination results may be partially explained by the preparation that both groups of students receive. Many DP-only students had completed the IGCSEs, which focus on disciplinary content and skills. Participants in the qualitative studies viewed this focus as advantageous in terms of preparing students for DP examinations. However, continuum schools may work to adapt the MYP programs to better prepare students for the content expectations of the DP program while drawing inquiry skills developed in the PYP and the MYP into the DP.
A particular challenge for assessing the impact of the continuum, as measured by examination results, is the tendency for teachers to focus increasingly on core disciplinary knowledge as students’ progress towards DP examinations. Time spent in DP classes on explicitly developing affective domain attributes, such as caring, is seen by many teachers and students as distracting from the core work of preparing students for examination success. However, participation in the continuum appears to equip students and teachers to reflectively identify areas of LP accomplishment that emerge organically, or exist implicitly in the DP (e.g., in CAS).
In sum, students and teachers are affected by the washback effect of the DP examinations. Although learning opportunities availed by CAS may provide opportunities for students to operationalize some of the affective domain attributes, the examinations themselves do not appear to provide a positive washback effect in the non-cognitive domain. Further, engagement in activities that support the affective domain—although important to the LP and to most school missions—appears to detract from examination preparation, as indicated by the negative association of caring and learning support with examination results.

Page | 110
Proposition 3
Effective continuum schools engage all faculty members in focused dialogue around matters of curriculum, instruction, and assessment, predicated on a culture of trust and the development of shared understanding. This dialogue is bolstered by rich, formal professional development opportunities. Participation in the IB continuum may encourage the school’s development by stimulating fuller understanding of other IB programs and networking with IB teachers in other schools.
Quantitative Data Case Study I Case Study II
- T-tests show that the continuum status was not significantly associated with the teacher professional community.
- Classroom monitoring is negatively associated with IB examination results.
- Within-program interaction is positively associated with IB examination results.
- De-privatized practice is positively associated with IB examination results.
- School-based and IB-provided PD.
- Support for staff as IB workshop facilitators.
- School-based training in other IB programs.
- New professional opportunities.
- Team teaching.
- Culture of trust.
- Engaging teachers in defining school-based policy.
- Ensuring teachers “buy-in” to the school mission.
- “Community school” ethos.
- Participation of teachers in curriculum articulation.
- Teacher engagement in vertical alignment of curriculum.
- Distributed curriculum leadership.
- PD provision for all faculties in essential initiatives (e.g., TFU).
- School-based training in IB programs.
- Engagement of teachers in articulation of school values, beliefs, and policies.
- Collaboration around D-12 curriculum articulation.
- Engagement in defining standards and benchmarks.
- Peer observation and feedback of teaching.
School leaders’ close and regular observations of classroom teaching (i.e., classroom monitoring) were not positively associated with IB examination scores. However, school leaders’ practices that promote sharing ideas among teachers (i.e., within-program interaction) were positively associated with IB examination results. In a similar vein, teachers’ de-privatized practice to obtain feedback from colleagues (not directly from principals) was positively associated with examination scores. The message here is that teachers’ interactions with colleagues for sharing ideas and seeking feedback work better for student learning outcomes than principals’ direct involvement in teaching and monitoring instruction, such as regular classroom observation and inspection of student work.

Page | 111
Proposition 4
Strongly held school values, and the diversity of the student population impact the enactment of the Learner Profile attributes knowledgeable and open-minded.
Quantitative Data Case Study I Case Study II
- The proportion of local and international students in schools is associated with LP attributes such as knowledgeable and open-minded.
- Strong value placed on “community school”.
- Strong emphasis on IB values and LP to drive school mission.
- Strong emphasis on “peace” and internationalism in school values.
- Perception that context, values and student composition requires and facilitates open-minded.
Quantitative findings suggest that students from schools that lack diversity may be denied the opportunity to examine their own and others’ values and beliefs, lowering the development of LP attributes knowledgeable and open-minded. The qualitative findings provide some support for this. Participants from School II, in particular, noted that student diversity encourages open-mindedness for practical reasons, such as making friends and facilitating discussions in courses that compare concepts and their application in a variety of contexts. Whether a predominantly local school population (in any location) can facilitate similar engagement was questioned by participants in School II. Students in School I explained that awareness of the open-minded attribute helps them adapt to peers and new contexts. Further, the school’s commitment to the “community school” concept may further support the open-minded attribute through the resulting positive interactions among students, faculty, administrators, and staff.

Page | 112
9-6 Limitations and Areas of Further Research
1. The development of the student questionnaire instrument, the IBLPQ, was a major product of this study. However, only four of the ten Learner Profile attributes were examined. These attributes were selected to represent attributes from the four theoretical constructs that underpin the Learner Profile. Potentially, the IBLPQ may be further developed to assess the impact of the Learner Profile on other attributes.
2. The impact of the continuum was assessed by analyzing the effect of the tested LP attributes and leadership constructs on IB DP examination results. However, qualitative data suggest that the impact of the Learner Profile affective and social domain attributes tend to be conserved in DP components such as CAS. Analysis of CAS, Extended Essay and Internal Assessments were not accounted for in this study. A future study could compare the impact of Learner Profile attributes and IB leadership constructs in continuum and non-continuum schools on measures of the non-examinable components of the DP.
3. This study compared continuum students with non-continuum students. Studies are required to examine how non-IB programs articulate to the DP and whether or not such an articulation influences examination results. However, it is acknowledged that other factors specific to the sample of continuum students in this study may explain these differences.
4. This study has not taken into account the impact that the IB continuum may have on schools, such as national schools, that aim to use the continuum as a lever to change values and practices pertaining to learning and teaching across schools. A study of schools that make such a shift could provide compelling data on the impact of the continuum in facilitating such a change.
5. This study was conducted prior to the introduction of MYP The Next Chapter. Participants in Schools I and II anticipate that revisions to the MYP will support the articulation of the curriculum and continuity of practice pertaining to instruction and assessment. There is potential for a study to analyze the impact on the continuum following implementation of these initiatives. The present study provides a baseline for comparative purposes.
9-7 Chapter Summary
This chapter provided an overview of major findings derived from quantitative and qualitative studies that were designed to investigate the impact of school and student participation in the IB continuum.
Two instruments were developed through the quantitative study. First, the IBLPQ was designed to assess student perceptions of their achievement of four LP attributes: caring, open-minded, inquirers, and knowledgeable. Construct validity was ensured through a two-stage Delphi study and a pilot survey. Second, adapted from surveys validated in Western public school contexts, an International School Leadership Questionnaire (ISLQ) was validated in the context of IB schools in Southeast Asia. This led to the development of an IB Leadership Framework comprising eleven constructs. These constructs are grouped into three dimensions: leadership practices, organizational conditions and teacher professional community.

Page | 113
Using the IBLPQ and the ISLQ, we collected data from students and teachers in four Southeast Asian countries. May 2013 IB DP examination results were provided by the IB and analyzed together with the questionnaire data to assess the impacts of continuum participation on the LP attributes, leadership constructs, and academic outcomes
In-depth case studies of two continuum schools provided rich data from school leaders, teachers and students. These data suggested important impacts, in two different contexts, of the IB continuum on school, teacher, and student outcomes. The findings suggest plausible explanations for some of the quantitative findings, albeit requiring further scrutiny.
Among the results that emerged from the analysis of the IB DP examinations were that there was no significant difference between DP-only and continuum students with regards to DP examination scores, DP-only students tended to earn slightly higher examination scores than did multi-program students (a very low effect size was observed). Second, the attribute of caring showed a negative effect on IB DP examination results and open-minded constituted no significant effect. Factors that may account for these results, and which are supported by qualitative data, include:
a) a reported narrowing of the DP curriculum to focus on tested, disciplinary specific content and skills that favor the LP attributes knowledgeable and inquirers (this finding corresponds to a positive association of the knowledgeable and inquirers attributes on the examination results); and
b) DP-only students to have experienced the IGCSEs as the middle school program, which lends itself to the development of disciplinary knowledge.
The quantitative study found no significant difference between DP-only and continuum schools in the dimensions of leadership practices, organizational conditions and teacher professional community and a negative impact for classroom monitoring. Whilst classroom monitoring tends to be associated in the literature with intrusive principal behaviors, the case studies suggested instead that school leaders and teachers focused on a series of behaviors that are supportive of building collaboration, trust, and school cohesion that is needed to develop a coherent and well-articulated continuum program.

Page | 114
References
Aiken, L. R. (1980). Content validity and reliability of single items or questionnaires. Educational and Psychological Measurement, 40(1), 955-959.
Aiken, L. R. (1985). Three coefficients for analyzing the reliability and validity of ratings. Educational and Psychological Measurement, 45(1), 131-142.
Aiken, L. S., Stein, J. A., & Bentler, P. M. (1994). Structural equation analysis of clinical subpopulation differences and comparative treatment groups: Characterizing the daily lives of drug addicts. Journal of Consulting and Clinical Psychology, 62, 488-499.
Anderson, J. C. & Gerbing, D. W. (1988). Structural equation modeling in practice: A review and recommended two-step approach. Psychological Bulletin, 103 (May), 411-423.
Antonio, A. L. (2003). Diverse student bodies, diverse faculties. Academe, 89(6), 14–17.
Benson, J. (2011). An investigation of chief administrator turnover in international schools. Journal of Research in International Education, 10(1), 87-103. doi:10.1177/1475240911398779
Bentler, P. M. (1990). Comparative fit indexes in structural models. Psychological Bulletin, 107(2), 238–246. doi:10.1037/0033-2909.107.2.238
Biro, I. M. (2003). Two Teachers’ Perspectives of Teacher-Teacher Interactions During the Implementation of the International Baccalaureate Primary Years Program. Unpublished MA thesis, University of Toronto, Canada.
Bullock, K. (2011). International Baccalaureate learner profile: Literature review. Retrieved from http://www.ibworldschool.org/research/resources/documents/LPLitReview_final.pdf
Bunnell, T. (2004). Overload and role ambiguity in international schools: The evidence from public relations activity. International Schools Journal, 23(2), 22–27.
Caldwell, B. (1998). Strategic leadership, resource management and effective school reform. Journal of Educational Administration, 36(5), 445-461.
Campbell, D. T., & Fiske, D. W. (1959). Convergent and discriminant validation by the multitrait multimethod matrix. Psychological Bulletin, 56(2), 81-105.
Cole, D. A., Maxwell, S. E., Arvey, R., & Salsa, E. (1993). Multivariate group comparisons of variable systems: MANOVA and structural equation modeling. Psychological Bulletin, 114, 174-184.
Creswell, J. W., Plano Clark, V. L., Gutmann, M., & Hanson, W. (2003). Advanced mixed methods research designs. In A. Tashakkori & C. Teddlie (Eds.), Handbooks of mixed methods in social and behavioural research (pp. 209-240). Thousand Oaks, CA: Sage.
Crocker, L., & Algina, J. (1986). Introduction to classical and modern test theory. Orlando, FL: Holt, Rinehart, & Winston, Inc.
Cronbach, L. J. (1951). Coefficient alpha and the internal structure of tests. Psychometrika, 16(3), 297-334.

Page | 115
Doherty, C. (2009). The appeal of the International Baccalaureate in Australia’s educational market: A curriculum of choice for mobile futures. Discourse: Studies in the Cultural Politics of Education, 30(1), 73–89.
Fan, X., & Sivo, S. (2007). Sensitivity of fit indices to model misspecification and model types. Multivariate Behavioral Research, 42(3), 509-529.
Field, A. (2005). Discovering statistics using SPSS. Thousand Oaks, CA: Sage.
Fornell, C., Larcker, D. F. (1981). Evaluating structural equation models with unobservable variables and measurement error. Journal of Marketing Research, 18(1), 39-50.
Gehring, J. (2001). The International Baccalaureate: ‘Cadillac’ of college-prep programs. Education Week. Available online at: http://www.edweek.org (accessed 05 October 2010).
Gilliam, L. H. (1997). The Impact of the International Baccalaureate Program on School Change. PhD dissertation, Virginia Commonwealth University, Virginia, US.
Gronn, P. (2002). Distributed leadership as a unit of analysis. The Leadership Quarterly, 13, 423-451.
Hair, J. F, Anderson, R. E., Tatham, R. L., & Black, W. C. (1998). Multivariate data analysis (5th ed.). NJ: Prentice Hall.
Halicioglu, M. (2008). The IB Diploma Program in national schools: The case of Turkey. Journal of Research in International Education, 7, 164-183.
Hall, J., Elder, T., Thompson, J. and Pollack, S. (2009) IBNA—The Primary Years Programme feld study. Education and Policy Evaluation Center, University of Georgia at Athens.
Hallinger, P., Lee, M., & Walker, A. (2011). Program transition challenges in International Baccalaureate schools. Journal of Research in International Education, 10(2), 123-136. doi:10.1177/1475240911407976.
Hallinger, P., Walker, A. & Lee, M. (2010). A study of successful practices in the IB program continuum (Research Report). Asia Pacific Centre for Leadership and Change, Hong Kong Institute of Education. Retrieved from http://www.ied.edu.hk/apclc/research_2.html
Hambleton, R. K. (1980). Test score validity and standard setting methods. In R. A. Berk (ed.), Criterion-referenced measurement: The state of the art. Baltimore: John Hopkins University Press.
Hancock, G. R. (1997). Structural equation modeling methods of hypothesis testing of latent variable means. Measurement and Evaluation in Counseling and Development, 30, 91-105.
Harker, R., & Tymms, P. (2004). The effects of student composition on school outcomes. School Effectiveness and School Improvement, 15(2), 177–199. doi:10.1076/sesi.15.2.177.30432
Hawley, D. (1994). How long do international school heads survive? Part 1. International Schools Journal, 14(1), 8–21.

Page | 116
Hawley, D. (1995). How long do international school heads survive? A research analysis (Part II). International Schools Journal, 14(2), 23–36.
Hayden, M. (2006). Introduction to international education: International schools and their communities. London: Sage.
Hayden, M., & Thompson, J. (1995). International Schools and International Education: A Relationship Reviewed. Oxford Review of Education, 21(3), 327–345. doi:10.2307/1050876
Haynes, S. N., Richard, D., & Kubany, E. S. (1995). Content validity in psychological assessment: A functional approach to concepts and methods. Psychological Assessment, 7(3), 238-247.
Hong, S., Malik, M. L., & Lee, M. K. (2003). Testing configural, metric, scalar, and latent mean invariance across genders in sociotropy and autonomy using a non-Western sample. Educational and Psychological Measurement, 63, 636–654.
Horng, E. & Loeb, S. (2010). New thinking about instructional leadership. Phi Delta Kappan, 92(3), 66-69.
Hu, L. T., & Bentler, P. M. (1999). Cutoff criteria for fit indexes in covariance structure analysis: Coventional criteria versus new alternatives. Structural Equation Modeling, 6(1), 1-55.
International Baccalaureate Organization. (2002). A basis for Practice: The Primary Years Programme. New York: International Baccalaureate Organization.
International Baccalaureate Organization. (2008). Towards a continuum of international education. Retrieved from http://occ.ibo.org/ibis/documents/general/g_0_iboxx_amo_0809_1_e.pdf
International Baccalaureate Organization. (2009a). IB learner profile booklet. Retrieved at http://www.ibo.org/programmes/profile/documents/Learnerprofileguide.pdf
International Baccalaureate Organization. (2009b). Request for proposals: A study of successful practices in the IB Programme continuum. New York: International Baccalaureate Organization.
International Baccalaureate Organization. (2011). Impact through leadership in international education: Our vision and strategic goals 2011-15. Retrieved from http://www.ibo.org/mission/strategy/documents/IBExternalStrat-V11.pdf
International Baccalaureate Organization. (2013). Programme growth statistics. Retrieved from http://www.ibo.org/facts/schoolstats/growth.cfm
Kenny, D. A. (2011). Commentary: Dyadic analyses of family data. Journal of Paediatric Psychology, 36(5), 630-633. doi:10.1093/jpepsy/jsq124
Kirk, R. E. (1996). Practical significant: A concept whose time has come. Education and Psychological Management, 56, 746-759.
Ko, J., Hallinger, P., & Walker, A. (2012). Exploring school improvement in Hong Kong secondary schools. Peabody Journal of Education, 87(2), 216-234. doi:10.1080/0161956X.2012.664474

Page | 117
Kwan, P. & Walker, A. (2008). Vice-principalship in Hong Kong: Aspirations, competencies and satisfaction. School Effectiveness and School Improvement, 19(1): 73-97.
Kwan, P. (2009). Beginning teachers’ perceptions of school human resource practices. Asia Pacific Journal of Education, 29(3), 373-386.
Lawshe, C. H. (1975). A quantitative approach to content validity. Personnel Psychology, 28, 563-575.
Lee, J. C. & Dimmock, C. (1999). Curriculum leadership and management in secondary schools: A Hong Kong case. School Leadership & Management, 19(4), 455-481.
Lee, M., & Madyun, N. (2008). School racial composition and academic achievement: The case of Hmong LEP students in the U.S. Educational Studies, 34(4), 319-331.
Lee, M., Hallinger, P., & Walker, A. (2012a). Leadership challenges in international schools in the Asia Pacific region: evidence from programme implementation of the International Baccalaureate. International Journal of Leadership in Education, 15(3), 289–310. doi:10.1080/13603124.2011.605475
Lee, M., Hallinger, P., & Walker, A. (2012b). A distributed perspective on instructional leadership in International Baccalaureate (IB) schools. Educational Administration Quarterly, 48(4), 664-698. doi:10.1177/0013161X11436271
Lee, M., Leung, L, Wright, E., Yue, T., Gan, A., Lei, K., & Li, J. (2014). A Study of the International Baccalaureate Diploma in China: Program’s impact on student preparation for university studies abroad. Education Policy Unit, Faculty of Education, Hong Kong University.
Lee, M., Louis, K. S., & Anderson, S. (2012). Local education authorities and student learning: The effects of policies and practices. School Effectiveness and School Improvement, 23(2), 133-158.
Lee, M., Walker, A., & Chui, Y. L. (2012c). Contrasting effects of instructional leadership practices on student learning in a high accountability context. Journal of Educational Administration, 50(5), 586–611. doi:10.1108/09578231211249835
Little, R. J. A. & Rubin, D. B. (1989). The analysis of social science data with missing values. Sociological Methods and Research, 18(2-3), 292-326.
Louis, K. S. & Lee, M. (2012). Does school culture matter? Defining and measuring a strong school culture linked to student learning. Presented at the annual meeting of American Educational Research Organization, Vancouver, British Columbia, Canada.
Louis, K. S., Leithwood, K., Wahlstrom, K. L., & Anderson, S. E. (2010). Investigating the links to improved student learning: Final report of research findings. University of Minnesota, USA. Retrieved from http://www.cehd.umn.edu/carei/Leadership/Learning-from-Leadership_Final-Research-Report_July-2010.pdf
Lowe, J. (1999). International examinations, national systems and the global market. Compare, 29(3), 317–330.

Page | 118
McGhee, R. (2003). Implementing the International Baccalaureate diploma programme in UK schools—rationales and challenges. IB Research Notes, 3(2), 3–8.
McIver, J. P., & Carmines, E. G. (1981). Unidimentional scaling. Beverly Hills, CA: Sage.
McLaughlin, M. W., & Talbert, J. E. (2006). Building school-based teacher learning communities: Professional strategies to improve student achievement. New York, NY: Teachers College Press.
Melton, T. D. (2003). Characteristics of Instructional Leadership in the American International School: Elementary School Principals’ Perceptions. Unpublished doctoral dissertation, Lehigh University, US.
Morse, D. T. (1998). MINSIZE: A computer program for obtaining minimum sample size as an indicator of effect size. Educational and Psychological Measurement, 58(1), 142-154
Muthén, B., Kaplan, D., & Hollis, M. (1987). On structural equation modeling with data that are not missing completely at random. Psychometrika, 42, 431-462.
Netemeyer, R. G., Johnston, M. W., & Burton, S. (1990). Analysis of role conflict and role ambiguity in a structural equations framework. Journal of Applied Psychology, 75, 148 - 57.
Newmann, F. M., Smith, B., Allensworth, E., & Bryk, A. S. (2001). Instructional program coherence: What it is and why it should guide school improvement policy. Educational Evaluation and Policy Analysis, 23(4), 297-321.
Nunnally, J. C., & Bernstein, I. H. (1994) Psychometric theory. New York: McGraw-Hill.
Penfield, R. D. (2003). A score method of constructing asymmetric confidence intervals for the mean of a rating scale item. Psychological Methods, 8(2), 149-163.
Penfield, R. D., & Giacobbi, Jr. (2004). Applying a score confidence interval to Aiken's item content-relevance index. Measurement in Physical Education and Exercise Science, 8(4), 213-225.
Raudenbush, S. W., & Bryk, A. S. (2002). Hierarchical linear models: Applications and data analysis methods. Thousand Oaks, CA: Sage.
Riesbeck, R. R. (2008). The impact of leadership and other factors on successful International Baccalaureate Diploma Programs in the United States (Unpublished doctoral dissertation). College of William and Mary, Williamsburg, VA.
Robinson, V. M. J., Lloyd, C., & Rowe, K. J. (2008). The impact of leadership on student outcomes: An analysis of the differential effects of leadership type. Educational Administration Quarterly, 44(5), 635-674.
Rovinelli, R. J., & Hambleton, R. K. (1977). On the use of content specialists in the assessment of criterion-referenced test item validity. Dutch Journal of Educational Research, 2, 49-60.
Rumberger, R., & Palardy, G. (2005). Does segregation still matter? The impact of student composition on academic achievement in high school. Teachers College Record, 107(9), 1999-2045.

Page | 119
Sammons, P., Day, C., & Ko, J. (2011). Exploring the impact of school leadership on pupil outcomes: Results from a study of academically improved and effective schools in England. International Journal of Educational Management, 25(1), 83-101.
Schafer, J. L. & Olsen, M. K. (1998). Multiple imputation for multivariate missing-data problems: A data analysts perspective. Multivariate Behavioral Research, 33(4), 545-571.
Segars, A. H. (1997). Assessing the unidimensionality of measurement: A paradigm and illustration within the context of information systems research. Omega, 25(1), 107-121.
Spillane, J. P. (2006). Distributed leadership. San Francisco: Jossey-Bass.
Stobie, T. D. (2007). Coherence and consistency in international curricula: a study of the International Baccalaureate diploma and middle years programmes, In M. Hayden, J. Levy & J. Thompson (Eds.) The SAGE Handbook of Research in International Education (pp.140–151). London: Sage.
Tabachnick, G. G. & Fidell, L. S. (2007). Experimental designs using ANOVA. Belmont, CA: Duxbury.
Tarc, P. (2009). Global dreams, enduring tensions: International Baccalaureate in a changing world. New York: Peter Lang.
Walker, A. (2007). Leading authentically at the crossroads of reform and culture. Journal of Educational Change, 8(3), 257-273.
Walker, A. (2012). Leaders seeking resonance: Managing the connectors that bind schools. International Journal of Leadership in Education, 15(2), 237-253. doi:10.1080/13603124.2011.626079
Walker, A., & Cheng, Y.C. (2009). Leading international primary schools: An integrative agenda for building understanding. International Studies in Educational Administration, 37(1), 43-59.
Walker, A., & Ko, J. (2011). Principal leadership in an era of accountability: A perspective from the Hong Kong context. School Leadership & Management, 31(4), 369-392. doi:10.1080/13632434.2011.606269
Walker, A., & Kwan, P. (2009). Linking professional, school, demographic and motivational factors to desire for principalship. Educational Administration Quarterly, 45(4), 590-615.
Walker, A., & Kwan, P. (2012). Principal selection panels: Strategies, preferences and perceptions. Journal of Educational Administration, 50(2), 188-205. doi:10.1108/09578231211210549
Walker, A., & Qian, H. Y. (2012). Reform disconnection in China. Peabody Journal of Education, 87(2), 162-177. doi:10.1080/0161956X.2012.664462
Walker, A., & Quong, T. (2010). Leading upstream: Professional learning for middle leaders. In A, Normore. (Ed.), Global perspectives on educational leadership reform: The development and preparation of leaders for learning and learners of leadership (pp. 357-376). Bingley, UK: Emerald.
Walker, A., Lee, M., & Bryant, D. (forthcoming). How much of a difference do principals make? An analysis of between-schools variation in academic achievement in Hong Kong public secondary schools. School Effectiveness and School Improvement.

Page | 120
Wells, J. (2011). International education, values and attitudes: A critical analysis of the International Baccalaureate (IB) Learner Profile. Journal of Research in International Education, 10(2), 174–188. doi:10.1177/1475240911407808

Page | 121
Appendices
Appendix 1: International Baccalaureate Learner Profile Questionnaire (IBLPQ) Used in Main Study

Page | 122

Page | 123

Page | 124
Note: Four items (two items from caring and two items from open-minded) were eliminated because of serious cross-factor loadings. They are crossed out in the above questionnaire.

Page | 125
Appendix 2: Valid Items in International Baccalaureate Learner Profile Questionnaire (IBLPQ)
Knowledgeable K1 Explore ideas and information from a range of different sources. K2 Explore ideas from a number of different perspectives and/or subject areas. K3 Appreciate the strengths and weaknesses of other peoples’ ideas. K4 Change your mind on issues after considering new evidence. K5 Apply ideas and concepts to understand how things work in new situations. K6 Analyse and present information and ideas found in different subject areas. K7 Build on others’ ideas to form your own opinion. K8 Apply familiar ideas and concepts in new ways in order to defend your own opinion.
Inquirers I1 Become curious about the things you read, see and hear. I2 Find out if there are more complex reasons for what appears to be a simple idea of belief. I3 Know how to systematically research a problem or a question. I4 Evaluate and use feedback from a variety of people to improve your learning. I5 Use a range of research strategies to investigate a problem. I6 Know how to research a problem independently. I7 Enjoy learning for yourself, not just because it’s required. I8 Want to keep on learning new things throughout your life.
Caring C1 Empathize with the feelings and needs of others in your local community. C2 Respect the feelings and needs of others in your local community. C3 Commit time and energy to help those in need. C4 Show care and compassion for your peers. C5 Make a positive difference in other peoples’ lives. C8 Empathize with the feelings and needs of people living in different communities and countries.
Open-minded O1 Critically examine your own cultural values and beliefs. O4 Critically explore the ways different individuals and cultures see the world. O5 Learn about the values and beliefs of different cultures. O6 Examine your own values and beliefs through learning how people from other cultures think and
act. O7 Consciously seek more knowledge about different cultures. O8 Encourage others to learn about different countries and cultures.
If using this instrument please reference as: Walker, A., Lee, M., Bryant, D., & Tam, H. L. (2013). International Baccalaureate Learner Profile Questionnaire. Hong Kong Institute of Education. Unpublished instrument.

Page | 126
Appendix 3: International School Leadership Questionnaire (ISLQ) Used in Main Study

Page | 127

Page | 128
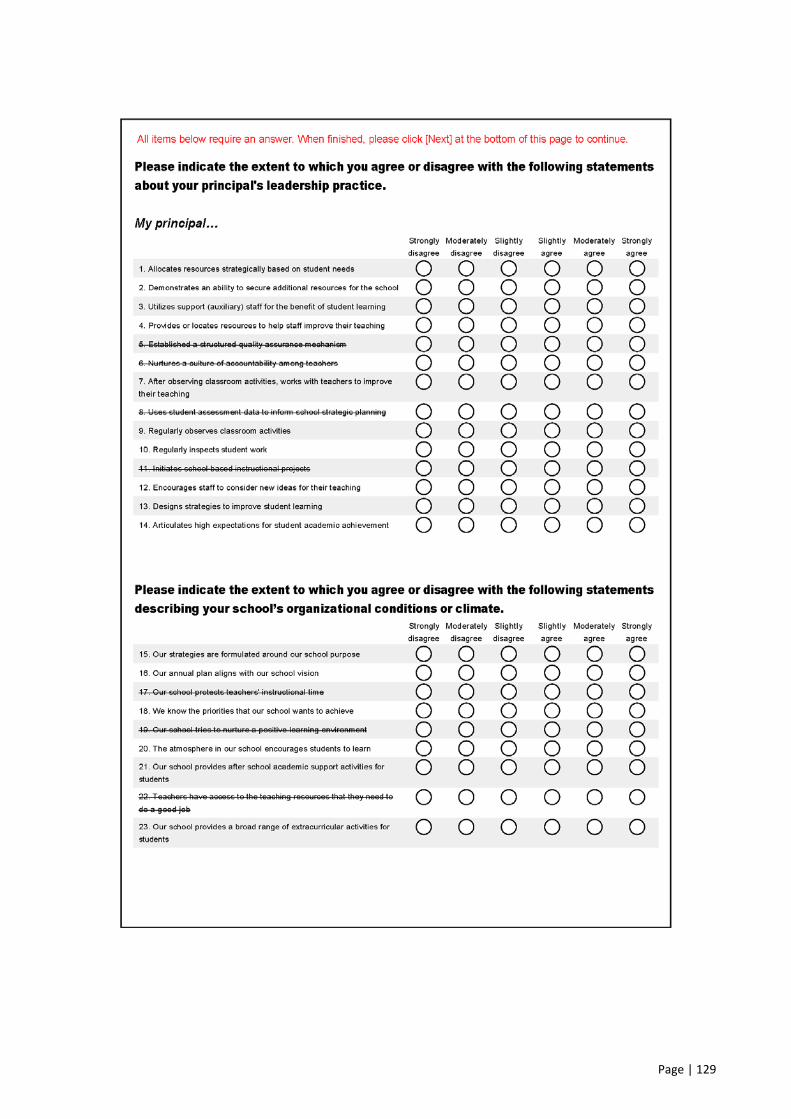
Page | 129

Page | 130

Page | 131
Note: 16 items were eliminated because of serious cross-factor loadings. They are crossed out in the above questionnaire.

Page | 132
Appendix 4: Valid Items in International School Leadership Questionnaire (ISLQ)
LEADERSHIP PRACTICES Learning and Teaching Strategic resourcing RM1 My principal allocates resources strategically based on student needs RM2 My principal demonstrates an ability to secure additional resources for the school RM3 My principal utilizes support (auxiliary) staff for the benefit of student learning RM4 My principal provides or locates resources to help staff improve their teaching
Classroom monitoring QA1 My principal after observing classroom activities, works with teachers to improve their teaching QA2 My principal regularly observes classroom activities QA3 My principal regularly inspects student work
Learning focus TL1 My principal encourages staff to consider new ideas for their teaching TL2 My principal designs measures to improve student learning TL3 My principal articulates high expectations for student academic achievement
Alignment and Articulation Within-program interaction WI1 School leaders encourage me to share ideas about effective teaching with other DP teachers in this
school WI2 School leaders encourage me to share teaching materials or learning activities with other DP
teachers in this school WI3 School leaders encourage me to discuss the DP program standards and assessment with other DP
teachers in this school WI4 School leaders encourage me to share what I learned at workshops or conferences with other DP
teachers in this school WI5 School leaders encourage me to discuss the educational philosophy and values embedded in the
Learner Profile with other DP teachers in this school
Cross-program interaction CI1 School leaders purposively schedule time for DP teachers to work together CI2 School leaders purposively schedule time for teachers across programs to work together CI3 School leaders provide enough resources which support teachers across programs in working
together effectively
Coherence building Art1 School leaders and/or Program Coordinators in this school teach classes Art2 School leaders encourage a common language of teaching and assessment across school programs Art3 School leaders provide clear guidelines and documentation to support curriculum implementation

Page | 133
ORGANIZATIONAL CONDITIONS Mission Focused AC1 Our strategies are formulated around our school purpose AC2 Our annual plan aligns with our school vision AC3 We know the priorities that our school wants to achieve
Learning Support SS1 Our school provides a broad range of extracurricular activities for students SS2 Our school provides after school academic support activities for students SS3 The atmosphere in our school encourages students to learn
TEACHER PROFESSIONAL COMMUNITY Shared Responsibility SR1 Teachers in this school help maintain discipline across this school, not just their own classroom SR2 Teachers in this school take responsibility for improving the school outside their own class SR3 Teachers in this school feel responsible for helping each other to teach better
Reflective Dialogue RD1 Teachers in this school talk to each other about what helps students learn best RD2 Teachers in this school work together to develop of new curriculum RD3 Teachers in this school work together to develop or improve curriculum materials
De-privatized Practice DP1 Teachers in this school visit each other’s classes to observe teaching DP2 Teachers in this school give each other meaningful feedback on their performance DP3 Colleagues regularly observe my teaching DP4 I regularly invite colleagues to help me teach in my classroom
If using this instrument please reference as: Walker, A., Lee, M.S. & Bryant, D. (2013). International School Leadership Questionnaire. Hong Kong Institute of Education. Unpublished instrument

Page | 134
Appendix 5: Key Interview Questions for Head of School
HEAD OF SCHOOL Organization 1. Why is your school an IB school?
2. What are the reasons for being a continuum school?
School cohesion/ shared goals/ culture
3. What goals drive the school? a. Are these particularly IB values? b. How do the IB values fit with the different set of principles? c. Does the different set of principles suggest areas of the IB program to stress
(e.g. CAS)? “Our learning community will be an inspirational role model for a better world”
d. How your values are manifest in the life of the school? e. Does being a FC school help to advance the school’s new vision statement?
How? 4. Are there any challenges in achieving buy-in to the IB / LP values with any
constituents of the school community
Leadership structure
5. Are there any areas of school improvement that you’re focusing on right now? 6. Does IB provide you with any levers that you can use to achieve your goals for the
school and its mission/vision? 7. Do you see the leadership structures as being any different because of being a
continuum school? a. Have these changed over time? b. Why? c. Has adopting the LP through to DP had any impact on this?
8. Are there any key leadership challenges in implementing the IB continuum? The LP? How are you working on them?
Teachers PD 9. Does being an IB school have any particular impact on of implications for staff
professional development? How is this supported/addressed?
Collaboration 10. Has being a continuum school impacted on: a. Collaboration among teachers? b. Teachers work on curriculum c. Changes in teaching and learning?
Students Coherence
11. Coming back to school vision. How do you see the school vision impacting on students?
a. How is IB positioned? Is it simply the academic side, or does it drive/support students in other areas?
b. Any adaptations made in the delivery of IB programs to harmonize with your school vision.
Impact 12. Are there any ways that being an IB school has unexpected impacts on your
organization and learning program? 13. As we go about interviewing teachers and students, is there anything that you think
we should ask to help us understand teacher and student outcomes of the school / IB program?

Page | 135
Appendix 6: Key Interview Questions for Director of Learning
DIRECTOR OF LEARNING Organization Cohesion
1. What do you see as the key driver for teaching and learning at this school? 2. How does being an IB school help to support the school mission/vision?
Curriculum development
3. What current initiatives are you working on to improve curriculum, teaching and assessment?
a. Are these in any way related to the LP b. Have any of the IB programs stimulated this change?
Leadership structures
4. What organizational structures do you have in place to support articulation between programs?
5. Do you think that any of the structures of the PYP, the MYP, the DP programs impact on the school leadership structure? Other practices?
Teachers Curriculum Development
6. Do you see program articulation being driven by DP, MYP, PYP, LP or something else? 7. What school improvement projects are teachers working now? Has the emphasis of this
sort of work changed? 8. What do teachers do to help develop curriculum coherence? Have these approaches
changed? 9. How tightly connected is the LP to the curriculum at the school?
Shared goals 10. Does being an IB continuum school in anyway drive improvement in curriculum and
instruction?
Collaboration 11. Does teacher collaboration look different in the different school levels? 12. To what extent does the LP provide a focus for work on curriculum and instruction in
the school? Is this different after adopting the LP in the MYP and DP levels? 13. How is teacher collaboration supported in the school? 14. Are there any key areas of program and schoolwide collaboration? What are not
necessarily IB related? What are clearly IB related?
Students Achievement and affective attributes
15. Aside from examinations, are there any strategies that your school uses to assess the impact of the LP on student learning outcomes?
a. Are there any facets of the LP that are challenging to assess? b. Are there any key areas of the LP that are assessed throughout the years? c. Are there any other skills sets (not necessarily in the LP) that you work on
aligning? d. How about the more affective domains
Coherence 16. Are there any aspects of the LP that are particularly emphasized throughout all
programs? a. Can you perceive any particular impact of this coherence on student
achievement?
Impact
17. Do you perceive any difference between students who have completed the full curriculum at your school and those who’ve just joined your school only for the DP?
18. What do you think students would say are the main benefits of completing the continuum?
19. As we go about interviewing teachers and students, is there anything that you think we should ask to help us understand teacher and student outcomes of the school / IB program?

Page | 136
Appendix 7: Key Interview Questions for Principals and IB Program Coordinators
PRINCIPALS AND IB PROGRAM COORDINATORS Organization Cohesion
1. What do you see as the key driver for teaching and learning at this school? 2. How does being an IB school help to support the school mission/vision?
Leadership structures
3. How does the school mission / vision / values help to guide areas of emphasis in instruction?
4. What are your roles and responsibilities? Does being a continuum school impact on this?
5. Does being a continuum school shape the role of teachers in your program?
Teachers Curriculum Development
6. Do you think that any of the structures of the PYP, the MYP, the DP programs impact on the school leadership structure? Other practices?
7. What current initiatives are you working on to improve curriculum, teaching and assessment at your level?
a. Are these in any way related to the LP b. Have any of the IB programs stimulated this change?
8. Do you see program articulation being driven by DP, MYP, PYP, LP or something else? 9. What do teachers do to help develop curriculum coherence? Have these approaches
changed?
Shared goals 10. What school improvement projects are teachers working now? Has the emphasis of this sort of work changed?
Collaboration 11. How tightly connected is the LP to the curriculum at this school? 12. Does being an IB continuum school in anyway drive improvement in curriculum and
instruction? 13. What does teacher collaboration look like in your level?
Coherence 14. How is teacher collaboration supported in the school? 15. To what extent does the LP provide a focus for work on curriculum and instruction in
the school? a. Is this different after adopting the LP in the MYP and DP levels? b. In the past few years, has there been any movement toward developing a
common language?
Students Achievement and affective attributes
16. Are there any key areas of program and schoolwide collaboration? What are not necessarily IB related? What are clearly IB related?
17. Aside from examinations, are there any strategies that your school uses to assess the impact of the LP on student learning outcomes?
a. Are there any facets of the LP that are challenging to assess? b. Are there any key areas of the LP that are assessed throughout the years? c. Are there any other skills sets (not necessarily in the LP) that you work on
aligning? d. How about the more affective domains?
Coherence 18. Are there any aspects of the LP that are particularly emphasized in your program? a. Can you perceive any particular impact of this coherence on student
achievement?
Impact
19. Do you perceive any difference between students who have completed the full curriculum at your school and those who’ve just joined your school only for the DP?
20. What do you think students would say are the main benefits of completing the continuum?
21. As we go about interviewing teachers and students, is there anything that you think we should ask to help us understand teacher and student outcomes of the school / IB program?

Page | 137
Appendix 8: Key Interview Questions for Teachers
TEACHERS Organization Cohesion
1. What do you see as being the key driver of learning and teaching at the school? (e.g. formal mission? Something informal?)
2. Is there anything in particular that you value about working at an IB school?
Cohesion and Culture
3. Do you see shared goals, values, and practices being enacted across the different levels of the school? What are examples of this?
Culture
4. How is the LP or other values in the IB communicated to the students? 5. Does the mission, values of the school or the different set of principles help to direct IB
implementation? What is the relationship here?
Teacher Curriculum Development
6. Have you observed any changes in emphasis in your program over the years that you’ve worked at the school?
a. In school structures? b. Is any of this a result of being a continuum school?
7. Are you working on any new school-initiated changes in learning and teaching? Are these in any ways connected to being an IB/FC school?
8. Have you observed any change in focus in this type of work over time?
Practice 9. Do you think that teaching in an IB continuum school causes you to teach differently? How?
Collaboration 10. What does teacher collaboration look like at your level? What sort of work is
emphasized? 11. What structures are there in place to encourage collaborative work? 12. How are targets for collaboration and or planning determined? 13. How is collaboration related to the IB program? 14. Do you see collaboration changing over your years in the school?
Structure (Org) 15. Have you observed any other major changes in learning and teaching over your years at
the school? What about support structures? Program alignment?
Culture (Org) 16. Is there a common language used across all levels of the school?
Teacher PD
17. How have you been developed professionally over your time at the school? What are the areas of emphasis?
Students Learning experience
18. Do you actively or deliberately align assessment to the Learner Profile? How would the sorts of skills that are stressed be assessed?
Affective learning outcomes
19. The IB LP stresses quite a lot of soft skills and attitudes like integrity and honesty and open-mindedness. How are these translated into skills? How are they assessed?
Impact
20. Do you notice any difference in the achievement of students who have completed the continuum in comparison to students who may transfer in from elsewhere?

Page | 138
Appendix 9: Key Interview Questions for Students
STUDENTS Organization Coherence
1. Is there anything that you see as special about your school?
Culture & Coherence
2. How familiar are you with the Learner Profile? Do teachers refer to it often in class? How else is it communicated to you? Or, are the different set of principles emphasised?
Achievement 3. Do you see teachers stressing similar themes or skills across subjects? How are these
communicated to you? 4. How do you think that you’ve grown?
a. Academically? b. Being organized? c. Other areas, like intercultural understanding, being open-minded or caring? d. What do teachers do to help you develop in these areas? e. Can you recall if there was any change in emphasis moving from MYP to DP?
5. Aside from tests, what other opportunities do you have to show what you’ve learnt? 6. What sort of activities have you participated in outside of the classroom that shows
your development? Are these related to IB?
Coherence 7. What do you see as being the key difference between MYP and DP or PYP and DP? 8. You are near to completing the DP program. Was there anything that you found new or
completely different that you were not prepared for? 9. What did you learn before that prepared you well for the DP? 10. Was there anything that you wish you had learnt before that could have prepared you
better for DP? 11. Do you think that it is the IB program that makes an impact on your learning OR is it
something unique about your school? 12. Do you think that you have benefited from having been in all of DP, MYP and PYP? In
what way?