Synthesis, Multinuclear NMR Characterization and Dynamic Property

1
The Integration of Mass Spectrometry and NMR for Structural
Characterization of Trace-Level Analytes in Complex Samples.
A dissertation presented by
Rose Muthoni Gathungu
to
The Department of Chemistry and Chemical Biology
In partial fulfillment of the requirements for the degree of
Doctor of Philosophy
in the field of
Chemistry
Northeastern University Boston, Massachusetts
April 2012

2
The Integration of Mass Spectrometry and NMR for Structural
Characterization of Trace-Level Analytes in Complex Samples.
by
Rose Muthoni Gathungu
ABSTRACT OF DISSERTATION
Submitted in partial fulfillment of the requirements for the degree of Doctor of Philosophy in Chemistry and Chemical Biology
in the Graduate School of Science Northeastern University, April 2012

3
ABSTRACT
This thesis centers on the applications of mass spectrometry based techniques and nuclear
magnetic resonance (NMR) to the structural elucidation of low molecular weight analytes in
complex mixtures. In the first chapter, a detailed overview of the challenges associated with the
integration of LC-MS and NMR and the approaches that have been taken towards overcoming
their mutually incompatible features in order to create an efficient analytical platform is
discussed.
Chapter 2 introduces an integrated LC-MS-NMR platform developed here at Northeastern that
provides high sensitivity for both MS and NMR. The platform uses a post-column nanoSplitter
for online LC-MS, and offline microdroplet NMR. The nanoSplitter provides nanoelectrospray
from 4 mm columns whilst collecting most of the flow for offline NMR. Nanoelectrospray
reduces signal suppression and increases sensitivity when compared to conventional
electrospray. Microfluidic sample loading, whereby the analyte is carried as a droplet in an
immiscible oil, increases sample loading efficiency into a microcoil NMR probe, for conducting
NMR in the most mass sensitive way. Because MS and NMR have different sample and time
requirements, NMR is conducted offline, which also allows for evaluation of MS data in
prioritizing goals for NMR analysis. The utility of this platform is shown in the analysis of plant
cell cultures. Plant cell and tissue cultures are a scalable and controllable alternative to whole
plants for obtaining natural products of medical relevance. The utility of our LC-MS-NMR
approach is demonstrated in the analysis of elicited Eschscholzia californica cell cultures induced
to produce benzophenanthridine alkaloids. Preliminary HPLC-UV analysis provides an overview
of the changes in the production of alkaloids with time after elicitation. At the time point
corresponding to the optimal yield of alkaloid products, the integrated LC-MS-microcoil NMR

4
platform is used for structural identification of extracted alkaloids. Eight benzophenanthridine
alkaloids were identified at the sub-microgram level.
In Chapter 3, a robust and highly sensitive analytical method that combines the strengths of mass
spectrometry, and NMR is developed. The end-goal of the work presented is to utilize this
analytical method in the structural elucidation of metabolites affected by diet. These metabolites
had previously been identified as markers of interest in a metabolomics study (the study of all
low molecular weight analytes in a biological system) using liquid-chromatography-
electrochemical detection (LC-EC). The structural characterization of these metabolites would
aid in identifying metabolic pathways altered by changes in diet and their association to disease
risk. Although highly sensitive (LODs at femtomole level), LC-EC provides little structural
information thus the need for MS and NMR. The validity of the developed analytical method is
demonstrated in the structural elucidation of metabolites in human plasma. For MS, a high-
resolution mass spectrometer operated with full-scan MS alternating between positive and
negative ion mode, and with high-energy collisional dissociation (HCD) all ion fragmentation in
each mode for MS/MS. Additional structural information of volatile and semi-volatile
metabolites is also gained from GC-MS analysis. Microcoil NMR, with limits of detection at 2
nmoles, is used as a follow-up to MS analysis. By integrating data from mass spectrometry,
microcoil NMR and LC-EC, nine metabolites from human plasma are unambiguously identified.
In Chapter 4, the superseding role of GC-MS for structural elucidation of Vitamin D compounds
is demonstrated. The hormonally active form of Vitamin D, 1α,25(OH)2D3 (Vitamin D3), has
therapeutic effects in various diseases including cancer. The major limitation to using Vitamin
D3 as a therapeutic agent is its potent calcemic activity, which leads to hypercalcemia.

5
Hypercalcemia leads to the formation of renal stones, soft tissue calcification and can be lethal.
A second limitation of the use of Vitamin D3 as a therapeutic agent is its short half-life caused by
its rapid metabolism and inactivation by CYP 24A1 hydroxylase. In this chapter, a combination
of GC-MS and HPLC were utilized to investigate the metabolism and stability of two vitamin D
analogs which were designed to resist metabolic inactivation by CYP24A1 and with reduced
calcemic effect. The metabolism of the C-3 epimer, a natural metabolite of 1α,25(OH)2D3 by
CYP24A1, is also investigated [6]. 1α, 25(OH)2-3epi-D3 differs from Vitamin D3 in the
configuration of the hydroxyl group at C-3 and has been shown to have the same therapeutic
effects as Vitamin D3 but without the calcemic effects.
In Chapter 5, some preliminary results demonstrating a metabolite extraction scheme utilizing
chelating agents for improved metabolite recovery in metabolomics are presented. This chapter
also includes some recommendations for future research based on the studies presented in this
dissertation.

6
ACKNOWLEDGEMENTS
The completion of this thesis would not have been possible without the help and support from a
lot of people who I would like to take this opportunity to thank.
For his guidance through these last four years and for giving me the opportunity to work in his
lab, many thanks to my graduate advisor Dr. Paul Vouros, who in addition to being a great
scientist is also a great man, I could not have asked for a better advisor. I am grateful for all the
time and energy he put into my scientific development. I would also like to thank Dr. Roger
Kautz who has acted as a co-supervisor. His love and enthusiasm towards science is an
inspiration. Dr. Vouros and Dr. Kautz gave me the freedom to explore on my own but always
gave me the guidance and support when I needed it which has made me a better scientist. Thank
you!
All my graduate work was done with collaborators from whom I have learnt a great deal about
different fields. I would like to thank Dr. Carolyn Lee-Parsons and Dr. John Oldham for all their
help with cell cultures. I would also like to thank Dr. Satya Reddy and Dr. Steve Rhieu with
whom I worked with on the analysis of Vitamin D compounds. Most recently, I started working
with Dr. Bruce Kristal, who has spent a lot of time answering all my questions even the simplest
of them and for that I am grateful. From Dr. Kristal’s lab I would like to thank Diane Sheldon
and most especially Dr. Susie Bird. Susie took me under her wings when I first joined the
Vouros group and has continued to be incredibly supportive through these last four years for that
I thank you. I would also like to thank Dr. Sergiy Tyukhtenko and Dr. Jianxin Guo both of
Northeastern’s Centre of Drug Discovery for always accommodating me on their NMR
spectrometer and for their assistance with experimental set-up.

7
I would like to thank members of my thesis committee for taking the time to read my thesis: Dr.
Michael Pollastri, Dr. Carolyn Lee-Parsons, Dr. Satya Reddy and Dr. Bruce Kristal. I would also
Dr. Susan Bird for the feedback she provided as I was writing this dissertation.
Shout out to Vouros group members both current and former who I have had the pleasure of r
meeting and working with. I would like to thank current members, Dr. Jim Glick for all hishelp
with instrumentation, Dr. Steve Coy, Vaneet Sharma, Josh Klaene, Adam Hall and Amol Kafle
and former members, Kristen Randall, Susie Bird, Christine Andrews, Caroline Flarakos, Jack
Cunniff and Yuriy Dunayevskiy. Yuriy and Jack donated two mass spectrometers that enabled
me to complete my work.
I was lucky enough to have some good friend both at Northeastern and outside Northeastern who
saw me though graduate school: Kyle, Chris, Lenny, Milos, Ben, Adam, Linda, Susel, Sahar,
Krytsal , Linnet, Richard, Cat, Francisca and Shiku thank you for all your support and for your
friendship.
Last and most importantly my sincere gratitude to my family in Kenya and in the U.S.A. First a
thank you to my parents for their unwavering faith in me and for their support throughout my life
and for the opportunities you provided that enabled me to pursue my dreams. To my brothers
thank you for always being there. To my cousins Wanja and Njoki you gave me a home when I
first came to the U.S.A and guided me as I adjusted to life in this strange land thank you.
Mwaura, Mwaniki, Dun and Georgina and aunt Charity, you have all stood by me I would not
have made it without you. Love you always!

8
DEDICATION
For my Mother.

9
TABLE OF CONTENTS
Abstract ........................................................................................................................................... 2
Acknowledgements ......................................................................................................................... 6
Dedication ....................................................................................................................................... 8
Table of Contents ............................................................................................................................ 9
List of Figures ............................................................................................................................... 12
List of Tables ................................................................................................................................ 14
List of Abbreviations .................................................................................................................... 15
Chapter 1: The Integration of LC-MS and NMR for the Analysis of Trace Analytes in
Complex Matrices ....................................................................................................................... 18
1.1 Introduction ............................................................................................................................. 19
1.2 Hyphenation of LC-MS and NMR ......................................................................................... 23
1.2.1 Choice of Mobile Phase for LC-MS-NMR………………………………………...24 1.2.2 Effect of LC Peak Width on LC-MS-NMR………………………………………..27 1.3 Online LC-MS-NMR .............................................................................................................. 29
1.3.1 On-Flow (Continuous) LC-MS-NMR……………………………………………..31 1.4 Alternatives to On-Flow LC-MS-NMR .................................................................................. 35
1.4.1 Stopped-flow LC-MS-NMR……………………………………………………….35 1.4.2 Loop-storage……………………………………………………………………….38
1.4.3 NMR Signal Enhancement by Fraction Collection Combined with Mass Sensitive NMR Probes …………………………………………………………………………….41
1.5 Conclusions…………………………………………………………………………………47

10
1.6 References……………………………………………………………………………………47
Chapter 2: Application of an Integrated LC-UV-MS-NMR Platform to the Identification of
Secondary Metabolites from Cell Cultures: Benzophenanthridine Alkaloids from Elicited
Eschscholzia californica (California poppy) Cell Cultures. .................................................... 54
2.1 Introduction ............................................................................................................................. 55
2.2 Project Goals ........................................................................................................................... 61
2.3 Materials and Methods ............................................................................................................ 62
2.4 Results and Discussion ........................................................................................................... 68
2.4.1 LC-UV Profilling of Elicited Cell Cultures……………………………………71
2.4.2 Identifictaion of Peak…………………………………………………………..73
2.5 Conclusions ............................................................................................................................. 89
2.6 References……………………………………………………………………………………90
Chapter 3: Identification of Metabolites Affected by Dietary Restriction using
Electrochemical Detection, Mass Spectrometry, and microcoil NMR and GC-MS. ............ 94
3.1 Introduction ............................................................................................................................. 95
3.2 Project Goals ........................................................................................................................... 97
3.3 Materials and Methods……………………………………………………………………..100
3.4 Results and Discussion ......................................................................................................... 106
3.4.1 Correlation of Analytical Results Across Platforms ............................................ 109
3.4.2 Metabolite Characterization ................................................................................. 111

11
3.4 Conclusion ............................................................................................................................ 128
3.5 References ............................................................................................................................. 128
Chapter 4: The Metabolism of Select Vitamin D Analogs and 1α, 25 (OH)2-3-epi Vitamin
D3 by Rat Cytochrome P450 24A1 Hydroxylase .................................................................... 133
4.1 Introduction ........................................................................................................................... 134
4.2 Biological Relevance of Vitamin D ...................................................................................... 136
4.3 Metabolism of 1α, 25 (OH)2 D3 by CYP 24A1 Hydroxylase ............................................. 137
4.4 Project Goals ......................................................................................................................... 139
4.5 Materials and Methods .......................................................................................................... 141
4.6 Results and Discussions…………………………………………………………………….145 4.6.1 Metabolism of Analogs by CYP 24A1…………………………………………...145
4.6.2 Metabolism studies of 1α,25(OH)2D3 and 1α,25(OH)2-3-epi-D3 using rat CYP24A1 reconstitution system.……………………………………………………………..158 4.7 Conclusions…………………………………………………………………………………163 4.8 References…………………………………………………………………………………..165
Chapter 5: Preliminary Results and Future Directions ........................................................ 169
5.1 Preliminary Results ............................................................................................................... 170
5.2 Future Directions .................................................................................................................. 175
5.3 References ............................................................................................................................. 176

12
List of Figures
Figure 1.1 Mass Spectrum of Propanolol ..................................................................................... 25
Figure 1.2 1H NMR spectra of 10 mM sucrose before and after solvent suppression .................. 27
Figure 1.3 Typical LC peak widths compared to the NMR probe’s observe volume .................. 28
Figure 1.4 Online coupling of LC-MS-NMR ............................................................................... 30
Figure 1.5 On-flow LC-MS-NMR analysis of Beer ……………………………........................ 32
Figure 1.6 UV and MS-based analyte selection for NMR analysis .............................................. 37
Figure 1.7 Stopped-flow and Loop Collection 1H NMR spectra of closely eluting LC Peaks…..40 Figure 1.8 Schematic Representation of LC-MS-SPE-NMR ....................................................... 42
Figure 1.9 LC-MS-SPE-NMR Analysis of the Glucuronide Metabolite of Paracetamol………..45 Figure 2.1 The nanoSplitter Interface ........................................................................................... 59
Figure 2.2 Comparison of segmented flow and flow injection analysis ....................................... 60
Figure 2.3The Work-flow used in the identification of Alkaloids ............................................... 70
Figure 2.4 Accumulation of Benzophenanthridine Alkaloids ...................................................... 72
Figure 2.5 LC-UV-MS-NMR of 96-hour time-point .................................................................... 75
Figure 2.6 MS and NMR results of Sanguinarine ........................................................................ 77
Figure 2.7 MS and NMR spectra of compound 3 and chelerythrine ............................................ 80
Figure 2.8 1H spectra of compound 4 and 7 ................................................................................. 84
Figure 2.9 The BPA pathway ...................................................................................................... 88
Figure 3.1 Schematic of LC-EC separation .................................................................................. 99
Figure 3.2 Analytical Strategy used to Identify Metabolites ...................................................... 108
Figure 3.4 LC-EC, LC-MS and 1H NMR analyis of Fraction C10 ............................................ 113
Figure 3.5 LC-UV profile of re-fractionation of D05 ................................................................ 115

13
Figure 3.6 MS/MS and GC-EI-MS fragmentation of Fraction D05_1 ....................................... 117
Figure 3.7 LC-UV profile of D05 and 1H NMR spectrum of D05_2 ......................................... 118
Figure 3.8 LC-EC and 1H NMR spectrum of E09 ...................................................................... 120
Figure 3.9 GC-MS spectra of E09 and indole-3-propionic acid ................................................. 122
Figure 3.10 LC-EC, MS/MS and GC-MS analysis of D06 ........................................................ 124
Figure 3.11 EI-MS spectrum of D12 .......................................................................................... 125
Figure 4.1 Biosynthesis and bioactivation of 1α, 25 (OH)2 Vitamin D3 .................................... 135
Figure 4.2 Metabolic pathways of 1α, 25 (OH)2 Vitamin D3 ..................................................... 138
Figure 4.3 Chemical structures of Vitamin D, its epimer and synthetic analogs ....................... 140
Figure 4.4 HPLC profile of lipid soluble metabolites of 1,2 and 3 ............................................ 146
Figure 4.5 EI-MS fragmentation of 1α, 25 (OH)2 Vitamin D3 .................................................. 148
Figure 4.6 EI-MS spectra of analog 2 and its metabolite f* ....................................................... 151
Figure 4.7 EI-MS spectra of analog 3 and its metabolites g* and h* ......................................... 153
Figure 4.8 ESI-MS analysis of analog 3 and its metbaolites g* and h*…………….. ............... 155
Figure 4.9 HPLC profiles of g* and h* before and after periodate oxidation ............................ 156
Figure 4.10 Comparison of rate of metabolism of 1,2, and 3 ..................................................... 157
Figure 4.11 HPLC profile of water soluble metabolites of 1 and 4 ............................................ 159
Figure 4.12 GC-MS spectra of water soluble metabolites of 1 and 4 ......................................... 160
Figure 4.13 Comparison of the metabolism of 1 and 4………………………………………....162 Figure 4.14 The C24 oxidation pathway of 1α,25 (OH)2 D3 and1α,25 (OH)2-3epi-D3………...164 Figure 5.1 Flow chart of Metabolite Concentration…………………………………………….171 Figure 5.2 Comparison of metabolite extraction with and without citric acid…………………174

14
List of Tables
Table 1.1 Summary of Advantages and Disadvantages of MS and NMR ................................... 23
Table 2.1 Table of Alkaloid Masses ............................................................................................. 78
Table 3.1 Correlation of LC-MS and LC-EC…………………………………………………..110
Table 3.2 Metabolites identified from Human Plasma ............................................................... 127

15
List of Abbreviations
1α.25 (OH)2 D3 1α, 25-dihydroxy vitamin D3
1α.25 (OH)2-3-epi- D3 1α, 25-dihydroxy-3-epi-vitamin D3
2,4-D 2,4-dichlorophenoxyacetic acid
25 (OH)D3 25-hydroxyvitamin D3
5MA 5-Methoxyindole acetate
ADR Adrenodoxin Reductase
ADX Adrenodoxin
BBE Bereberine Bridge Enzyme
BPA Benzophenanthridine Alkaloids
CHE Chelerythrine
CID Collisonally Induced Dissocaiation
CID Collisonally Induced Dissocaiation
CYP24A1 Cytochrome P450 24A1 hydroxylase
DAD Diode Array Detector
DHBPA Dihydrobenzophenanthridine alkaloids
DHCHE Dihydrochelerythrine
DHSA Dihydroxysanguinarine
DMSO Dimethyl Sulfoxide
DNP Dynamic Nuclei Polarization
DSS-d6 4,4, dimethyl-4-silapentane-1-sulfonic acid
DW Dry Weight
EC Electrochemcal Detection
EI Electron Impact
ESI Electrospray Ionization
eV electron volt
FIA Flow Injection Analysis
FID Free Induction Decay
FW Fresh Weight
GC Gas Chromatography

16
HCD High Collission Dissociation
HESI Heated Electrospray Ionization
HMDB Human metabolome database
HTS High Temperature Superconductors
Hz Hertz
I3AA Indole-3-Acetic ACid
I3LA Indole-3-Lactic Acid
I3PA Indole-3-Propionic acID
IPK Isolated Perfuse Kidney
ISA Indoxyl Sulfate
KHz kIlo Hertz
LC Liquid Chromatography
LOD Limit of Detection
m/z mass-to-charge
MS Mass Spectrometry
mV milivolt
NAA α-napthalene acetic acid
NaBH4 Sodium Borohydride
NaIO4 Sodium periodate
nESI nano electrospray Ionization
NMR Nuclear Magnetic Resonance
ppm parts per million
PYE Purified Yeast Extract
QBPA Quarternary benzophenanthridine alkaloids
rf radio frequency
S/N Signal-to-Noise Ratio
SA Sanguinarine
SFA Segmented Flow Analysis
SPE Solid Phase Extraction
TIC Total Ion Current

17
TMS Trimethylsilyl
TMSOH Trimethylsilanol
UV Ultraviolet Detection
VWD Variable wave detector
XIC Extracted Ion Chromatogram
18
Chapter 1:
The Integration of LC-MS and NMR for the Analysis of Trace Analytes in Complex Matrices

19
1.1 INTRODUCTION
The unambiguous identification of known - and more importantly unknown - analytes in
complex mixtures requires the use of chromatographic separation coupled to detectors that give
high structural information. Mass Spectrometry (MS) and Nuclear Magnetic Resonance (NMR)
are the two most widely used techniques for structural identification of compounds. The work
presented in this thesis utilizes mass spectrometry (coupled to gas chromatography (GC) or
liquid chromatography (LC)) together with subsequent NMR for elucidation of low molecular
weight compounds (molecular weight below 2,000). The coupling of these techniques and more
so the hyphenation of LC-MS and NMR is not trivial and requires compromises both in
instrumentation and method development. In this chapter, an overview of the analytical
challenges associated with hyphenation of LC-MS and NMR, and the steps taken towards
overcoming these challenges is discussed. GC-MS is a mature technique thus the hyphenation of
GC to MS is not covered.
Since the development of electrospray ionization, mass spectrometry combined with liquid
chromatography (LC-MS) has become the method of choice for structural identification of
analytes found in complex mixtures, due to its high sensitivity and selectivity [1-3]. The limits of
detection of MS are comfortably in the femtomole range for analytes with high ionization
efficiency. The LC separation greatly reduces the complexity of samples in MS, which in turn
reduces ion suppression, by reducing the number of charged analytes entering the mass
spectrometer at any one time, thus reducing competition for the amount of charge available at
any one time [4-6]. MS provides molecular weight information and from exact mass
measurements the elemental composition of compounds can be deduced [7]. Furthermore,

20
tandem mass spectrometry (MS/MS) provides structural information of compounds based on
their fragmentation patterns [8-11]. LC-MS is also very fast; spectral scan rates for MS are in the
nanosecond to microsecond range depending on the mass analyzer. In combination with fast
chromatography it is ideal for high-throughput analysis [11]. A limitation of mass spectrometry,
however, is that it does not provide unambiguous structural identification of compounds in the
absence of authentic standards. Definitive structural identification by LC-MS is usually based on
comparison of the retention time and the MS/MS spectral pattern of the analyte of interest, with
those of an authentic standard [10, 12, 13].
NMR is generally accepted as the method of choice when more definitive structural
characterization is needed. The NMR phenomenon is based on the interaction of nuclei with an
external magnetic field. In principle, any magnetically active nucleus is detectable by NMR;
however, due to the low sensitivity of most nuclei, those primarily studied in NMR are 1H, 13C,
19F and 31P. 15N is also frequently studied but it is detected indirectly though attached 1H [14,
15]. Structural information from NMR is deduced from the chemical shift which is dependent on
how shielded a nucleus is by surrounding electrons. Structural information is also gained from
mutual splitting of signals which provides information on the number of neighboring nuclei, and
from multi-dimensional experiments which indicate atomic connectivity [14, 15]. NMR has the
advantage of being non-destructive so, after NMR analysis, a sample can be recovered and
analyzed further using other techniques [14]. Also, unlike MS, the NMR signal strength is not
affected by matrix effects, so NMR is intrinsically quantitative [16]. NMR of pure compounds
or simple mixtures requires little or no sample preparation; however, when complex mixtures are
analyzed, separation of the mixture into their individual components is required in order to

21
reduce spectral complexity caused by overlapping signals. This has led to the coupling of LC to
NMR to streamLine the separation of compounds prior to NMR [17-19].
NMR and LC-NMR are, however, limited by the intrinsically low sensitivity of NMR. The low
sensitivity of NMR is because the energy gap between the low energy and high energy states is
extremely small at room temperature (only 1 in 10,000 molecules produce signal) making the
sample requirements 100-fold higher than for MS. Because of this low sensitivity, NMR also
requires long observation times to increase the signal to noise ratio (S/N) especially for low
concentration analytes [14, 19]. The observation times range from minutes to hours for a simple
1H spectrum, and hours to days for 2D experiments at the low microgram level and for the
analysis of low sensitivity nuclei like 13C which are particularly useful in the structural analysis
of unknowns. In light of these limitations, several strategies have been developed to allow the
routine use of NMR in the analysis of low concentration analytes [20]. One approach is the
development of higher field spectrometers as an increase in spectrometer frequency by a factor
of three leads to a 5.2-fold increase in S/N (e.g. from 300 MHz to 900 MHz). Moving to higher
fields primarily improves resolution which is useful in highly crowded spectra e.g. in proteins,
high field spectrometers are however very expensive [20, 21]. A second approach is the
development of highly sensitive NMR probes of which the principal approaches are small probes
(microcoil probes) and cryogenically cooled probes or high temperature superconducting probes
(HTS). Cryoprobes and HTS probes improve sensitivity by reducing the noise from the
electronic components; the electronics are kept at about 20K while the sample is at room
temperature, which leads to a four-fold improvement in S/N for organic solvents and two-fold
for aqueous solvents, when compared to a room temperature probe of the same dimensions [22,

22
23]. Microcoil probes have reduced coil dimensions, which lead to a reduction in noise leading
to an increase in signal. In addition, due to the probe’s small observe or active volumes (the
portion of the sample that is within the rf coil of the probe and is the only portion of sample that
contributes to signal) which are as low as 1.5 µl, analytes are dissolved in low volumes of
solvent which increases their concentration [24, 25]. NMR signal enhancement has also been
achieved by dynamic nuclear polarization (DNP) which involves the transfer of magnetization
from electrons to nuclei spins (electrons have an electronic polarization that is 660 times larger
than a proton and 2500 times larger than 13C) S/N improvements of as much as 10000 have been
achieved for 13C nuclei [26]. DNP however requires additional specialized instrumentation and is
applicable to only a few types of samples [27].
In the analysis of unknowns, MS and NMR provide complementary data and both are often
required. While MS cannot distinguish isobaric and stereoisomeric compounds, those are
distinguishable by NMR. On the other hand, MS can identify certain functional groups such as
sulfate and nitro groups which do not contain protons [28]. These complementary capabilities of
MS and NMR have led to complementary applications of both techniques in the analysis of
compounds that cannot be characterized with either detector alone in fields such as natural
product discovery, metabolomics and drug metabolite identification.
The advantages offered by each one of these techniques outlined in Table 1.1 can best be
realized through the analysis of individual compounds in as pure a form as possible. As such,
their coupling to chromatographic separation methods, specifically HPLC, provides an optimum
approach for their application in a broad spectrum of bioanalytical problems, which is the subject
of this chapter. The challenges associated with the integration of HPLC, MS and NMR and the

23
several approaches taken towards overcoming their mutually incompatible features in order to
create an efficient analytical platform will be discussed.
Advantages Limitations
MS
(LC-MS)
• Provides Molecular Weight
• Sensitive (LODs 10-12–10-21
mol )
• Specific (MS/MS)-Fragmentation patterns unique to specific analytes
• Fast
• Suffers from matrix effects (mitigated by LC)
• Structural identification requires comparison with authentic standards
NMR
(LC-NMR)
• Detailed structural information (multi-dimensional experiments)
• Non-destructive
• Inherently quantitative
• Low sensitivity (LODs 10-9–10-12
mol)
• Long acquisition times for low conc. and Multi-dimensional experiments.
Table 1.1: A summary of the advantages and limitations of MS and NMR.
1.2 HYPHENATION OF LC-MS AND NMR.
Online coupling of LC-MS and NMR in a single integrated system would provide all structural
information of a sample in a single injection, while minimizing sample preparation, and reducing
the potential of sample degradation though drying. The online coupling of LC-MS and NMR was
first reported by Pullen et al. in 1995 [29] . The coupling of LC to NMR required the commercial
development of flow NMR probe; because conventional NMR uses tubes [30, 31].

24
In the development of a hyphenated analytical method, (e.g.LC-MS, GC-MS, LC-NMR, etc.) it
is essential to consider the features which make them compatible and/or incompatible and the
complexity of hyphenating them. For the online hyphenation of LC-MS and NMR, the technical
considerations required for their successful integration are summarized below.
1.2.1 Choice of Mobile Phase for LC-MS-NMR:
The mobile phases commonly used in reversed-phase HPLC are acetonitrile or methanol as the
organic mobile phase and water as the aqueous mobile phase. All of these solvents have protons
at concentrations of 30-100 M, and these strong signals can mask the NMR signal of low
concentration analytes [32, 33]. To reduce interference from the mobile phase resonances,
deuterated solvents are preferably used for separation but due to cost often the organic phase is
used in its protonated form and water is substituted with D2O which is relatively inexpensive.
However, the use of deuterated water in 1H NMR, masks exchangeable (active) hydrogens i.e, -
SH, -NH, -OH because of their rapid exchange with the solvent. Deuteration can also shifts the
mass-to-charge (m/z) ratio of analytes of interest, and slightly changes the retention time of the
analytes relative to the protonated form [34, 35]. Deuterium incorporation has to be taken into
account when interpreting mass spectra, especially so when an analyte is partially deuterated
which leads to observation of several masses for the same analyte [34, 36]. For example, Figure
1.1 shows the mass spectrum of propranolol obtained from a LC-MS-NMR experiment that
utilized deuterated water and acetonitrile (protonated) for separation. Two masses at m/z 262 and
m/z 263 are observed due to partial H/D exchange [34]. To account for the changes observed in
LC and in MS, an initial LC-MS separation with non-deuterated mobile phases is first done then
compared with one in the deuterated solvent. Differences between data with and without

25
deuterated solvents can often assign the number of exchangeable protons, which is useful for
structural characterization [34, 37]. An alternative technique for mass spectrometry is to
introduce a “make-up” flow with an excess of non-deuterated solvent between LC and MS
analysis so, that deuterated protons can back-exchange [38].
Figure 1.1 The mass spectrum of propranolol (molecular weight 259) obtained during an LC-MS-NMR (mobile phase D2O and protonated acetonitrile), shows masses at m/z 262 and m/z 263 from different states of deuteration. Reprinted from ref. [34] with permission.
When non-deuterated solvents are used for LC-MS-NMR, interference from the solvent
resonance can be reduced through its selective suppression which enhances analyte signal [39,
40]. The residual water resonance which is observed in all NMR solvents may also require
suppression [40]. Figure 1.2 shows NMR spectra of a 10 mM sample of sucrose before and after
solvent suppression. Suppression of the residual water resonance at 4.5 ppm and the acetonitrile

26
resonance at 2 ppm increases the analyte signal 100-fold [40]. Solvent signal suppression
however tends to also suppress resonances in close proximity to that of the solvent. Suppression
of the water signal can also lead to suppression of exchangeable protons which are in fast
exchange with water [17, 41].
Modifiers and buffers that are added to the mobile phase to improve the peak shape of ionic
compounds and to ensure reproducible retention times in LC, and for ionization of analytes in
MS, can also produce high background in online LC-MS-NMR [17, 42]. For NMR, additives
that do not have protons are preferred, while for MS, additives that will not interfere with the
ionization process are preferred. Buffers that are NMR friendly are generally incompatible with
ESI because most are non-volatile and can clog the ion source (e.g. sodium phosphates). Other
additives like trifluoroacetic acid (TFA), which is NMR friendly, is volatile and a great ion
pairing reagent, leads to ion suppression in MS especially of acidic analytes due to its high
conductivity and high surface tension. In addition, TFA ion pairs with acidic analytes and
neutralizes them, which makes them undetectable in MS [43]. Formic acid has been found to be
the best compromise for both MS and NMR. Although it has a sharp proton resonance at 8.5
ppm, this single sharp signal is easily suppressed [34].

27
Figure 1.2 10 mM sample of sucrose analyzed by LC-NMR (mobile phase 50:50 D20: acetonitrile), before suppression of solvent resonance (Top Spectrum). Selective suppression of the solvent resonances at 2 ppm (acetonitrile) and 4.3 ppm (residual water) lead to the enhancement of the analyte signal (bottom spectrum). Reprinted from ref. [40] with permission.
1.2.2 Effect of LC Peak Width on LC-MS-NMR
Signal in NMR is proportional to the amount of analyte present in the NMR probe’s active
volume. Flow probes used in LC-MS-NMR have observe volumes of 60-250µl. A 60 μl volume
is equivalent to 8 seconds of flow at a flow rate of 1 mL/minute. Typical LC peaks are usually
10-90 seconds wide (Figure 1.3), which means that only a fraction of the available analyte
produces NMR signal which further reduces the overall sensitivity [44]. Because the probe
dimensions cannot be changed, the residence time of the analyte can be increased by reducing

28
the LC flow rate, or by stopping the LC pump to ensure the acquisition of more scans[17, 45].
This can compromise LC, leading to broader peaks through diffusion [17]. An alternative is the
use of capillary LC which typically has sharper peaks but the capillary LC columns have a 10-
fold lower loading capacity than analytical columns which limits them for NMR analysis
especially of low concentration analytes [19, 46].
The above discussion illustrates the disparate requirements of these three analytical techniques
and the challenges involved in their incorporation into an integrated platform. The approaches
taken to overcome these disparities are discussed next.
120 µL
Figure 1.3 A 120µL flow probe (left), some typical LC peak widths compared to the NMR probe’s volume. Reprinted from ref. [44] with permission.

29
1.3 LC-MS-NMR
HPLC can be interfaced to both MS and NMR, either in series or in parallel as shown in Figure
1.4. When connected in series, (Figure 1.4A) after LC separation the eluent passes first through
the NMR detector which is non-destructive, and is then followed by MS analysis. Due to the
differences in sample requirements between MS and NMR, the flow is split before MS analysis,
with the majority directed to waste and the rest to the MS system. This mode has not been
extensively used because it is difficult to correlate the results from each detector as the analytes
are sampled at different times in each detector [37].
Parallel detection by MS and NMR is the more extensively used approach of hyphenating LC-
MS and NMR (Figure 1.4B). In this mode, the LC eluent is split at typical ratios of 1:5 or 1:20
between the MS and the NMR with the majority of the flow directed towards the NMR and the
smaller fraction to the MS system[17].
Online LC-MS-NMR data can either be acquired simultaneously on both detectors, or the NMR
experiment can be temporarily decoupled from the LC-MS to allow for enhancement of the
NMR S/N.

30
LC
NMR
Waste/Recovery
MSSplitter
(A) (B)
LC
UV
5% 95%
MS NMR
Waste/Recovery
Splitter5%
95%
UV
Figure 1.4: Online coupling of LC-MS-NMR, in series (A) and in parallel (B). In series, after LC separation, the LC eluent passes through the NMR, and directed to the MS after completion of the NMR experiment. In parallel, the LC eluent is split between the MS and NMR with most of the flow directed towards the NMR due to the low sensitivity of NMR.

31
1.3.1 On-flow (Continuous) LC-MS-NMR
On-flow or “continuous mode” LC-MS-NMR is characterized by simultaneous and continuous
acquisition of MS and NMR data. A second detector, usually a UV detector, is used to trigger the
transfer of the analyte to both the MS and the NMR. The transfer lines between the MS and the
NMR are first calibrated to co-ordinate the operation of the two detectors [17].
Data in the on-flow mode are generally displayed as a contour plot of stacked 1H or 19F spectra
with the retention time displayed on the vertical scale and the chemical shift on the horizontal
scale. Figure 1.5 shows a typical depiction of on-flow LC-MS-NMR results, in this case used in
the determination of carbohydrates in beer [47]. Figure 1.5A shows the LC-NMR results
displayed as a pseudo-2D contour plot, the LC retention time is on the vertical axis and the
chemical shift on the horizontal axis. The 1H NMR spectra corresponding to each component
based on the retention time are extracted from each contour (Figure 1.5B). The MS data (Figure
1.5B) of each analyte are recorded concurrently with the NMR data. In this specific case, the MS
results detected the presence of polysaccharides in the beer while the NMR results indicated
whether the oligomers observed were branched or straight. Straight oligomers have α (14)
glycosidic linkages while branched oligomers have α (16) glycosidic linkages. These two
configurations have distinct chemical shifts of the 1Hs at α (14) and α (16) positions. In the
on-flow mode however, the NMR results of some analytes were inconclusive due to their low
concentrations, as indicated for the compound with the retention time of 16.6 minutes [47].

32
(A)
1H NMR MS
(B)
Figure 1.5 On-flow LC-MS-NMR analyses of Carbohydrates in Beer. A. Contour plot representation of the LC-NMR results. B. 1H NMR spectra (Right) extracted from A. Positive ion MS (Left) results recorded concurrently with NMR results. Reprinted from ref. [47] with permission.
33
In addition to the considerations of solvent composition and LC peak width , use of on-flow LC-
MS-NMR also need to take into account the effect of gradient elution and the flow rate of the
mobile phase. These factors mainly affect the NMR [17]. Specifically for separation of mixtures,
the wide differences in polarities of analytes benefit from the use of gradient elution whereby the
percentage of the organic mobile phase is increased over time to give better separation of
multiple components in the mixture. Gradient elution is problematic in NMR because it leads to
broadening of resonances (reduced resolution) in the NMR dimension. This is due to a gradient
of magnetic susceptibility in the NMR probe caused by the constant change in the mobile phase
composition within the probe. Magnetic inhomogeneity can be reduced by using shallower
gradients [17, 32, 33].
Gradient elution also affects the chemical shifts of the analytes under investigation. The chemical
shift in NMR is highly dependent on the solvent. Thus, under gradient elution, where the solvent
(mobile phase composition) is constantly changing, the chemical shifts of the analytes also
change. For example, a 1% change in solvent composition can shift the solvent resonance by up
to 15 Hz [17, 32, 33, 48]. The shift in the solvent resonance can complicate solvent suppression
as it is difficult to predict where the solvent is located. To allow for solvent suppression, a scout
scan is usually first performed to establish the location of the solvent resonance [32, 33].
On-flow LC-MS-NMR is also affected by the flow rate used for elution. Due to the higher
sample requirements in NMR as compared to MS, analytical columns with a loading capacity of
>100 μg are used to ensure the presence of enough material for NMR. The optimal flow rate for
these columns is in the mL/minute range, which has a negative effect on both MS and NMR. The
effect of the high flow rate is reduced in MS because the flow is split with the majority directed

34
to the NMR. For NMR however, higher flow rates reduce the residence time of the analytes in
the NMR probe which leads to acquisition of fewer scans. As a result the use of NMR is limited
to the analysis of only high concentration samples due to the short residence time of analytes in
the probe. Reduced flow rates can increase the residence time for NMR analysis but lead to
broadening of the LC peaks. Flow rates of between 0.1-0.4 mL/minute have been found to be a
good compromise to increase the residence time in the NMR probe with acceptable broadening
of LC peaks [17, 49].
Although the limits of detection (LOD) in the on-flow mode are relatively high (LODs are
between 5-10 µg) due to the short residence time of a sample in the NMR probe, on-flow LC-
MS-NMR is useful as a screening tool to give an overview of proton (and in some cases fluorine)
carrying compounds eluting from an LC column. On-flow LC-MS-NMR has found applications
mainly in the identification of drug metabolites, and has especially been useful in identifying
metabolites from fluorine containing compounds [28, 50]. Fluorine containing compounds are
relatively common in drug design thus the use of 19F NMR is highly diagnostic especially
because 19F NMR spectra are less crowded than 1H NMR spectra [28, 50] .
In addition to metabolite identification, on-flow LC-MS-NMR has been used as a screening tool
in the field of natural product whereby it is used to provide an overview of a plant extract to
eliminate known compounds (dereplication) and also to confirm if there are co-eluting species
which even if they co-elute, can be distinguished in either in NMR or in MS [17, 45, 51]. Other
applications include quality control in the beverage industry [47]. It has also been used as a
screening tool in metabolomics [36] and in the characterization of degradation products in the
pharmaceutical industry [52]. In all his applications however, on-flow LC-MS-NMR does not

35
provide detailed structural information which is a requirement for structural elucidation of
unknowns.
1.4 ALTERNATIVES TO ON-FLOW LC-MS-NMR
Due to the lower sensitivity of NMR when compared to MS, alternative methods to continuous
flow LC-MS-NMR have been developed that temporarily decouple the MS and NMR analyses.
These methods increase NMR sensitivity either by allowing for longer acquisitions of NMR data
or by increasing analyte concentration. These approaches permit acquisition of NMR data of low
concentration analytes, acquisition of low sensitivity nuclei (i.e. 13C or 15N) and, for acquisition
of 2D NMR experiments which are often required for complete structural characterization of
unknowns. Alternatives to on-flow LC-MS-NMR include stopped-flow, LC peak collection into
loops and LC peak pre-concentration using either solid phase extraction (SPE) or guard columns
or by collecting and drying fractions on well-plates each will be discussed
1.4.1 Stopped-flow LC-MS-NMR
Stopped-flow LC-MS-NMR is used to increase the short residence time in on-flow LC-MS-
NMR by stopping the LC pump when the analyte of interest reaches the NMR probe. This allows
for acquisition of more scans for detection of low concentration analytes (LODs for 1H NMR in
stopped-flow mode are ~100 ng) [17]. It should be noted that the S/N in NMR increases with the
square root of the number of scans, thus to double the S/N, the number of acquisitions has to be
quadrupled [14]. The stopped-flow LC-MS-NMR mode also enables the acquisition of more
time-consuming 2D NMR and also allows for acquisition of spectra from low sensitivity nuclei
like 13C for detailed structural analysis [53]. An additional advantage realized through stopped-

36
flow NMR is that, because acquisitions are performed under static conditions, magnetic
homogeneity is maintained and solvent resonances remain constant for suppression [17, 32, 33,
37, 53].
In the stopped-flow mode, the LC pump is stopped when the analyte of interest is in the NMR
probe. This can be triggered by either a UV and/or the MS-detector, thus delays must be
calibrated and prior knowledge of the elution patterns of analytes of interest is an advantage [17].
The use of the MS to determine when the LC pump should be stopped has an advantage over UV
in detecting analytes that do not contain a chromophore or for compounds with a low UV
absorbance. Even more specificity on peak selection can be achieved by use of tandem MS (MS
/MS), whereby a particular MS/MS transition can be used to trigger when the LC pump should
be stopped [17, 53, 54]. Figure 1.6 shows an example of the analysis of apple peel extracts by
LC-MS-stopped-flow NMR. Apple peel extracts contain two classes of flavonoids, quercetin and
phloretin glycosides, which have antioxidant properties [54]. Quercetein and phloretin have
distinct UV absorbance and MS spectra thus both are used to trigger the stopping of the LC
pump for NMR analysis. As shown with the UV and MS chromatograms (Figure 1.6) of
quercetein, MS is much more selective than UV because multiple compounds with different
masses can have the same UV absorbance. [54].

37
Figure 1.6 UV (280 nm) and m/z 273 [M-H]- used to selectively determine which peaks contain quercetin for further NMR analysis. Reprinted from ref. [54] with permission.
In addition to targeted peak picking, stopped-flow LC-MS-NMR can also be acquired in a time-
slicing mode, whereby an LC chromatogram is analyzed in short intervals. This is especially
useful when analyzing co-eluting compounds, when the retention time is unknown (for non-
targeted analysis) or for analysis of compounds with poor ionization or which have a weak UV
chromopohore [17, 51].

38
The stopped-flow mode of LC-MS-NMR operation received a strong boost in NMR sensitivity,
by the development of cryoflow probes [55]. The performance of the cryoflow probe was
demonstrated in the analysis of metabolites from acetaminophen [55] and the results compared
with results from previously published LC-MS-NMR studies that had utilized a conventional
flow probe [36, 55]. The experiments with the cryoflow probe utilized 40% less material and
allowed for detection of metabolites that had not been previously detected [55]. This study
demonstrated the potential of cryoprobes in LC-MS-NMR not only in detection of low
concentration analytes but in addition, the reduction in NMR analysis time, allowed the detection
of easily degradable samples [55].
The main limitation of stopped-flow LC-MS-NMR is diffusion mediated peak broadening which
can lead to peak-to-peak contamination of closely eluting compounds. This can however be
circumvented by the use of gradient elution in LC rather than isocratic elution. Stopped-flow LC-
MS-NMR also suffers from contamination of the NMR probe, when a low concentration sample
is run immediately after one of high concentration [17].
1.4.2 Loop storage
An alternative to stopped-flow LC-MS-NMR is loop collection of analytes of interest prior to
NMR analysis [17, 54, 56, 57]. This avoids the need to stop the LC pumps for NMR analysis by
directing the LC flow to capillary loops which are matched to the NMR probe active volume[56].
This approach avoids diffusion mediated broadening of the LC peak but still allows for the
improvement of NMR S/N through signal averaging or for 2D experiments. As in the stopped-
flow mode, peak selection for NMR may be done either by MS or by UV. The NMR

39
experiments are usually performed after completion of LC-MS analysis. The loops can also be
stored indefinitely before NMR analysis if the samples are stable and do not degrade [17, 54,
56].
Loop collection can eliminate carry-over contamination of low concentration compounds if they
are analyzed after high-concentration analytes, which is sometimes observed in the stopped-flow.
Figure 1.7 shows an example of two compounds analyzed in the loop collection mode and in the
stopped-flow mode, where their retention time differs by 0.4 minutes. In the stopped-flow mode,
carryover of peak 1 to peak 2 is observed but is not observed in the loop collection mode.
Carryover can be completely eliminated under loop collection because the probe can be flushed
with solvent prior to NMR analysis [17, 18].

40
Figure 1.7 NMR spectra of closely eluting LC peaks (retention time difference 0.4 minutes) under two different working modes, stopped-flow and loop transfer. Reprinted from ref [17] with permission.
The main limitation of loop collection as with both on-flow and stopped-flow LC-MS-NMR, is
that deuterated solvents are still required for separation. Loop collection also requires more
complicated fluidics than stopped-flow mode [17, 18]. However, the loop collection interface
comes standard with most LC-NMR instruments.

41
1.4.3 NMR Signal Enhancement by Fraction Collection combined with Mass-Sensitive
NMR probes.
Another approach of enhancing NMR sensitivity in hyphenated LC-MS-NMR is to concentrate
analytes of interest after the LC separation but prior to NMR analysis. This is often done either
by post-column trapping on guard columns or SPE cartridges, or by fraction collection on tubes.
This is followed by drying and re-suspending of the concentrated LC-peaks into a small volume
of deuterated solvent. Either way, the concentrated analyte is transferred into a small-volume
NMR probe (smaller probes have better mass sensitivity). The most sensitive NMR probes are
cryoprobes and microcoil probes. When fractions are concentrated, the NMR experiment may be
temporarily decoupled or completely offline from the LC-MS experiment. Chapters 2 and 3 of
this dissertation demonstrate the offline coupling of LC-MS and NMR using a microcoil probe.
Post-column trapping of analytes for NMR was first demonstrated by Griffiths et.al using a
guard column for analyte enrichment[58]. This method has evolved and analyte trapping is
widely done on solid-phase extraction (SPE) cartridges (a SPE fraction collector is commercially
available) [59]. Post-column trapping on SPE or guard columns is similar to 2D LC whereby a
mixture is first separated on one column and, as each analyte elutes, it routed to a second
column. For LC-MS-NMR, separation is done on a large diameter column (first LC column)
with a high loading capacity which provides enough material for NMR. The second LC column
i.e. SPE or guard columns, has a smaller diameter columns and it is used to concentrate the
sample for NMR [60-62]. The instrumental set-up for LC-MS-NMR is shown on Figure 1.8.
To ensure components of interest are trapped onto the cartridges, a make-up flow with aqueous
solvent is added to the enrichment columns prior to peak trapping which reduces the eluotropic

42
strength of the mobile phase [59]. A ratio of 3:1 of the make-up flow to the strength of the
mobile phase is typically used. The flow rate of the make-up flow is typically between 2.5-5
mL/minute, these higher flow rates however, lead to high pressure on the trapping cartridge
which has been known to inadvertently elute the analyte from the cartridge [60]. After analyte
trapping, cartridges containing analytes of interest are then dried with nitrogen to remove
residual mobile phase, and finally eluted in deuterated solvents into the NMR probe.
Figure 1.8 Schematic representation of LC-MS-SPE-NMR instrumentation set-up. Reprinted from [59] with permission.

43
LC-MS-SPE-NMR adds another chromatographic step into the analysis, and requires that a
method is developed to ensure efficient trapping of analytes onto the SPE cartridges and the
efficient transfer of trapped analytes into the NMR probe. Efficiency in trapping and elution are
highly dependent on the analyte of interest [60, 62-64]. Analyte trapping is influenced by the
choice of sorbent material, which is a compromise in the analysis of complex mixtures which
have different analytes - a single sorbent might not work for all analytes in a particular mixture
[60, 64]. Clarkson et al. investigated the trapping efficiency of eight SPE phases for 25 model
natural products with a variety of polarities. Overall, the authors found that hydrophobic
compounds were retained on most phases but that hydrophilic and charged compounds were best
retained on polymeric phases made from poly(divenylbenzene) as compared to silica-bonded
phases (e.g –C18) [60]. After choosing the right sorbent material, another consideration in LC-
MS-SPE-NMR is the choice of solvent used to elute and transfer the analyte into the NMR
probe, which is also highly dependent on the analyte of interest. Deuterated methanol and
acetonitrile are the most commonly used solvents for analyte transfer because they are used as
organic mobile phase for reversed-phase LC separation. Thus it is generally assumed that the
analyte will be eluted from the cartridge using acetonitrile or methanol. However, as with the
choice of sorbent material, in the analysis of mixtures, analytes may behave differently.
Additionally, because it is desirable to elute the trapping cartridges with a small volume of
solvent for NMR analysis elution from the cartridge may be incomplete leading to analyte loss
[64, 65].
Fraction collection on well plates or tubes is a cheaper alternative to the use of SPE cartridges. In
contrast to the use of post-column trapping, this mode does not add an analytical step and is the

44
traditional method of doing LC-MS-NMR [66, 67]. Unlike in the LC-MS-SPE-NMR mode,
which has mainly been limited to hydrophobic compounds, concentration by drying allows for
analysis of hydrophilic compounds, because any validated LC method can be used, including
separation using HILIC-LC which is mainly for hydrophilic compounds. In this mode, the NMR
experiment is completely decoupled from the LC-MS (demonstrated in Chapters 2 and 3). Plates
do often contain plasticizer phthalates which can contaminate analytes of interest. Generally,
however, the phthalates can be eliminated by washing plastic-ware with organic solvents prior to
use [68].
Pre-concentration of analytes of interest prior to NMR analysis has several advantages. The main
advantage is that the amount of material for NMR can be increased by repeated collection of the
same analyte through multiple LC injections [61, 69]. As shown in Figure 1.9, multiple trapping
of an analyte of interest reduces the NMR experimental time exponentially with a linear increase
in analyte concentration. In this specific case, by making three repeat trappings, the experimental
time is reduced ten-fold and all the proton resonances are still observable [69]. With the
multiple-trapping strategy, enough material can also be obtained for NMR analysis of low
concentration analytes or for acquisition of 2D NMR experiments necessary for de novo
structural elucidation [59, 61, 64, 65]. It should be noted, however, that when trapping on SPE
cartridges, overloading the SPE cartridges can lead to sample loss. The columns used for LC-
MS-NMR applications are typically 2 mm internal diameter columns which have a maximum
loading capacity of 50 µg.

45
Figure 1.9 LC-MS-SPE-NMR analysis of the glucuronide metabolite of paracetamol. Single trapping on a SPE cartridge require 1024 scans (NS) while with triple trapping, the NMR time is reduced 10-fold. Reprinted from [69] with permission.
Another advantage of these modes of offline LC-MS-NMR is the LC separations may use non-
deuterated solvents which greatly reduces expense and avoids adjusting chromatography for
differences in elution. Importantly for mass spectrometry, the interpretation of mass information
is more straightforward without deuterium exchange, and in NMR, because aprotic deuterated
solvents may be used, exchangeable protons are observed [59, 60, 66, 67].
46
The choice of whether to run the NMR experiment offline or whether to only temporarily
decouple it from the LC-MS experiment depends on the application and on the choice of probe.
When the NMR experiment is completely decoupled from LC-MS, the use of flow probes is no
longer a requirement and tube-based probes can also be used [65]. LC-MS with offline NMR
also allows for each method to be developed independently and performed without compromises.
Another advantage is when NMR is performed offline from LC-MS, the LC-MS results can be
used as a first step in analysis so NMR analysis, which is more time-consuming can be done only
when necessary, and targeted to more specific questions [66, 67].
The advantage of using LC-MS results as a first step in analysis has been realized in natural
product dereplication [66, 67]. Crude extracts are first separated by LC-MS and compounds are
tentatively identified by their molecular weight and fragmentation information. The mass spectra
are then searched against various natural product databases and masses that are not found in the
databases are then targeted for NMR analysis [70]. Unlike dereplication using on-flow LC-MS-
NMR, because pre-concentration LC-MS-NMR methods can utilize more sensitive micro-NMR
probes, lower limits of detection are achieved thus requiring less starting material, or identifying
low-concentration analytes [66, 67]. This mode of LC-MS-NMR can also be used to identify
endogenous metabolites from a metabolomics study whereby the acquired high resolution mass
spectra are searched in databases and then NMR is used as a follow-up for structural
confirmation (Demonstrated in Chapter 3 of this thesis).
The offline LC-MS and NMR approach also has an advantage in that LC-MS and NMR
laboratories are traditionally separate. This is especially useful because although most analytical
labs have a mass spectrometer available, the expense of purchasing an NMR spectrometer

47
restricts their availability and most departments have one or two shared NMR spectrometers.
Separating LC-MS and NMR also separates the expertise required into their respective
established fields of LC-MS and NMR, obviating the requirement for an expert dedicated team
on hyphenated LC-MS-NMR.
1.5 CONCLUSIONS
The use of LC-MS and NMR in the analysis of low concentration analytes in complex matrices
has become more popular in recent years due mainly to the improvements in NMR sensitivity,
through improvements in cryoprobe and microcoil technologies. To take advantage of the
improvements in sensitivity in NMR, it is becoming increasingly clear that NMR should be
employed after exhaustive MS analysis.
The use of offline NMR, (after LC-MS analysis) is demonstrated in the second and third chapters
of this dissertation. In the second chapter, an integrated LC-MS/NMR platform is introduced.
The platform’s merits are discussed in the context of its application in the analysis of cell
cultures. In the third chapter, the need for multiple analytical platforms for unequivocal structural
elucidation is demonstrated in the analysis of endogenous metabolites in human plasma. In that
chapter, offline NMR is combined with electrochemical detection, LC-MS and GC-MS. Chapter
4 highlights the advantages of GC-MS in the elucidation of vitamin D compounds.
1.6 REFERENCES
1. Fenn, J.B., et al., Electrospray ionization for mass spectrometry of large biomolecules. Science (Washington, D. C., 1883-), 1989. 246(Copyright (C) 2012 American Chemical Society (ACS). All Rights Reserved.): p. 64-71.

48
2. Mann, M. and J.B. Fenn. Electrospray mass spectrometry: principles and methods. 1992: Plenum.
3. Yamashita, M. and J.B. Fenn, Application of electrospray mass spectrometry in medicine
and biochemistry. Iyo Masu Kenkyukai Koenshu, 1984. 9(Copyright (C) 2012 American Chemical Society (ACS). All Rights Reserved.): p. 203-6.
4. Trufelli, H., et al., An overview of matrix effects in liquid chromatography-mass
spectrometry. Mass Spectrom Rev, 2011. 30(3): p. 491-509. 5. Bonfiglio, R., et al., The effects of sample preparation methods on the variability of the
electrospray ionization response for model drug compounds. Rapid Commun Mass Spectrom, 1999. 13(12): p. 1175-1185.
6. Pascoe, R., J.P. Foley, and A.I. Gusev, Reduction in matrix-related signal suppression
effects in electrospray ionization mass spectrometry using on-line two-dimensional liquid chromatography. Anal Chem, 2001. 73(24): p. 6014-23.
7. Xian, F., C.L. Hendrickson, and A.G. Marshall, High Resolution Mass Spectrometry.
Analytical Chemistry, 2012. 84(2): p. 708-719. 8. Glish, G.L. and D.J. Burinsky, Hybrid mass spectrometers for tandem mass spectrometry.
J Am Soc Mass Spectrom, 2008. 19(2): p. 161-72. 9. Jonscher, K.R. and J.R. Yates, 3rd, The quadrupole ion trap mass spectrometer--a small
solution to a big challenge. Anal Biochem, 1997. 244(1): p. 1-15. 10. Chen, J., et al., Practical approach for the identification and isomer elucidation of
biomarkers detected in a metabonomic study for the discovery of individuals at risk for diabetes by integrating the chromatographic and mass spectrometric information. Anal Chem, 2008. 80(4): p. 1280-9.
11. Plumb, R.S., et al., UPLC/MS(E); a new approach for generating molecular fragment
information for biomarker structure elucidation. Rapid Commun Mass Spectrom, 2006. 20(13): p. 1989-94.
12. Kind, T. and O. Fiehn, Advances in structure elucidation of small molecules using mass
spectrometry. Bioanal Rev, 2010. 2(1-4): p. 23-60. 13. Xiao, J.F., B. Zhou, and H.W. Ressom, Metabolite identification and quantitation in LC-
MS/MS-based metabolomics. Trends Analyt Chem, 2012. 32: p. 1-14. 14. Claridge, T. and Editor, High-Resolution NMR Techniques in Organic Chemistry. 2000:
Pergamon. 384 pp.

49
15. Akitt, J.W., NMR and Chemistry: An Introduction to Modern NMR Spectroscopy. 3rd Ed.
1994: Tokyo Kagaku Dozin Co., Ltd. 296 pp. 16. Holzgrabe, U., Quantitative NMR spectroscopy in pharmaceutical applications. Prog
Nucl Magn Reson Spectrosc, 2010. 57(2): p. 229-40. 17. Albert, K., On-Line LCV-NMR and Related Techniques. 2002: John Wiley & Sons Ltd.
290 pp. 18. Exarchou, V., et al., LC-NMR coupling technology: recent advancements and
applications in natural products analysis. Magn Reson Chem, 2005. 43(9): p. 681-7. 19. Jayawickrama, D.A. and J.V. Sweedler, Hyphenation of capillary separations with
nuclear magnetic resonance spectroscopy. J Chromatogr A, 2003. 1000(1-2): p. 819-40. 20. Webb, A., Increasing the Sensitivity of Magnetic Resonance Spectroscopy and Imaging.
Analytical Chemistry, 2011. 84(1): p. 9-16. 21. Hoult, D.I. and R.E. Richards, The signal-to-noise ratio of the nuclear magnetic
resonance experiment. Journal of Magnetic Resonance (1969), 1976. 24(1): p. 71-85. 22. Brey, W.W., et al., Design, construction, and validation of a 1-mm triple-resonance high-
temperature-superconducting probe for NMR. Journal of Magnetic Resonance, 2006. 179(2): p. 290-293.
23. Styles, P., et al., A high-resolution NMR probe in which the coil and preamplifier are
cooled with liquid helium. Journal of Magnetic Resonance (1969), 1984. 60(3): p. 397-404.
24. Olson, D.L., et al., High-Resolution Microcoil 1H-NMR for Mass-Limited, Nanoliter-
Volume Samples. Science, 1995. 270(5244): p. 1967-1970. 25. Fratila, R.M. and A.H. Velders, Small-Volume Nuclear Magnetic Resonance
Spectroscopy. Annual Review of Analytical Chemistry, 2011. 4(1): p. 227-249. 26. Ardenkjær-Larsen, J.H., et al., Increase in signal-to-noise ratio of > 10,000 times in
liquid-state NMR. Proceedings of the National Academy of Sciences, 2003. 100(18): p. 10158-10163.
27. Maly, T., et al., Dynamic nuclear polarization at high magnetic fields. J Chem Phys,
2008. 128(5): p. 052211.

50
28. SCARFE, G.B., Quantitative studies on the urinary metabolic fate of 2-chloro-4-trifluoromethylaniline in the rat using 19F-NMR spectroscopy and directly coupled HPLCNMR-MS. Xenobiotica, 1999. 29(1): p. 77-91.
29. Pullen, F.S., et al., ‘On-line’ liquid chromatography/nuclear magnetic resonance mass
spectrometry—a powerful spectroscopic tool for the analysis of mixtures of pharmaceutical interest. Rapid Communications in Mass Spectrometry, 1995. 9(11): p. 1003-1006.
30. Bayer, E., et al., On-line coupling of high-performance liquid chromatography and
nuclear magnetic resonance. Journal of Chromatography A, 1979. 186(0): p. 497-507. 31. Haw, J.F., et al., Direct coupling of a liquid chromatograph to a continuous flow
hydrogen nuclear magnetic resonance detector for analysis of petroleum and synthetic fuels. Analytical Chemistry, 1980. 52(7): p. 1135-1140.
32. Paul A, K., Chemical-shift referencing and resolution stability in gradient LC–NMR
(acetonitrile:water). Journal of Magnetic Resonance, 2009. 199(1): p. 75-87. 33. Paul A, K., Chemical-shift referencing and resolution stability in methanol:water
gradient LC–NMR. Journal of Magnetic Resonance, 2010. 205(1): p. 130-140. 34. Taylor, S.D., et al., Practical aspects of the use of high performance liquid
chromatography combined with simultaneous nuclear magnetic resonance and mass spectrometry. Rapid Communications in Mass Spectrometry, 1998. 12(22): p. 1732-1736.
35. Jayawickrama, D.A., A.M. Wolters, and J.V. Sweedler, Retention characteristics of
protonated mobile phases injected into deuterated mobile phases in capillary liquid chromatography (LC) using on-line nuclear magnetic resonance (NMR) detection. Analyst, 2004. 129(7): p. 629-33.
36. Shockcor, J.P., et al., Combined HPLC, NMR Spectroscopy, and Ion-Trap Mass
Spectrometry with Application to the Detection and Characterization of Xenobiotic and Endogenous Metabolites in Human Urine. Analytical Chemistry, 1996. 68(24): p. 4431-4435.
37. Lindon, J.C., J.K. Nicholson, and I.D. Wilson, Directly coupled HPLC–NMR and HPLC–
NMR–MS in pharmaceutical research and development. Journal of Chromatography B: Biomedical Sciences and Applications, 2000. 748(1): p. 233-258.
38. Louden, D., et al., HPLC Analysis of Ecdysteroids in Plant Extracts Using Superheated
Deuterium Oxide with Multiple On-Line Spectroscopic Analysis (UV, IR, 1H NMR, and MS). Analytical Chemistry, 2001. 74(1): p. 288-294.

51
39. Neuhaus, D., I.M. Ismail, and C.-W. Chung, “FLIPSY”—A New Solvent-Suppression Sequence for Nonexchanging Solutes Offering Improved Integral Accuracy Relative to 1D NOESY. Journal of Magnetic Resonance, Series A, 1996. 118(2): p. 256-263.
40. Smallcombe, S.H., S.L. Patt, and P.A. Keifer, WET Solvent Suppression and Its
Applications to LC NMR and High-Resolution NMR Spectroscopy. Journal of Magnetic Resonance, Series A, 1995. 117(2): p. 295-303.
41. Zheng, G. and W.S. Price, Solvent signal suppression in NMR. Progress in Nuclear
Magnetic Resonance Spectroscopy, 2010. 56(3): p. 267-288. 42. Mallet, C.R., Z. Lu, and J.R. Mazzeo, A study of ion suppression effects in electrospray
ionization from mobile phase additives and solid-phase extracts. Rapid Communications in Mass Spectrometry, 2004. 18(1): p. 49-58.
43. Apffel, A., et al., Enhanced sensitivity for peptide mapping with electrospray liquid
chromatography-mass spectrometry in the presence of signal suppression due to trifluoroacetic acid-containing mobile phases. Journal of Chromatography A, 1995. 712(1): p. 177-190.
44. Sharman, G.J. and I.C. Jones, Critical investigation of coupled liquid chromatography–
NMR spectroscopy in pharmaceutical impurity identification. Magnetic Resonance in Chemistry, 2003. 41(6): p. 448-454.
45. I.D, W., Multiple hyphenation of liquid chromatography with nuclear magnetic
resonance spectroscopy, mass spectrometry and beyond. Journal of Chromatography A, 2000. 892(1–2): p. 315-327.
46. Lacey, M.E., et al., Union of capillary high-performance liquid chromatography and
microcoil nuclear magnetic resonance spectroscopy applied to the separation and identification of terpenoids. Journal of Chromatography A, 2001. 922(1–2): p. 139-149.
47. Duarte, I.F., et al., Application of NMR Spectroscopy and LC-NMR/MS to the
Identification of Carbohydrates in Beer. Journal of Agricultural and Food Chemistry, 2003. 51(17): p. 4847-4852.
48. Blechta, V., et al., High-performance liquid chromatography with nuclear magnetic
resonance detection applied to organosilicon polymers: Part 2: Comparison with other methods. Journal of Chromatography A, 2007. 1145(1–2): p. 175-182.
49. Sandvoss, M., et al., Combination of matrix solid-phase dispersion extraction and direct
on-line liquid chromatography–nuclear magnetic resonance spectroscopy–tandem mass spectrometry as a new efficient approach for the rapid screening of natural products::

52
Application to the total asterosaponin fraction of the starfish Asterias rubens. Journal of Chromatography A, 2001. 917(1–2): p. 75-86.
50. Shockcor, J.P., et al., Application of directly coupled LC–NMR–MS to the structural
elucidation of metabolites of the HIV-1 reverse-transcriptase inhibitor BW935U83. Journal of Chromatography B: Biomedical Sciences and Applications, 2000. 748(1): p. 269-279.
51. Wolfender, J.L., S. Rodriguez, and K. Hostettmann, Liquid chromatography coupled to
mass spectrometry and nuclear magnetic resonance spectroscopy for the screening of plant constituents. Journal of Chromatography A, 1998. 794(1–2): p. 299-316.
52. Feng, W., et al., Structural characterization of the oxidative degradation products of an
antifungal agent SCH 56592 by LC-NMR and LC-MS. J Pharm Biomed Anal, 2001. 25(3-4): p. 545-57.
53. Corcoran, O. and M. Spraul, LC-NMR-MS in drug discovery. Drug Discov Today, 2003.
8(14): p. 624-31. 54. Lommen, A., et al., Application of Directly Coupled HPLC−NMR−MS to the
Identification and Confirmation of Quercetin Glycosides and Phloretin Glycosides in Apple Peel. Analytical Chemistry, 2000. 72(8): p. 1793-1797.
55. Spraul, M., et al., Advancing NMR Sensitivity for LC-NMR-MS Using a Cryoflow Probe:
Application to the Analysis of Acetaminophen Metabolites in Urine. Analytical Chemistry, 2003. 75(6): p. 1536-1541.
56. Graça, G.a., et al., Metabolite Profiling of Human Amniotic Fluid by Hyphenated Nuclear
Magnetic Resonance Spectroscopy. Analytical Chemistry, 2008. 80(15): p. 6085-6092. 57. Markus, G., Hydrophilic interaction chromatography coupled to nuclear magnetic
resonance spectroscopy and mass spectroscopy—A new approach for the separation and identification of extremely polar analytes in bodyfluids. Journal of Chromatography A, 2007. 1156(1–2): p. 87-93.
58. Griffiths, L. and R. Horton, Optimization of LC–NMR. III—Increased signal-to-noise
ratio through column trapping. Magnetic Resonance in Chemistry, 1998. 36(2): p. 104-109.
59. Tang, H., C. Xiao, and Y. Wang, Important roles of the hyphenated HPLC-DAD-MS-
SPE-NMR technique in metabonomics. Magnetic Resonance in Chemistry, 2009. 47(S1): p. S157-S162.

53
60. Clarkson, C., et al., Evaluation of on-line solid-phase extraction parameters for hyphenated, high-performance liquid chromatography–solid-phase extraction–nuclear magnetic resonance applications. Journal of Chromatography A, 2007. 1165(1–2): p. 1-9.
61. Exarchou, V., et al., LC-UV-Solid-Phase Extraction-NMR-MS Combined with a
Cryogenic Flow Probe and Its Application to the Identification of Compounds Present in Greek Oregano. Analytical Chemistry, 2003. 75(22): p. 6288-6294.
62. Lambert, M., et al., HPLC–SPE–NMR hyphenation in natural products research:
optimization of analysis of Croton membranaceus extract. Magnetic Resonance in Chemistry, 2005. 43(9): p. 771-775.
63. Sandvoss, M., et al., HPLC–SPE–NMR in pharmaceutical development: capabilities and
applications. Magnetic Resonance in Chemistry, 2005. 43(9): p. 762-770. 64. Seger, C., et al., LC-DAD-MS/SPE-NMR Hyphenation. A Tool for the Analysis of
Pharmaceutically Used Plant Extracts: Identification of Isobaric Iridoid Glycoside Regioisomers from Harpagophytum procumbens. Analytical Chemistry, 2004. 77(3): p. 878-885.
65. Willmann, J., et al., Characterization of Sphingomyelins in Lipid Extracts Using a
HPLC-MS-Offline-NMR Method. Analytical Chemistry, 2007. 79(11): p. 4188-4191. 66. Lin, Y., et al., Microscale LC-MS-NMR Platform Applied to the Identification of Active
Cyanobacterial Metabolites. Analytical Chemistry, 2008. 80(21): p. 8045-8054. 67. Glauser, G., et al., Optimized liquid chromatography–mass spectrometry approach for
the isolation of minor stress biomarkers in plant extracts and their identification by capillary nuclear magnetic resonance. Journal of Chromatography A, 2008. 1180(1–2): p. 90-98.
68. Keller, B.O., et al., Interferences and contaminants encountered in modern mass
spectrometry. Anal Chim Acta, 2008. 627(1): p. 71-81. 69. Godejohann, M., et al., Characterization of a paracetamol metabolite using on-line LC-
SPE-NMR-MS and a cryogenic NMR probe. Journal of Chromatography A, 2004. 1058(1–2): p. 191-196.
70. Nielsen, K.F., et al., Dereplication of Microbial Natural Products by LC-DAD-TOFMS.
Journal of Natural Products, 2011. 74(11): p. 2338-2348.

54
Chapter 2:
Application of an Integrated LC-UV-MS-NMR Platform to the Identification of Secondary
Metabolites from Cell Cultures: Benzophenanthridine Alkaloids from Elicited Eschscholzia
californica (California poppy) Cell Cultures.
Published in Analytical Methods. Gathungu,M.R.; Oldham, J.; Bird, S.S.; Lee-Parsons, C.; Vouros, P.; Kautz. R. Application of an Integrated LC-UV-MS-NMR Platform to the Identification of Secondary Metabolites from Cell Cultures: Benzophenanthridine Alkaloids from Elicited Eschscholzia Californica (California poppy) cell cultures. Analytical Methods 2012, DOI: 10.1039/C2AY05803K

55
2.1 Introduction
Plant-derived natural products are a rich source of valuable medicines; examples include the
painkiller morphine from the opium poppy, the anti-cancer drugs paclitaxel from the Pacific yew
tree, and vincristine and vinblastine both from the Catharanthus roseus plant [1]. Natural
products often have complex structures with multiple stereochemical centers, making them
challenging to produce economically through chemical synthesis. Therefore, many plant-derived
drugs are still supplied by extracting plant material. These compounds are produced in response
to stress and pathogen attack; therefore their production is highly dependent on the season of
harvest or on environmental conditions, making their production unpredictable. Furthermore, the
supply of the desired natural products may be limited by the availability of the plant,
compounded by slow growth rates or over-harvesting [2, 3].
An alternative method to producing natural products is the use of plant cell and tissue cultures,
which can potentially produce them reproducibly at higher rates and concentrations than in
whole plants. Plant cell and tissue cultures can also produce these compounds in a renewable
and scalable way, unlike harvested plants. Plant cell and tissue cultures have already been
successfully applied to the large-scale and commercial production of at least fourteen
compounds. Paclitaxel production yield in cell cultures is 0.5% by dry weight, compared to only
0.01% by dry weight in harvested yew trees [4, 5].
Plant cell and tissue culture conditions can be manipulated to alter the metabolite profile or to
enhance production of a particular compound (s) by adjusting the media or growth conditions, by
selecting higher-producing cell strains, or by inducing production with biological elicitors (such
as yeast extract) to mimic pathogen attack, even without resorting to genetic engineering [6-8].

56
Arrays of relevant conditions can be explored in small-scale cultures before scale-up to
production levels.
Optimizing metabolite production requires a rapid assay to profile the levels of metabolites in
test cultures, and HPLC –UV is the obvious choice for resolving the complexity of the cell
cultures. It has a throughput commensurate with the typical number of test growths, tens of
samples per day, and can be readily automated for unattended analysis. Sample preparation steps
such as liquid-liquid extraction or solid-phase-extraction (SPE) can pre-extract a family of
compounds, and are parallelizable for moderate throughput, within a time comparable to setting
up cultures [9]. HPLC is also highly repeatable; the retention time of each compound is
reproducible enough to identify it relative to a standard. Where detection of one compound of
interest would be minimally adequate, a full profiling of the family of metabolites would be
valuable to characterize how different inducers or precursors activate and regulate different
products or pathways. When coupled to a UV detector alone, however, it is limited by the
requirement of a chromophore for detection of compounds of interest. Additionally, in order to
structurally identify compounds produced in the cell cultures, LC-UV provides limited
information in the absence of an authentic standard for co-injection [10].
To use HPLC for metabolite profiling, the peaks first need to be structurally identified, typically
by mass spectrometry (MS) and/or nuclear magnetic resonance (NMR). MS provides molecular
weight and, when high resolution instruments are used, the elemental composition of
compounds. In addition, tandem MS (MS/MS), provides structural information from
fragmentation patterns, although again, it is not always possible to identify structural isomers
and, for unequivocal structural identification, authentic standards are required. Tandem MS can

57
also be used to selectively screen for a particular class of compounds in a complex matrix [11].
The high sensitivity of MS (attomole limits of detection) is not always attained due to its
dependence on the ionization efficiency of some compounds or by ion suppression due to matrix
effects in complex samples, although this is less of a problem when nanoelectrospray ionization
is used [12, 13].
It is generally accepted that NMR gives the most definitive structural information. NMR
provides atomic connectivity through chemical shift, and multi-dimensional experiments, It is
non-destructive, and is inherently quantitative [14]. During optimization of cell cultures, NMR
can be used to identify fingerprints of a particular class of compounds. However, NMR is limited
to only the major components as NMR is fundamentally much less sensitive when compared to
MS. Also, NMR requires relatively pure compounds thus necessitating a separation step to avoid
signal overlap [15-17].
Combining LC-MS and NMR is a powerful platform for initial identification of components in
cell/tissue cultures as the two detectors provide complementary information to each other. On-
line LC-NMR (and LC-MS-NMR) methods have found some strong applications, but with on-
flow NMR acquisition times under one minute, the crude spectra at the limits of detection of LC-
NMR (tens of micrograms) restrict its applicability to major components of mixtures. The
sensitivity of on-line LC-NMR is also limited by the large volumes of LC peaks (> 100 uL).
Larger probes have lower mass-sensitivity when compared to smaller probes; LC peak volumes
are usually larger than the probe active volume thus only part of the peak is sampled in NMR
[18, 19].

58
To overcome the conflicting limitations of online LC-MS and NMR, our laboratory developed a
sensitive, integrated HPLC-MS-NMR platform that couples online MS with offline microcoil
NMR for the analysis of mass-limited samples in complex matrices [20]. This platform provides
optimal sensitivity for both MS and NMR by integrating a post-analytical column nanoSplitter
with a microcoil NMR probe. By performing NMR offline from LC-MS, the entire peak volume
can be concentrated into a smaller NMR detector with >10-fold higher mass-sensitivity and
NMR acquisition may be as long as necessary to address questions remaining after review of on-
line LC-MS data.
The nanoSplitter interface was developed a decade ago in the Vouros lab [21], and as shown on
Figure 2.1 uses a concentric split design which preserves chromatographic resolution in LC-MS
[12, 13, 21]. The nanoSplitter provides nanoelectrospray conditions from 4.6 mm LC columns
with most of the LC eluent collected for offline NMR. The 4.6 mm columns are ideal for our
applications because they have a high loading capacity (> 100 ug) thus they provide enough
material for NMR of components below the 1% level. Although these columns require high flow
rates for efficient separation, with the nanoSplitter interface, nanoliter/minute volumes are
directed to the mass spectrometer. These low flow rates reduce signal suppression due to the
efficiency in desolvation from the smaller electrospray droplets and lead to an increase in MS
sensitivity up to 1000-fold when compared to conventional electrospray [12, 13, 21].

59
Figure 2.1 The nanoSplitter interface used in this work provides nanoelectrospray from normal bore (4.6 mm) HPLC columns. The concentric split preserves chromatographic resolution. Reprinted from ref. [21].
For NMR analysis, we use a solenoidal microcoil NMR probe. The microcoil probe has a
reduced coil diameter, which reduces noise leading to increased mass-sensitivity for the limited
material collected from LC when compared to conventional probes (5mm). Noise in NMR is
proportional to the NMR probe’s coil diameter, therefor reducing the coil diameter decreases
background noise which in-turn increases signal. The microcoil probe has a small observe
volume thus analytes of interest are dissolved in a small volume of solvent which increases their
concentration leading to an improvement in the NMR signal. Samples are typically dissolved in
3-10 µl of solvent, depending on the volume of the probe’s observe volume [22, 23].

60
Solenoidal microcoil probes are flow-probes which means that they have a large dead volume
from the probe’s inlet to the probe’s observe volume. Dead volumes from the probe’s inlet can
range from 6 µl to 40 µl when using a sample loader. To facilitate the loading of small volumes
of concentrated sample into a microcoil NMR probe through the large dead volume, we are using
segmented flow sample loading whereby the analyte is carried as a droplet in an immiscible
fluid, which avoids dispersion and can confine all sample into the microcoil probe’s observe
volume [24] (Figure 2.2A). If a miscible solvent is used to push the sample into the NMR probe
through the large dead volume, due to parabolic flow, the sample diffuses into the push solvent
which dilutes the sample (Figure 2.2B).
Zero-Dispersion SFA (Immiscible Carrier)
Carrier Wets Capillary Wall
Observed Volume
1 mm
FIA (miscible carrier)
Parabolic Flow
Observed Volume
1 mm
Taylor Dispersion
A.
B.
Figure 2.2 Comparison of segmented flow sample loading (Immiscible fluorocarbon) and Flow injection sample loading. The sample dye is dissolved in DMSO (aqueous solvent). A. The dye sample is pushed using immiscible fluorocarbon and it remains as a discrete plug. B. The dye sample is pushed with a miscible solvent (DMSO) which leads to dispersion and diffusion

61
2.2 Project Goal
In this work, we demonstrate the applicability of our LC-MS and NMR platform to the typical
case encountered when establishing new cell culture expression system; structural identification
of peaks in an LC chromatogram, given one authentic standard of a metabolite of interest. As a
model system, the method is applied to extracts of E. californica, elicited with a yeast extract to
produce benzophenanthridine alkaloids (BPA). The effects of elicitation on E. california cell
cultures have been previously investigated using HPLC-UV [25] and a pathway activated by
elicitors was proposed in the 1990’s using enzymatic assays [26]. The addition of an elicitor
activates the benzophenanthridine alkaloids (BPA) pathway by stimulating the expression of the
Berberine Bridge Enzyme (BBE) which catalyzes the formation of (S)-scoulerine, the precursor
of BPAs [27, 28]. The BPAs, which include sanguinarine and chelerythrine, are an important
class of biologically active compounds which have been investigated for anti-viral, anti-
inflammatory, anti-cancer, anti-microbial, and anti-fungal properties [29-32] .
The characterization of BPAs from elicited E. californica cell cultures has principally been done
using preparative LC for conventional NMR [33]. Other published work has focused on the
commercially available BPAs sanguinarine and chelerythrine mainly by HPLC-UV and
fluorescence studies [34]. Benzophenanthridine alkaloids from sources other than the E.
Californica have also been reported using mass spectrometry-based methods [35]. Due to the
availability of data compiled from the literature over the last 25 years, this system was deemed
suitable for evaluation of the applicability of the LC-MS-microcoil NMR platform in the
characterization of natural products from elicited cell cultures at the micro-analytical scale. In
this study, elicited E. californica cell cultures were harvested at different time-points and

62
profiled using LC-UV. After identifying the optimal conditions which corresponded to the time-
point with the most diversity, the products were characterized by LC-MS/MS and microcoil
NMR. This study required a total of 200 mg fresh weight (10 mg dry weight) of plant material.
2.3 Materials and Methods
The work in this chapter was done in collaboration with Professor Carolyn Lee-Parsons and her
former graduate student Dr. John T. Oldham. All cell culture experiments were performed by
John Oldham.
Chemicals
LC-MS grade acetonitrile, water, formic acid, HPLC grade methanol and ethanol were purchased
from Fisher Scientific (Pittsburgh, PA). All deuterated solvents were obtained from Cambridge
Isotopes (Andover, MA). Fluorocarbon (FC-43) was purchased from 3M (St. Paul, MN).
Sucrose, 2, 4-dichlorophenoxyacetic acid, L α-napthaleneacetic acid, sodium borohydride and
the benzophenanthridine alkaloids sanguinarine and chelerythrine were purchased from Sigma-
Aldrich (St. Louis, MO).
Dihydrosanguinarine and dihydrochelerythrine were synthesized from the sodium borohydride
reduction of sanguinarine and chelerythrine respectively [33].
Maintenance and Elicitation of Cell Culture
The E. Californica (California poppy) suspension cultures (cell line ELDN01) were a gift from
Dr. Song-Yong Yoon and Dr. Hwa-Young Cho of Pohang Institute of Science and Technology

63
(POSTECH, Pohang, South Korea). Cell Cultures were maintained and elicited using the
previously described method [36].
Cultures were maintained on Linsmaier-Skoog macro- and micronutrients (Caisson Laboratories,
Rexburg, ID) supplemented with 30 g/L sucrose (Sigma), 0.37 mg/L 2,4-dichlorophenoxyacetic
acid (2,4-D, Sigma), and 0.11 mg/L α-napthaleneacetic acid (NAA, Sigma) and adjusted to pH
5.5 with 1 N NaOH. Sub-culturing was performed every 14 days by pipetting 20 mL of culture
(containing 6 mL of packed cells) to 80 mL of fresh media. The cultures were maintained in a
rotary incubator at 120 rpm, 22oC with a 16 hour light photoperiod. Sterile water was added
weekly to compensate for evaporation.
The purified yeast extract (PYE) for eliciting the cell cultures was prepared as described by
Hahn and Albersheim and modified as reported previously [36]. Yeast extract (50 g, Becton-
Dickinson, Sparks, MD) was first dissolved in 200 mL of water in a 1 L Erlenmeyer flask; then
ethanol was added to a final concentration of 80% (v/v). The mixture was sealed with aluminum
and parafilm stored at 4 oC for 4 days. The precipitate settled to the bottom and the supernatant
was discarded without filtering. The gummy precipitate was re-dissolved in 200 mL of water
and precipitated again with ethanol (80% v/v) and stored at 4 oC. The final yeast extract
precipitate was then re-suspended in 200 mL of deionized water, lyophilized for 72 hours, and
stored at -20 oC. The PYE stock solution was prepared by dissolving 1 g of lyophilized PYE in 4
mL of water followed by autoclaving for 30 minutes at 121 oC.
For elicitation experiments, 2,4-D was omitted from the media to maximize alkaloid production.
After growth for 7 days in 2,4-D free media (exponential phase), 25 mL of culture was

64
transferred to a 125 mL Erlenmeyer flask and PYE was added to a final concentration of 40 mg
of PYE / g fresh cell weight (FW). Cells were harvested after 24, 48, 72, and 96 hours by
vacuum filtration, flash frozen in liquid nitrogen, lyophilized for 48 hours, and stored at -20 oC
before further analysis.
Alkaloid Extraction
Alkaloids were extracted in 1 mL of methanol containing 0.2% (v/v) HCl as previously
described [36]. Cell extracts from the four time-points were first sonicated for one hour,
vortexed for 30 minutes, centrifuged for 20 minutes at 13,200 g at 4 oC and finally filtered
through a Millex-FH 0.45 µm syringe filter prior to HPLC analysis and LC-MS analysis.
HPLC Analysis
Chromatographic separations of the 24, 48, 72 and 96 hour cell extracts were performed on an
Agilent (Wilmington, DE) LC system, equipped with a binary pump, an auto-sampler, a diode
array detector (Agilent 1100 series) and a fraction collector (Agilent 1200 series) controlled by
Agilent ChemStation (Version B.02.01) Software. LC separations were performed on a C-18
Phenomenex (Torrance, CA) 3.5 µm, 4.6 x 150 mm, column. Separations were performed at a
flow rate of 1 mL/minute with a linear gradient. The gradient was held for five minutes at 10% A
(Water modified with 0.1 % Formic acid), then increased linearly to 90 % B (Acetonitrile
modified with 0.1 % Formic acid) over 90 minutes. The gradient was then held at 90% B for 5
minutes then dropped down to 10% A. A fifteen minute post-time (At 10% B) was added to
allow the column to equilibrate.

65
LC-MS and the nanoSplitter Interface
Details on the construction and design of the nanoSplitter can be found in previous publications
[12, 13]. The nanoSplitter was used to split the flow from the LC column between the fraction
collector and the MS system. 2% of the flow from the LC was directed to the MS system and
98% of the flow directed to the fraction collector. The flow directed to the nanoSplitter was then
adjusted with a restriction valve so that 200 nL/minute was directed to the MS system and the
rest to waste.
MS detection was performed on a Finnigan LCQ Classic quadrupole ion trap, (San Jose, CA)
operated in positive ion mode. Full scan spectra in the mass range between m/z 100-1000 were
acquired. The source voltage was held at 2 kV and, due to the low flow rates, no sheath or drying
gas was required. Xcalibur software (version 1.3) was used to control the instrument and for
data processing.
The instrument was tuned with sanguinarine and calibrated weekly with a mixture of Ultramark,
MRFA and Caffeine (Thermo Scientific, San Jose, CA) according to the vendor’s specifications.
Fraction collection
The 96 hour extract was chosen for offline high resolution MS and NMR analysis. The LC eluent
was split with a restriction valve and 98% of the flow was directed to the fraction collector via
the diode array detector (the delay volume between the UV and the fraction collector was 71
µL). The fraction collector was operated in a time-dependent mode at five fractions per minute.
The fractions were collected in low retention 96-well PCR plates (Nunc, Rochester, NY) with
200 µl deposited in each well. Wells containing the same peak of interest were pooled together
66
into eppendorf tubes for high resolution MS and NMR analysis. To reduce contamination from
plasticizer phthalates, the PCR plates and eppendorf tubes were soaked for an hour in a tub filled
with 100% methanol before use.
High Resolution MS
For high resolution mass spectrometry, 10 µg of the 96-hour extract was injected on the LC
column and fractions of the peaks of interest collected as described above. Wells containing the
same peak of interest were pooled, and then infused directly without drying into an LTQ-
Orbitrap XP (Thermo Fischer, San Jose, CA) at a flow rate of 10 µl/minute. The mass
spectrometer was operated in the positive ion mode with the source voltage and heated capillary
temperature set to 4.5 kV and 275 oC respectively. Nitrogen was used as a sheath gas.
Full MS and MS/MS spectra of the mass range between m/z 100-500 were acquired for each
chromatographic peak (1-8), at 60k resolution, with 3 microscans. MS/MS analysis, collision
induced dissociation (CID) of the most abundant ion with was performed in the LTQ, and the
fragments ions measured in the Orbitrap with an isolation window of 1 m/z. Fragmentation was
activated for 0.25 ms, normalized collision energy of between 30 and 40% was used for each
analyte. Xcalibur software (Version 2.1) was used to control the instrument and for data
analysis. The fragmentation method was optimized using direct infusion of a solution of
sanguinarine standard at a flow rate of 10 µl/minute
Mass calibration was performed according to the method provided by the instrument vendor. The
mass accuracy of all fractions of interest was below 3 ppm.

67
NMR analysis
NMR analysis was performed on an Inverse Carbon Gradient (ICG) probe (MRM/Protasis,
Savoy, IL). This probe has an observe volume of 2.5 µL. The probe was internally coated with
fluoro-octosilane for use with microdroplet NMR as previously described [24]
All NMR spectra were acquired on a Varian (Palo Alto, CA) Inova spectrometer with an 11.7-T
(500 MHz) actively shielded magnet; the data were processed and analyzed with VNMR version
6.1C software. 1K to 16K scans were acquired for each fraction depending on the concentration
of each sample. Spectra were acquired with a 60 degree tip angle, 1.98 s acquisition times, and
when necessary, pre-saturation of the residual water peak using a saturation delay of 1.5s was
performed. All spectra were collected at a fixed gain of 60 (maximum gain). The spectral width
was set to 8 KHz. Each FID was zero-filled to 64K points, multiplied with an exponential
function (1Hz line broadening), phased manually, and, baseline corrected. Chemical shifts were
referenced to deuterated 4, 4, dimethyl-4-silapentane-1-sulfonic acid (DSS-d6).
Before NMR analysis, the LC solvent of the pooled fractions was dried under vacuum and the
fractions re-suspended in 5 µl deuterated DMSO. The samples were loaded into the probe as
immiscible droplets of water in oil as follows: a 25 µl Hamilton syringe fitted with 10 cm Teflon
tubing (200 µm I.D) with a 4 cm 200 µm capillary stub was filled with the immiscible carrier
fluid FC-43 to the 15 µl mark, 3µl of the sample was then drawn into the syringe, followed by 2
µl of FC-43 and finally deuterated DMSO as a wash plug. The sample was pumped into the
probe with a syringe pump flowing at 2.5 µL/minute. The centering of the sample in the probe’s
active volume was determined by the maximum lock.

68
Compounds 2 and 3, which showed the presence of more than one co-eluting compound in
NMR, were recovered after NMR analysis to ensure they had not degraded during analysis. Each
compound was recovered by back-flushing the microcoil probe with 25 µL of FC-43 (total probe
dead volume is 17µL). Each recovered fraction contained a layer of immiscible fluorocarbon
(bottom layer) and sample. The sample layer (top layer) was pipetted out and dried down under
vacuum. Each recovered fraction was then re-suspended in starting mobile phase (10%
acetonitrile/90% water) then re-injected into the LC-MS system and analyzed using the same
method that was used for separation of the cell extracts.
2.4 Results and Discussion
An overview of the experimental design used in this work is illustrated in Figure 2.3. An
extraction and LC method was developed for the E. californica cell cultures, and several growth
conditions were examined (time-points after elicitation), prior to requesting the expense and
expertise of structural assignment of the chromatogram. A sample was selected with the best
representation of peaks of interest at sufficient level for identification, and analyzed with the
nanoSplitter LC-MS using a unit resolution MS (ion-trap), while collecting time-based fractions.
After review of the LC-MS data, fractions were pooled to recover single-compound peaks.
Each fraction was infused into a high resolution MS (LTQ- Orbitrap XP) to determine the exact
mass and to obtain tandem MS fragmentation (MS/MS). Fractions for NMR were concentrated
by drying off the LC solvent, re-suspended in deuterated dimethyl sulfoxide (DMSO-d6) then
loaded into the microcoil NMR probe using droplet microfluidics. The MS and NMR data from
the micro-analytical platform were then interpreted with reference to analysis of one standard,
sanguinarine (SA). The results were confirmed by comparison with the previously published

69
(large-scale) studies of E. californica [33]. The benzophenanthridine alkaloid (BPA)
chelerythrine was also used as a reference for confirmatory purposes of one of the isolated
compounds. Eight compounds were isolated, down to the 200 ng level, using the nanoSplitter
LC-MS / Microdroplet NMR platform from analytical scale LC separation loading of 50 µg of
extract.

70
Dry, Re-suspend 5 µl DMSO_d6
Elicit Cell culture
Time-Course of Cultures by LC-UV
Initial LC-MS Characterization andFraction Collection
High Resolution MSMS/MS
Microdroplet NMR
Methanol extraction
LC-MS
Structural Identification
Data Interpretation
Pool peak fractions after review of LC-MS
Recover
Re-a
naly
ze
Figure 2.3 The work-flow used in identification of secondary metabolites in cell cultures. After extraction of the metabolites, an LC method is developed that resolves the complexity of the mixture. Different cell culture conditions are surveyed by LC-UV.
71
2.4.1 LC-UV Profiling of Elicited Cell Cultures
Figure 2.4 shows a time-course of alkaloid production after elicitation, monitored by LC-UV.
An overall pattern of five early eluting peaks (1-5) and three late eluting peaks (6-8) is evident.
This pattern reflects the two forms of BPAs: the more polar quaternary benzophenanthridine
alkaloids (QBPAs), represented by peaks 1-5, and the non-polar dihydrobenzophenanthridine
alkaloids (DHBPAs), peaks 6-8 which elute late under reversed phase LC conditions[26]. The
total amount of all the BPAs combined, accumulated roughly linearly from 7 mg/g dry weight
(DW) at 24 hours after elicitation, to 20 mg/g DW at 72 hours as illustrated in Figure 2.4b. The
compounds in peaks 6-8 were observed 24 hours after elicitation and their accumulation
remained relatively constant between 24 and 96 hours after elicitation, while the accumulation of
the compounds in peaks 1-5 increased with time, with the compounds in peaks 2 and 5 not
accumulating to a detectable level until 72 and 48 hours respectively. Longer harvest times are
therefore preferred for accumulation of peaks 1-5. Compounds corresponding to Peaks 6-8 can
be harvested at any time point. In order to identify the compounds produced from a single
chromatogram after elicitation, the 96 hour extract was selected for LC-UV-MS and NMR
analysis because it presented the most balanced presence of the all the peaks in the mixture.

72
3
6
8
1
7
4
Un-elicited0 24 hr 48 hr 72 hr 96 hr
Time After Elicitation
5
10
15
20
25
30
Alk
alo
id p
rod
ucti
on
, m
g/g
dry
weig
ht
24 hours
48 hours
72 hours
1
23
4
5
6
7
8
96 hours
A.
B.
Figure 2.4 Accumulation of benzophenanthridine alkaloids (BPA) with time: (A) LC-UV (283 nm) chromatograms showing a time course of detected metabolites. The 96 hour extract is further analyzed by LC-MS and NMR (B) The bar graph represents the total accumulation of indicated peaks in (A) over time (done in triplicate). The total BPAs accumulate roughly linearly with time from 24 to 96 hours after elicitation

73
2.4.2 Identification of LC Peaks
After initial LC-UV analysis had established that the 96-hour extract presented the most
balanced profile of all of the compounds in the elicited cell culture, this time-point was selected
for more detailed characterization of the individual compounds by LC-MS-microcoil NMR.
Given the high mass-sensitivity of the microcoil NMR (ca. 200 ng as compared to ca. 10 μg for
conventional 5 mm NMR probes) isolation of compounds of interest could be conducted on the
4.6 mm columns as opposed to semi-preparative columns [22, 23]. To prevent column overload
that led to peak-to-peak contamination from peak broadening, the total amount of extract loaded
on the LC column for any given injection was kept under a maximum of 50 µg. In addition,
three repeat injections were pooled to increase the amount of material collected for NMR
analysis of the smaller peaks (Note that tripling the amount of material for NMR reduces the
time requirement for NMR acquisition by nearly 10-fold). Repeating an LC collection only
required an additional two hours per run and could be done overnight under LC automation,
which took considerably less time when compared to NMR analysis time. Fractions that
contained the same chromatographic peak from the different LC runs were then pooled manually
for microcoil NMR analysis. The mass of each peak collected was estimated by UV, to aid in
allocation of the NMR acquisition time to obtain an acceptable (>10) signal-to-noise ratio. For
example, the NMR spectrum for Peak 4 (8 µg) was acquired in an hour, while the spectrum of
Peak 2 (200 ng) required an overnight acquisition.
The LC-UV-MS chromatograms and 1H NMR spectra of the 96-hour extract are shown in
Figure 2.5. All the peaks detected by UV were also observed in the MS chromatogram, although
Peak 6 gave a strong signal in UV but a small peak in MS, presumably due to low ionization

74
efficiency. The correlation of the UV and MS signals was important because the pooling of
fractions for offline analysis (exact mass and NMR) was based on the MS response while
fraction collection was correlated to the UV. At unit mass resolution, some peaks exhibited the
same nominal mass e.g. Compounds 2 and 3 (Table 2.1). All the LC peaks above a 0.1%
threshold in the UV chromatograms were targeted for offline high resolution MS and NMR
analysis. High resolution MS was used to determine elemental composition and for MS/MS
analysis as a first step towards structural assignment of the BPAs. MS/MS showed various
similar neutral losses from the components of the chromatogram, an indication that the isolated
compounds were related. Exact mass MS/MS results also established the elemental composition
of the fragment ions, pin-pointing the chemical moiety present in the BPAs as summarized in
Table 1. The BPAs have the same core structure and differ only in functional group and
substitution patterns around the four fused rings. NMR was used to determine the site of
modification and to confirm MS results; spectral differences were mainly in the aromatic region
patterns (Figure 2.5B)

75
1
2
3
4
5
6
7
8
min30 40 50 60 70 80
0
20
40
60
80
1
2
35
6
4
87
UV (283nm)
MS (TIC)
MicroNMR
LC-UV-MS
Figure 2.5 LC-UV-MS-NMR of the 96 hour time-point E. Californica extract: (Top) UV (283nm) and MS chromatograms correlate to within 0.1 minutes (MS chromatogram is shifted to the right for clarity). The LC peaks labeled 1-8 were fractionated for offline high resolution MS, MS/MS and, microcoil NMR analysis. (Bottom) Microcoil 1H NMR spectra of the aromatic region (6.5 to 9 ppm) of the LC-UV Peaks 1-8. The mass of collected analytes varied from 200 ng (2) to 8 ug ( 4).

76
MS and NMR Features of Sanguinarine (SA)
When establishing a cell culture expression system, there is usually at least one well-
characterized compound of interest. The MS and NMR data (Figure 2.6) of the standard
sanguinarine (SA) were used as a reference to assist in the interpretation of the MS and NMR
data of the LC-UV peaks in the 96 hour cell extract. Because the ESI mass spectrum was
obtained from an acidic solution which put SA into the positively charged quaternary nitrogen
form, its peak of highest mass corresponded to the actual molecular mass, M+, and occurred at an
even mass, m/z 332, even though SA contains a single nitrogen atom. The MS/MS spectrum of
SA exhibited fragment ions at m/z 317 [M – CH3]+, m/z 304 [M – CO] + and at m/z 274 [M -
(CH2O + CO)] +. Although the acidic form of SA was observed under positive electrospray
conditions, in the 1H NMR analysis of the LC-fractionated SA, the neutral form (pseudo-base)
was observed (Figure 2.6C). This is in accord with the previously published results showing that
QBPAs like SA exist in two forms, which are dependent on the pH of the solution [37] (Figure
2.6B). The aromatic region of the 1H spectrum of SA-pseudo-base (Figure 2.6C ) exhibited six
protons, two as singlets and four as ortho-coupled doublets (J=8.8 Hz). In addition, the 1H
spectrum exhibited a methyl singlet at 2.8 ppm from the N-CH3 group and resonances between
6.1 and 6.15 ppm from the methylenedioxy groups at C-2 and C-7. In the subsequent evaluation
of the NMR spectra of Peaks 1-8 discussed below, the NMR resonances of the basic form of SA
are used as a reference.

77
1 2-CH2
N-CH34
67-CH2
91011 12DMSO
332 ([M]+)
220 240 260 280 300 320 340 360m/z
05
101520253035404550556065707580859095
100R
ela
tive
Ab
undan
ce
304.0961
333.0941
274.0860
317.0677246.0912
278.0809
218.0963
301.0734
232.0526
332.0917
317
304
274
-CH
3
-CO
-CH
2O
+C
O
m/z
1
45
6
9
11
A.
B.
C.
Figure 2.6 (A) MS/MS spectrum of Sanguinarine (SA). (B) The conversion of quaternary benzophenanthridine alkaloids to the pseudo-base from the acidic form (left) in LC-MS to the pseudo-base neutral form (right) in neutral solution. (C) 1H NMR spectrum (δ 5-9 (left), δ 2.0-3.0 (right)) of sangunarine pseudo-base, with NMR peak assignments.

78
Observed Nominal Mass Observed Exact Mass Major Fragment Ions Calculated Exact Mass
Peak 1 332 332.0909 [M]+ 317.0680, 304.0964, 274.0861 332.0912 Sanguinarine
Peak 2 348 348.0858 [M]+ 333.0626, 320.0910, 290.0808 348.0861 10‐hydrosanguinarinea
Peak 3 348 348.1216 [M]+ 333.0982, 315.0890, 304.0960 348.1225 Chelerythrineb
Peak 4 362 362.1015 [M]+ 347.0783, 334.1074 362.1018 Chelirubine
Peak 5 392 392.1123 [M]+ 377.1130, 364.1353 392.1123 Marcapine
Peak 6 350 350.1374 [M+H]+ 335.1140, 319.1193 350.1387 Dihydrochelerythine
Peak 7 364 364.1165 [M+H]+ 349.0920, 333.0987 364.1179 Dihydrochelirubine
Peak 8 334 334.1060 [M+H]+ 319.0826, 304.0960, 276.1013 334.1074 Dihydrosanguinarine
Table 2.1 The nominal mass, exact mass and major fragments ions of compounds 1-8. The exact mass error was below 5 ppm for all the peaks.
a,b Compounds 2 and 3 were tentatively identified as 10-hydrosanguniarine and chelerythrine based on their MS and MS/MS results

79
The first LC peak, 1 (m/z 332, [M]+) was assigned as SA on the basis of the comparison of its
MS and 1H NMR spectra with a reference sample of SA. In addition under the same
chromatographic conditions, its retention time was the same as that of SA. Furthermore, co-
injection with sanguinarine yielded a single peak.
The second and the third LC peaks, 2 and 3 exhibited the same nominal masses, (m/z 348, [M] +)
but different exact mass (elemental composition) and MS/MS spectra. The MS/MS spectrum of
compound 2, (results summarized on Table 2.1) exhibited neutral losses similar to SA with
fragment ions at m/z 333 [M - CH3] +, m/z 320 [M - CO] +, and m/z 290 [M - (CH2O + CO)]+, an
indication that the two compounds were structurally related. Its exact mass suggested that a
hydroxyl group had been added to SA. The MS/MS spectrum of peak 3 (Figure 2.7A) on the
other hand, exhibited fragment ions at m/z 333 [M - CH3] +, m/z 318 [M - 2CH3], 315 [M-(2CH3
+ 2H)]+, m/z 304 [M - (CO + CH3 + H] +].

80
T
260 270 280 290 300 310 320 330 340 350 360m/z
0
5
10
15
20
25
30
35
40
45
50
55
60
65
70
75
80
85
90
95
100
Rel
ativ
e Ab
unda
nce
333.0982
318.0749
348.1216
304.0960 346.0698
315.0883
278.0805262.0856 302.0805274.0857 280.0598 350.2579343.2876
MS/MS [3]
[M]+
Exact mass: 348.1230
A.
3
CHE
B.
Figure 2.7 (A) The MS/MS spectrum of Fraction 3. (B) The comparison of the 1H NMR spectrum of fraction 3 and chelerythrine (CHE) shows that fraction 3 in addition to CHE, contains a co-eluting compound.

81
To identify the differences and similarities of 2 and 3 to SA, their 1H spectra were acquired.
However, although the two compounds exhibited individual peaks in LC, their 1H NMR spectra
suggested that the chromatographically isolated peaks contained more than one co-eluting
species. To ensure that the extra signals observed in 1H NMR were due to co-eluting species and
not from degradation, after 1H NMR acquisition each of the two compounds was recovered and
re-injected into the LC-MS system, and each eluted as a single peak at the retention time
observed during fractionation. The two compounds were therefore tentatively identified by their
MS and MS/MS results and in the case of compound 3 by comparison with the BPA
chelerythrine (CHE) which is commercially available (Figure 2.7B). Co-injection of 3 with CHE
yielded a single peak and the MS and MS/MS spectra of 3 and CHE were identical. Compound 2
was tentatively identified as 10-hydrosanguinarine based on its exact mass and MS/MS spectra.
The molecular mass of the fourth LC peak, 4 (m/z 362, [M]+) was 30 mass units above that of
SA, consistent with the addition of a methoxy group to SA, as also confirmed by exact mass
measurements. The MS/MS spectrum of 4 exhibited similar neutral losses as sanguinarine, of [M
- CH3]+ and [M – CO]+, an indication of some structural similarity to SA. The presence of the
methoxy group was supported by the presence of a three-proton singlet at ~ 3.9 ppm in its 1H
spectrum. To determine the site of the methoxy substitution the 1H NMR spectra of 4 and SA
were compared. The presence of five protons (two ortho-coupled doublets and three singlets) is
evident in the aromatic region of the 1H NMR spectrum of 4. This compares with six protons in
SA, seen as four ortho-coupled doublets and two singlets. Specifically, in SA, H-9 is an ortho-
coupled doublet but is found as a singlet in 4, and is shifted upfield to 6.98 ppm from 7.02 ppm
in SA. In addition, H-11, which is the most de-shielded proton in SA is shifted downfield to 8.34
82
ppm in 4 from 7.83 ppm in SA, and this can be attributed to the through- space interactions of
that proton with the methoxy group. Compound 4 can thus be identified as chelirubine. Our
assignment of compound 4 as chelirubine is in agreement with previously published results [37].
The mass spectrum of LC peak 5, with a molecular mass (m/z 392, [M]+ ) which is 60 mass units
above that of SA, suggested the addition of two methoxy groups to SA. The MS/MS spectrum of
5 also exhibited the same neutral losses (Table 2.1) as SA and analytes 2 and 4, an indication
that they shared common functional groups. The addition of the two methoxy groups to 5 was
confirmed by its 1H spectrum which showed methoxy singlets at 3.7 and 3.9 ppm. The aromatic
region of the 1H NMR spectrum of 5 exhibited four one-proton singlets; the two singlets at 7.4
ppm (H-1) and 7.6 ppm (H-4) which were also observed in SA; H-9 and H-11 were singlets in 5,
but were doublets in SA, an indication that C-10 and C-12 were the sites of substitution. This
conclusion is further supported by the absence of the doublets from H-10 and H-12 seen in SA.
The pattern of resonances in the aromatic region of compound 5, matches previously published
1H results of marcapine thus 5 is assigned as Marcapine [33].
Characterization of late eluting LC Peaks 6-8
In comparing the MS, MS/MS and 1H NMR features of the early eluting compounds, 1-5, and
the late eluting cluster, 6-8, several distinct features as well as similarities became apparent.
Some key differences between peaks in the two clusters of compounds is observed in their
respective 1H NMR spectra as illustrated in Figure 2.8, which shows an expansion from the 1H
NMR spectra of compounds 4 and 7. Although the aromatic regions of the NMR spectra are
similar, a methine proton signal is observed at ~5.3 ppm (H-6) in the spectrum of 4. This signal

83
is shifted upfield to ~4.05 ppm and integrates to two protons, reflecting the presence of a
methylene group. A similar shift of H-6 is observed in all the other late-eluting peaks. This
structural change is also reflected in the mass spectral results. While both sets of compounds
exhibited similar neutral loss fragments in their MS/MS spectra, the MS peak representative of
the molecular mass of each compound differed in that while the highest mass ion in the spectra
of 1-5 corresponded to [M]+, the ESI spectra of the late eluting peaks produced the protonated
adduct ([M + H]+). As discussed earlier for SA, this is because the early eluting peaks (QBPAs)
are already charged in solution while the late eluting peaks (DHBPAs) elute in their neutral form.
These general features were observed in the analysis of 6 - 8 and along with data from the
reference sample of SA were used in their structural characterization as discussed below.

84
O-CH3 (C-10)
O-CH3 (C-10)
H (C-6)
2-H (C-6)
4
7
Figure 2.8: 1H NMR spectra (δ 3.8- 6.6) of compounds 4 (top) and 7 (bottom) representative of the common difference between the early eluting compounds (1-5) and the late eluting compounds (6-8). The singlet (C-6, one proton) at δ 5.3 in 4, is shifted upfied to δ 4.1 (C-6, two protons) in 7. The early-eluting compounds are the quartenary benzophenanthridine alkaloids which are converted to their dihydro derivatives (6-8) by the enzyme dihydrobenzophenanthridine alkaloid oxidase. Compound 7 is the dihydro derivative of compound 4. The neutral (pseudo-base) form of 4 shown in the figure is the form in deuterated DMSO for NMR.
The NMR spectrum of the sixth LC peak 6, (m/z 350, [M+H] +), exhibited a number of
similarities to that of sanguinarine in its aromatic region where it shared the same six protons,
four as ortho-coupled doublets (J ~8 Hz) and two as singlets, but differed by the additional

85
presence of two methoxy singlets at ~3.7 ppm and at ~ 3.9 ppm. In addition, unlike SA which
had two methylenedioxy groups, compound 6 had one methylenedioxy group as shown by the
singlet at ~6.1 ppm. Accordingly, 6 was assigned the structure of dihydrochelerythrine. This
assignment was further supported by the reduction of the commercially available standard
chelerythrine with NaBH4 to its dihydro derivative [33], and when the dihydro derivative was
analyzed by MS and NMR, its MS and NMR results matched those of 6. Also, LC co-injection
of isolated 6 and dihydrochelerythrine yielded a single peak.
As discussed above, the 1H NMR spectra of compounds 7 (m/z 364, [M+H]+) and 4, both
exhibited five protons in the aromatic region, two ortho-coupled doublets and three singlets. 7
also exhibited a methoxy singlet at ~3.9 ppm. The main difference in their 1H spectra was in the
two proton singlet at ~ 4.1 ppm in 7, which appeared as a one proton singlet in 4, indicating that
7 had two protons at C-6 unlike 4 which had one proton. Peak 7 was therefore assigned as the
structure of dihydrochelirubine, the dihydro derivative of 4. This was further confirmed by the
NaBH4 reduction of 4 to its dihydro derivative and comparison the 1H NMR results with those of
7.
Finally, the 1H NMR spectrum of the eighth LC peak, 8 (m/z 334, [M+H]+) exhibited the same
pattern of resonances in its aromatic region as SA, with six protons in its aromatic region, two as
singlets and four as ortho-coupled doublets. Its 1H spectrum differed from that of SA, in that the
methine resonance at 5.5 ppm in SA was shifted upfield to 4.1 ppm and was indicative of a two-
proton singlet. Compound 8 was therefore identified as dihydrosanguinarine and the assignment
is further supported by the NaBH4 reduction of sanguinarine to its dihydro derivative. The MS
and the 1H NMR spectra of the reduced SA derivative, matched the results from compound 8.

86
In summary, the complementary use of MS and NMR identified six of the eight compounds in
the 96 hour extract, and exact mass measurements aided in differentiating compounds of the
same nominal mass (Compounds 2 and 3). Crucial for the complete structural characterization of
the compounds in the cell culture was the availability of a reference compound in this case
sanguinarine, which contained the core structure of most of the likely products. The MS/MS data
brought out the similarities of the profiled compounds as they all originate from
dihydrosanguinarine, with the exception of chelerythrine and dihydrochelerythrine which are
derived directly from S-scoulerine, (Figure 2.9). The 1H NMR spectrum of sanguinarine
provided a reference for identification of the exact site(s) of modification of the core structure in
most of the isolated metabolites, thus removing the requirement for more time consuming 2D-
NMR experiments. In principle, after their full characterization, the isolated compounds can be
used as standards in other studies either for method development or in analysis of cell cultures
producing related compounds. The results from our microanalytical platform are consistent with
data obtained from previous studies carried out at the preparative scale using 400-fold larger
amounts of sample [33].
As shown in Figure 2.9 E. californica cell cultures produce twelve compounds compared to our
detection of eight in the cell cultures employed in the present work. It is conceivable that the
remaining four could either be at low levels, below the detection limit of our analytical platform
or these compounds do not accumulate under the specific conditions employed in our cell
cultures. Additionally, the 1H NMR spectra of 2 and 3 showed the presence of more than one co-
eluting compounds. It is possible to improve the selectivity of our LC method to resolve the
other compounds in the two peaks either by changing the mobile phase or by changing the

87
column chemistry. It should be noted however that changing selectivity in LC might change the
elution order and selectivity of the other peaks detected by our method.

88
Tyrosine(S)-Reticuline
(S)-Scoulerine
DHBO
DHBO DHBODHBO
DHBODHBO
1 234 5
6 78 9 10
11
12
1 Sanguinarine
2 10-hydrosanguinarine
3 Chelerythrine
4 Chelirubine
5 Marcapine
6 Dihydrochelerythrine
7 Dihydrohelirubine
8 Dihydrosanguinarine
910-hydroxydihydrosanguinarine
10 12-Hydroxychelirubine
11 12-Hydroxydihydrochelirubine
12 Dihydromarcapine
Figure 2.9 The benzophenanthridine alkaloids pathway that is activated when E. Californica cell cultures are elicited. The compounds labeled 1-8 (names on the table) were detected in the work presented. Compound 9-12 were not detected in our cell culture experiments. Adapted from [26] .

89
The data presented above demonstrates the applicability of a novel integrated LC-UV-MS-
microNMR platform for the identification of compounds from a plant cell culture at the
analytical scale. The platform has a large dynamic range as demonstrated in the analysis of the E.
Californica cell cultures, where structure characterization was carried out in elicited cell cultures
containing metabolites ranging from as little as 200 ng to as high as 8 µg. With these
identifications, LC-UV serves as a rapid method for profiling metabolites produced in cell
cultures under different elicitation and growth conditions. For final structure characterization,
this analytical approach allows for the use of each detector at its optimal sensitivity by having
NMR offline from MS, so each method is applied independently without compromising its
performance. Having LC-MS offline from NMR also separates the expertise required into the
established fields of LC-MS and NMR, obviating the requirement for an expert team on
hyphenated LC-MS-NMR. The simultaneous use of MS and UV as a guide for detection and
collection of peaks of interest for offline NMR analysis is advantageous because it can be
extended to the analysis of LC peaks that can be monitored by either detector regardless of
whether they contain a UV chromophore or not. The non-destructive nature of NMR is valuable
in that compounds of interest can be recovered for re-injection as demonstrated with compounds
2 and 3 or for further analysis on other analytical platforms.
2.5 Conclusion
While the focus of the work presented was in demonstrating the utility of the LC-UV-MS-offline
microNMR analytical platform in the identification of the compounds in the E. californica cell
culture, it should be noted that its general applicability extends to a broader spectrum of

90
preliminary screening and optimization of bioengineered cultures and, indeed, to identification of
natural products or drug metabolites in general. We have illustrated LC-MS+NMR using our
platform of concentrating collected fractions by drying for later analysis by microcoil NMR, but
these same advantages can be gained with other forms of fraction collection, such as SPE
cartridges [38], followed by offline NMR analysis using any of a variety of highly sensitive
NMR probes available, such as micro-cryoprobes with 1 mm or 1.7 mm tubes [39].
2.6 References
1. Kinghorn, A.D. and E.-K. Seo, Cultivating the pharmacopoeia. CHEMTECH, 1996. 26(Copyright (C) 2011 American Chemical Society (ACS). All Rights Reserved.): p. 46-54.
2. Hartmann, T., Plant-derived secondary metabolites as defensive chemicals in herbivorous insects: a case study in chemical ecology. Planta, 2004. 219(1): p. 1-4.
3. Williams, D.H., et al., Why Are Secondary Metabolites (Natural Products) Biosynthesized? Journal of Natural Products, 1989. 52(6): p. 1189-1208.
4. Leonard, E., et al., Opportunities in metabolic engineering to facilitate scalable alkaloid production. Nat Chem Biol, 2009. 5(5): p. 292-300.
5. Kutney, J.P., Plant cell culture combined with chemistry: a powerful route to complex natural products. Acc. Chem. Res., 1993. 26(Copyright (C) 2011 American Chemical Society (ACS). All Rights Reserved.): p. 559-66.
6. Odjakova, M. and C. Hadjiivanova, The complexity of pathogen defense in plants. Bulg. J. Plant Physiol., 2001. 27(Copyright (C) 2011 American Chemical Society (ACS). All Rights Reserved.): p. 101-109.
7. Angelova, Z., S. Georgiev, and W. Roos, Elicitation of plants. Biotechnol. Biotechnol. Equip., 2006. 20(Copyright (C) 2011 American Chemical Society (ACS). All Rights Reserved.): p. 72-83.
8. Hou, P. and S. Guo, Fungal elicitation to plants and its application in natural medicines. Zhongcaoyao, 2002. 33(Copyright (C) 2011 American Chemical Society (ACS). All Rights Reserved.): p. 855-857.

91
9. Oniszczuk, A. and A. Hawryl, Sample preparation of plant material. Chromatogr. Sci. Ser., 2011. 102(Copyright (C) 2011 American Chemical Society (ACS). All Rights Reserved.): p. 107-149.
10. Markowski, W. and M. Waksmundzka-Hajnos, Photodiode array (PDA) and other detection methods in HPLC of plant metabolites. Chromatogr. Sci. Ser., 2011. 102(Copyright (C) 2011 American Chemical Society (ACS). All Rights Reserved.): p. 331-350.
11. Li, S., et al., Determination of paclitaxel and other six taxoids in Taxus species by high-performance liquid chromatography-tandem mass spectrometry. J Pharm Biomed Anal, 2009. 49(1): p. 81-9.
12. Andrews, C.L., et al., Improved liquid chromatography-mass spectrometry performance in quantitative analysis using a nanosplitter interface. J Chromatogr A, 2004. 1053(1-2): p. 151-9.
13. Andrews, C.L., et al., Incorporation of a nanosplitter interface into an LC-MS-RD system to facilitate drug metabolism studies. J Mass Spectrom, 2006. 41(1): p. 43-9.
14. Claridge, T. and Editor, High-Resolution NMR Techniques in Organic Chemistry. 2000: Pergamon. 384 pp.
15. Fraccaroli, M., et al., Pre-analytical method for metabolic profiling of plant cell cultures of Passiflora garckei. Biotechnol Lett, 2008. 30(11): p. 2031-6.
16. Zulak, K.G., et al., Quantitative 1H NMR metabolomics reveals extensive metabolic reprogramming of primary and secondary metabolism in elicitor-treated opium poppy cell cultures. BMC Plant Biol, 2008. 8: p. 5.
17. Hagel, J.M., et al., Quantitative 1H nuclear magnetic resonance metabolite profiling as a functional genomics platform to investigate alkaloid biosynthesis in opium poppy. Plant Physiol, 2008. 147(4): p. 1805-21.
18. Rehbein, J., et al., Characterization of bixin by LC-MS and LC-NMR. J. Sep. Sci., 2007. 30(Copyright (C) 2011 American Chemical Society (ACS). All Rights Reserved.): p. 2382-2390.
19. Albert, K., On-Line LCV-NMR and Related Techniques. 2002: John Wiley & Sons Ltd. 290 pp.
20. Lin, Y., et al., Microscale LC-MS-NMR platform applied to the identification of active cyanobacterial metabolites. Anal Chem, 2008. 80(21): p. 8045-54.
21. Gangl, E.T., et al., Reduction of signal suppression effects in ESI-MS using a nanosplitting device. Anal Chem, 2001. 73(23): p. 5635-44.

92
22. Olson, D.L., et al., High-resolution microcoil 1H-NMR for mass-limited, nanoliter-volume samples. Science (Washington, D. C.), 1995. 270(Copyright (C) 2011 American Chemical Society (ACS). All Rights Reserved.): p. 1967-70.
23. Olson, D.L., M.E. Lacey, and J.V. Sweedler, High-Resolution Microcoil NMR for Analysis of Mass-Limited, Nanoliter Samples. Anal. Chem., 1998. 70(Copyright (C) 2011 American Chemical Society (ACS). All Rights Reserved.): p. 645-650.
24. Kautz, R.A., W.K. Goetzinger, and B.L. Karger, High-throughput microcoil NMR of compound libraries using zero-dispersion segmented flow analysis. J Comb Chem, 2005. 7(1): p. 14-20.
25. Collinge, M.A. and P.E. Brodelius, Dynamics of benzophenanthridine alkaloid production in suspension cultures of Eschscholtzia californica after treatment with a yeast elicitor. Phytochemistry, 1989. 28(Copyright (C) 2011 American Chemical Society (ACS). All Rights Reserved.): p. 1101-4.
26. Zenk, M.H., The formation of benzophenanthridine alkaloids. Pure Appl. Chem., 1994. 66(Copyright (C) 2011 American Chemical Society (ACS). All Rights Reserved.): p. 2023-8.
27. Cho, H.Y., et al., Differential induction of protein expression and benzophenanthridine alkaloid accumulation in Eschscholtzia californica suspension cultures by methyl jasmonate and yeast extract. J Microbiol Biotechnol, 2008. 18(2): p. 255-62.
28. Cho, H.-Y., et al., Synergistic effects of sequential treatment with methyl jasmonate, salicylic acid and yeast extract on benzophenanthridine alkaloid accumulation and protein expression in Eschscholtzia californica suspension cultures. J Biotechnol, 2008. 135(Copyright (C) 2011 U.S. National Library of Medicine.): p. 117-22.
29. Eley, B.M., Antibacterial agents in the control of supragingival plaque--a review. Br Dent J, 1999. 186(6): p. 286-96.
30. Malikova, J., et al., The effect of chelerythrine on cell growth, apoptosis, and cell cycle in human normal and cancer cells in comparison with sanguinarine. Cell Biol Toxicol, 2006. 22(6): p. 439-53.
31. Malikova, J., A. Zdarilova, and A. Hlobilkova, Effects of sanguinarine and chelerythrine on the cell cycle and apoptosis. Biomed Pap Med Fac Univ Palacky Olomouc Czech Repub, 2006. 150(1): p. 5-12.
32. Adhami, V.M., et al., Sanguinarine causes cell cycle blockade and apoptosis of human prostate carcinoma cells via modulation of cyclin kinase inhibitor-cyclin-cyclin-dependent kinase machinery. Mol Cancer Ther, 2004. 3(8): p. 933-40.

93
33. Tanahashi, T. and M.H. Zenk, New hydroxylated benzo[c]phenanthridine alkaloids from Eschscholtzia californica cell suspension cultures. J Nat Prod, 1990. 53(Copyright (C) 2011 U.S. National Library of Medicine.): p. 579-86.
34. Klvana, M., et al., Analysis of secondary metabolites from eschscholtzia californica by high-performance liquid chromatography. Phytochem Anal, 2006. 17(4): p. 236-42.
35. Perez Gutierrez, R.M., et al., Identification of benzophenanthridine alkaloids from Bocconia arborea by gas chromatography-mass spectrometry. Phytochem Anal, 2002. 13(3): p. 177-80.
36. Oldham, J.T., et al., Shotgun proteomic analysis of yeast-elicited California poppy (Eschscholzia californica) suspension cultures producing enhanced levels of benzophenanthridine alkaloids. J Proteome Res, 2010. 9(9): p. 4337-45.
37. Seckarova, P., et al., Structural studies of benzophenanthridine alkaloid free bases by NMR spectroscopy. Magn. Reson. Chem., 2002. 40(Copyright (C) 2011 American Chemical Society (ACS). All Rights Reserved.): p. 147-152.
38. Seger, C., et al., LC-DAD-MS/SPE-NMR Hyphenation. A Tool for the Analysis of Pharmaceutically Used Plant Extracts: Identification of Isobaric Iridoid Glycoside Regioisomers from Harpagophytum procumbens. Analytical Chemistry, 2004. 77(3): p. 878-885.
39. Hilton, B.D. and G.E. Martin, Investigation of the Experimental Limits of Small-Sample Heteronuclear 2D NMR. Journal of Natural Products, 2010. 73(9): p. 1465-1469.

94
Chapter 3:
Identification of Metabolites Affected by Diet using Electrochemical Detection, Mass
Spectrometry, and Microcoil NMR

95 3.1 Introduction
Metabolomics is a comprehensive study of all metabolites (low molecular weight compounds) in
a biological system. A typical metabolomics study has two major goals: to identify differences in
metabolite concentration between two states or metabolite profiling. These differences can
subsequently be used as indicators for a particular state [1-4]. The second goal is to structurally
characterize the biomarkers identified in the profiling experiments. Structural characterization of
metabolite is essential because it helps in pin-pointing the exact metabolic pathways affected, by,
(e.g. disease) which would be important in designing therapeutics and would also aid in
understanding disease biochemistry [3].
.Dietary choices are known to have an effect on the development of certain diseases. For
example, a diet rich in fats, red meats etc., has been associated with occurrence of diseases
including cancer and heart disease [5, 6]. On the other hand, diets rich in vegetables or of low
caloric composition are known to protect against disease and to even retard aging [7-9]. Because
diet is known to alter metabolism, metabolomics studies involving different diets can be used to
provide an insight into the biochemical alterations that occur due to changes in dietary intake and
the relationship of diet to disease development [8-10].
Metabolomics studies and most especially metabolite identification is complicated by the
diversity of the metabolome, in both chemical properties and in concentration. Unlike other
‘omics’ studies like genomics or proteomics which profile compounds made from the same
building blocks (e.g. four nucleotide bases in genomics and the twenty amino acids for
proteomics) metabolites are products from all cellular processes creating a great chemical
diversity, and therefore requires multiple analytical platforms for their detection and

96 identification [11, 12]. Also, the concentration of different metabolites encompasses a wide
range, from picomolar to millimolar quantities which therefore require analytical platforms that
are both highly sensitive and have a large dynamic range to ensure thorough characterization of
the sample. Analysis is also limited by the complexity of biofluids (e.g. plasma, serum) used for
metabolomics studies. For de novo identification of metabolites, extensive sample preparation to
reduce a sample’s complexity combined with structurally informative analytical platforms is
required [13].
Mass spectrometry (MS) based methods (GC-MS and LC-MS) and NMR are the two main
analytical techniques used in metabolite identification [14]. GC-MS is a well-established
analytical technique and is particularly useful for structural characterization of volatile and semi-
volatile compounds. GC-MS normally utilizes electron impact (EI) which yields predictable and
reproducible mass spectral fragmentation patterns. The predictability and reproducibility of EI
mass spectra allows libraries of reference spectra to be consulted to aid in structural assignment
and confirmation [15, 16]. GC-MS however, is limited to the analysis of volatile and semi-
volatile compounds which require derivatization before analysis. Derivatization can complicate
analysis if analytes are only partially derivatized which can lead to observation of multiple peaks
for the same analyte [17]. Another limitation in the use of GC-MS is that EI is a hard ionization
method, and the molecular ion may not always be detected, thus it is may be difficult to assign
structures especially for unknowns [15, 16, 18]
In recent years, LC-MS has become perhaps the most widely used technique for metabolomics
profiling and identification. This is because LC-MS is capable of analyzing a wide range of
chemically diverse compounds with high sensitivity, and the LC method can be tailored for

97 separation of different types of compounds (e.g., HILIC separation for hydrophilic compounds
and reversed-phase for hydrophobic compounds) [19]. Metabolite identification by LC-MS is
based on spectra obtained by tandem mass spectrometry (MS/MS) which are then compared to
authentic standards [20-22]. These mass spectral patterns can also be searched against databases,
although LC-MS databases are not as comprehensive or as consistent as GC-MS libraries,
because ESI fragmentation patterns vary depending on the collision energy used and from
instrument-to-instrument [23-27]. Further, although MS-based platforms are sensitive, they are
affected by matrix effects, and are limited to compounds with good ionization efficiencies [28,
29]. Moreover, MS cannot always distinguish between stereo isomers, which might be necessary
in a metabolomics experiment [30].
NMR provides complementary and more definitive structural information than MS and it can
distinguish stereoisomers [31]. In addition, NMR is a non-destructive technique which allows for
recovery of samples for further analysis. However as in the case for MS, NMR also requires
relatively pure samples [32]. Therefore when analyzing complex samples, a separation step is
necessary to reduce signal overlap [32]. NMR also suffers from relatively poor detection limits,
rendering it less applicable to routine metabolite identification [33]. However, in recent years,
several new instrumental and experimental techniques have emerged to enhance NMR sensitivity
these include the development of highly sensitive NMR probes and alternative processing
techniques discussed in the first two chapters of this thesis [34].
3.2 Project Goal
In this work, we have combined the strengths of mass spectrometry and NMR to structurally
characterize metabolites from human plasma. These metabolites are identified from LC fractions
98 that contain metabolites that were previously identified in a comparison of the metabolome under
calorie restriction with normal diet [8]. The reduction of the amount of calories consumed has
been shown to slow down the rate of aging and with it, the development of diseases associated
with aging (e.g. cardiovascular disease, diabetes, cancer) [35, 36]. The identification of the
metabolites affected by dietary restriction would aid in identifying the relationship between
caloric restriction and disease risk.
Profiling experiments to find metabolites affected by caloric restrictions have been done using
electrochemical detection (LC-EC). LC-EC is highly sensitive when compared to LC-MS and
NMR [36, 37]. It can detect hundreds of metabolites down to the picomolar level, recognizing
them according to their hydophobicities (LC retention time) and oxidation potential (Figure 3.1)
[38, 39]. An array of EC cells with different potentials are connected in tandem, which can
distinguish co-eluting species, based on their distinct oxidation potentials [38, 39]. The high
sensitivity and specificity of LC-EC makes it ideal for profiling. However, LC-EC is limited to
compounds that are electroactive, and it provides little to no structural information of the
detected metabolites [38]. Thus structural characterization of analytes requires follow-up
analysis with structurally-rich detectors like MS and NMR.
In this work, LC-EC was repeated in combination with both LC-MS and microcoil NMR for
structural characterization metabolites from human plasma. All detectors - LC-EC, LC-MS and
NMR - were run independently to ensure that each detector could be used at its optimal
conditions. Prior to MS and NMR analysis, the metabolite extract was first fractionated using
HPLC. The HPLC fractionation was to simplify the sample’s complexity to reduce the
possibility of ion suppression in MS and signal overlap in NMR

99
Figure 3.1: LC-EC detection separates analytes in two dimensions; hydrophobicity (LC) and oxidation potential (EC). The EC detector is comprised of porous electrodes (upto 16) all operating at different electrical potentials. Reprinted from [4].
For LC-MS, a high resolution (Orbitrap) mass spectrometer was used, high resolution MS
reduces the number of possible candidates. The exact mass was then searched against the
metabolomics databases, METLIN [24] and HMDB [23] which combined have over fifty-
thousand mass spectra of both endogenous and exogenous metabolites. The mass spectrometer
was operated in both positive and negative ion mode with all ion fragmentation using high
collision dissociation (HCD) in each mode. This multimode detection increased metabolite
coverage which ensured that metabolites that ionized in either mode were detected [40]. The
MS/MS was used to provide structural information of the analytes of interest. For volatile and
semi-volatile metabolites, GC-MS was also used for structural confirmation.

100 For NMR, a solenoidal microcoil probe which has high mass sensitivity when compared to
conventional NMR probes was used [41]. The microcoil probe showed limits of detection of 2
nanomoles for 1H NMR spectra. NMR results were used in combination with mass spectrometry
data to produce tentative identifications. Structural confirmation was based on comparison of
analytical results with those of authentic standards.
3.3 Materials and Methods
The work presented was done in collaboration with Professor Bruce S. Kristal at Brigham and
Women’s Hospital (BWH), his post-doctoral associate, Dr. Susan S. Bird and his research
associate Diane P. Sheldon. The LC-EC, LC-MS and fractionation experiments were done at
BWH while the NMR experiments were performed at Northeastern University.
Chemicals
LC-MS grade acetonitrile, methanol, isopropyl alcohol (IPA) and water were obtained from
Fisher Scientific (Pittsburgh, PA). Triethylamine, ammonium acetate and acetic acid were
purchased from Fisher Scientific (Pittsburgh, PA). All deuterated solvents were purchased from
Cambridge Isotopes (Andover, MA). All standards were purchased from Sigma-Aldrich (St.
Louis, MO)
Metabolite Extraction for Identification
For each injection, proteins from two 1.25 ml plasma pools were first precipitated with 5 ml cold
(-20o C) acetonitrile/0.4% glacial acetic acid. The samples were then centrifuged for 15 minutes
at 4 oC, at 12,000 rpm. The supernatant was then transferred into microcentrifuge tubes (1 ml per
tube to a total of ten tubes), then dried under vacuum in a cold centrivap. The dried extract in

101 each tube was then reconstituted in 20 µl mobile phase A (water modified with 25 mM
ammonium acetate adjusted to pH 3.1 with acetic acid), vortexed thoroughly, then pooled
together for HPLC fractionation to a final volume of 200 µL.
LC-EC profiling method
The LC-EC method in which the metabolites of interest were identified was as follows:
Separation was performed by gradient elution on two reversed-phase ESA (Chelmsford, MA)
(4.6 x 250 mm, 5µm) columns connected in tandem with PEEK tubing. The column temperature
was held at 32 oC. The gradient conditions were as follows: The gradient was held at 0% B for
one minute, increased to 12% B over 30 minutes, followed by an increase to 35% B over 5
minutes, then to 48 % B over 20 minutes and finally to 100% B over 35 minutes. The gradient
was then held at 100% B for 10 minutes before being dropped to down 0% B. The mobile
phases used for profiling were water modified with 70 mM pentane sulfonic acid adjusted to pH
3.1 with acetic acid (mobile phase A) and 80:10:10 methanol: acetonitrile: isopropanol alcohol
modified with 100 mM lithium acetate modified with 0.1% acetic acid. The flow rate in the
system was set to 1 mL/minute.
HPLC Fractionation for Metabolite Identification
Because LC-MS and LC-EC have different experimental requirements, with LC-EC using
mobile phases that compromise MS performance (pentane sulfonic acid is not volatile). For
fractionation before LC-MS and NMR experiments the profiling method was modified to use
MS friendly solvents (pentane sulfonic acid was substituted with triethylamine and lithium

102 acetate was substituted with ammonium actetate). All other separation parameters were kept the
same as in the profiling method.
To reduce the sample’s complexity before LC-MS and NMR analysis, the metabolite extract was
first fractionated by LC. Separation of the metabolite extract was performed on an Agilent 1200
series HPLC system consisting of a binary pump, an auto-sampler, a degasser, a variable wave
detector and a fraction collector. The mobile phase consisted of 100% LC-MS grade water
modified with 100 mM triethylamine and 25 mM ammonium acetate with acetic acid (Mobile
phase A) and a mixture of 80% methanol, 10% acetonitrile and 10% isopropanol modified with
25 mM ammonium acetate and adjusted to pH 3.1 with acetic acid (mobile phase B). Time-
dependent fractions were collected from 3 to 104 minutes for a total of 96 fractions, in a 96 well
plate (Waters, Milford, MA). The fractions were named according to the well they were
collected in. The variable wave detector was monitored at 280 nm. The fractions were then
transferred to 1.5 ml microcentrifuge tubes. Before drying, 20 µl of dimethyl sulfoxide (DMSO)
was added into each tube to ensure efficient sample recovery. The HPLC solvent was then dried
under vacuum. Each fraction was then reconstituted in mobile phase A before injection into the
LC-EC and LC-MS.
For NMR analysis, three separate extractions and LC fractionations each of 2.5 mL plasma were
performed. From the three separate extractions (and injections), wells containing the same
analyte were pooled together, dried down and re-suspended in 10 µl deuterated dimethyl
sulfoxide (DMSO-d6) for NMR analysis.

103 LC-MS and LC-EC analysis
Because LC-MS and LC-EC have different experimental requirements, with LC-EC using
mobile phases that compromise MS performance, the LC-EC method initially used in the
profiling experiments was modified to use MS friendly solvents.
For LC-MS and LC-EC, separation was performed using two Shiseido C-18 columns (4.6 x 150
mm) connected in tandem using the same gradient as that used in the fractionation of the
metabolites. The mobile phases used were as follows: Mobile phase A consisted of water
modified with 25 mM ammonium acetate adjusted to pH 3.1 using acetic acid, while mobile
phase B consisted of 100% methanol modified with ammonium acetate and adjusted to pH 3.1
using acetic acid. The flow rate was set to 500 µL/minute. 50 µL of the extract was injected into
both the LC-MS and the LC-EC.
LC-MS Instrumentation
LC-MS was performed on a Thermo Scientific HPLC system which consisted of an autosampler
and an Acela quaternary HPLC pump (Thermo-Fisher, San Jose, CA). The HPLC system was
connected to an Exactive bench-top Orbitrap mass spectrometer (Thermo Fisher, San Jose, CA)
equipped with a heated electrospray ionization (HESI) probe. The spray voltage was set to 4 kV.
The heated capillary and HESI probe were both held at 400 oC. The sheath gas flow was set to 60
units and that of the auxiliary gas at 20 units. The instrument was operated in both positive and
negative ion mode. The instrument was tuned and calibrated as specified by the vendor.
Spectra were acquired using four scan events, alternating between full scan and high collision
dissociation (HCD) in both the positive and negative ion mode. The instrument was operated in

104 high resolution mode, corresponding to 50K resolution. HCD acquisitions were acquired at 60
eV. Full scan spectra were acquired at a mass range between m/z 50 and 1000. The instrument
was controlled using Xcalibur software version 2.1. The same software was used to process the
data.
For identification, the exact mass of the analytes of interest was searched against the
METLIN[24] database and HMDB [23] with a mass tolerance of 10 ppm on both sites. Both
sites allow the user to search masses in both the positive and negative ion mode, and multiple
adduct possibilities are calculated based on the exact mass.
LC-EC Instrumentation
Chromatographic separation with electrochemical detection (LC-EC) was performed on an ESA
(Thermo-Scientific, Chelmsford, MA) LC-EC system with 16-channel coulorometric array
detector. LC separation conditions were the same as for LC-MS. For metabolite detection, the
EC detector was operated with potentials incremented in 60 mV steps (0–900 mV). All HPLC-
ECD system functions were controlled by CoulArray software (CEAS-5.12 software)
NMR Analysis
NMR spectra were acquired on a Bruker Avance II 700 spectrometer (Bremen, Germany)
operating at 699.97 MHz (1H frequency). The spectrometer was equipped with a triple resonance
inverse gradient capillary NMR probe (MRM/Protasis, Savoy, IL). The probe has a 10 μl flow
cell, and a 5µl observe volume.
Before NMR analysis, the LC solvent of the pooled fractions was dried under vacuum, and the
fractions re-suspended in 10 µl DMSO-d6. 8µl of each sample was then loaded into the capillary
probe using One-Minute-NMR (Version 2.18.43) automation (Protasis, Savoy, IL) controlling a
105 CTC-PAL autosampler (LEAP Technologies, Carrboro, NC) with DMSO-d6 as the push solvent.
40 µl of DMSO-d6 was used to center the sample to the probe’s active volume, using 40
µl/minute flow rate. The spectrometer was set to automatically start when the sample was
centered in the probe.
Spectra were acquired with a 45 degree tip angle, 1.45 s acquisition time and a 1 second recycle
delay. When necessary, the residual water peak was pre-saturated with the standard Bruker zgpr
pulse sequence with two dummy scans. The receiver gain was set to 256 and the spectral width
was set to 8 KHz. Depending on an analyte’s concentration, 1K-24K scans were acquired. The
FIDs were processed by zero filling to 64K, baseline corrected, and Fourier transformed with a 1
Hz exponential line broadening. All chemical shifts were referenced to deuterated sodium 2,2,
dimethyl-silapentane-1-sulfonate (DSS-d6). Topspin version 2.1 was used to process the data
and to control the spectrometer. All samples were recovered after NMR analysis.
Re-fractionation of D05 for NMR analysis
LC-MS results indicated that fraction D05 contained multiple compounds. Thus prior to NMR
analysis, the fraction was re-fractionated on an Agilent 1100 HPLC system consisting of a binary
pump, an auto-sampler, a diode-array detector (DAD) monitored at 280 nm, and a fraction
collector. The mobile phase composition and the columns used in the LC-MS and LC-EC
experiments were maintained. However, because the sample was less complex than the human
plasma extract, the LC gradient was shortened as follows: The gradient was held at 0% B for
eight minutes, increased to 20% B over 12 minutes, followed by an increase to 45% B over 15
minutes, then to 95% B over 20 minutes. The gradient was then held at 95% B for five minutes
and finally dropped to 0% B. The total run time was 80 minutes.
106 Time-based fractions were collected between 20 and 35 minutes. Each minute was time-sliced
five times, with five fractions collected for each minute (200 µl per fractions). The fractions that
contained the same analyte were pooled together before drying.
GC-MS analysis
Fractions D05, D06, D12 and E09, and their respective standards were subjected to GC-MS
analysis. The recovered samples were dried under vacuum then derivatized with N,O-bis
(trimethylsilyl) trifluoroacetamide with 1% trimethylchlorosilane (Fisher-Scientific). The
analytes were incubated at 70 oC for 1 hour. The derivatized analytes were then analyzed by
GC/MS using a HP 6890 series GC coupled to a single quadrupole HP 5973 mass selective
detector. Separation was on a HP-5MS GC capillary column (30 m × 0.25 mm × 0.25 μm, 5%
phenyl siloxane) with helium as a carrier gas at a flow rate of 0.8 mL/min. 5µl of each sample
was injected into the injector port in the split mode at a ratio of 1:10. The inlet temperature was
set to 230 oC. A temperature gradient was used for separation as follows: the oven temperature
was set at 130 °C and ramped at a rate of 10 °C/min to reach the final temperature of 300 °C.
Full-scan electron impact spectra across the mass range of m/z 50-700 were acquired in each run
and the final spectra were obtained after background subtraction. Background subtracted spectra
were searched against the NIST database (NIST08.L)
3.4 Results and Discussion
The long term goal of the work presented is the structural characterization of metabolites
previously identified using LC-EC as changing due to caloric restriction. The short term is to
develop a robust analytical method to allow us to achieve our long-term goal. The analytical

107 strategy developed is shown on Figure 3.2. After metabolite extraction, the supernatant was first
fractionated by LC-UV. The fractionation was done to reduce the sample’s complexity prior to
MS and NMR analysis. Time-based fractions were collected at one minute intervals through the
entire chromatographic run (1 ml per fraction) for a total of 96 fractions (for identification, the
metabolites are referred to after the 96-well position they were collected into). Fractionation was
followed by LC-MS, LC-EC and NMR analysis. Prior to LC-MS and LC-EC the metabolites
were pre-concentrated 10-fold, by drying and reconstitution in 100 µl of mobile phase A. To
compare the retention times of the metabolites between LC-MS and LC-EC, all pre-concentrated
fractions were injected into the LC-MS and the LC-EC systems under the same chromatographic
conditions.
NMR analysis was used as a follow up to LC-EC and LC-MS so, only fractions corresponding to
the retention time of metabolites of interest (identified during LC-EC profiling) were analyzed
by NMR. Due to the higher sample concentration requirements of NMR when compared to both
LC-EC and LC-MS, for NMR, samples for NMR were obtained by pooling the collected fraction
containing the same analyte from three separate fractionations. These samples were then dried
down, re-suspended in 10 µl DMSO-d6, and then loaded into the microcoil probe. The analytes
for NMR analysis were 300-fold more concentrated than for LC-MS and LC-EC analysis. After
NMR analysis, the analytes were recovered and volatile analytes were analyzed by GC-MS,
which provided further structural information on the identity of the markers. Unequivocal
structural identification of the markers of interest was based on comparisons of analytical results
with those of authentic standards.

108
2.5 mL plasma
Metabolite Extraction(acidified ACN)
200 Ul(MPA)
Dry supernatant,Re-suspend
FractionationLC-UV4.6 mm, 500 mm RP C-18 column
LC-CoulArray LC-MS
3 fractionations, 3 injectionsPool, dry, re-suspend 10 uL
Dry, Re-suspend 100 µl
Exact Mass(Orbitrap)
+ve/-ve polarity switching
MS/MS (HCD)
Microcoil NMR
Recover after NMR(GC-MS analysis)
Dry, Re-suspend 100 µl
MS
Figure 3.2: The analytical strategy used to identify metabolites in the work presented.

109
3.4.1 Correlation of Analytical Results across Platforms:
When integrating analytical platforms offline, it is important to be able to correlate data across
the platforms to ensure that the same analyte is observed with the different detectors, or when
analytes are observed in one but not all detectors. In the work presented, we needed to correlate
the retention times between the LC-MS and the LC-EC detectors. These two detectors have
differences in sensitivity and are known to detect different compounds, thus metabolites
observed in one might not be detectable in the other. For example, the mass spectrometer is less
sensitive than the electrochemical detector and an analyte detected with EC might not be
detected above background with the MS but if the expected retention time is known, it is
possible to search for a unique mass in the mass spectrometer. The retention time was expected
to be different between the two systems because separate LC instruments were used with each
detector, each with different void volumes.
To determine the exact differences in void volumes and retention times between the two systems,
six standards with a range of polarities were analyzed in the LC-MS and the LC-EC systems. For
their separation the chromatographic conditions were kept the same. As summarized in Table
3.1, the retention time of the six standards (except ascorbic acid which was not observed in the
LC-MS), differed by up to ten-minutes. The correlation of the retention time was however linear
across the gradient with a regression of 0.995 which was used for correlation of retention times
of the markers of interest.
Correlation between the LC-EC and LC-MS results with the NMR results was based on the
reproducibility of the retention times during fractionation of the metabolites. Retention time
drifts are caused by changes in column temperature, column back-pressure and can also be

110 affected by column aging. To minimize day-to-day drifts, the column temperature was kept
constant at 32 oC, and the column pressure was monitored. Any drastic changes in column
pressure were solved before injection. Some retention time changes are expected as the column
ages, thus known metabolites in the plasma extract were used to monitor and adjust for minor
changes (to within one-minute) in the retention time (e.g. uric acid which elutes at ~ 12 minutes
in plasma pool extract). If major changes in retention times were observed, the collected
fractions were not used for subsequent analysis.
Mass Spec CoulArray
Compund Positive/Neg Ion RT RT
Void Volume 9.80 9.60
Ascorbic Acid(ASC) ‐ 13.94
Uric Acid (URIC) ‐ 24.26 26.52
Tyrosine (TYR) +/‐ 26.32 31.15
Kynureinine (KYN) ‐ 34.11 38.22
Tryptophan(TRP) ‐ 40.24 48.36
Melatonin (MEL) ‐ 49.03 57.47
Table 3.1: Comparison of retention times between the LC-MS and LC-MS platforms

111
3.4.2 Metabolite Characterization
After optimization of all the analytical steps, the next step was the structural identification of the
markers of interest. For identification of the markers, the exact mass was first searched against
the METLIN and HMDB databases. For database searches, the mass tolerance was kept at 10
ppm to reduce the number of hits. The database hits were filtered based on MS/MS, 1H NMR
and GC-MS analysis. Unequivocal assignment of the structures was based on comparison of the
analytical results with authentic standards.
Identification of C10
Fraction C10 contained a high concentration metabolite (C10) which was thought to be
tryptophan (TRP) from LC-EC analysis. MS and NMR were therefore used for structural
confirmation.
LC-MS analysis of the fraction C10 showed a peak with retention time at 40 minutes, an elution
that, when compared to that from LC-EC was within the calculated retention time from the
correlation experiments (Figure 3.4A). The mass spectrum of fraction C10, shown in Figure
3.4B, exhibited an ion at m/z 205.0962 [M+H]+ as the base peak. The mass spectrum also
exhibited an ion at m/z 227.4779, which was consistent with the sodiated adduct of the
metabolite C10 and an ion at m/z 409.1852, as the peak of highest mass which was attributed to
the dimerization of C10. HCD MS/MS fragmentation of the metabolite exhibited a fragment ion
at m/z 188.0690 [M-NH3]+, and m/z 146.0954 from fragmentation across the beta carbon of the
indole ring.

112 The 1H NMR spectrum of fraction C10 (Figure 3.4B bottom panel) was used to support the
assignment of the metabolite, C10 as Trp. In the aromatic region (Figure 3.4B inset), of the 1H
spectrum of fraction C10 exhibited five protons, two triplets at 7.01 ppm and 7.09 ppm (J=8.32
Hz), two ortho-coupled doublets at 7.36 ppm and 7.58 ppm (J=8Hz) and a singlet at 7.21 ppm.
A highly de-shielded proton was also observed at 10.89 ppm which was the –NH proton in the
indole moiety. These analytical results matched an authentic standard of TRP.
Negative Ion MS TIC
0.00 30.00 60.00 90.00
0
10
20
30
40
Retention time (minutes)
Resp
onse
(µA)
Raw Data
16151413121110987654321
48.5 minutes
Positive Ion MS TIC
LC-EC
:
0 10 20 30 40 50 60 70 80 90 100Time (min)
0
20
40
60
80
100
0
20
40
60
80
100
Rel
ativ
e A
bundance
40.15
69.4866.31 70.61 79.2562.27
60.3255.73
38.959.82 33.8227.45 95.3922.445.75 92.27
40.17
68.5567.76 69.88 79.2261.0954.599.68 39.4527.66 95.3024.421.71
LC-MS
A.

113
::
100 200 300 400 500 600 700 800 900 1000m/z
0
10
20
30
40
50
60
70
80
90
100
Rel
ativ
e A
bund
ance
205.0962
188.0696
409.1852
227.0779146.0593 431.1673 632.2478507.1536 734.2919 866.3039 917.2378
[M+H]+
[M+Na]+
[2M+H]+
m/z 188.0696
MS
1H NMR
-NH
2
67 89
2
36
7
8
9
B.
Figure 3.4 (A) LC-MS and LC-EC retention time of Fraction C10 (B) MS and 1H NMR spectra MS/MS and 1H NMR analysis of Fraction C10. Based on these results, Fraction C10 is identified as tryptophan

114
Identification of components in D05
Even after the fractionation prior to MS and NMR, due to the complexity of the metabolome, it
is not always possible to obtain pure compounds. LC-MS analysis of fraction D05, showed the
presence of three distinct molecular masses, an indication that the fraction was comprised of
multiple compounds. Therefore, before NMR analysis, to reduce the possibility of signal overlap,
fraction D05 was subjected to a re-fractionation step using the same LC conditions (column and
mobile phases) used in both LC-EC and LC-MS, which ensured that the analytes eluted in the
same order. Also in the initial fractionation step, one-minute time-based fractions had been
collected. For re-fractionation, to reduce the possibility of contamination of closely eluting
analytes, each minute was time-sliced five times (five fractions each of 200 µL were collected
each minute). As shown in Figure 3.5, re-fractionation of fraction D05 yielded three distinct UV
peaks (D05_1, D05_2 and DO5_3), which were isolated for further analysis.

115
min25 26 27 28 29 30 31 32
mAU
0
10
20
30
40
50
60
70
D05_1
D05_2
D05_3
Observed MassD05_1 212.0020 [M-H]-D05_2 137.0233 [M-H]-D05_3 195.0871 [M+H]+
LC-UV (280 nm) D05
Ab
sorb
ance
Figure 3.5: LC-UV (280 nm) profile of re-fractionation of Fraction D05. Initial LC-MS results indicated that D05 was not pure and consisted of three distinct compounds. For NMR and GC-MS analysis, D05 was therefore first re-fractionated. Each minute was time-sliced five times.
D05_1 was a low concentration metabolite. The ESI-mass spectrum of D05_1 shown in Figure
3.6A, exhibited an exact mass at m/z 212.0019 [M-H]-, and also a fragment ion at m/z 132.0443,
derived from a neutral loss of SO3H. D05_1 was putatively identified as indoxyl sulfate (ISA)
based on database hits, the results were also consistent with previously published MS/MS spectra
of indoxyl sulfate [42]. After re-fractionation, enough material could not be isolated for NMR
analysis. D05_1 was however subjected to GC-MS analysis. Prior to GC-MS analysis, D05_1

116 was converted to its trimethylsilyl derivative to increase its volatility. The GC mass spectrum of
D05_1, shown in Figure 3.6B, exhibited an ion at m/z 277 as the base peak, which was attributed
to the migration of the TMS group [43] followed by a loss of SO3H. The fragment ion at m/z 73
is from the loss of a TMS group. A TMS derivatized authentic standard of ISA also showed the
same fragmentation pattern as D05_1
MS/MS (HCD) D05_1
120 140 160 180 200 220m/z
0
10
20
30
40
50
60
70
80
90
100
110
Rela
tive A
bundance
212.0019
103.9190
132.0443
136.9216
178.9325
115.9195 205.8607
108.0204199.8505
152.9167 188.8577
132.0443
A.

117
73.1
277.1
Ab
un
da
nce
m/z
EI‐MS D05_1‐TMS
m/z 277
B.
Figure 3.6. (A) MS/MS (HCD) spectrum of Fraction D05_1. (B) GC-EI-MS fragmentation of trimethylsilylated D05_1. The fragment ion at 277 is from the migration of the TMS group and from the loss of SO3 as shown in the schematic (B bottom).
Fraction D05_2 exhibited a mass of 137.0233 [M-H]-. When searched against the databases, this
mass yielded three possibilities, para, meta, and ortho salicylic acid. These three compounds are
all positional isomers, and are indistinguishable by MS fragmentation. NMR was therefore used
to determine the isomer represented by D05_2. In the aromatic region of the 1H NMR spectrum
of fraction D05_2 (Figure 3.7), four protons were observed, two ortho coupled doublets at 7.66

118 ppm (J=7.37 Hz) and 6.61 ppm (J=8.3 Hz) and two triplets at 7.14 ppm (J= 6.98 Hz) and 6.59
ppm (J=6.98). The pattern of resonances (two doublets and two triplets) was consistent with a 1,
2 substitution on a benzyl ring. The aromatic region of a 1,3 substitution(meta-salicylic acid)
would exhibit a singlet, two doublets and a triplet, while a 1,4 substitution (para) would exhibit
two doublets. The aromatic region of fraction D05_2 also exhibited two broad proton resonances
at 6.71 ppm and 7.32 ppm which were attributed to the hydroxyl group on the 2 position and on
the carboxylic acid. DO5_2 was therefore identified as ortho salicylic acid. Co-injection of
D05_2 with ortho-salicylic acid yielded a single peak.
min25 26 27 28 29 30 31 32
mAU
0
10
20
30
4050
60
70
D05_1
D05_2
D05_3LC‐UV D05
1
23
4
5
6
35
46
D05_2
Figure 3.7 LC-UV (280 nm) profile of re-fractionated fraction D05 (Top) . The aromatic region of 1H NMR spectrum of metabolite D05_2 indicates it is a 1,2 substituted benzyl ring (Bottom).

119 The largest chromatographic peak, D05_3, exhibited a mass at 195.0815 [M+H] + which was
consistent with caffeine. The proton spectrum of fraction D05_3 exhibited four singlets, three of
which integrated to three protons and were observed at 3.8 ppm, 3.42 ppm and 3.2 ppm, the other
singlet integrated to a single proton and was observed at 8.01 ppm, (the NMR results of caffeine
are not very diagnostic because it only has four signals and they are all singlets). Co-injection of
fraction D05_3 with caffeine yielded a single peak, thus D05_3 was identified as caffeine.
Characterization of E09, a low level Metabolite
Fraction E09 contains a low concentration metabolite which was structurally characterized using
a combination of MS and NMR. E09 had been putatively identified as indole-3-propionic acid
(I3PA) based on a retention time match with an authentic standard of I3PA on the LC-EC
(Figure 3.8A).
For LC-MS analysis, although no apparent peak could be detected above the background, the
retention time could be correlated from the LC-EC as previously discussed, and at the expected
retention time (54 minutes) a mass in the negative ion mode at m/z of 188.0715 [M- H]- was
extracted. This mass corresponded to that of I3PA to within 1 ppm. The ion count of the parent
mass was observed at only 10-3 which although sufficient to provide a molecular mass, was not
sufficient for MS/MS fragmentation. Further characterization of the fraction was therefore
performed using NMR and GC-MS.
For NMR analysis, 2 nmol (UV 280) of E09 was isolated from three separate extractions of the
plasma extract. In the aromatic region of the 1H NMR spectrum showed the presence of an
indole moiety which had been observed in the Trp metabolite (Figure 3.4 bottom panel). These

120 resonances consisted of four protons, two ortho-coupled doublets at 7.34 ppm (J=8.2 Hz) and
7.52 ppm (J = 8.4Hz), and two triplets at 7.07 ppm (J=7.81 Hz) and 6.98 ppm (J= 7Hz). A highly
de-shielded proton at 10.78 ppm attributed to the –NH proton on the five-membered indole ring
was also observed. These resonances matched peak-to-peak with those of an authentic standard
of I3PA as shown in Figure 3.8B.
E09
I-3PA
E09 in Plasma Pool
1H NMR
LC‐ECA.
B.
Figure 3.8 (A) E09 is a low concentration metabolite as seen in LC-EC separation of the human plasma pool. (B) the aromatic regions (6.5-11ppm) of the 1H NMR analysis of 2 nmoles of E09 shows the presence of an Indole moiety. A comparison of the NMS spectrum with the spectrum of an authentic standard of indole-3-propionic acid shows a peak-to-peak match.
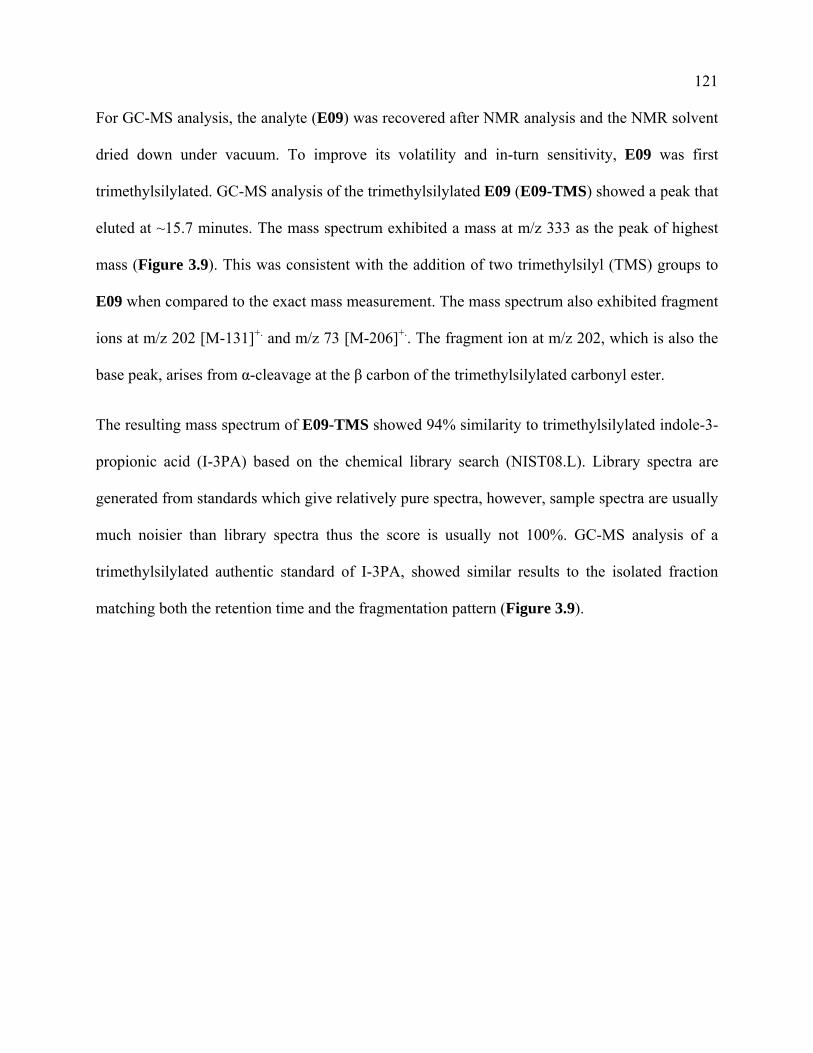
121 For GC-MS analysis, the analyte (E09) was recovered after NMR analysis and the NMR solvent
dried down under vacuum. To improve its volatility and in-turn sensitivity, E09 was first
trimethylsilylated. GC-MS analysis of the trimethylsilylated E09 (E09-TMS) showed a peak that
eluted at ~15.7 minutes. The mass spectrum exhibited a mass at m/z 333 as the peak of highest
mass (Figure 3.9). This was consistent with the addition of two trimethylsilyl (TMS) groups to
E09 when compared to the exact mass measurement. The mass spectrum also exhibited fragment
ions at m/z 202 [M-131]+. and m/z 73 [M-206]+.. The fragment ion at m/z 202, which is also the
base peak, arises from α-cleavage at the β carbon of the trimethylsilylated carbonyl ester.
The resulting mass spectrum of E09-TMS showed 94% similarity to trimethylsilylated indole-3-
propionic acid (I-3PA) based on the chemical library search (NIST08.L). Library spectra are
generated from standards which give relatively pure spectra, however, sample spectra are usually
much noisier than library spectra thus the score is usually not 100%. GC-MS analysis of a
trimethylsilylated authentic standard of I-3PA, showed similar results to the isolated fraction
matching both the retention time and the fragmentation pattern (Figure 3.9).

122
333
202.2
333.1
202.2
73.2
215.2
m/z
Abundance
333.1
215.1
202.2
73.2
m/z
Abundance
I-3PA_TMS
E09_TMS
I-3PA_TMS
E09_TMS
15.75
15.76
202
73
Figure 3.9 A comparison of the retention time and EI-MS fragmanetion of trimethylsilylated E09 and indole-3-propionic acid. The GC-MS results are identical confirming E09 as indole-3-propionic acid.
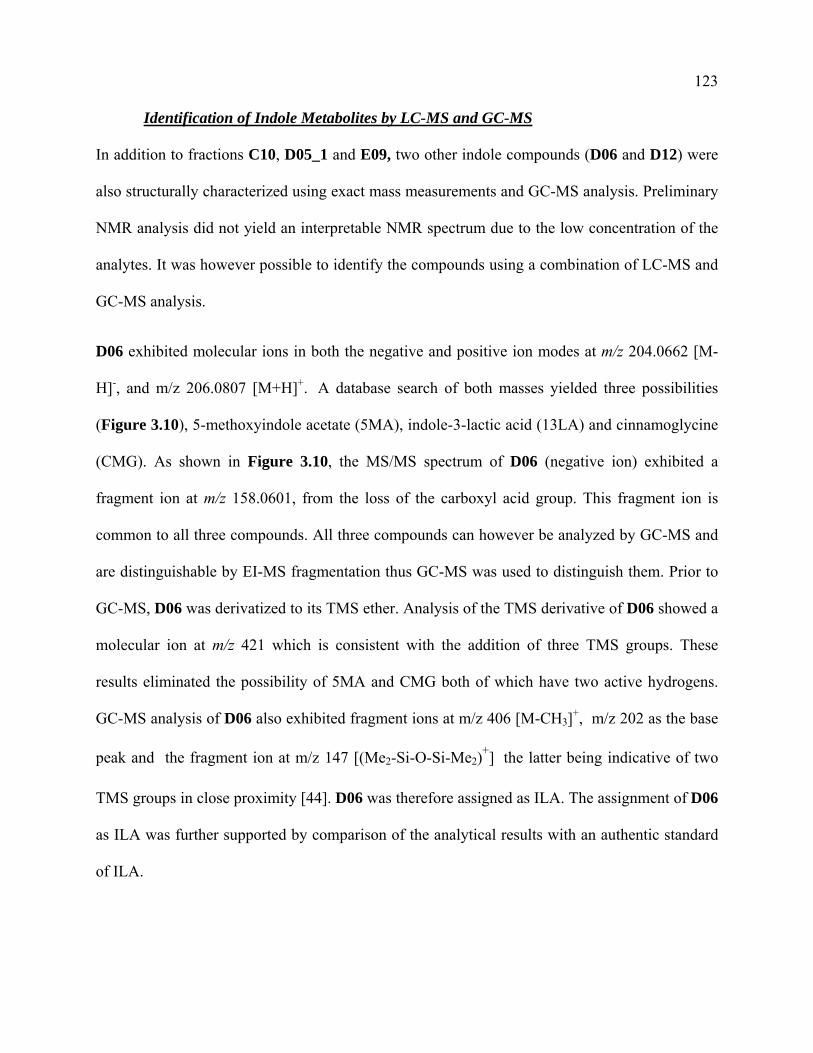
123
Identification of Indole Metabolites by LC-MS and GC-MS
In addition to fractions C10, D05_1 and E09, two other indole compounds (D06 and D12) were
also structurally characterized using exact mass measurements and GC-MS analysis. Preliminary
NMR analysis did not yield an interpretable NMR spectrum due to the low concentration of the
analytes. It was however possible to identify the compounds using a combination of LC-MS and
GC-MS analysis.
D06 exhibited molecular ions in both the negative and positive ion modes at m/z 204.0662 [M-
H]-, and m/z 206.0807 [M+H]+. A database search of both masses yielded three possibilities
(Figure 3.10), 5-methoxyindole acetate (5MA), indole-3-lactic acid (13LA) and cinnamoglycine
(CMG). As shown in Figure 3.10, the MS/MS spectrum of D06 (negative ion) exhibited a
fragment ion at m/z 158.0601, from the loss of the carboxyl acid group. This fragment ion is
common to all three compounds. All three compounds can however be analyzed by GC-MS and
are distinguishable by EI-MS fragmentation thus GC-MS was used to distinguish them. Prior to
GC-MS, D06 was derivatized to its TMS ether. Analysis of the TMS derivative of D06 showed a
molecular ion at m/z 421 which is consistent with the addition of three TMS groups. These
results eliminated the possibility of 5MA and CMG both of which have two active hydrogens.
GC-MS analysis of D06 also exhibited fragment ions at m/z 406 [M-CH3]+, m/z 202 as the base
peak and the fragment ion at m/z 147 [(Me2-Si-O-Si-Me2)+] the latter being indicative of two
TMS groups in close proximity [44]. D06 was therefore assigned as ILA. The assignment of D06
as ILA was further supported by comparison of the analytical results with an authentic standard
of ILA.

124 A.
B.
L
D06
LC-EC MS/MS
202
421147
73
m/z
GC-MS
m/z 421
202
160 170 180 190 200m/z
0
10
20
30
40
50
60
70
80
90
100
Rel
ativ
e A
bund
ance
158.0602
176.9874204.0661
174.9917 199.8505
159.0636186.0554172.0396
160.0395
m/z 204.0661 [M-H]-
Figure 3.10 Chemical structures of the three possible compounds in D06. In the negative ion mode all three compounds can lose the carboxylic acid group as a neutral fragment. (B) Fraction D06 is identified as indole-3-lactic acid based on its retention time, MS/MS fragmentation and GC-MS spectra. Confirmation as indole-3-lactic acid is however based on GC-MS results. Fraction D12 was also subjected to GC-MS analysis.

125 In the GC-MS, timethylsilylated D12 (D12-TMS) eluted at 14 minutes and its EI mass spectrum
(Figure 3.11) exhibited a mass at m/z 319 [M]+. as the ion of highest mass as well as a fragment
ion at m/z 304 [M-CH3]+.. Its GC- mass spectrum also exhibited a fragment ion at m/z 202, as the
base peak, and this ion is consistent with an indole compound with side-chain carbons at the
alpha and beta positions of C-3. The assignment of D12 as indole acetic acid was supported by
comparison of its analytical results with those of an authentic standard.
319.1
202.1
73.1
m/z
202
m/z 319
EI‐MS D12‐TMS
Figure 3.11 EI mass spectrum of trimethylsilylated D12. The fragment ion at m/z 202 is characteristic to all trimethylsilylated indole compounds with a carbon beta to the indole ring.
The metabolites identified in the work presented are summarized on Table 3.2. Although the
relevance of the metabolites identified in this work is yet to be established previous studies have

126 shown that the metabolites indoxyl sulfate and indole-3-propionic acid, are produced from the
metabolism of tryptophan by the enzyme tryptophanase in the gut microbiome [42]. In the work
presented, we have demonstrated the importance of combining multiple analytical platforms for
the structural identification of biomarkers in a metabolomics study. This is exemplified by the
identification of the metabolite in Fraction E09. From LC-MS analysis, the molecular weight
(elemental composition) can be deduced while structural confirmation is based on both GC-MS
and 1H NMR experiments. In addition, multiple analytical platforms enable structural
characterization of metabolites that cannot be identified from a single platform. This is
demonstrated in the characterization of the metabolite in D06, the exact mass and database
results shortlists three compounds which are eliminated by both LC-EC and GC-MS results. We
identified seven compounds using a combination of mass spectrometry and NMR. In addition to
increasing the confidence in identification, multiple analytical platforms that give
complementary information also reduce the number of standards that may need to be synthesized
or purchased for comparison.

127
Fraction # Compound ID Confirmation
C10 Tryptophan LC-MS,NMR
D05 1. Indoxyl Sulfate2. Salicylic Acid3. Caffeine
LC-MS,GC-MSLC-MS,NMRLC-MS,NMR
D06 Indoxyl-3-Lactic Acid LC-MS, GC-MS
D12 Indoxyl-3-Acetic Acid LC-MS, GC-MS
E09 Indole-3-Propionic Acid LC-MS, GC-MS, NMR
Table 3.2 Metabolites identified in this work
The work presented here demonstrated the utility and value of the complementary use of LC-EC,
LC-ESI MS, GC-EI-MS and NMR. LC-MS was done by scanning in both positive and negative
ion mode which increases metabolite coverage. The advantages of GC-MS, although limited to
the analysis of volatile and /or semi-volatile compounds, have been demonstrated in the work
presented. Mass spectra from GC-MS are highly reproducible and as demonstrated in the
identification of the indole metabolites, EI fragmentation produces characteristic fragment ions
that can be identified because they display well defined and predictable fragment ions that enable
structural identification of a class of compounds with structural similarities. The combination of
GC-MS and LC-MS mass spectral results when derivatization is used is useful in pinpointing the
number of active hydrogens.
The high mass-sensitivity of a microcoil probe with LODs of 2 nmoles enables the analysis of
low concentration metabolites. However, when working at the LOD of NMR, NMR can only be

128 used to confirm a structural assignment but not for de-novo structural identification which
requires 2D experiments. The advantage of NMR over MS to identify isomers is demonstrated in
the analysis of D05_2, identified as ortho-salicylic acid which from the exact mass has three
possibilities which are distinguished by NMR. Thus, despite its relatively low sensitivity,
especially when used with a microcoil probe, NMR proved to be of significant value in this
metabolomics study.
3.5 Conclusions
The primary challenge in metabolomics is the unequivocal structural identification of
compounds identified as biomarkers. The work presented clearly shows the necessity and also
demonstrates the effectiveness of using multiple analytical platforms combined with database
searches in the structural elucidation of metabolites of interest.
3.6 References
1. Lindon, J.C., E. Holmes, and J.K. Nicholson, Peer Reviewed: So What’s the Deal with Metabonomics? Analytical Chemistry, 2003. 75(17): p. 384 A-391 A.
2. Nicholson, J.K., J.C. Lindon, and E. Holmes, 'Metabonomics': understanding the metabolic responses of living systems to pathophysiological stimuli via multivariate statistical analysis of biological NMR spectroscopic data. Xenobiotica, 1999. 29(11): p. 1181-1189.
3. Vinayavekhin, N., E.A. Homan, and A. Saghatelian, Exploring Disease through Metabolomics. ACS Chemical Biology, 2009. 5(1): p. 91-103.
4. Kaddurah-Daouk, R., B.S. Kristal, and R.M. Weinshilboum, Metabolomics: a global biochemical approach to drug response and disease. Annu Rev Pharmacol Toxicol, 2008. 48: p. 653-83.

129 5. Verhoef, P., et al., A high-protein diet increases postprandial but not fasting plasma total
homocysteine concentrations: a dietary controlled, crossover trial in healthy volunteers. The American Journal of Clinical Nutrition, 2005. 82(3): p. 553-558.
6. Cross, A.J., et al., A Prospective Study of Meat and Meat Mutagens and Prostate Cancer Risk. Cancer Research, 2005. 65(24): p. 11779-11784.
7. Rezzi, S., et al., Metabolic shifts due to long-term caloric restriction revealed in nonhuman primates. Exp Gerontol, 2009. 44(5): p. 356-62.
8. Kristal, B.S., et al., Metabolomics in the study of aging and caloric restriction. Methods Mol Biol, 2007. 371: p. 393-409.
9. Stella, C., et al., Susceptibility of Human Metabolic Phenotypes to Dietary Modulation. Journal of Proteome Research, 2006. 5(10): p. 2780-2788.
10. Gibney, M.J., et al., Metabolomics in human nutrition: opportunities and challenges. The American Journal of Clinical Nutrition, 2005. 82(3): p. 497-503.
11. Buscher, J.M., et al., Cross-platform comparison of methods for quantitative metabolomics of primary metabolism. Anal Chem, 2009. 81(6): p. 2135-43.
12. Kind, T., et al., A comprehensive urinary metabolomic approach for identifying kidney cancer. Analytical Biochemistry, 2007. 363(2): p. 185-195.
13. Yanes, O., et al., Expanding coverage of the metabolome for global metabolite profiling. Anal Chem, 2011. 83(6): p. 2152-61.
14. Werf, M.J.v.d., et al., Microbial metabolomics: Toward a platform with full metabolome coverage. Analytical Biochemistry, 2007. 370(1): p. 17-25.
15. Fiehn, O., et al., Identification of Uncommon Plant Metabolites Based on Calculation of Elemental Compositions Using Gas Chromatography and Quadrupole Mass Spectrometry. Analytical Chemistry, 2000. 72(15): p. 3573-3580.
16. Koek, M.M., et al., Microbial Metabolomics with Gas Chromatography/Mass Spectrometry. Analytical Chemistry, 2006. 78(4): p. 1272-1281.

130 17. Halket, J.M., et al., Chemical derivatization and mass spectral libraries in metabolic
profiling by GC/MS and LC/MS/MS. Journal of Experimental Botany, 2005. 56(410): p. 219-243.
18. Oliver, F., Extending the breadth of metabolite profiling by gas chromatography coupled to mass spectrometry. TrAC Trends in Analytical Chemistry, 2008. 27(3): p. 261-269.
19. Cubbon, S., et al., Metabolomic applications of HILIC-LC-MS. Mass Spectrom Rev, 2010. 29(5): p. 671-84.
20. Saghatelian, A., et al., Assignment of endogenous substrates to enzymes by global metabolite profiling. Biochemistry, 2004. 43(45): p. 14332-9.
21. Yanes, O., et al., Metabolic oxidation regulates embryonic stem cell differentiation. Nat Chem Biol, 2010. 6(6): p. 411-417.
22. Chen, J., et al., Practical Approach for the Identification and Isomer Elucidation of Biomarkers Detected in a Metabonomic Study for the Discovery of Individuals at Risk for Diabetes by Integrating the Chromatographic and Mass Spectrometric Information. Analytical Chemistry, 2008. 80(4): p. 1280-1289.
23. Wishart, D.S., et al., HMDB: a knowledgebase for the human metabolome. Nucleic Acids Res, 2009. 37(Database issue): p. D603-10.
24. Smith, C.A., et al., METLIN: a metabolite mass spectral database. Ther Drug Monit, 2005. 27(6): p. 747-51.
25. Okuda, S., et al., KEGG Atlas mapping for global analysis of metabolic pathways. Nucleic Acids Res, 2008. 36(Web Server issue): p. W423-6.
26. Bateman, R., et al., A novel precursor ion discovery method on a hybrid quadrupole orthogonal acceleration time-of-flight (Q-TOF) mass spectrometer for studying protein phosphorylation. Journal of the American Society for Mass Spectrometry, 2002. 13(7): p. 792-803.
27. Plumb, R.S., et al., UPLC/MSE; a new approach for generating molecular fragment information for biomarker structure elucidation. Rapid Communications in Mass Spectrometry, 2006. 20(13): p. 1989-1994.

131 28. Taylor, P.J., Matrix effects: the Achilles heel of quantitative high-performance liquid
chromatography-electrospray-tandem mass spectrometry. Clin Biochem, 2005. 38(4): p. 328-34.
29. Mallet, C.R., Z. Lu, and J.R. Mazzeo, A study of ion suppression effects in electrospray ionization from mobile phase additives and solid-phase extracts. Rapid Communications in Mass Spectrometry, 2004. 18(1): p. 49-58.
30. Xiao, J.F., B. Zhou, and H.W. Ressom, Metabolite identification and quantitation in LC-MS/MS-based metabolomics. Trends Analyt Chem, 2012. 32: p. 1-14.
31. Seger, C., et al., LC-DAD-MS/SPE-NMR Hyphenation. A Tool for the Analysis of Pharmaceutically Used Plant Extracts: Identification of Isobaric Iridoid Glycoside Regioisomers from Harpagophytum procumbens. Analytical Chemistry, 2004. 77(3): p. 878-885.
32. Albert, K., On-Line LCV-NMR and Related Techniques. 2002: John Wiley & Sons Ltd. 290 pp.
33. Claridge, T. and Editor, High-Resolution NMR Techniques in Organic Chemistry. 2000: Pergamon. 384 pp.
34. Webb, A., Increasing the Sensitivity of Magnetic Resonance Spectroscopy and Imaging. Analytical Chemistry, 2011. 84(1): p. 9-16.
35. Yu, B.P. and Editor, Modulation of Aging Processes by Dietary Restriction. 1994: CRC. 281 pp.
36. Redman, L.M. and E. Ravussin. Caloric restriction, longevity, and adiposity. 2010: Wiley-VCH Verlag GmbH & Co. KGaA.
37. Vigneau-Callahan, K.E., et al., Characterization of diet-dependent metabolic serotypes: analytical and biological variability issues in rats. J Nutr, 2001. 131(3): p. 924S-932S.
38. Kristal, B.S., et al., High-performance liquid chromatography separations coupled with coulometric electrode array detectors: a unique approach to metabolomics. Methods Mol Biol, 2007. 358: p. 159-74.

132 39. Matson, W.R., et al., n-Electrode three-dimensional liquid chromatography with
electrochemical detection for determination of neurotransmitters. Clinical Chemistry, 1984. 30(9): p. 1477-88.
40. Nordstrom, A., et al., Multiple ionization mass spectrometry strategy used to reveal the complexity of metabolomics. Anal Chem, 2008. 80(2): p. 421-9.
41. Olson, D.L., M.E. Lacey, and J.V. Sweedler, High-Resolution Microcoil NMR for Analysis of Mass-Limited, Nanoliter Samples. Analytical Chemistry, 1998. 70(3): p. 645-650.
42. Wikoff, W.R., et al., Metabolomics analysis reveals large effects of gut microflora on mammalian blood metabolites. Proc Natl Acad Sci U S A, 2009. 106(10): p. 3698-703.
43. Meg Annan, P.W., LeQuesne, and V. Paul, Trimethylsilyl group migration in the mass spectra of trimethylsilyl ethers of cholesterol oxidation products. Product ion characterization by linked-scan tandem mass spectrometry. Journal of the American Society for Mass Spectrometry, 1993. 4(4): p. 327-335.
44. Sloan, S., D.J. Harvey, and P. Vouros, Interaction and rearrangement of trimethylsilyloxy functional groups. The structural significance of the m/e 147 ion in the mass spectra of trimethylsil steroidal ethers. Organic Mass Spectrometry, 1971. 5(7): p. 789-799.

133
Chapter 4:
The Metabolism of Select Vitamin D Analogs and 1α, 25 (OH)2-3-epi Vitamin D3 by Rat
Cytochrome P450 24A1 Hydroxylase.
Published in Archives of Biochemistry and Biophysics, and Mass Spectrometry Reviews.
Rhieu, Y.S.; Annalora, J.A.; Gathungu, M. R.; Vouros, P.; Uskokovic, R. M., Schuster, I.; Tayhas, G.; Palmore, R.; Reddy, S.G. A new insight into the role of rat cytochrome P450 24A1 in metabolism of selective analogs of 1α, 25-dihydroxyVitamin D3. Archives of Biochemistry and Biophysics. 2011. 509, 33-43. Gathungu, M.R.; Flarakos, C.C.; Reddy, S.G.; Vouros, P. The Role of Mass Spectrometry in the Analysis of Vitamin D Compounds. 2012. Mass Spectrometry Reviews. (Accepted)

134
4.1 Introduction
Vitamin D3 is a prosecosteroid hormone rather than a true Vitamin because its main source is its
endogenous biosynthesis from its precursor 7-dehydrocholesterol, present in the skin [1].
Vitamin D3 is mainly associated with the regulation of calcium and phosphorus homeostasis and
in bone mineralization [2]. It is also important for proper functioning of other biological systems,
including the immune, cardiovascular, and reproductive systems [3-6].
Vitamin D3 is biologically inactive. Its bioactivation by the sequential action of two specific
cytochrome P450 hydroxylase enzymes, results in the formation of the biologically active
metabolite, 1α, 25-dihydroxy Vitamin D3 (1α, 25 (OH)2D3) (Figure 4.1). Upon dietary ingestion
or biosynthesis, Vitamin D enters the circulatory system and is transported to the liver, where it
is first hydroxylated to form 25-hydroxy Vitamin D3 (25 (OH)D3 [7, 8], which is the major
circulating form of Vitamin D3 and the immediate precursor of the most potent hormonal form
of the Vitamin D3, 1α,25(OH)2D3. C25-hydroxylation, is the initial step in activation of Vitamin
D3 into 25-hydroxyVitamin D3 and is mostly unregulated, whereas the 1α-hydroxylation, the
final step in the activation of 25-hydroxyVitamin D3 into 1α, 25(OH)2D3 in the kidney, is
stringently regulated [9-12]). The production of 1α,25(OH)2D3 in the kidney is up-regulated by
the parathyroid hormone and down-regulated through negative feedback, by 1α,25(OH)2D3.
Other regulators include calcium, phosphate, and growth hormone, prolactin and fibroblast
growth factor 23 (FGF 23) [13].

135
Figure 4.1 Biosynthesis and bioactivation of 1α, 25 (OH)2 Vitamin D3 in man from 7-dehydrocholesterol. Reprinted from ref [11].

136
4.2 Biological Relevance of Vitamin D
1α, 25(OH)2D3 is the most important biological regulator of calcium metabolism. It stimulates
the absorption of dietary calcium through the intestines and participates in its calcium’s
incorporation into the skeleton [12, 14]. Without adequate levels of 1α, 25(OH)2D3 in the blood,
the body cannot absorb or use calcium, which is essential for the electrochemical signaling
between brain cells. The reduced absorption of calcium and phosphorus through the intestine
also leads to poor skeletal integrity. In children, Vitamin D deficiency results in rickets, a bone
disease characterized by bowed legs and deformed ribs; and in adults Vitamin D deficiency
results in osteoporosis [15].
The presence of the Vitamin D receptor in cells other than those involved in the regulation of
calcium metabolism (i.e. bone, kidney and the small intestines), led to the discovery of other
functions of 1α,25 (OH)2D3 that are not associated with calcium and phosphorus homeostasis
[16]. In recent years, 1α, 25 (OH)2D3 has been shown to be involved in the regulation of cell
proliferation, differentiation, and immunomodulation. Many of these activities suggest potential
therapeutic applications for 1α, 25(OH)2D3 in a variety of diseases including cancer [17, 18].
Despite its pleiotropic applications, a major limitation to the use of 1α, 25(OH)2D3 as a
therapeutic agent is its potent calcemic activity, which leads to hypercalcemia. When used at
supraphysiological levels, 1α, 25(OH)2D3 results in the formation of renal stones, soft tissue
calcification and can even be lethal [19, 20]. Also, 1α, 25(OH)2D3 has a short half-life as it is
rapidly metabolized in its target tissue by a multi-catalytic enzyme cytochrome P450 24A1
hydroxylase (CYP24A1) [21].

137
The calcemic effects and short half-life of 1α,25(OH)2D3, has stimulated a search for alternative
Vitamin D analogs with a longer half-life and which only weakly stimulate bone calcium
mobilization or intestinal calcium absorption, while retaining the desired biological activity [11,
22, 23] These Vitamin D analogs are synthesized by altering the structure of A–ring, seco–B–
ring, CD–ring, and/or the side chain of 1α,25(OH)2D3 (Figure 4.3). The rationale behind such
structural modifications is aimed to specifically resist CYP24A1-mediated metabolism thus
extending the half-life of the analogs, in-turn prolonging their biological activities within target
cells [11, 22, 23].
4.3 Metabolism of 1α, 25(OH)2D3 by CYP24A1 Hydroxylase
1α, 25(OH)2 D3 is rapidly inactivated in its target tissues through modification of the side-chain
and the A-ring in four different pathways as illustrated in Figure 4.2. The C-24 oxidation
pathway, is the major metabolic pathway, and it is initiated by hydroxylation at C-24 by
CYP24A1 and yields the end product calcitroic acid [24, 25] . The C-23 and C-26 oxidation
pathways are minor metabolic pathways initiated by hydroxylation at C-23 and C-26
respectively, and both lead to the formation of the end product, 1α,25(OH)2-23,26-lactone [26-
28]. In a Vitamin D supplemented state, excess 25(OH) D3 may also be converted to other
similar side-chain metabolites via the C-23 and C-24 oxidation pathways leading to the
termination of their physiological activity [29]. The C-3 epimerization pathway, is the only A-
ring modification pathway and leads to the inversion of configuration of the C-3 hydroxyl group
from β to α, yielding 1α,25(OH)2-3epi-D3. The C-3 epimerization pathway was first reported in
human keratinocytes by Reddy et al. and has since been observed in human colon carcinoma

138
cells, bovine parathyroid cells, rat osteosarcoma cells, and various cultured cell lines [30-32].
Significantly, 1α, 25(OH)2-3-epi-D3, has been found to be equipotent with 1α,25 (OH)2D3 but
without its calcemic effects and it is therefore considered a potential therapeutic agent [33, 34].
Figure 4.2: Metabolic pathways of 1α, 25 (OH)2 D3. Adapted from [35]

139
4.4 Project Goal
In the work presented in this chapter, we investigated the metabolism of two Vitamin D3 analogs
possessing a 16-ene-23-yne modification (Figure 4.3). Analogs with the 16-ene-23-yne were
synthesized with the aim of blocking metabolic inactivation through the C23 and C24 oxidation
pathways. 1α, 25-dihydroxy-16-ene-23-yne-Vitamin-D3 [2], the archetype of all analogs
featuring 16-ene-23-yne modification, was found to have 4- to 12-fold higher potency than
1α,25(OH)2D3 in inducing differentiation and inhibiting proliferation of human myeloid
leukemia cells without causing hypercalcemia [36, 37]. The mechanism of the metabolism of 2,
has however not been studied. In this work we investigated the metabolism of 2. We also
investigated the metabolism of 1α, 25-dihydroxy-16-ene-23-yne-26, 27-dimethyl-Vitamin-D3
[3], which is structurally similar to 2 except the distal carbon has been extended with methyl
groups. Other analogs with a similar methyl extension as 3 were found to have remarkable
biological properties when compared to 1, and some have even entered clinical drug
development stage [38, 39].
We also investigated the metabolism of 1α, 25(OH)2-3-epi-D3 (4) in comparison to that of 1. As
discussed previously, 3 was found to be equipotent to 1 in inhibiting cellular proliferation and in
suppressing parathyroid hormone secretion in bovine parathyroid cells. Compound 3 however,
does not have the calcemic effects of 1 which makes it a potential therapeutic agent [33, 34]. To
understand the mechanisms associated with the biological activity of 3, we investigated its
metabolism by CYP 24A1 and compared it to the metabolism of 1 by the same enzyme.

140
1 2
34
A
C D
Side-Chain
Seco-B-ring
1α3β
25
Figure 4.3 The chemical structures of 1α, 25-dihydroxyVitamin D3 [1], Its analogs 1α, 25-dihydroxy-16-ene-23-yne-Vitamin D3 [2], and 1α, 25-dihydroxy-16-ene-23-yne-26, 27 dimethyl Vitamin D3 [3], and its natural metabolite 1α, 25-dihydroxy-3-epi-Vitamin D3 [4]

141
4.5 Materials and Methods
This work was done in collaboration with Dr. G. Satyarayana Reddy of Epimer LLC and Brown
University and his former doctoral student Dr. Steve Rhieu. All metabolism and HPLC
experiments were performed by Steve Rhieu.
Chemicals
Crystalline 1, 2, 3, 4, 25-hydroxyVitamin D3 (25(OH)D3), 1α, 25,26-trihydroxy-16-ene-23-yne-
Vitamin D3 were synthesized by Dr. Milan Uskokovic (Hoffman-La-Roche, Nutley, NJ). All
known natural metabolites of 1 were biologically synthesized using an isolated perfused kidney
(IPK) as described previously [40]. All other chemicals were purchased from Sigma-Aldrich (St.
Louis, MO) and used without further purification.
Preparation of enzymes
Recombinant rat CYP24A1 was expressed in E.Coli and purified as previously described [41].
Purified CYP24A1 samples with A417/A280 ratio exceeding 1.0 were considered pure for
biochemical assay. Bovine adrenodoxin (ADX) and adrenodoxin reductase (ADR) were
expressed in E. Coli and purified as described [41, 42]. All enzymes were purified using an
AKTATM FPLC system (GE Healthcare, Chalfont St. Giles, UK) and stored at -80 oC prior to
use.
CYP24A1 Reconstitution assay
The CYP24A1 reconstitution assay consisted of a mixture CYP24A1 (0.5 µM), ADX (0.5µM),
ADR (0.5 µM), and Vitamin D substrate i.e. compounds 1-4 (5µM) in 1 mL of 50 mM
phosphate buffer, pH 7.4. After pre-incubation at 37 °C for 15 min, the reaction was initiated by

142
addition of NADPH (Final concentration 1 mM). After incubation at 37 oC for 5 minutes, the
reactions were terminated by adding 2 mL of methanol followed by the addition of 2 µg of
25(OH)2 D3 as an internal standard. A time course study of metabolism of 2, 3 and 4 was
performed as described above except the buffer contained 0.1 µM ADX, 0.1 µM ADR, and 0.4
µM CYP24A1 over a 5-60 minute time period.
Extraction of Lipid-Soluble and Water Soluble Metabolites
After termination of the metabolism reaction with methanol, the reactants were extracted by
adding 4 mL of dichloromethane (DCM). The organic layer containing lipid-soluble metabolites
was evaporated under a stream of nitrogen and the residue re dissolved in hexane/isopropanol
(85:15, v/v) for HPLC analysis. The aqueous layer containing the water-soluble metabolites was
acidified with a drop of concentrated hydrochloric acid and re-extracted with DCM. The DCM
fraction was dried with a stream of nitrogen and the residue re-dissolved in
hexane/isopropanol/methanol (80:10)19, v/v/v) for HPLC analysis.
It should be noted that only the lipid soluble metabolites of 2 and 3 in comparison to the lipid-
soluble metabolites of 1 were analyzed while the water soluble metabolites of 4 in comparison to
those of 1 were analyzed. The lipid soluble metabolites of 4, were a focus of a previous
dissertation from Vouros lab [43].

143
Purification of metabolites using High-performance liquid chromatography (HPLC)
The isolated extracts obtained from the CYP24A1 reconstituted assays were subjected to HPLC
analysis using a Waters System Controller (Millennium 3.2). A photodiode array detector
(Model 996) was used to monitor the typical spectral characteristics of the Vitamin D cis/triene
chromophore (λmax at 265 nm and λmin at 228 nm). HPLC separation was performed on a normal-
phase HPLC column Zorbax-SIL column (250 mm × 4.6 mm) (Dupont, Wilmington, DE). In the
analysis of 1, 2 and 3 three different solvent mixtures at a flow rate of 2 mL/min were used, as
follows: (1) 10% isopropanol in hexane for initial separation, (2) 6% isopropanol in hexane for
enhanced resolution of the metabolites, (3) 15% isopropanol in methylene chloride for further
purification. The metabolites produced from the IPK were purified in the same way as described
above. In the analysis of the metabolites of 4, two different solvent mixtures were used also at a
flow rate of 2 ml/min as follows: 1) 15% isopropanol hexane for separation of lipid-soluble
metabolites 2) 10% isopropanol and 10% methanol in hexane for water-soluble metabolites.
Gas Chromatography/Mass Spectrometry (GC/MS)
GC/MS analysis was performed using an Agilent GC system 6890 equipped with a mass-
selective detector MSD5973. Prior to GC-MS analysis, the metabolites collected from the HPLC
purification step were first trimethylsilylated in a 1:1 (v/v) mixture of anhydrous acetonitrile and
Power SIL-Prep (Alltech Associates, Deerfield, IL) at a final concentration of 10 µg/mL and
incubated at 70 °C for 15 min. All samples were analyzed on a HP-5MS GC capillary column
(5% phenyl siloxane; 30 m × 0.25 mm × 0.25 μm). A 5µl injection of each sample was made into
the injector port in the split mode at a ratio of 1:10. The inlet temperature was set to 230 oC, a

144
temperature gradient was used for separation as follows: the oven temperature was initially at
150 °C and ramped at a rate of 10 °C/min to final temperature of 300 °C, the temperature was
held at 300 oC for 5 minutes. Helium was used as a carrier gas at a flow rate of 0.8 mL/min. Full-
scan electron impact spectra across the mass range of m/z 50-800 were acquired in each run and
the published spectra were averaged and background subtracted.
ESI-MS analysis (Infusion)
The molecular weight of the metabolites of 3 was confirmed by ESI-MS analysis. The substrate
and its metabolites were directly infused into the mass spectrometer at a flow rate of 10
µL/minute. Prior to infusion, the underivatized Vitamin D compounds were dried down under
vacuum and reconstituted in acetonitrile modified with 0.1% formic acid to a final concentration
of 2 µg/mL.
Mass spectrometry data were acquired on an Agilent 6330 Ion Trap mass spectrometer (Santa
Clara, CA) operated in the positive ion mode, with N2 as a dying gas and the capillary voltage
held at -1900V. Full scan mass spectra of each compound were acquired with a mass range of
100-650 a.m.u. 6300 Series Ion Trap HPLC-MS software Vers. 6.1 and 6300 Series Trap Control
Software Vers. 6.1 (Bruker Daltonik, Bremen Germany), were used to control the instrument and
for data processing.
Periodate oxidation of metabolites of 3
The metabolites of 3 (g* and h* (Figure 4.4)) from the CYP24A1 reconstitution assay were
purified as described above. Each metabolite (1µg) in 15 µL of methanol was subjected to

145
treatment with 15 µL of 5% (w/v) sodium periodate at 25 °C for 30 min. Sodium periodate was
used to determine if any of these two metabolites contained a vicinal diol. The reaction products
were dried under nitrogen and subjected to HPLC analysis.
4.6 Results and Discussion
4.6.1 Metabolism of Vitamin D Analogs by CYP24A1
Isolation of Metabolite by HPLC
The HPLC profiles of the lipid soluble metabolites of 1, 2 and 3 produced by CYP24A1 are
shown in Figure 4.4. As expected, 1 was extensively metabolized into several polar metabolites
as shown in Figure 4.4A. The metabolites of 1 were identified as 1α,24(R),25(OH)3D3 (d*),
1α,25(OH)2-24-oxo-D3 (a*), 1α,23(S),25(OH)3-24-oxo-D3 (c*), 1α,23(OH)2-24,25,26,27-
tetranor-D3 (b*), and calcitriol lactone (e*) based on co-elution with the authentic standards of
the known metabolites of 1 [44, 45]. The analog 2 was metabolized into a single polar
metabolite (f*) while the analog 3 was metabolized into two polar metabolites, g* and h*
(Figure 4.4B and 4.4C). For structural characterization of the metabolites f*, g*, h*, each
metabolite was isolated by HPLC then the trimethylsilylated derivative of each compound was
subjected to GC-MS analysis.

146
3
Figure 4.4 HPLC profiles of the lipid soluble metabolites of the substrates 1, 2 and 3. For metabolite quantitation 25 (OH) D3 was used as the internal standard (IS)
Structural Characterization of the metabolites of 2 and 3
Structural characterization of Vitamin D compounds is usually done by GC-MS due to the
reproducibility and predictability of GC-MS mass spectra. Vitamin D compounds are not volatile
and are usually first derivatized with trimethylsilyl (TMS) to increase their volatility. GC-MS
analysis of derivatized Vitamin D compounds yields characteristic fragment ions that are unique

147
to derivatized Vitamin D compounds. The electron impact (EI) mass spectral pattern of 1α, 25
(OH)2 D3 is used as a template in assignment of fragment ions of Vitamin D compounds. The EI-
mass spectrum of derivatized 1α, 25 (OH)2 D3 is depicted in Figure 4.5. In addition to the
molecular ion, M+. (m/z 632), fragment ions resulting from the successive losses of TMSOH
groups (a loss of 90 mass units) from each trimethylsilylated hydroxyl group are observed. The
fragment ions at m/z 217 and m/z 501 [M – 131]+ originate from the cleavage of the A-ring. The
A-ring fragment ions are characteristic to Vitamin D compounds with two hydroxyl groups (-
OTMS after derivatization) at C-1 and C-3 and are detected in all Vitamin D compounds in
which the seco-steroid structure (A-Ring) remains intact after metabolism, or in new analogs
with that structural feature. The fragment ion at m/z 131, is from cleavage of the side chain at
C24-C25, a fragmentation that is also characteristic to derivatized Vitamin D compounds and is
also used as a diagnostic ion in identifying changes to 1α, 25 (OH)2D3 either in synthetic analogs
or in metabolites.

148
Figure 4.5 Fragmentation of TMS derivative of 1α, 25 (OH)2 D3. This fragmentation pattern serves as a template in the structural identification of Vitamin D compounds.
Structural characterization of the Vitamin D compounds analyzed in this work was based on
comparison of each metabolite’s mass spectral characteristics with mass spectral characteristics
of its respective precursor analog. The fragmentation of 1 was used as a template in assigning
fragment ions of the analogs whose mass spectral characteristics were in turn used as templates
in assigning structural changes of their respective metabolites. Prior to GC-MS analysis, each
compound was derivatized to its trimethylsilyl (TMS) ether to increase its volatility.

149
The mass spectra of 2-TMS and its metabolite f* are shown in Figures 4.6A and 4.6B
respectively. The mass spectrum of 2-TMS exhibited a molecular ion at m/z 626 [M]+.. The
spectrum also exhibited fragment ions at m/z 536 [M-90]+. and m/z 446 [M-(2x90)]+. from the
sequential losses of trimethylsilanol (TMSOH) moieties. The mass spectrum also exhibited
additional fragment ions that are characteristic of derivatized Vitamin D compounds at m/z 217,
m/z 495 and m/z 131. The fragment ions at m/z 217 and m/z 495 [M-131]+, are associated with
cleavage of the A-ring, while the fragment ion at m/z 131 arises from the cleavage of the side-
chain across C24-C25. These characteristic fragment ions are significant in establishing whether
the integrity of the A-ring or the side-chain is maintained after metabolism or in newly
synthesized Vitamin D compounds.
The mass spectrum of trimethylsilylated f* (f*-TMS), exhibited an ion at m/z 624 as its highest
detectable mass (Figure. 4.6B) but did not exhibit the molecular ion peak at m/z 714 since the
latter is beyond the mass range of our instrument. However, the molecular mass can be inferred
indirectly from consideration of the masses of key fragment ions. Specifically, the presence of
the fragment ion at m/z 583 ([M−131]+, from the cleavage of the A-ring, can be related to a
parent ion of m/z 714. Based on this finding, we concluded that metabolite f* differed from its
parent compound by an additional hydroxyl group (-OTMS after derivatization). Moreover, the
fragment ions at m/z 624 ([M−90]+.) and m/z 534 ([M-2x90]+.) reflected the sequential losses of
TMSOH moieties further supporting the conclusion that they originate from a molecular species
of m/z 714. The mass spectrum of f* also exhibited fragment ions at m/z 217 and m/z 583 an
indication that the integrity of the A-ring was maintained which ruled out the possibility of the
A-ring being the site of hydroxylation. The absence of the fragment ion at m/z 131 that had been

150
observed in the precursor molecule 2 is indicative of a modification to the end of the side chain.
The presence of a fragment ion at m/z 611 [M−103]+ represented a loss of [·CH2OTMS] group
from the side chain of f* suggesting C26 as the possible site of hydroxylation. The fragment ion
at m/z 147 [(Me3-Si-O-Si-Me2)+] indicated the presence of two trimethylsilyloxy groups in close
proximity [46] at C25 and C26, which further confirmed C26 as the site of hydroxylation
(Figure 4.6B). Conclusive structural assignment of f* as C26-hydroxy-2, was based on
comparison of the mass spectral characteristics of the synthetic standard of 1α, 25,26(OH)3-16-
ene-23-yne-D3 which gave a fragmentation pattern virtually identical to that of f*-TMS (Figure
4.6C).

151
Figure 4.6 Mass spectra (GC-EI-MS) of the analog 2(A), and its metabolite f* (B), and an authentic standard of 1α, 25, 26(OH)3-16-ene-23-yne-D3 (C)

152
Structural Identification of metabolites of 3
As in the previous case, the mass spectrum of the precursor analog 3 (trimethylsilylated) was
used as a template for comparison with the mass spectral characteristics of its metabolites g* and
h*. The mass spectrum of 3, shown in Figure 4.7A, exhibited a molecular ion ([M]+.) at m/z
654. The mass spectrum also exhibited the fragments associated with sequential losses of
trimethylsilanol (m/z 564 and m/z 474), the characteristic fragment ions arising from the
cleavage of the A-ring at m/z 217 and at m/z 523 ([M−131]+), and the fragment ion arising from
the side-chain cleavage across the C24-C25 bond at m/z 159.
While missing the molecular ion peak of m/z 742 due to limited mass range of the instrument, by
analogy to its precursor compound, the spectra of trimethylsilylated g* (g*TMS) and h*
(h*TMS) exhibited fragment ions at m/z 652 [M-90]+., m/z 562 [M-2x90]+. and m/z 611 [M-
131]+ which provided indirect evidence about the molecular weights (742 Da) of the TMS
derivatized metabolites. These results also suggested that the metabolites g* and h* differed from
their precursor compound by an additional hydroxyl group. The GC-MS spectra of both
metabolites exhibited the characteristic fragment ion at m/z 217 an indication that the integrity of
their A-ring was maintained, thus ruling out the A-ring as the site of hydroxylation. The
characteristic fragment ion from the side-chain cleavage which had been observed at m/z 159 in
the spectrum of the precursor compound was shifted to m/z 247 in the spectra of both
metabolites which suggested that the site of hydroxylation on both metabolites was on the side-
chain, either at C26 or at C26a. The fragment ions at m/z 117 and m/z 625 in the spectrum of g*
suggested C26 was the site of hydroxylation (Figure 4.7B) while the fragment ion at m/z 103 in

153
the spectrum of h* was consistent with hydroxylation at C26a (Figure 4.7C).
Figure 4.7 Mass spectra (GC-EI-MS) of the analog 3 and its metabolites g* and h*

154
Confirmation of molecular mass of g* and h* by ESI-MS
As discussed above, the molecular ion of trimethylsilylated g* and h* was not observed with
GC-MS analysis. Electrospray ionization-MS (ESI-MS) was therefore used to detect the intact
molecules of g* and h* (Figure 4.8). ESI-MS is used to detect the intact molecule because it is a
soft-ionization technique thus extensive fragmentation of molecules does not occur unlike with
electron impact-MS (EI-MS) the ionization mode used in GC-MS.
As in the previous studies, the mass spectrum of the precursor analog was compared with the
mass spectrum of its respective metabolites. The full scan mass spectrum acquired for 3,
exhibited a sodiated molecular ion [M+Na]+, at m/z 461. Similarly, the metabolites g* and h*
were detected as sodium adducts, both at m/z 477 (Figure 4.8B and 4.8C). The ESI-MS are in
agreement with addition of a single hydroxyl group to each metabolite because the molecular
weight of both metabolites is 16 Da higher than that of the precursor compound 3.

155
Figure 4.8 ESI-MS analysis of the analog 3 and its metabolites g* and h*, ESI-MS analysis was done to confirm the molecular weight of the metabolites since the molecular ion was not observed in GC-MS.
Periodate oxidation of g* and h*
The proposed structures of g* and h* from the MS results, showed that the two metabolites had
the same mass, but differed in the position of the hydroxyl group, with g* hydroxylated at C26
and h* hydroxylated at C26a. The two metabolites were therefore tested with sodium periodate

156
for the presence of a vicinal hydroxyl functionality. Periodate oxidizes vicinal hydroxyls to form
less polar carbonyl compounds [21]. The HPLC profile of g* and h* after reaction with sodium
periodate, shown on Figure 4.9 indicated that g* was oxidized to a less polar compound g**,
while h* resisted oxidation. These served to confirm the structural assignment of g* and h* as
C26-hydroxyl-3 and C26a-hydroxyl-3 respectively (Figure 4.8B and 4.8C).
Figure 4.9 HPLC profiles of the metabolites g* and h* before (panel A and C) and after periodate oxidation (panel B and D). The metabolite g* is oxidized to a less polar metabolite (g**) an indication it contains a vicinal hydroxyl.

157
Metabolic Stability of Vitamin D analogs 2 and 3
The metabolic stability of 2 and 3 in relation to 1 after incubation with CYP24A1 was
determined by HPLC analysis. The concentration of each unmetabolized substrate and its
metabolites was determined by comparing the area under the LC peak of the each substrate and
its respective metabolite(s). The results, shown on Figure 4.10, indicated that 2 and 3 were more
stable than 1, with 4.2 µM (84%) of 2, and 2.53 µM (50.6 %) of 3 remaining un-metabolized
when compared to 1.64 µM (32.8%) of 1.
3
Figure 4.10 The relationship between un-metabolized 1, 2 and 3 and their respective lipid soluble metabolites produced from incubation with CYP24A1. The concentration of each compound was based on HPLC analysis

158
4.6.2 Metabolism studies of 1α,25(OH)2D3 and 1α,25(OH)2-3-epi-D3 using rat CYP24A1 reconstitution system.
To understand the metabolic pathway undertaken by the C3-epimer (4) of 1α,25(OH)2D3 (1), we
investigated the metabolism of 4 by CYP24A1 and compared it to the metabolism of 1. The lipid
soluble metabolites of 4, were a focus of a previous thesis from the Vouros group and are not
discussed here [43]. The water soluble metabolites were therefore analyzed in this study. 1, is
metabolized by CYP24A1 to a single water soluble metabolite calcitroic acid and this was used
as a reference in establishing the metabolism of 4.
The HPLC chromatogram of the water-soluble metabolites of 1 and 4 are shown on Figure
4.11A and 4.11B respectively. 1 and 4 were each metabolized to a single water-soluble
metabolite (X and X*) by CYP24A1, which were isolated for structural characterization by GC-
MS. Metabolite X, is known to be the final product of the metabolism of 1, calcitroic acid.

159
Ab
sorb
ance
at 2
65 n
m
Abso
rban
ceat 265
nm
A B
Figure 4.11 The HPLC profiles of the water soluble metabolite of 1 and 3, cholacalcioic acid was used as the internal standard (IS-2)
Structural identification of water-soluble metabolites X and X* using GC-MS
After isolation and purification with HPLC, each metabolite (X and X*) was subjected subjected
to GC-MS analysis for structural characterization. Prior to analysis, the metabolites and their
respective substrates were derivatized into their respective TMS ethers to increase their
volatility. The mass spectra of the trimethylsilylated metabolites are shown in Figure 4.12.
The trimethylsilylated metabolite of X (X-TMS) exhibited a molecular ion at m/z 590. The mass
spectrum also exhibited fragment ions at m/z 500 and m/z 410 which were attributed to the
sequential losses of trimethylsilanol moieties (90 Da). The characteristic fragment ions at m/z
217 and m/z 459 ([M-131]+) were derived from A-ring cleavage. Another characteristic
fragment ion was observed at m/z 117 which is indicative of a loss of the TMS-derivatized

160
COOH group accounts for the fragment ion at m/z 117, indicating the presence of a TMS ester
function in the side-chain of X. As shown in Figure 4.12B, the mass spectral analysis of
trimethylsilylated metabolite X* gave a fragmentation pattern virtually identical to that of X-
TMS. Although the two compounds (X and X*) had the same mass, they exhibited different
retention times in GC, at 22.97 (X) minutes and 22.05 (X*) minutes. The difference in retention
time was evidence that these were different compounds
Figure 4.12 GC-MS spectra of the water soluble metabolites of 1α,25(OH)2D3 and 1α,25(OH)2-3-epi-D3. Although the mass spectra area identical the two compounds elute at different GC retention times.
161
Metabolic stability of 1α,25(OH)2-3-epi-D3 over 1α,25(OH)2D3
For direct comparison of metabolite levels measured by HPLC, 1α,25(OH)2D3 and 1α,25(OH)2-
3-epi-D3 were incubated at the same concentration of the two substrates 1 and 4 in a rat
CYP24A1 reconstituted system (details in methods). Relative amounts of un-metabolized
substrates and their respective metabolites are shown in Figure 4.13. The amounts of un-
metabolized substrates of 1α,25(OH)2D3 and 1α,25(OH)2-3-epi-D3 were not significantly
different from each other. However, the amount of 3-epi-calcitroic acid (the water soluble
metabolite of 4) was ~three-fold lower than that of calcitroic acid. This finding provides
definitive evidence that 1α,25(OH)2-3-epi-D3, shows higher metabolic stability over its parent
substrate although both are readily metabolized through the C24 oxidation pathway.

162
Figure 4.13 Comparison of the metabolism of 1 and 4. 1 is metabolized faster than 4.
In the work presented above, using a combination of mass spectrometry (GC-MS and ESI-MS)
and HPLC analysis, we have demonstrated that Vitamin D analogs with a 16-ene-23-yne
modification resist metabolism by CYP24A1 when compared to 1α, 25 (OH)2 D3. The presence
of the triple bond on the side-chain protects the analogs from hydroxylation through the C23 and
C24 pathways although they are still susceptible to C25 hydroxylation. However, as shown with

163
the analog 3, extending the distal carbon with an additional methyl group at C26 makes this
compound more susceptible to CYP24A1 hydroxylation.
In the present work, we also established that 1α, 25 (OH)-3-epi-D3 is metabolized by C24A1 to
3-epi calcitroic acid, as illustrated in Figure 4.14. This establishes that both 1α, 25 (OH)2 D3 and
its C3-epimer are metabolized through the same C24 oxidation pathways. The 3-epi calcitroic
acid is however produced at a ~3-fold lower concentration than that calcitroic acid which
provided proof that 1,25(OH)2-3-epi-D3 shows stability against CYP24A1 metabolism over
1,25(OH)2D3, providing a reason why 1α, 25-(OH)2-3-epi D3 exerts its biological activities for
longer duration than 1α, 25 (OH)2 D3.
4.7 Conclusions
The discovery of new biological functions of 1α, 25(OH)2D3, along with the development of
Vitamin D analogs, has reinvigorated the Vitamin D field over the past two decades. As
demonstrated in the work presented in this chapter, mass spectrometry remains at the forefront
for the structural characterization of Vitamin D compounds and their metabolic pathways.

164
Figure 4.14 The complete C24 oxidation pathway of the metabolism of 1α,25(OH)2D3 and 1α,25(OH)2-3-epi-D3 by CYP24A1

165
4.8 References:
1. Holick, M.F., et al., Photosynthesis of preVitamin D3 in human skin and the physiologic consequences. Science, 1980. 210(4466): p. 203-5.
2. Holick, M.F., Vitamin D: A millenium perspective. J Cell Biochem, 2003. 88(2): p. 296-307.
3. Cantorna, M.T., Vitamin D, multiple sclerosis and inflammatory bowel disease. Arch Biochem Biophys, 2011.
4. Davis, C.D., Vitamin D and cancer: current dilemmas and future research needs. Am J Clin Nutr, 2008. 88(2): p. 565S-569S.
5. Davis, C.D., et al., Vitamin D and cancer: current dilemmas and future needs. Nutr Rev, 2007. 65(8 Pt 2): p. S71-4.
6. Hewison, M., Vitamin D and the immune system: new perspectives on an old theme. Endocrinol Metab Clin North Am, 2010. 39(2): p. 365-79, table of contents.
7. Blunt, J.W., H.F. DeLuca, and H.K. Schnoes, 25-hydroxycholecalciferol. A biologically active metabolite of Vitamin D3. Biochemistry, 1968. 7(10): p. 3317-22.
8. Blunt, J.W., Y. Tanaka, and H.F. DeLuca, Biological activity of 25-hydroxycholecalciferol, a metabolite of Vitamin D3. Proc Natl Acad Sci U S A, 1968. 61(4): p. 1503-6.
9. Holick, M.F., H.K. Schnoes, and H.F. DeLuca, Identification of 1,25-dihydroxycholecalciferol, a form of Vitamin D3 metabolically active in the intestine. Proc Natl Acad Sci U S A, 1971. 68(4): p. 803-4.
10. Holick, M.F., et al., Isolation and identification of 1,25-dihydroxycholecalciferol. A metabolite of Vitamin D active in intestine. Biochemistry, 1971. 10(14): p. 2799-804.
11. Plum, L.A. and H.F. DeLuca, Vitamin D, disease and therapeutic opportunities. Nat Rev Drug Discov, 2010. 9(12): p. 941-55.
12. Tanaka, Y. and H.F. Deluca, Bone mineral mobilization activity of 1,25-dihydroxycholecalciferol, a metabolite of Vitamin D. Arch Biochem Biophys, 1971. 146(2): p. 574-8.
13. Haussler, M.R., et al., The role of Vitamin D in the FGF23, klotho, and phosphate bone-kidney endocrine axis. Rev Endocr Metab Disord, 2011.
14. Norman, A.W., J.A. Putkey, and I. Nemere, Intestinal calcium transport: pleiotropic effects mediated by Vitamin D. Fed Proc, 1982. 41(1): p. 78-83.
166
15. Kanis, J.A., Biochemical markers in osteoporosis. Scand J Clin Lab Invest Suppl, 1997. 227: p. 6-11.
16. Stumpf, W.E., et al., Target cells for 1,25-dihydroxyVitamin D3 in intestinal tract, stomach, kidney, skin, pituitary, and parathyroid. Science, 1979. 206(4423): p. 1188-90.
17. Bouillon, R., W.H. Okamura, and A.W. Norman, Structure-function relationships in the Vitamin D endocrine system. Endocr Rev, 1995. 16(2): p. 200-57.
18. Nagpal, S., S. Na, and R. Rathnachalam, Noncalcemic actions of Vitamin D receptor ligands. Endocr Rev, 2005. 26(5): p. 662-87.
19. Jones, G., Pharmacokinetics of Vitamin D toxicity. Am J Clin Nutr, 2008. 88(2): p. 582S-586S.
20. Vieth, R., Vitamin D supplementation, 25-hydroxyVitamin D concentrations, and safety. Am J Clin Nutr, 1999. 69(5): p. 842-56.
21. Beckman, M.J., et al., Human 25-HydroxyVitamin D3-24-Hydroxylase, a Multicatalytic Enzyme†. Biochemistry, 1996. 35(25): p. 8465-8472.
22. Brown, A.J., Vitamin D analogues. Am J Kidney Dis, 1998. 32(2 Suppl 2): p. S25-39.
23. Brown, A.J. and E. Slatopolsky, Vitamin D analogs: therapeutic applications and mechanisms for selectivity. Mol Aspects Med, 2008. 29(6): p. 433-52.
24. Reddy, G.S. and K.Y. Tserng, Calcitroic acid, end product of renal metabolism of 1,25-dihydroxyVitamin D3 through the C-24 oxidation pathway. Biochemistry, 1989. 28(Copyright (C) 2011 American Chemical Society (ACS). All Rights Reserved.): p. 1763-9.
25. Reddy, G.S., et al., Isolation and identification 1,23-dihydroxy-24,25,26,27-tetranorVitamin D3, a new metabolite of 1,25-dihydroxyVitamin D3 produced in rat kidney. Biochemistry, 1987. 26(Copyright (C) 2011 American Chemical Society (ACS). All Rights Reserved.): p. 324-31.
26. Napoli, J.L. and R.L. Horst, C(24)- and C(23)-oxidation, converging pathways of intestinal 1,25-dihydroxyVitamin D3 metabolism: identification of 24-keto-1,23,25-trihydroxyVitamin D3. Biochemistry, 1983. 22(25): p. 5848-53.
27. Reinhardt, T.A., et al., A new in vivo metabolite of Vitamin D3: 1,25,26-trihydroxyVitamin D3. Biochem Biophys Res Commun, 1981. 99(1): p. 302-7.
28. Reinhardt, T.A., et al., 1 Alpha-25,26-trihydroxyVitamin D3: an in vivo and in vitro metabolite of Vitamin D3. Biochemistry, 1981. 20(21): p. 6230-5.
29. Reddy, G.S., et al., 23-carboxy-24,25,26,27-tetranorVitamin D3 (calcioic acid) and 24-carboxy-25,26,27-trinorVitamin D3 (cholacalcioic acid): end products of 25-

167
hydroxyVitamin D3 metabolism in rat kidney through C-24 oxidation pathway. Arch Biochem Biophys, 2006. 455(1): p. 18-30.
30. Sekimoto, H., et al., 1alpha,25-dihydroxy-3-epi-Vitamin D3: in vivo metabolite of 1alpha,25-dihydroxyVitamin D3 in rats. FEBS Lett, 1999. 448(2-3): p. 278-82.
31. Singh, R.J., et al., C-3 epimers can account for a significant proportion of total circulating 25-hydroxyVitamin D in infants, complicating accurate measurement and interpretation of Vitamin D status. J Clin Endocrinol Metab, 2006. 91(8): p. 3055-61.
32. Siu-Caldera, M.L., et al., Production of 1alpha,25-dihydroxy-3-epi-Vitamin D3 in two rat osteosarcoma cell lines (UMR 106 and ROS 17/2.8): existence of the C-3 epimerization pathway in ROS 17/2.8 cells in which the C-24 oxidation pathway is not expressed. Bone, 1999. 24(5): p. 457-63.
33. Brown, A.J., et al., Isolation and identification of 1alpha-hydroxy-3-epi-Vitamin D3, a potent suppressor of parathyroid hormone secretion. J Cell Biochem, 2005. 96(3): p. 569-78.
34. Molnar, F., et al., 1alpha,25(OH)2-3-epi-Vitamin D3, a natural physiological metabolite of Vitamin D3: its synthesis, biological activity and crystal structure with its receptor. PLoS One, 2011. 6(3): p. e18124.
35. Ishizuka, S., et al., Antagonistic Action of Novel 1α,25-DihydroxyVitamin D3-26,23-Lactone Analogs on 25-HydroxyVitamin-D3-24-hydroxylase Gene Expression Induced by 1α,25-Dihydroxy-Vitamin D3 in Human Promyelocytic Leukemia (HL-60) Cells. Archives of Biochemistry and Biophysics, 2000. 380(1): p. 92-102.
36. Zhou, J.Y., et al., 1,25-Dihydroxy-16-ene-23-yne-Vitamin D3 prolongs survival time of leukemic mice. Proc Natl Acad Sci U S A, 1990. 87(10): p. 3929-32.
37. Zhou, J.Y., et al., Novel Vitamin D analogs that modulate leukemic cell growth and differentiation with little effect on either intestinal calcium absorption or bone mobilization. Blood, 1989. 74(1): p. 82-93.
38. Adorini, L., et al., Inhibition of prostate growth and inflammation by the Vitamin D receptor agonist BXL-628 (elocalcitol). The Journal of Steroid Biochemistry and Molecular Biology, 2007. 103(3–5): p. 689-693.
39. Peleg, S., et al., Inhibition of prostate cancer-meditated osteoblastic bone lesions by the low-calcemic analog 1α-hydroxymethyl-16-ene-26,27-bishomo-25-hydroxy Vitamin D3. The Journal of Steroid Biochemistry and Molecular Biology, 2005. 97(1–2): p. 203-211.
40. Reddy, G.S. and K.Y. Tserng, Calcitroic acid, end product of renal metabolism of 1,25-dihydroxyVitamin D3 through C-24 oxidation pathway. Biochemistry, 1989. 28(4): p. 1763-9.

168
41. Annalora, A., et al., Rat cytochrome P450C24 (CYP24A1) and the role of F249 in substrate binding and catalytic activity. Arch Biochem Biophys, 2004. 425(2): p. 133-46.
42. Sagara, Y., et al., Direct expression of adrenodoxin reductase in Escherichia coli and the functional characterization. Biol Pharm Bull, 1993. 16(7): p. 627-30.
43. Flarakos, C.C., Applications of mass spectrometry techniques to the elucidation of novel metbaolic pathways of Viatmin D and the quantitation of DNA adducts., in Chemistry and Chemical Biology. 2008, Northeasten University: Boston. p. 216.
44. DeLuca, H.F., The metabolism and functions of Vitamin D. Adv Exp Med Biol, 1986. 196: p. 361-75.
45. Esvelt, R.P., H.K. Schnoes, and H.F. DeLuca, Isolation and characterization of 1.alpha.-hydroxy-23-carboxytetranorVitamin D: a major metabolite of 1,25-dihydroxyVitamin D3. Biochemistry, 1979. 18(18): p. 3977-3983.
46. Sloan, S., D.J. Harvey, and P. Vouros, Interaction and rearrangement of trimethylsilyloxy functional groups. The structural significance of the m/e 147 ion in the mass spectra of trimethylsil steroidal ethers. Organic Mass Spectrometry, 1971. 5(7): p. 789-799.

169
Chapter 5:
Preliminary Results and Future Directions.

170
This chapter summarizes some preliminary results and also offers recommendations for future
work.
5.1 Preliminary Results
The work presented in chapter 3 of this thesis, highlighted the importance of using multiple
analytical platforms for structural characterization of metabolites. A critical analytical step that
was not discussed was sample preparation which dictates the types of metabolites extracted and
the amount of metabolites available, which can dramatically affect the quality of the subsequent
data.
In chapter 3, for the purposes of LC-MS and NMR analysis, which require more sample (have
higher LODs) than LC-EC, the amount of plasma was scaled-up from the initial profiling
experiments from 125 µl to 2.5 ml (Figure 5.1). Also, after metabolite extraction, the
supernatant was dried down and re-dissolved in a smaller volume (100 µl) of mobile phase, for a
10-fold increase in metabolite concentration prior to LC fractionation. Analytical results however
showed only a 2-fold increase in metabolite concentration, an indication that there were
significant sample losses. This was of concern because most of the metabolites of interest are
present at very low levels. If not recovered adequately we might not detect them in LC-MS and
especially in NMR.
In light of the sample loss concerns, we are now working towards improving our sample
recovery to ensure that we can detect all analytes. We hypothesize that some of sample loss is
due to inefficiency in sample recovery and/or to analyte degradation. Presented in this section are

171
some preliminary results on use of DMSO as a keeper, and use of chelating agents as we work
towards improving our sample recovery.
125 µL Plasma Pool
Profiling Concentration Metabolite ID Concentration
2500 µL Plasma Pool
500 µL ACN/0.4 % Acetic Acid
10 mLACN/0.4 % Acetic Acid
Evaporate Supernatant
Evaporate Supernatant
Reconstitute in 200 µL
Reconstitute in 100 µL
Inject 50 µL on Coularray
Inject 160 µL on LC-Fraction Collector
Collect 96 fractions
Reconstitute in 100 µL)
Reconstitute in 5-10 µl (NMR)
10x Concentrated
Figure 5.1 Flow-chart of the metabolite concentration

172
Efficiency in Sample Recovery using DMSO as a keeper:
To increase metabolite concentration, after metabolite extraction, our analytes of interest are pre-
concentrated by drying and re-suspending in a smaller volume of mobile phase. Losses are
thought to occur by adsorption to the walls of the micro-centrifuge tubes during drying. When
the extraction solvent (acetonitrile) is highly volatile as it dries out the analytes stick to the walls
of the tubes and when the extract is re-suspended in a smaller volume of solvent not all
metabolites are re-dissolved. As a first step to improve the recovery of our analytes, we added 10
µL of DMSO (as a keeper) to our extracted samples before drying. The role of a keeper is to
maintain the analytes in solution during the drying process thus reducing sample loss to the walls
of the tubes [1]. DMSO was chosen due to its high boiling point and its strong general solvating
properties (“universal solvent”). Preliminary results indicate that DMSO improved the recovery
of hydrophobic compounds, but had little effect on hydrophilic analytes. This is to be expected
as the more hydrophobic the analyte the higher its affinity toward acetonitrile solvation. Studies
are underway to replicate these results and to quantify the exact improvement in analyte
recovery.
Use of Chelating Agents to Reduce Analyte Degradation:
As stated previously, a second possible source of sample loss may occur through oxidation and
degradation.. Analyte degradation was thought to be from analyte oxidation by metals, which are
inevitably present, as they are released from metal co-factors that stabilize some proteins. These
metals are left in solution after protein precipitation, and are extracted with the metabolites and
may thus degrade our analytes of interest.

173
To remove these metals, we are exploring the use of chelating agents. To date, we have explored
three commonly used chelating agents: ethylenediamineacteic acid (EDTA),
ethyleneglycolactetic acid (EGTA) and citric acid. We added the chelating agents to our
extraction solvent, acidified acetonitrile. After metabolite extraction, the metabolite extract was
analysed by LC-EC.
When compared to extraction without a chelating agent, there were no observable changes of
metabolite concentration with EDTA or EGTA. However as shown in Figure 5.2, with citric
acid as a chelator, an overall increase in the metabolite concentration was observed. Although
both EDTA and EGTA are generally considered better chelating agents than citric acid, their
chelating efficiency is reduced at low pHs due to the high pKa of the acidic groups in both
EDTA and EGTA [2]. For example EDTA chelates at pH 4 and above [3] while our extraction
solvent is at pH 3.1.
Future work will be directed towards establishing whether the increase in metabolite
concentration is significant enough to allow detection of metabolites (by MS and NMR) that
were previously not detectable or whose signal was not high enough for characterization. More
work is also directed towards exploring other chelating agents which are active at low pH e.g.
oxalic acid.

174
Plasma Pool Extract with Citric acid
Plasma Pool Extract no Chelating Reagent
Figure 5.2 Comparison of metabolite extraction from human plasma using acidified acetonitrile (Top) and acidified acetonitrile modified with acid. The use of citric acid for extraction leads to an overall increase in metabolite concentration.

175
5.2 Future Directions
Microscale LC-MS-NMR Platform
Chapters 2 and 3 of this dissertation highlighted a streamlined approach of combining LC-MS
and offline NMR to ensure that each detector was utilized at its optimal sensitivity. This
approach was successfully utilized in the structural characterization of metabolites.
In Chapter 2, the use of an integrated LC-MS-NMR platform was demonstrated for analysis of
plant cell cultures was demonstrated. This approach utilized LC-UV as a rapid method for
profiling changes in cell cultures during optimization, followed by structural characterization of
the individual components of the optimized cell cultures. Future recommendations for cell
culture analysis would be to use tandem mass spectrometry in place of a UV-detector during
optimization. The use of MS/MS for analyte selection is much more specific and would reduce
interference from background and can also be useful if analytes of interest do not contain a
chromophore. In the example with benzophenanthridine alkaloids, we observed that all our
analytes of interest exhibited a similar neutral loss transition, thus the use of MS/MS would
provide more targeted and specific selection of analytes of interest.
Vitamin D analysis
Chapter 4 of this thesis illustrated GC-MS was utilized in the structural elucidation of vitamin D
compounds. GC-MS is expected to retain this role as the method of choice for structural
elucidation of Vitamin D compounds due to its reproducibility and predictability.
176
5.3 References
1. Matthiessen, A., Use of a keeper to enhance the recovery of volatile polycyclic aromatic hydrocarbons in HPLC analysis. Chromatographia, 1997. 45(1): p. 190-194.
2. Christian, G.D., Analytical Chemistry, Wiley, Editor. 2004. 3. Ke, J., et al., Quantitative liquid chromatographic–tandem mass spectrometric
determination of reserpine in FVB/N mouse plasma using a “chelating” agent (disodium EDTA) for releasing protein-bound analytes during 96-well liquid–liquid extraction. Journal of Chromatography B: Biomedical Sciences and Applications, 2000. 742(2): p. 369-380.


![Synthesis, NMR structural characterization and …323531/UQ323531.pdf · Synthesis, NMR structural characterization and molecular modeling of ... [2,6-8] Thiosemicarbazone having](https://static.fdocuments.in/doc/165x107/5a7d5f467f8b9a49588d82a1/synthesis-nmr-structural-characterization-and-323531uq323531pdfsynthesis.jpg)