The integration of human resource and operation management practices and its … · 2010-11-15 ·...
17
The integration of human resource and operation management practices and its link with performance: A longitudinal latent class study Lilian M. de Menezes a, *, Stephen Wood b,1 , Garry Gelade c,2 a Cass Business School, City University London, London, UK b School of Management, University of Leicester, UK c Business Analytic Ltd., London, UK 1. Introduction Markets are increasingly more competitive and global, so quality standards and product or service efficiency is crucial to the survival of any organization. In this context, the lean production concept has been increasingly advocated beyond manufacturing (e.g. in services: Abdi et al., 2006; Abernathy et al., 2000; Swank, 2003; in the public sector and healthcare: Kollberg et al., 2007). The spread and interest that it has attracted are possibly due to claims of cost and waste reduction, superior performance and competitive advantage that have been consistently made by academics and practitioners alike (e.g. Chandler and McEvoy, 2000; Dennis, 2002; Hart and Schle- singer, 1991; MacDuffie, 1995; Powell, 1995; Womack and Jones, 1994; Womack et al., 1990; Wood et al., 2004; Youndt et al., 1996). Despite controversies about the precise meaning of lean production (Li et al., 2005; Shah and Ward, 2007), it has commonly been taken to involve techniques concerned with production, work organization, quality management, logistics, supply chain, customer satisfaction, efficient delivery and continuous improvement methods. In other words, the adoption of lean production implies integration in the use of operation (OM) and human resource management (HRM) practices. The quality management literature, which can be traced back to 1949 when the Union of Japanese Scientists and Engineers formed a committee to improve Japanese productivity (Powell, 1995), also offers competing definitions for total quality management (TQM). Some authors argue that it is a managerial philosophy (e.g. Martinez-Lorente et al., 1998), whose principles imply an integration of operations and people management (Wickens, 1987). Yet Deming (2000) focused on an organizational system that promotes cooperation and learning for facilitating process management, resulting in the constant improvement of processes, products and services, as well as employee fulfillment and customer satisfaction. This system, then, becomes critical to the survival of organizations (Anderson et al., 1994). Juran (1993) emphasized not only team and project work, participation and recognition, but also highlighted the need to achieve the best return on investment. According to him, the primary responsibility of management is to minimize the total cost of quality and to decide when quality management efforts should be stopped. Deming also argued that the improvement of the work process reduces cost because of less re-work, fewer mistakes or delays and less waste in manpower and materials, but (in contrast to Juran) prescribed constant improvements. In this context, important questions for managers and scholars are: How do different managerial practices impact on perfor- mance? Which practices have greater impact on performance Journal of Operations Management xxx (2010) xxx–xxx ARTICLE INFO Article history: Received 17 June 2008 Received in revised form 20 January 2010 Accepted 25 January 2010 Available online xxx Keywords: Operation and human resource management practices Lean production Performance Latent classes, latent growth and multi-level models ABSTRACT This paper reviews the literature on the association between lean production and performance. From this, propositions on the integration and evolution of operation and human resource management practices associated with the lean production concept are developed. Using 24 years of data on the use of seven core OM and HRM practices in British manufacturing firms, the potential link between integration in the use of practices and productivity is tested. In each year, three latent clusters are identified via ordered restricted latent class models; the cluster that consistently makes a more integrated use of practices outperforms the others. Furthermore, the longitudinal nature of the data permits modeling the growth curves of each practice in the sample, recognizing any similarity in growth and investigating whether or not an early integration in adoption of practices is associated with higher final productivity. The results show that pioneers are more productive, thus suggesting that the head start in integrating core OM and HRM practices associated with the lean production concept has paid off. ß 2010 Elsevier B.V. All rights reserved. * Corresponding author. Tel.: +44 2070408359; fax: +44 2070408328. E-mail address: [email protected] (L.M. de Menezes). 1 Institute of Work Psychology, University of Sheffield, Sheffield, UK. 2 Garry Gelade was a research fellow at Cass Business School, City University London, 2007–2009. G Model OPEMAN-688; No. of Pages 17 Please cite this article in press as: de Menezes, L.M., et al., The integration of human resource and operation management practices and its link with performance: A longitudinal latent class study. J. Operations Manage. (2010), doi:10.1016/j.jom.2010.01.002 Contents lists available at ScienceDirect Journal of Operations Management journal homepage: www.elsevier.com/locate/jom 0272-6963/$ – see front matter ß 2010 Elsevier B.V. All rights reserved. doi:10.1016/j.jom.2010.01.002
Transcript of The integration of human resource and operation management practices and its … · 2010-11-15 ·...
Journal of Operations Management xxx (2010) xxx–xxx
G Model
OPEMAN-688; No. of Pages 17
The integration of human resource and operation management practices and itslink with performance: A longitudinal latent class study
Lilian M. de Menezes a,*, Stephen Wood b,1, Garry Gelade c,2
a Cass Business School, City University London, London, UKb School of Management, University of Leicester, UKc Business Analytic Ltd., London, UK
A R T I C L E I N F O
Article history:
Received 17 June 2008
Received in revised form 20 January 2010
Accepted 25 January 2010
Available online xxx
Keywords:
Operation and human resource
management practices
Lean production
Performance
Latent classes, latent growth and multi-level
models
A B S T R A C T
This paper reviews the literature on the association between lean production and performance. From this,
propositions on the integration and evolution of operation and human resource management practices
associated with the lean production concept are developed. Using 24 years of data on the use of seven
core OM and HRM practices in British manufacturing firms, the potential link between integration in the
use of practices and productivity is tested. In each year, three latent clusters are identified via ordered
restricted latent class models; the cluster that consistently makes a more integrated use of practices
outperforms the others. Furthermore, the longitudinal nature of the data permits modeling the growth
curves of each practice in the sample, recognizing any similarity in growth and investigating whether or
not an early integration in adoption of practices is associated with higher final productivity. The results
show that pioneers are more productive, thus suggesting that the head start in integrating core OM and
HRM practices associated with the lean production concept has paid off.
� 2010 Elsevier B.V. All rights reserved.
Contents lists available at ScienceDirect
Journal of Operations Management
journa l homepage: www.e lsev ier .com/ locate / jom
1. Introduction
Markets are increasingly more competitive and global, so qualitystandards and product or service efficiency is crucial to the survivalof any organization. In this context, the lean production concept hasbeen increasingly advocated beyond manufacturing (e.g. in services:Abdi et al., 2006; Abernathy et al., 2000; Swank, 2003; in the publicsector and healthcare: Kollberg et al., 2007). The spread and interestthat it has attracted are possibly due to claims of cost and wastereduction, superior performance and competitive advantage thathave been consistently made by academics and practitioners alike(e.g. Chandler and McEvoy, 2000; Dennis, 2002; Hart and Schle-singer, 1991; MacDuffie, 1995; Powell, 1995; Womack and Jones,1994; Womack et al., 1990; Wood et al., 2004; Youndt et al., 1996).Despite controversies about the precise meaning of lean production(Li et al., 2005; Shah and Ward, 2007), it has commonly been taken toinvolve techniques concerned with production, work organization,quality management, logistics, supply chain, customer satisfaction,efficient delivery and continuous improvement methods. In otherwords, the adoption of lean production implies integration in the
* Corresponding author. Tel.: +44 2070408359; fax: +44 2070408328.
E-mail address: [email protected] (L.M. de Menezes).1 Institute of Work Psychology, University of Sheffield, Sheffield, UK.2 Garry Gelade was a research fellow at Cass Business School, City University
London, 2007–2009.
Please cite this article in press as: de Menezes, L.M., et al., The integraits link with performance: A longitudinal latent class study. J. Opera
0272-6963/$ – see front matter � 2010 Elsevier B.V. All rights reserved.
doi:10.1016/j.jom.2010.01.002
use of operation (OM) and human resource management (HRM)practices.
The quality management literature, which can be traced back to1949 when the Union of Japanese Scientists and Engineers formeda committee to improve Japanese productivity (Powell, 1995), alsooffers competing definitions for total quality management (TQM).Some authors argue that it is a managerial philosophy (e.g.Martinez-Lorente et al., 1998), whose principles imply anintegration of operations and people management (Wickens,1987). Yet Deming (2000) focused on an organizational systemthat promotes cooperation and learning for facilitating processmanagement, resulting in the constant improvement of processes,products and services, as well as employee fulfillment andcustomer satisfaction. This system, then, becomes critical to thesurvival of organizations (Anderson et al., 1994). Juran (1993)emphasized not only team and project work, participation andrecognition, but also highlighted the need to achieve the bestreturn on investment. According to him, the primary responsibilityof management is to minimize the total cost of quality and todecide when quality management efforts should be stopped.Deming also argued that the improvement of the work processreduces cost because of less re-work, fewer mistakes or delays andless waste in manpower and materials, but (in contrast to Juran)prescribed constant improvements.
In this context, important questions for managers and scholarsare: How do different managerial practices impact on perfor-mance? Which practices have greater impact on performance
tion of human resource and operation management practices andtions Manage. (2010), doi:10.1016/j.jom.2010.01.002
L.M. de Menezes et al. / Journal of Operations Management xxx (2010) xxx–xxx2
G Model
OPEMAN-688; No. of Pages 17
outcomes? Does the integration of operations management andhuman resource management practices pay off? Are expectationsof long-lasting gains fulfilled? For several decades the link withperformance has mainly been investigated by addressing the firsttwo questions. However, not only do results and measures varywithin studies but the focus has generally either been on individualpractices or sets of practices that are presumed to result in superiorperformance. For example, a common view is that HRM practices –for instance those that empower or involve the employee – supportspecific OM practices; jointly they have a higher, possiblynonlinear, effect on performance (Kufidu and Vouzas, 1998;Lawler et al., 1995; MacDuffie, 1995). Longitudinal studies remainrare and tend to rely either on subjective assessments of practiceimplementation (Easton and Jarrell, 1998; Fullerton et al., 2003) oron relatively short periods (e.g. Callen et al., 2000; Capelli andNeumark, 2001).
In this paper, we concentrate on the integration of HRM and OMpractices and its potential impact on performance, by reviewingthe empirical literature and developing a set of propositions, whichwe then test. In our analysis, we assume that there is a philosophyor culture underlying the integration of OM and HRM practices,whose principles are not only concerned with eliminating wasteand adding value for customers but also entail the pursuit ofcontinuous improvements. The latter cannot be achieved withoutworker participation, such as quality at source inspections thatimply responsibility for checking one’s own work. Learning andcooperation thus facilitates process management, and integrationshould continue to pay over time; those organizations that adoptthis managerial philosophy should outperform those that do not.
We use secondary data of 448 British firms (Birdi et al., 2008) onseven management practices that are the most extensivelyemployed in British manufacturing (Wood et al., 2004), andcompany records for the period 1980–2003. Of the sevenmanagement practices, the OM practices are total qualitymanagement, just-in-time procedures (JIT), integrated comput-er-based technology (ICT, also known as advanced manufacturingtechnology), and supply-chain partnering. The first three arecentral to the lean manufacturing system and the last adds thecustomer–supplier relationships that are necessary for the deliveryof desired standards at a minimum cost. HRM practices includedare learning culture (or extensive training), empowerment andteamwork. The first two have consistently been associated withquality management, as shown by the criteria of the 1992 BaldrigeAward (George, 1992) and can be easily traced back to two ofDeming’s 14 points (Walton, 1986). Empowerment has beendescribed as critical to successful JIT initiation and implementation(Koufteros and Vonderembse, 1998), whereas teamwork is coreboth to high involvement (Bailey, 1993; de Menezes and Wood,2006) and quality managements (Wickens, 1987). Together, wewould expect that these HRM practices will allow employees toenhance their knowledge of the company, work more flexibly, andtake more responsibility in quality management and decision-making.
By focusing on the philosophy that underlies the co-existence(correlation in the use) of different types of practices, we alsoaddress the measurement problem that has been identified in theacademic literature (e.g. Shah and Ward, 2007). This is done not interms of what should be included in the measure, but in terms ofhow it should be constructed. If the lean production conceptimplies a managerial philosophy, culture or way of thinking, asadvocated in the literature (Womack and Jones, 1994), the co-existence of OM and HRM practices that are traditionallyassociated with this concept should reflect this philosophy.Moreover, if this philosophy is geared towards improvingperformance, the direct link between the philosophy and perfor-mance should be investigated rather than the association between
Please cite this article in press as: de Menezes, L.M., et al., The integraits link with performance: A longitudinal latent class study. J. Opera
its elements and performance. If practices co-exist, the longitudi-nal nature of our data also permits an assessment of the overallevolution of practices and the association with performance. Ourlongitudinal study thus investigates whether: (1) the integrateduse of core OM and HRM lean practices is associated with higherperformance; (2) there are performance gains from being an earlyadopter of such an integrated approach.
In the following sections, we review the empirical evidence onthe link with performance as well as the literature on the evolutionof management practices, which set the background to thepropositions that are tested. We then describe the data, themethodology that we use and report our results. Finally, we assessour contribution and conclude.
2. Background
Empirical studies of the link between a lean productionphilosophy and performance have concentrated on assessingwhether one or more of its elements are key, or whethercombinations of these lead to higher performance. In general,cross-sections were analyzed; definitions of constructs as well assample sizes vary considerably. Consequently, it is not onlydifficult to compare studies, but, as observed by Shah and Ward(2003: 130), analyses of the performance effects that focus onmultiple components of lean production remain rare.
In the HRM literature, diverse sets of practices have beenassumed to be part of a high performance work system (Becker andGerhart, 1996; Huselid, 1995) and as such are linked withperformance. Fundamental practices like empowerment or workenrichment that we would associate with the high involvementconcept (Bailey, 1993) are often omitted in empirical analyses.Results on the link with performance also reflect the diversity inmeasurement constructs and dependent variables (Wall andWood, 2005). The empirical evidence ranges from positiveassociation with all practices (Arthur, 1994), to lack of associationand even a negative correlation (Capelli and Neumark’s 2001 panelstudy showed no association, but one practice was negativelyrelated to both productivity and its change).
Overall, longitudinal studies are rare and the potential impact ofintegrating practices has been generally neglected, though it isoften argued that practices should be adopted in an integratedfashion. We now review the empirical evidence from studies onquality management and lean production, which justify ourassessment of the current state of the literature and the needfor studies like ours.
2.1. The empirical evidence on the link between lean practices and
performance
Initial reviews of the evidence reported a lack of associationbetween practices and performance. Powell (1995) offered severalanecdotal examples where the costs of implementing a TQMstrategy outweighed its benefits. Reed et al. (1996) concluded thatany observed benefits were simply contingent on matchingenvironmental conditions to firm orientation. Samson andTerziovski (1999) argued that the lack of evidence was due tosmall samples and measures that did not reflect the variousdimensions of quality management. They examined the relation-ship between TQM and quality, operational and business perfor-mance in Australian and New Zealand manufacturing (n = 1200),using multi-item measures that were thoroughly constructed andvalidated. A positive link with performance was then observed, butnot all categories of TQM were strong predictors of performance. Itappeared that gains from quality management might be due to theinteraction of practices, thus leading to subsequent research wheresynergistic effects were found between distinct elements of lean
tion of human resource and operation management practices andtions Manage. (2010), doi:10.1016/j.jom.2010.01.002

L.M. de Menezes et al. / Journal of Operations Management xxx (2010) xxx–xxx 3
G Model
OPEMAN-688; No. of Pages 17
(JIT, TQM, HRM) on multi-item measures of manufacturing andemployee performance (Challis et al., 2002).
Indeed, the search for promising combinations of practices hasbeen a dominant subject of empirical research (e.g. Bou andBeltran, 2005; Cua et al., 2001; Dow et al., 1999; Flynn et al., 1995;MacDuffie, 1995; Narasimhan et al., 2004; Shah and Ward, 2003).Flynn et al. (1995) claimed that TQM and JIT mutually support eachother: TQM reduces process variance, which can simplify themanufacturing process and closely match production and custom-er demand, while JIT affects quality management by reducing lotsizes and thus decreasing potential waste and re-work. Besides thecombination of TQM and JIT, Flynn et al. argued that other practices(a combination of OM and HRM that they named infrastructure)should interact with either of them. Their sample of USmanufacturing plants (n = 42) within three industries (machinery,transportation components and electronics) showed strongsynergistic effects on quality, but these were especially fromcombinations that also included HRM practices. The potential gainfrom the interactions with HRM practices was also observed byMacDuffie (1995) in a seminal study (n = 62) that was part of awider investigation on the human resource side of lean production,using data from the MIT Future of the Auto Industry project.According to two performance criteria – productivity (hours takento build a vehicle adjusted by relevant factors, e.g. size) and quality(defects/vehicle) – MacDuffie’s results showed significant syner-gies between OM and HRM systems.
Positive interactions between supply-chain and total qualitymanagements have also attracted considerable interest (e.g. Carterand Narasimhan, 1996; Carter et al., 2000; Mehra and Inman,2004). The predominant view is that TQM expands supply-chainmanagement from cooperative relationships aimed at minimizingcosts or trade-offs, to a focus on achieving cumulative competitivecapabilities that target the production of the highest value productfor customers. A minimum integration of OM practices is requiredto achieve this effectiveness, and thus one would expect asignificant correlation between the uses of TQM, JIT and supply-chain practices. Flynn and Flynn (2005) tested for synergiesbetween the perceptions of how extensively TQM and supply-chain management were employed on a sample of manufacturingplants from five industrialized countries (n = 164). Their TQMmeasure included JIT delivery and HRM practices and is thusbroader than most studies. Overall, TQM supported supply-chainmanagement, though not all combinations of practices werepositively associated with all measures of performance (quality,volume flexibility, manufacturing cycle time, on-time delivery).
With a few exceptions (e.g. Cua et al., 2001; Challis et al., 2002),most studies have concentrated on just two elements of lean,though in some cases HRM practices might have been includedwithin TQM. Shah and Ward’s (2003) study is one of the mostcomprehensive, since it focused on multiple elements in a largesample of US manufacturing plants (n = 1757) from severalindustries. Plants were classified into four bundles of relatedprocesses and procedures: JIT, TQM, HRM and TPM (TotalPreventive Maintenance). After controlling for industry, unionpresence, size and age of plant, the adoption of these bundles waspositively associated with operational performance, measured asthe five-year change in six items (scrap and re-work costs,manufacturing cycle time, first pass yield, labor productivity, unitmanufacturing cost and customer lead time). Shah and Ward thenconcluded that ‘‘a separate and identifiable incremental effect canbe attributed to the four major lean practices areas’’ (2003: 145–146), and that these findings provide ‘‘unambiguous evidence thatthe synergistic effects of all lean practices are associated withbetter manufacturing performance’’. Thus, all elements shouldcoexist, though they did not formally test for the four-wayinteraction (synergy) nor modeled a secondary factor (integration).
Please cite this article in press as: de Menezes, L.M., et al., The integraits link with performance: A longitudinal latent class study. J. Opera
To sum up, the literature supports synergies between thedifferent practices and we would expect OM and HRM practices tocoexist, at least in the long run. It is reasonable, then, to expectsignificant correlation between the different elements of leanproduction, and we propose:
Proposition 1. OM and HRM practices that are associated with the
lean production concept are integrated.
Yet in the literature addressing the potential link withperformance, the analysis of the correlation structure has beenlimited to separate elements of lean. Potential synergies betweentwo or three elements tend to be analyzed, thus implying thatelements may be perceived as being independent. As an example,we refer to Bou and Beltran (2005: 71), who claimed that ‘‘theinfluence of TQM on organizational results will be greater when itsimplementation is supported by a high-commitment strategy’’,and therefore HRM and TQM should have a synergistic effect onperformance. They tested this hypothesis via a structural equationmodel, where TQM and high commitment management (HRMpractices) are two independent latent variables that positivelyinteract on financial performance (Bou and Beltran, 2005: 81,Fig. 2). They quoted Dwyer (2002: 536) by stating that ‘‘a modelintegrating quality and people [practices] could have an impact onthe bottom line of the organization’’, but did not test for thisintegration by assessing whether their two latent variables werecorrelated and loaded on a single dimension. Moreover, byassuming that the correlation between TQM and the HRM-centered commitment variable is negligible, they contradictedtheir observation that the correlation could be significant, as an‘‘analysis of the foundations of high-commitment managementshows clear parallelism with the quality climate proposed by TQMexperts, since both approaches [i.e. TQM and high-commitmentmanagement] emphasize employee participation, commitmentand trust within the organization’’ (Bou and Beltran, 2005: 75). Inshort, despite acknowledging their expectation of integrationbetween OM and HRM, the authors followed the general trend inthe literature and limited the investigation to synergistic effects.Proposition 1 remains to be tested.
2.1.1. The potential link between the integration of lean practices and
performance
The first stage in examining a link between the integrated use ofpractices and performance is an assessment of integration. Fewauthors have actually modeled the correlation in the adoption ofdifferent types of practices when developing their construct.Among those that did, not all assumed that underlying thecorrelation between practices (or elements) was a managementphilosophy. For example, Callen et al. (2003) investigated the risk–profitability trade-off of JIT manufacturing (lean) on a sample of100 plants. Seventeen practices were considered, of which onlytwo can be broadly classified as HRM (quality circles and flexibilityof worker’s skills). Principal component analysis was used todevelop an index of JIT manufacturing, which is therefore aformative rather than a reflective construct (latent variable). Bychoosing this statistical method, as described by Diamantopoulosand Siguaw (2006), the authors assumed that the use of practicescauses the construct being measured (JIT manufacturing) and notthat the coexistence of practices reflects an underlying managerialapproach. According to each plant’s score, the sample was thensplit: JIT manufacturing (lean), non-JIT and the first group of plantswere found to be more profitable, even after adjusting for theoperational risks relative to non-JIT manufacturing. Had similarresults been found based on a construct derived from factoranalysis, we would have evidence of a link between integration andperformance.
tion of human resource and operation management practices andtions Manage. (2010), doi:10.1016/j.jom.2010.01.002
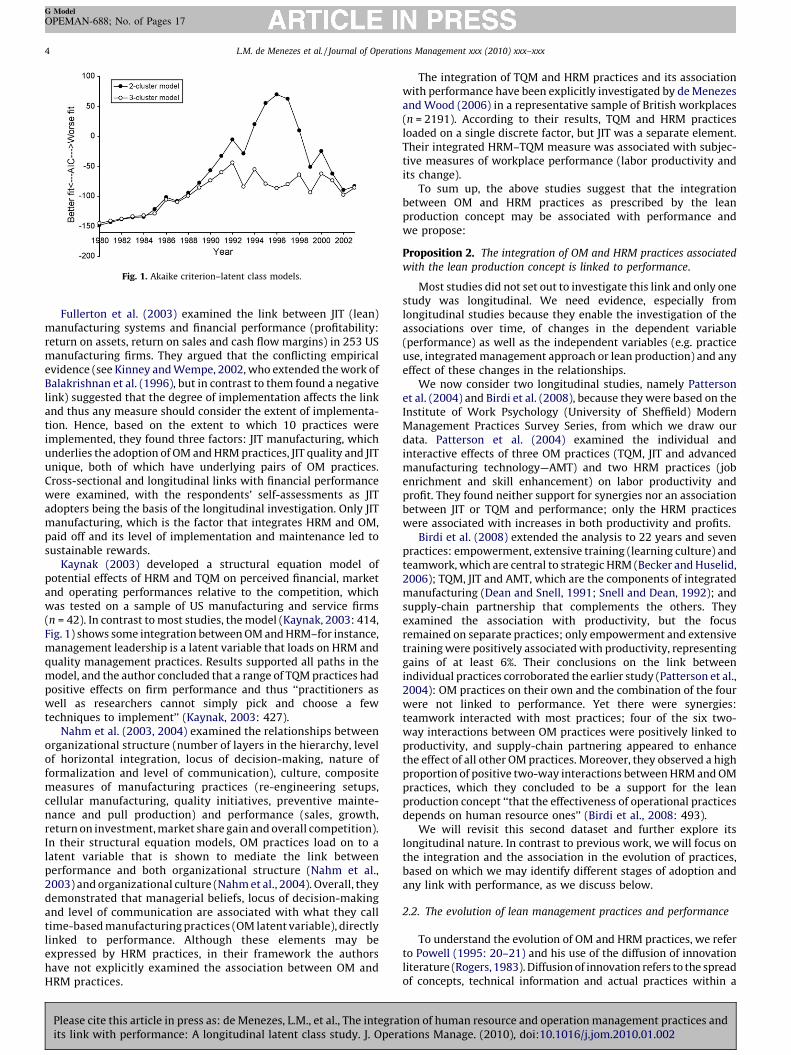
Fig. 1. Akaike criterion–latent class models.
L.M. de Menezes et al. / Journal of Operations Management xxx (2010) xxx–xxx4
G Model
OPEMAN-688; No. of Pages 17
Fullerton et al. (2003) examined the link between JIT (lean)manufacturing systems and financial performance (profitability:return on assets, return on sales and cash flow margins) in 253 USmanufacturing firms. They argued that the conflicting empiricalevidence (see Kinney and Wempe, 2002, who extended the work ofBalakrishnan et al. (1996), but in contrast to them found a negativelink) suggested that the degree of implementation affects the linkand thus any measure should consider the extent of implementa-tion. Hence, based on the extent to which 10 practices wereimplemented, they found three factors: JIT manufacturing, whichunderlies the adoption of OM and HRM practices, JIT quality and JITunique, both of which have underlying pairs of OM practices.Cross-sectional and longitudinal links with financial performancewere examined, with the respondents’ self-assessments as JITadopters being the basis of the longitudinal investigation. Only JITmanufacturing, which is the factor that integrates HRM and OM,paid off and its level of implementation and maintenance led tosustainable rewards.
Kaynak (2003) developed a structural equation model ofpotential effects of HRM and TQM on perceived financial, marketand operating performances relative to the competition, whichwas tested on a sample of US manufacturing and service firms(n = 42). In contrast to most studies, the model (Kaynak, 2003: 414,Fig. 1) shows some integration between OM and HRM–for instance,management leadership is a latent variable that loads on HRM andquality management practices. Results supported all paths in themodel, and the author concluded that a range of TQM practices hadpositive effects on firm performance and thus ‘‘practitioners aswell as researchers cannot simply pick and choose a fewtechniques to implement’’ (Kaynak, 2003: 427).
Nahm et al. (2003, 2004) examined the relationships betweenorganizational structure (number of layers in the hierarchy, levelof horizontal integration, locus of decision-making, nature offormalization and level of communication), culture, compositemeasures of manufacturing practices (re-engineering setups,cellular manufacturing, quality initiatives, preventive mainte-nance and pull production) and performance (sales, growth,return on investment, market share gain and overall competition).In their structural equation models, OM practices load on to alatent variable that is shown to mediate the link betweenperformance and both organizational structure (Nahm et al.,2003) and organizational culture (Nahm et al., 2004). Overall, theydemonstrated that managerial beliefs, locus of decision-makingand level of communication are associated with what they calltime-based manufacturing practices (OM latent variable), directlylinked to performance. Although these elements may beexpressed by HRM practices, in their framework the authorshave not explicitly examined the association between OM andHRM practices.
Please cite this article in press as: de Menezes, L.M., et al., The integraits link with performance: A longitudinal latent class study. J. Opera
The integration of TQM and HRM practices and its associationwith performance have been explicitly investigated by de Menezesand Wood (2006) in a representative sample of British workplaces(n = 2191). According to their results, TQM and HRM practicesloaded on a single discrete factor, but JIT was a separate element.Their integrated HRM–TQM measure was associated with subjec-tive measures of workplace performance (labor productivity andits change).
To sum up, the above studies suggest that the integrationbetween OM and HRM practices as prescribed by the leanproduction concept may be associated with performance andwe propose:
Proposition 2. The integration of OM and HRM practices associated
with the lean production concept is linked to performance.
Most studies did not set out to investigate this link and only onestudy was longitudinal. We need evidence, especially fromlongitudinal studies because they enable the investigation of theassociations over time, of changes in the dependent variable(performance) as well as the independent variables (e.g. practiceuse, integrated management approach or lean production) and anyeffect of these changes in the relationships.
We now consider two longitudinal studies, namely Pattersonet al. (2004) and Birdi et al. (2008), because they were based on theInstitute of Work Psychology (University of Sheffield) ModernManagement Practices Survey Series, from which we draw ourdata. Patterson et al. (2004) examined the individual andinteractive effects of three OM practices (TQM, JIT and advancedmanufacturing technology—AMT) and two HRM practices (jobenrichment and skill enhancement) on labor productivity andprofit. They found neither support for synergies nor an associationbetween JIT or TQM and performance; only the HRM practiceswere associated with increases in both productivity and profits.
Birdi et al. (2008) extended the analysis to 22 years and sevenpractices: empowerment, extensive training (learning culture) andteamwork, which are central to strategic HRM (Becker and Huselid,2006); TQM, JIT and AMT, which are the components of integratedmanufacturing (Dean and Snell, 1991; Snell and Dean, 1992); andsupply-chain partnership that complements the others. Theyexamined the association with productivity, but the focusremained on separate practices; only empowerment and extensivetraining were positively associated with productivity, representinggains of at least 6%. Their conclusions on the link betweenindividual practices corroborated the earlier study (Patterson et al.,2004): OM practices on their own and the combination of the fourwere not linked to performance. Yet there were synergies:teamwork interacted with most practices; four of the six two-way interactions between OM practices were positively linked toproductivity, and supply-chain partnering appeared to enhancethe effect of all other OM practices. Moreover, they observed a highproportion of positive two-way interactions between HRM and OMpractices, which they concluded to be a support for the leanproduction concept ‘‘that the effectiveness of operational practicesdepends on human resource ones’’ (Birdi et al., 2008: 493).
We will revisit this second dataset and further explore itslongitudinal nature. In contrast to previous work, we will focus onthe integration and the association in the evolution of practices,based on which we may identify different stages of adoption andany link with performance, as we discuss below.
2.2. The evolution of lean management practices and performance
To understand the evolution of OM and HRM practices, we referto Powell (1995: 20–21) and his use of the diffusion of innovationliterature (Rogers, 1983). Diffusion of innovation refers to the spreadof concepts, technical information and actual practices within a
tion of human resource and operation management practices andtions Manage. (2010), doi:10.1016/j.jom.2010.01.002

L.M. de Menezes et al. / Journal of Operations Management xxx (2010) xxx–xxx 5
G Model
OPEMAN-688; No. of Pages 17
social system. The spread denotes a flow from a source to an adopter,typically by communication or influence (for example, the adoptionof lean practices by Japanese subsidiaries in the UK). Diffusiontrajectories as a function of time (growth curves) are such that at thebeginning adoption takes longer and growth is barely observed, thenthere is a period of growth, and finally there is a plateau.
This pattern is observed and modeled in many areas, asdescribed in Wejnert’s (2002) review of diffusion processes. Inmanagement, the spreads of specific practices have rarely beeninvestigated. Bryson et al. (2007) and Freitas (2008) use Britishdata from the Workplace Employment Relations Surveys and focuson workplace characteristics that predict the diffusion of HRMpractices. They argue that practices are governed by considerationsof costs and benefits that are similar to those involved in anyinnovation and thus can be examined by diffusion models. The firststudy measured the diffusion or intensity of HRM through anadditive score, while the second focused on specific practices andtheir implementation. Neither modeled the growth curve norfocused on performance, for both aimed to identify factors thatmay predict diffusion. They found that industrial sector, size andage of the establishment, set-up date and number of organizationalaffiliations are associated with diffusion. Such results are consis-tent with the general view that innovations propagate morerapidly among those that share similar visions, values andapproaches. Consequently, firms can be classified based on theirstages of adopting a managerial philosophy and we propose:
Proposition 3. There is a pattern in the evolution of lean practices, so
firms can be classified according to their adoption stages.
Few studies have examined the link between the stages ofadopting a managerial philosophy and performance. Among thisliterature, Easton and Jarrell (1998) developed an event historystudy on the impact of TQM between 1981 and 1991. Implemen-tation was judged according to the Baldrige Award criteria, inwhich case an advanced implementation would combine OM andHRM practices (George, 1992). Each firm’s performance (account-ing and stock returns) was compared with a control benchmarkthat captured what performance would have been without TQM.Independently of the performance measure, a positive link withTQM was established and the observed improvement in perfor-mance was larger three to five years after TQM implementation,which led the authors to support the view of a longer term impact.Yet expectations of sustainable effects might have been toooptimistic. For example, Hendriks and Singhal (2001) found nosignificant difference in performance between earlier and later‘‘effective’’ implementers (award winners) of TQM, and argued thatthe positive effects of TQM could be diluted by other factors withinthe organization. Moreover, Fullerton et al. (2003: 400) observedthat greater degrees of implementation of JIT quality practicesdecreased profitability, but JIT manufacturing that integrated OMand HRM showed sustainable profits. All in all, we lack coherentevidence on any link between the evolution of managementpractices and firm performance, possibly because of samplingvariations, different constructs and measures, but also due todistinct perspectives on long-term effects.
We may argue that expectations of long-term effects coulddiscourage diffusion, because only firms that have higherinvestment capacity would be willing to adopt an innovationand wait for medium- or long-range returns. In which case, ahigher performance would be associated with early adoption.Furthermore, the diffusion process and its link with performancecan be highly influenced by learning effects, which may createasymmetries among firms and affect the spread of adoption. In fact,when practices are viewed in bundles, learning can be subject toconsiderable variance: some features are easily transferable,
Please cite this article in press as: de Menezes, L.M., et al., The integraits link with performance: A longitudinal latent class study. J. Opera
others may suffer great resistance; therefore, investment can beperceived as too risky. Innovators would then be those that havelow transaction costs, are willing to take the risk, or have thecapacity to invest in continuous learning. Early adopters wouldthen benefit from the sustainable learning and continuousimprovement that are commonly associated with the leanproduction concept. Hence we propose:
Proposition 4. There is an association between stages of evolution
and performance.
The longitudinal nature of the data that we analyze enables usto test our four propositions and thus explore whether theintegration of core lean HRM and OM practices in Britishmanufacturing may be linked to sustainable productivity.
3. The empirical study
3.1. The data
We use company-level data from the Institute of WorkPsychology (University of Sheffield) Modern Management Prac-tices Survey Series. The dataset, as described by Birdi et al. (2008:479–80), was constructed by matching the evidence from threesurveys on the use of management practices to yearly auditedrecords of company data that include a measure of performance.The surveys established the use of practices as well as when theywere implemented, and were based on interviews with either thecompany’s managing director or a senior representative responsi-ble for HRM or production.
During these interviews, a definition of working practices wasgiven, which was formulated from literature reviews, focus groupsand pilot studies. Respondents were asked whether and howextensively the practice was used across the company and, if so,the year it was introduced. The descriptions of the practices thatwere common to all surveys in the series, as relayed to theinterviewees, are listed in Table 1 of Birdi et al. (2008: 480) and are:
� Empowerment: Passing considerable responsibility for opera-tional management to individuals or teams (rather than keepingall decision-making at the managerial level).� Integrated computer-based technology: Linking together com-
puterized equipment to enable enhanced integration (such asCADCAM, computer-integrated manufacturing and flexiblemanufacturing systems).� Just-in-time production: Making products or providing services
in direct response to internal or external customer demands(rather than building in advance to maintain stock levels).� Learning culture, which Birdi et al. (2008) relabeled ‘‘extensive
training’’: Providing a range of development opportunities for allemployees (rather than training people occasionally to meetspecific needs).� Supply-chain partnering: Developing strategic alliances and
long-term relationships with suppliers and customers (ratherthan negotiating on a short-term basis).� Team-based work: Placing employees into teams with their own
responsibilities and giving them the freedom to allocate workamong team members (rather than having everyone work asindividuals).� Total quality management: Seeking continuous change to
improve quality and making all staff responsible for the qualityof their work. (Such practices include Kaizen and continuousimprovement.)
In 1996, these practices were identified as the most popular inthe lean management practitioner literature and were estimated to
tion of human resource and operation management practices andtions Manage. (2010), doi:10.1016/j.jom.2010.01.002

L.M. de Menezes et al. / Journal of Operations Management xxx (2010) xxx–xxx6
G Model
OPEMAN-688; No. of Pages 17
be implemented in at least half of the UK’s manufacturingcompanies (Waterson et al., 1999), where their combined usedwas pioneered in the early 1990s by Japanese transplants and firmsdirectly competing with or supplying them (Wood, 1996).Together with the HRM practices, they are also included withinelements that define total quality management as a philosophy(Dean and Bowen, 1994). All seven practices appear in mostaccounts of lean production (e.g. Hopp and Spearman, 2004;Parker, 2003; Shah and Ward, 2003; Womack et al., 1990) and havebeen linked to descriptions of the Toyota Production System (e.g.Spear and Bowen, 1999). They represent two (supplier-related andinternally related) of the three underlying constructs identified byShah and Ward (2007) in their comprehensive investigation onwhat constitutes lean production. Individually, TQM, JIT and ICTwere core to integrated manufacturing technology centers (Snelland Dean, 1992, 1994) or the Toyota Production System (Ohno,1988) and were considered in studies of JIT manufacturing (e.g.Fullerton et al., 2003; Koufteros and Vonderembse, 1998). The data,however, does not cover the involvement of customers or TPM(Total Preventive Maintenance–Cua et al., 2001; Shah and Ward,2003, 2007), which was only included in the 1996 survey where itwas rarely used. Other HRM practices in the survey series(appraisal, selection procedures and reward schemes) were absentin most years and their link with employee involvement remainsquestionable (Beer et al., 1984; de Menezes and Wood, 2006).
Birdi et al. (2008) checked the consistency between thereported years of introductions and the stated practice use in asub-sample of over 200 companies for which they had additionaldata. Very few inconsistencies in the reported year of introductionof practices were found between surveys, in which case they optedfor the most recent information. Their yearly data was thenconstructed, by combining the practice usage information fromthe three surveys with the information on when the practice hadbeen introduced. The usage of each practice in each year of thestudy was then recorded as a binary indicator (1 if a firm was usinga practice that year, otherwise 0). Only a small number of firms (1%of the total) had stopped using a practice within the periodstudied. Company-related yearly data (productivity, size ofworkforce, value of assets) were extracted from the annualaudited accounts held at Companies House in London, wherechecks were done and any anomalies were corrected prior to thecreation of the dataset.
Productivity, the performance variable in the dataset, is ourdependent variable, and was measured as the logarithm of value-added derived profit and loss (operating profit, labor costs anddepreciation), adjusted for GDP inflation so that the measure isstandardized to 2001 prices. The focus on productivity as an indexof performance is justified on grounds that ‘‘it should more directlyreflect the impact of implementing management practices’’ (Birdiet al., 2008: 481); it represents a direct link between human capitaland organizational performance (Datta et al., 2005) and is the keyindicator of workforce performance (Delery and Shaw, 2001).Value-added is an important indicator of a company’s outputbecause it evaluates a company’s efficiency relative to its input(Birdi et al., 2008; Kato and Morishima, 2002).
When testing Proposition 2 and thus considering the (yearly)association between the integrated use of practices and produc-tivity, the models are controlled for: size of workforce (log numberof employees), value of assets (log fixed assets adjusted forinflation), and time (accounting year). Finally, when examining theassociation between stages of adoption and performance, we addinitial productivity (value-added) to our controls, and measuretime by the number of years from the starting accounting year.These controls are consistent with the Cobb-Douglas productionfunction (Birdi et al., 2008: 481), as well as previous analysis of thediffusion of management practices (Bryson et al., 2007).
Please cite this article in press as: de Menezes, L.M., et al., The integraits link with performance: A longitudinal latent class study. J. Opera
Our models, which are described in the next section, aim to fitall possible combinations of practice use in the data; if there wereno missing observations, we could observe 128 (27) types ofresponses. Hence, we need as much information on practice usageas possible (see de Menezes, 1999, for the effect of sample sizes)and started with all 684 companies. However, the exclusion ofmissing values practice-by-practice resulted in inconsistentmodels over the years, so that we use the data from 448companies that have complete information on all seven practicesin every year of our study period (1980–2003). A total of 157companies had complete information on all seven practices aswell as productivity; the latter is unavailable for the first two yearsin the dataset, so when addressing the association with perfor-mance we are limited to this subset of 157 companies and theperiod from 1982 to 2003 (22 years). Yet this sample size iscomparatively larger than other studies of the link withperformance in the manufacturing industry that rely on dataselected from far larger populations (e.g. Flynn et al., 1995;Kaynak, 2003; Powell, 1995). Our sample differs from Birdi et al.(2008), since they excluded the first two years because theselacked information on productivity thus leading to a total of 308firms, but, depending on the practice or combination analyzed,their sample sizes vary from 122 to 284 firms.
3.2. Analysis procedure
Table 1 summarizes the steps, goals and methods that areinvolved in testing our four propositions, which are detailed below.
3.2.1. Assessing integration of practice-use and its link with
performance
To test Propositions 1 and 2, we need to examine the associationin practice use in all years studied and then analyze the link withperformance. Our analysis differs from most of the literature, sincelean production has often been treated solely as a set ofmanagement practices (e.g. Birdi et al., 2008; Li et al., 2005; Shahand Ward, 2007), which on their own or combined may beassociated with performance. In which case, if xi is a binary variablethat indicates the use of practice i (i = 1 to n), the link withperformance can be assessed by the following model:
Per formance ¼ b0 þ b1x1 þ � � � þ bnxn þ bnþ1C1 þ � � � þ bnþkCK
þ e
where the Cks (k = 1 to K) are a set of control variables. In addition,if two or more practices are assumed to have a synergistic effect onperformance, interactions or product-terms are added to themodel. For example, when considering two practices, the modelbecomes:
Per formance ¼ b0 þ b1x1 þ b2x2 þ b3x1x2 þ bnþ1C1
þ � � � þ bnþkCK þ e
. The estimated coefficients of the individual practices and theirinteraction term are then expected to be positive and todemonstrate that the effect of the combination is greater thanthat of individual practices.
By contrast, when we view lean production as a philosophy, inline with Proposition 1, practices co-exist due to this philosophy(latent variable) and can be measured by the common factorunderlying the correlation of individual practices or elements.Integration implies that a common factor, which can be modeledas the latent variable that measures the philosophy, can beestimated. Moreover, when testing Proposition 2, it is the linkbetween this factor and performance that should be examined, forexample:
tion of human resource and operation management practices andtions Manage. (2010), doi:10.1016/j.jom.2010.01.002

Table 1Methodological summary.
Steps in testing propositions Goal Method
Proposition 1 Establish evidence of integration and develop yearly measures
For each year of practice use data:
1. Test for association in practice use Examine evidence for integration of OM and HRM practices Chi-square tests of independence
2. Test for a common factor (latent variable
that measures the integrated approach)
Estimate the underlying construct (common factor) to be analyzed:
Continuous Latent trait model (Bartholomew
et al., 2002: 175–206)a
Discrete (clusters of firms that similarly integrate practices) Latent class analysis (McCutcheon, 1987)b
Proposition 2 Establish link between integration and performance
Test for a link between extent of
integration and productivity
Continuous
Estimate equation 1 if the common factor is continuous; Linear two-level model (Goldstein, 2003)
Discrete Level 1 = firm,
Assess significance and identify the sign of the estimated
coefficients for the common factor (cluster membership).
Level 2 = time
Dependent variable = productivity
In our case, a significant positive coefficient for the high
usage cluster (or a significant negative coefficient for the
low-usage cluster) indicates a positive link between
combined practice use (integration) and productivity.
Proposition 3 Establish evidence of evolution and classify firms
according to their different stages
1. Estimate the evolution of each practice Identify the evolutionary stages of each practice Latent class growth analysis
(Andruff et al., 2009)c
2. Estimate the underlying evolution of all
practices, using results from the previous
stage as input
Identify stages of evolution of an integrated approach Latent class analysis
Proposition 4 Establish a link between the identified stages and performance Linear model (GLM or OLS)
Test for a link between stages of adoption
and productivity
Estimate the linear model and assess the significance
of the adoption stages
Independent variable = evolution (trajectory
class)
Dependent variable = productivity
a If the extent of practice use were available rather than binary indicators of practice use, standard factor analysis would be used.b If latent variable is ordinal, estimate an order-restricted model.c Time (t = 1–24) would have been the predictor of usage; we were unable to estimate the model and thus divided the 24 years in equal lengths (epochs) that we use as
predictors.
L.M. de Menezes et al. / Journal of Operations Management xxx (2010) xxx–xxx 7
G Model
OPEMAN-688; No. of Pages 17
Per formance ¼ b0 þ b1 factor þ bnþ1C1 þ � � � þ bnþkCK þ e,which in a longitudinal framework may be written as:
Per formancet ¼ b0 þ b1t factort þ bnþ1tC1t þ � � � þ bnþktCKt
þ et: (1)
Testing Proposition 1: Establishing evidence of integration and
developing yearly measures of the construct. We need to assesswhether a factor underlies the association between the sevenpractices in every year (t) of our data. If practices were usedindependently, we would have no evidence of integration andProposition 1 would be rejected. Hence, we first establish thatthere is significant correlation in practice use, so that we canestimate for each firm the value of this factor in the year. Since ourpractice data are binary variables, we use chi-square tests. Havingestablished association, our second step is to determine whetherthis association is due to a common continuous factor. Wetherefore fit a logit-probit latent trait model that is analogous tothe traditional factor model but is specifically for binary variables,as proposed by Bartholomew and Knott (1999: chapter 4) and usedby de Menezes and Wood (2006) in their analysis of managementpractices. For brevity, we report that these fits were poor and fromnow on we consider models that assume the latent variable iscategorical (discrete).
Latent class models were initially proposed by Lazarsfeld andHenry (1968) in order to identify homogeneous groups ofindividuals based on the correlation structure between severalbinary or categorical variables. Several variants of latent classmodels have been used in sociology to identify types of attitudestructures from survey responses, in marketing to unveil consumersegments from demographic and preference variables and in
Please cite this article in press as: de Menezes, L.M., et al., The integraits link with performance: A longitudinal latent class study. J. Opera
management to identify management styles (DeSarbo et al., 2006;Lewis, 2005; McCutcheon, 1987; Rost and Langeheine, 1997a;Wood and de Menezes, 1998). The standard latent class modelassumes that binary indicator variables are associated because ofdiscrete points (classes) in the latent space. In the absence of theseclasses, the indicator variables are no longer associated. Accord-ingly, we let pij be the probability of the ith practice being used by afirm in category j, hj be the prior probability that a randomlychosen firm is in class j or the size of a class, and x = (x1, x2, . . ., x7)represent the response of a firm to the use of these seven practices.As we only observe x, inference must be based on the jointdistribution, whose density for the K-class model is given by:
f ðxÞ ¼XK
j¼1
h j
Yp
i¼1
pxi
i jð1� pxi
i jÞ1�xi (2)
The posterior probability that a firm with response vector x is inclass j is therefore:
hð jjxÞ ¼h j
Yp
i¼1
pxi
i jð1� pi jÞ1�xi
f ðxÞ ; j ¼ 1; . . . K (3)
By maximizing the log-likelihood function, parameters(h jsandpi js) are estimated. Multiple sets of random starting valuesare generally used to avoid local solutions. A firm is allocated to theclass that it has the highest posterior probability (3) of belongingto. Consequently, in a latent class we have firms that do notnecessarily make use of exactly the same subset of practices, buthave the same probability of adopting each practice and as suchhave a similar approach to management.
tion of human resource and operation management practices andtions Manage. (2010), doi:10.1016/j.jom.2010.01.002
L.M. de Menezes et al. / Journal of Operations Management xxx (2010) xxx–xxx8
G Model
OPEMAN-688; No. of Pages 17
A log-linear reformulation of this model, as shown by Rost andLangeheine (1997b), whose parameters are not probabilities and assuch not restricted to the interval [0,1] enables restrictions to beapplied to the parameters, the inclusion of predictors and moreflexible inference for categorical indicator variables (Heinen, 1996;Vermunt, 1999). This reformulation has been adopted by Vermuntand Magidson (2005) in developing LatentGold 4.0, the softwarethat we use here, to classify cases into homogeneous groups thatthey call latent class clusters.
If a categorical latent variable is responsible for the association inpractice use, we can fit a latent class model to the data. LatentGold4.0 is used to estimate the model parameters and allocate firms intolatent class clusters for each year in the dataset. Standard goodness-of-fit and model selection statistics are then used to judge thenumber of latent class clusters that best fits the data. Residualcorrelations are analyzed in order to detect any dependencybetween pairs of practices (violation of the local independenceassumption), which, if necessary, can then be modeled. Since theprobabilities of a firm adopting each practice are estimated, giventhat it is in a cluster, we can also identify the characteristics of eachcluster in terms of how firms are likely to use practices.
As we describe in the next section, we fit up to five latent classesper year and the best solutions imply either two- or three-classes;we opted for three. However, the yearly classification varied andwe then restricted the models so that the probability of a firm usinga practice changes monotonically as we move along the sequenceof latent class clusters, i.e.: pi j�pi j�1. In short, we estimate modelsthat are known in the statistical literature as order-restricted latentclasses (Goodman, 1974; Croon, 1990), which represent anintermediate stage between the latent trait model where thelatent space is a continuum, as in factor analysis, and the standardlatent class model described above. This procedure results in threeordered homogeneous clusters of firms per year and a firm isallocated to the cluster that it has the highest estimated probabilityof belonging to. In each cluster, the probabilities of a firm adoptinga practice i, where i = 1–7, is the same, and as specified these do notdecrease from cluster 1 to 3.
Testing Proposition 2: Establishing the link between integration
and performance. The association between cluster membership andproductivity is investigated via a two-level hierarchical regressionprocedure, using Mixed Models with SPSS14. The first level is time(t) and the second is the company (i). Cluster 2, the medium-usagecluster, is chosen as the baseline, so that if there is a link, we wouldexpect a positive coefficient for Cluster 3 and/or a negativecoefficient for Cluster 1. Our model is the following:
productiyit ¼ b0 þ bsSizeit þ bAAssetsit þ btt þ bCl1Cluster1it
þ bCl3Cluster3it þ eit (4)
where Cluster1it is 1 if firm i is low-usage at time t and 0 otherwise,Cluster3it is 1 if firm i is high-usage at time t and 0 otherwise, and eit
is the error term. Time (t) varies from 1 to 22 (1982–2003, since1982 is the first year for which performance data is available). Thecorrelation structure of the first level residuals is identified andestimated from a baseline model that excludes the clustermembership predictors. Improvement in model fit between ourmodel, as described in equation (4), and the baseline model isassessed by the change in �2 times the log-likelihood, which is alikelihood ratio statistic that in our case is distributed as a chi-square with two degrees of freedom (due to two additionalparameters that our model has, relative to the baseline model).
3.2.2. Assessing evolution and its link with performance
Testing Proposition 3: Establishing the evidence of evolution and
classifying firms according to the different stages. In order to establishthe trajectory (evolution) of each practice, we estimate latent
Please cite this article in press as: de Menezes, L.M., et al., The integraits link with performance: A longitudinal latent class study. J. Opera
growth cluster models (latent class growth analysis or LCGA:Andruff et al., 2009; Jung and Wickrama, 2008; Muthen, 2001,2004), using LatentGold 4.0 as described by Vermunt andMagidson (2005). These models are increasingly being used insocial sciences and psychology with the aim of capturinginformation over time about inter-individual differences andintra-individual change (Nesselroade, 1991; Wang, 2007). Incontrast to conventional growth models that would assume firmscome from a single population and that a single growth trajectorycan adequately approximate the entire population, LCGA enablesthe identification of homogeneous clusters of firms that describesimilar growth trajectories of practice use.
We first examine the growth pattern of each practiceseparately, by using time (year) as a predictor of usage in a latentclass growth model. The aim is to find the best model (correctnumber of latent classes) that describes the evolution of eachpractice. However, after attempting to model the growth using the24 points in time, the results did not converge to unique solutions.Therefore, we divided the period 1980–2003 into five epochs ofequal length as follows: epoch 0 = 1980–1984, epoch 1 = 1985–1989, epoch 2 = 1990–1994, epoch 3 = 1995–1999, epoch4 = 2000–2003. If a practice was introduced at any time duringan epoch, or was already in use at the beginning of an epoch, thepractice code for that epoch was set to 1. Otherwise, the practicecode for that epoch was 0.
We estimate latent class growth models for each individualpractice: the dependent variable is the practice-use indicator (xi = 0or 1) and the predictor is the epoch coded 0–4, as defined above.Practice-use indicators are binary variables and thus binary logisticregression models are estimated. For each practice, we fit up to fivelatent classes and choose the model with the lowest BayesianInformation Criterion (BIC) that describes the growth or trajectoryfor each practice. A mean growth curve is estimated for each class.We then use the identified growth classes as inputs to a secondlatent class model, whose classification summarizes the overallevolution of the seven practices. In short, this is a two-stage processthat leads to a single classification of firms (trajectory class) based onthe diffusion of the seven practices over the 24 years.
Testing Proposition 4: Establishing the link between stages of
adoption and performance. Finally, we investigate whether theevolution is associated with firm performance, by examiningproductivity in the last available accounting year as a function oftrajectory class that categorizes firms according to the identifiedstages of adopting (integrating) practices. A General Linear Modelis estimated using SPSS14, where the dependent variable is finalperformance and the covariates are initial productivity, finalcompany size, final fixed assets and accounting period. Thetrajectory class is the categorical predictor. We also estimate analternative model, as a validity check, where the dependentvariable is an average of productivity in the last two years and theinitial productivity is replaced by its average in the two initialyears.
4. Empirical results
4.1. The link between integration and performance
4.1.1. Establishing the evidence of integration
Testing for association in practice use. Chi-square tests of thecross-tabulations of the seven practices for the 24 years showedthat independency was generally rejected (P-values < 0.05). Wealso observed that in 1980, 14% of firms reported using one or moreOM practice and only 9% reported using one or more HRM practice;by 2002 these figures had grown to 99% and 98%, respectively. Inorder to confirm that HRM practices were not being adoptedindependently of OM practices, we created two binary indicator
tion of human resource and operation management practices andtions Manage. (2010), doi:10.1016/j.jom.2010.01.002

L.M. de Menezes et al. / Journal of Operations Management xxx (2010) xxx–xxx 9
G Model
OPEMAN-688; No. of Pages 17
variables. For each year, the first variable indicated whether a firmhad adopted at least one OM practice, and the second whether afirm had adopted at least one HRM practice. Cross-tabulation ofthese two variables suggested that in every year prior to 2002,firms that had adopted at least one OM practice were more likely tobe using at least one HRM practice than firms that had not adoptedany OM practices. With the exception of 2002 and 2003, by whichtime almost all firms had adopted at least one OM and one HRMpractice, chi-square tests of independence with continuitycorrection were strongly significant (P-values � 0.002). There isno evidence that firms emphasized a type of practice, or that twoseparate clusters representing HRM and OM practices are likely toemerge from these data. In short, there is significant correlation inpractice use over the 24 years.
Estimating the underlying construct: Identifying yearly latent class
clusters or homogeneous groups of firms (1980–2003). As the data didnot fit either a one- or two-factor latent trait model, and failed thegoodness-of-fit tests described by Bartholomew et al. (2002: 184–188), there is no evidence of a continuous common factor. Wetherefore tested for a discrete common factor, as outlined inTable 1, and initially considered up to five latent classes–K = 2–5 in(2). However, some models resulted in multiple solutions,indicating that either sample sizes were not sufficiently large tocapture the detailed patterns that stem from large models or thatfewer homogeneous clusters are present in the data. Hence, weestimated two- and three-latent class models (up to 23 parametersin a model) in each year, and used model selection criteria to decidewhich best represented the data.
The log-likelihood-based model selection criteria (AIC, BIC,CAIC) suggested a three-cluster (latent class) solution in someyears and a two-cluster solution in others. This is illustrated in theplot of the Akaike Information Criterion (AIC) that is shown inFig. 1: the smaller the AIC statistic, the better is the model. It can beseen in the first decade of the period that two- and three-latentcluster solutions fit the data equally well. From 1989, however,three-cluster solutions fit better and, towards the end of the period,the quality of fit of the two- and three-cluster solutions begins toconverge again. It appears that the pattern of co-existence ofpractices evolves in the period investigated. Yet the ordering ofclusters oscillated between years. In order to achieve consistencyyear to year, we use order-restricted models that, as described inthe previous section, constrain the probabilities of using a practicein each class so that they do not decrease. Consequently, the latentvariable that we estimate is ordinal.
Although the three-class solution might be worse than the two-class solution in a few years, using a three-class model throughoutis suitable to most years and simplifies tracking the evolution ofpractice usage over time. We therefore concentrate on three-classmodels, which are specified so that the first cluster makes theminimum use of practices and the third the maximum use. Allestimated models are identifiable (converge to unique solutions)and satisfy the goodness-of-fit criteria, thus Proposition 1 issupported by the data.
Our results are summarized in Fig. 2a–d, which show,respectively, for each year the average number of practices usedin each cluster, the cluster sizes (i.e. number of firms in eachcluster), the number of companies per cluster that use eachpractice (i.e. the diffusion of each practice per cluster), and the(estimated) probability of usage of each practice per cluster.
As shown in Fig. 2a, practice use increases significantly in everycluster during the period studied. Firms in Cluster 3 appear to bethe innovators, who are then followed by the others. At the start ofthe study period, Cluster 3 firms had already adopted an average ofabout four different practices, which increased to just above six atthe end of the period, suggesting that most firms in this cluster useall seven practices in the final year. As Fig. 2b indicates, Cluster 3
Please cite this article in press as: de Menezes, L.M., et al., The integraits link with performance: A longitudinal latent class study. J. Opera
was initially quite small, but increased significantly in the 1990s sothat at the end of the study period it comprises more than 50% ofthe firms. The observed frequencies of adopting each practice, asshown in Fig. 2c, indicate that the typical growth curve that weassociate with diffusion processes is only completely observablefor Cluster 3.
Firms in Cluster 1 are characterized by a consistently low use ofpractices, which only increases by around the year 2000. Thiscluster comprises about 90% of the firms at the start of the studyperiod, but membership declined steadily. By contrast, Cluster 2,which contains firms with an intermediate usage of practices (anaverage use of two practices until 1990), increased in size up to2000, and then decreased, such that by 2001 the data could bereasonably represented by a high usage and a low usage group.
The observed frequencies of using a practice and the estimatedprobabilities of using a practice vary significantly from cluster tocluster (see Fig. 2c). Overall, JIT is used less and is not used inCluster 1; but in more recent years, the estimated likelihood of itsuse, according to the latent class models, increased significantly inClusters 2 and 3 (Fig. 2d—probability of usage is approximately0.70).
Fig. 2d shows the evolution of the estimated probability of usingeach practice if a firm belongs to a cluster over the years. Clusters 2and 3 are closer with regards to the estimated probabilities of usingOM practices, whereas Clusters 1 and 2 are closer with respect totheir likelihood of making use of empowerment in the early andlate years. The relative gaps between each cluster in the figuressuggest that ICT and supply-chain partnering discriminatebetween Clusters 1 and 2, whereas empowerment and teamworkdiscriminate between Clusters 2 and 3. All figures indicate thatfirms in Cluster 3 adopt an integrated management approach andare more likely to mirror those that have been described in theliterature as early implementers. If there were benefits fromhaving such an approach, we would expect this group of firms tooutperform the others.
Testing Proposition 2: The link between cluster membership and
performance (1982–2003). The association between productivity,our performance measure, and yearly cluster membership isexamined by a linear mixed model with time defined as the firstlevel, and company as the second level. A baseline growth model(i.e. with time and the controls as fixed effects) suggested a first-order autoregressive error covariance structure for the effect oftime; its fit statistics are:�2log LL = 1775, BIC = 1814, which showa significant improvement from a null model that estimates theintercept (�2log LL = 5195, BIC = 5210). To this baseline model weadded the cluster membership predictors as fixed effects, so thatwe have the model that we defined in equation (3). Results aresummarized in Table 2. This model is not an improvement inquality of fit (�2log LL = 1779, BIC = 1818) when compared to ourbaseline growth model, but indicates that belonging to the high-usage cluster (Cluster 3) is positively associated with performance(t = 2.35, p = 0.019), while belonging to the low-usage cluster is not(t = �0.44, p = 0.66). That is, a high-usage firm outperformsmedium-usage firms, though there is no difference between thosewithin low- and medium-usage groups nor is cluster membershipper se a strong predictor of productivity.
The lack of difference in productivity within the two lowerclusters tallies with our initial finding that in more recent years atwo-class model would best fit the data. In addition, given ourobservations on the extent of practice use in each cluster, we mightconclude that Cluster 3 is the only one making a fully integrateduse of practices. Indeed, this is confirmed when we consider theestimated probabilities of using each practice if a firm is in Cluster3 that resulted from the yearly models, as illustrated in Table 3. Weobserve that not only the estimated size of Cluster 3 significantlyincreases in the period, but also that by the year 2003 all seven
tion of human resource and operation management practices andtions Manage. (2010), doi:10.1016/j.jom.2010.01.002

L.M. de Menezes et al. / Journal of Operations Management xxx (2010) xxx–xxx10
G Model
OPEMAN-688; No. of Pages 17
practices are very likely to be adopted within this group of firms.All in all, those that made a more integrated use of practices arealso more likely to be high performers. These results may indicatesupport for Propositions 3 and 4, which we now formally test byfollowing the steps that were described in Table 1.
4.2. Assessing the link between stages of adoption and performance
Testing for Proposition 3: Establishing the evidence of evolution and
classifying firms according to the different stages. We first estimatedgrowth models for each practice separately. For TQM, empower-ment and ICT, the best latent class growth model is a three-classmodel, and for JIT, learning culture, supply-chain partnership and
Fig. 2. (a) Evolution of practice usage. (b) Evolution of cluster membership. (c) Frequency of
Please cite this article in press as: de Menezes, L.M., et al., The integraits link with performance: A longitudinal latent class study. J. Opera
teamwork it is a four-class model. The latent class growth models aresummarized in Table A1 (Appendix), where we report the estimatedregression coefficients, the quality of fit of the model and the size foreach class per practice. These describe the different growth curvesper practice that were identified; a higher coefficient for epochindicates higher growth. For learning culture and supply-chainpartnership, the fourth class contained less than 1% of cases, so wealso adopt three-class solutions for these practices. For JIT andteamwork, four classes were identified whose sizes were greaterthan 5%; we kept the 4-class solution, though we note that in bothcases one of the growth classes explains a very small proportion ofthe variance (low r-square). These results indicate that there arethree clearly identifiable stages in the evolution of these practices.
practice use by cluster and year. (d) Estimated probability of practice-use per Cluster.
tion of human resource and operation management practices andtions Manage. (2010), doi:10.1016/j.jom.2010.01.002

Fig. 2. (Continued ).
Table 2Cluster membership and productivity—estimates of fixed effects.
Baseline model With cluster membership added
Estimate Std error t Estimate Std error t
Intercept 9.35 0.181 51.62** 9.42 0.185 50.98**
Assets 0.1 0.016 6.47** 0.1 0.016 6.34**
Size 0.85 0.023 36.49** 0.84 0.023 36.51**
Time 0.01 0.003 3.22** 0.01 0.003 2.00*
Cluster 1–low usage �0.01 0.027 �0.44
Cluster 3–high usage 0.06 0.025 2.35*
Dependent variable: log(Value-added).* p� .05.** p� .01.
L.M. de Menezes et al. / Journal of Operations Management xxx (2010) xxx–xxx 11
G Model
OPEMAN-688; No. of Pages 17
Identifying firms according to stages of evolution of an integrated
approach. Our next step was to classify the firms based on thegrowth models. The indicators for clustering were the sevengrowth class membership variables that are categorical variablesranging from 1 to 4 in the case of JIT and teamwork, or 1 to 3 for all
Table 3High-usage cluster 3—estimated probabilities of practice use and size.
Practice Year
1980 1985
Empowerment 0.84 0.70
ICT 0.13 0.26
JIT 0.42 0.50
Learning Culture 0.67 0.74
Supply-chain 0.39 0.42
Teamwork 0.57 0.78
TQM 0.46 0.35
Size of Cluster 3 0.03 0.05
Please cite this article in press as: de Menezes, L.M., et al., The integraits link with performance: A longitudinal latent class study. J. Opera
other practices. In order to identify the number of trajectoryclusters across all practices, models with up to five latent classeswere estimated. Goodness-of-fit chi-square statistics were non-significant (p = 1.00) for models with more than three latentclasses. Three clusters are sufficient to describe the whole data and
1990 1995 2000 2003
0.71 0.95 0.98 1.00
0.52 0.89 0.95 1.00
0.70 0.94 0.90 0.84
0.62 0.94 0.96 0.99
0.62 0.93 0.96 0.95
0.79 0.96 0.95 0.97
0.54 0.96 0.97 0.98
0.14 0.30 0.44 0.60
tion of human resource and operation management practices andtions Manage. (2010), doi:10.1016/j.jom.2010.01.002
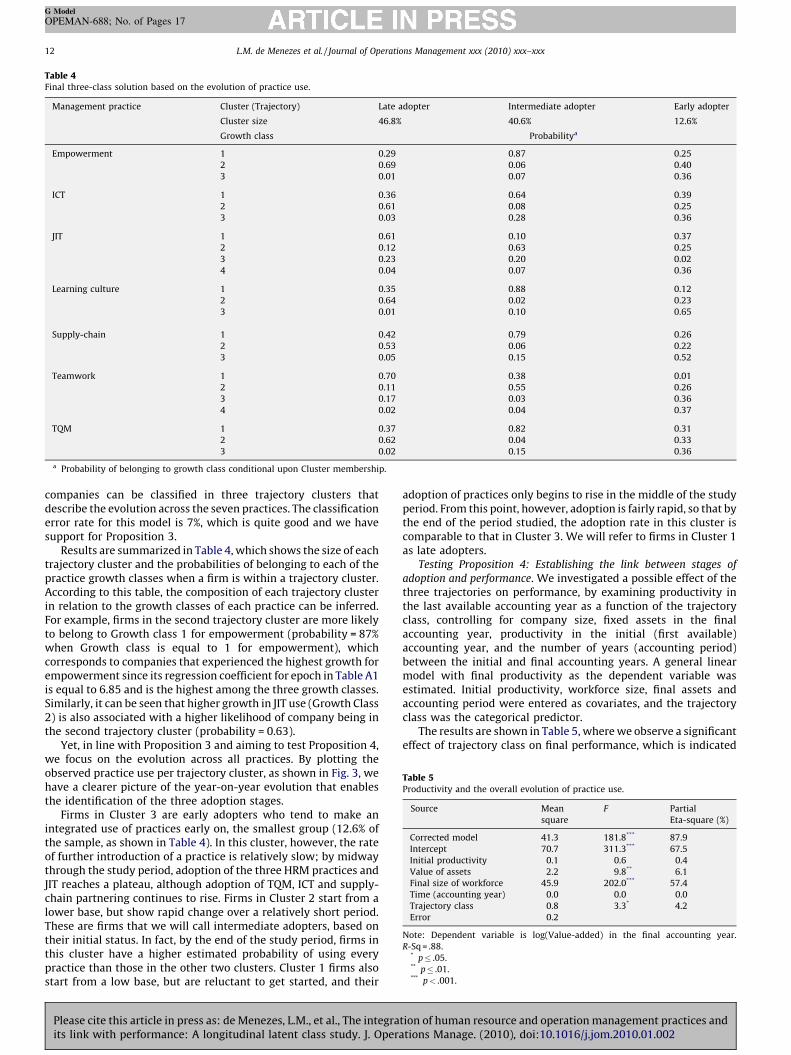
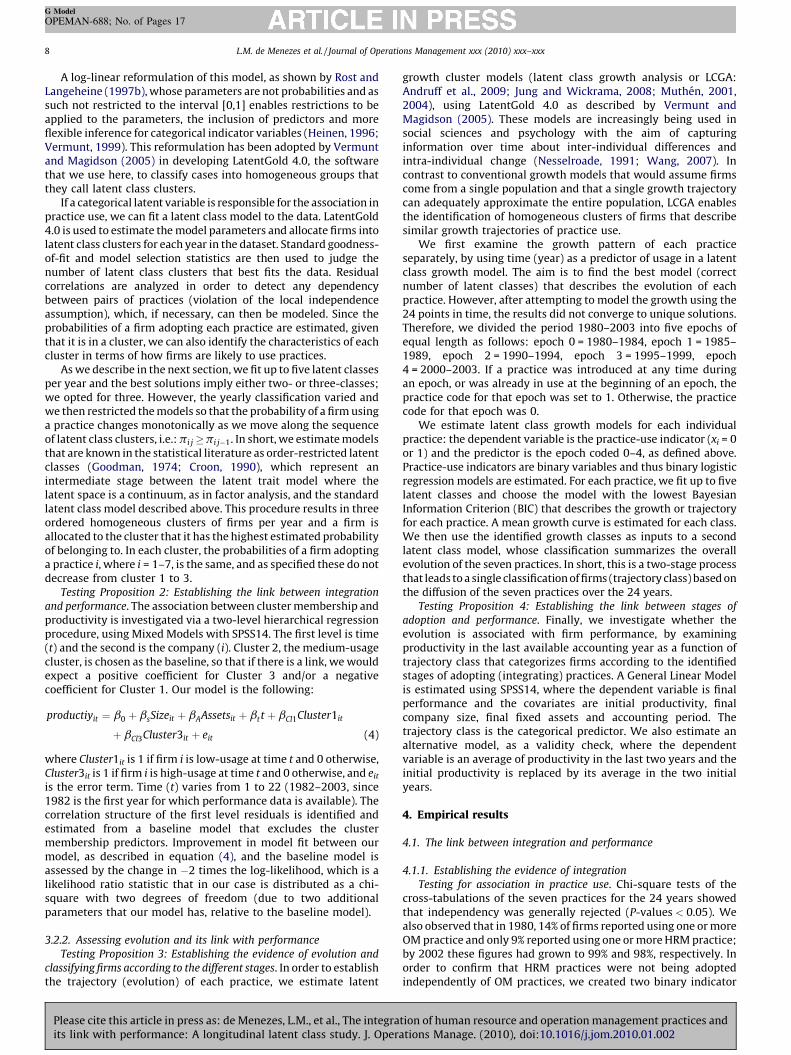
Table 4Final three-class solution based on the evolution of practice use.
Management practice Cluster (Trajectory) Late adopter Intermediate adopter Early adopter
Cluster size 46.8% 40.6% 12.6%
Growth class Probabilitya
Empowerment 1 0.29 0.87 0.25
2 0.69 0.06 0.40
3 0.01 0.07 0.36
ICT 1 0.36 0.64 0.39
2 0.61 0.08 0.25
3 0.03 0.28 0.36
JIT 1 0.61 0.10 0.37
2 0.12 0.63 0.25
3 0.23 0.20 0.02
4 0.04 0.07 0.36
Learning culture 1 0.35 0.88 0.12
2 0.64 0.02 0.23
3 0.01 0.10 0.65
Supply-chain 1 0.42 0.79 0.26
2 0.53 0.06 0.22
3 0.05 0.15 0.52
Teamwork 1 0.70 0.38 0.01
2 0.11 0.55 0.26
3 0.17 0.03 0.36
4 0.02 0.04 0.37
TQM 1 0.37 0.82 0.31
2 0.62 0.04 0.33
3 0.02 0.15 0.36
a Probability of belonging to growth class conditional upon Cluster membership.
Table 5Productivity and the overall evolution of practice use.
Source Mean
square
F Partial
Eta-square (%)
Corrected model 41.3 181.8*** 87.9
Intercept 70.7 311.3*** 67.5
Initial productivity 0.1 0.6 0.4
Value of assets 2.2 9.8** 6.1
Final size of workforce 45.9 202.0*** 57.4
Time (accounting year) 0.0 0.0 0.0
Trajectory class 0.8 3.3* 4.2
Error 0.2
Note: Dependent variable is log(Value-added) in the final accounting year.
R-Sq = .88.* p� .05.** p� .01.*** p< .001.
L.M. de Menezes et al. / Journal of Operations Management xxx (2010) xxx–xxx12
G Model
OPEMAN-688; No. of Pages 17
companies can be classified in three trajectory clusters thatdescribe the evolution across the seven practices. The classificationerror rate for this model is 7%, which is quite good and we havesupport for Proposition 3.
Results are summarized in Table 4, which shows the size of eachtrajectory cluster and the probabilities of belonging to each of thepractice growth classes when a firm is within a trajectory cluster.According to this table, the composition of each trajectory clusterin relation to the growth classes of each practice can be inferred.For example, firms in the second trajectory cluster are more likelyto belong to Growth class 1 for empowerment (probability = 87%when Growth class is equal to 1 for empowerment), whichcorresponds to companies that experienced the highest growth forempowerment since its regression coefficient for epoch in Table A1is equal to 6.85 and is the highest among the three growth classes.Similarly, it can be seen that higher growth in JIT use (Growth Class2) is also associated with a higher likelihood of company being inthe second trajectory cluster (probability = 0.63).
Yet, in line with Proposition 3 and aiming to test Proposition 4,we focus on the evolution across all practices. By plotting theobserved practice use per trajectory cluster, as shown in Fig. 3, wehave a clearer picture of the year-on-year evolution that enablesthe identification of the three adoption stages.
Firms in Cluster 3 are early adopters who tend to make anintegrated use of practices early on, the smallest group (12.6% ofthe sample, as shown in Table 4). In this cluster, however, the rateof further introduction of a practice is relatively slow; by midwaythrough the study period, adoption of the three HRM practices andJIT reaches a plateau, although adoption of TQM, ICT and supply-chain partnering continues to rise. Firms in Cluster 2 start from alower base, but show rapid change over a relatively short period.These are firms that we will call intermediate adopters, based ontheir initial status. In fact, by the end of the study period, firms inthis cluster have a higher estimated probability of using everypractice than those in the other two clusters. Cluster 1 firms alsostart from a low base, but are reluctant to get started, and their
Please cite this article in press as: de Menezes, L.M., et al., The integraits link with performance: A longitudinal latent class study. J. Opera
adoption of practices only begins to rise in the middle of the studyperiod. From this point, however, adoption is fairly rapid, so that bythe end of the period studied, the adoption rate in this cluster iscomparable to that in Cluster 3. We will refer to firms in Cluster 1as late adopters.
Testing Proposition 4: Establishing the link between stages of
adoption and performance. We investigated a possible effect of thethree trajectories on performance, by examining productivity inthe last available accounting year as a function of the trajectoryclass, controlling for company size, fixed assets in the finalaccounting year, productivity in the initial (first available)accounting year, and the number of years (accounting period)between the initial and final accounting years. A general linearmodel with final productivity as the dependent variable wasestimated. Initial productivity, workforce size, final assets andaccounting period were entered as covariates, and the trajectoryclass was the categorical predictor.
The results are shown in Table 5, where we observe a significanteffect of trajectory class on final performance, which is indicated
tion of human resource and operation management practices andtions Manage. (2010), doi:10.1016/j.jom.2010.01.002

Fig. 3. Practice evolution trajectories: proportion of firms using each practice.
L.M. de Menezes et al. / Journal of Operations Management xxx (2010) xxx–xxx 13
G Model
OPEMAN-688; No. of Pages 17
by its partial eta-squared value (last column). After accounting forthe control variables, trajectory class membership explains 4.2% ofthe remaining variation in final firm performance. Pairwisecomparison tests showed that early adopters significantlyoutperform both late and intermediate adopters (p < 0.05) inthe final accounting year, but there is no significant differencebetween late and intermediate adopters. In spite of the similarityin performance between late and intermediate adopters, we havean indication that early adoption is beneficial to the firm.
These results were confirmed by a similar model where theinitial productivity was measured as the average of the first twoavailable years, and similarly the final productivity was theaverage of the last two years. Furthermore, hierarchical regres-sions, where a baseline model had the covariates as controls andthe second model had additional dummy variables that indicatedearly and late adopters, also showed that early adopters werepositively associated with final (and average final) productivity.Given that intermediate adopters experienced rapid growth and bythe end of the period studied make a similar or even greater usageof the practices than early adopters (as shown in Fig. 3), thisproductivity differential supports Proposition 4. Furthermore, itsuggests first-movers’ advantage, which may reflect the continu-ous improvement achieved through a longer period of integratingpractices.
5. Discussion
Our review of the literature has shown that many studies haveaddressed the potential gains from combining two or moreelements of lean production, and that often such combinationsentailed both OM and HRM practices. We therefore expect asignificant correlation in the use of practices and thus a focus onseparate elements may hide the potential outcomes fromintegration. Indeed, the evidence from case studies on the
Please cite this article in press as: de Menezes, L.M., et al., The integraits link with performance: A longitudinal latent class study. J. Opera
successes of quality management and lean production suggestthat integrating OM and HRM practices is crucial (e.g. Scherrer-Rathje et al., 2009; Terziovski et al., 1996). Yet few authors haveempirically addressed the integration of management practicesand even fewer its link with productivity.
In the present study, we observed that the use of the sevenpractices evolved in a similar fashion and three homogeneousgroups that described three levels of usage were identified for eachof the 24 years studied. The assumption that practices are onlymanifest of a latent philosophy and that they would beindependent in the absence of this philosophy was supported bythe data. The choice of practices is not driven by expectations onthe performance of specific combinations but by having anintegrated system in place that reflects a managerial philosophy.Hence, the focus switches from potential efficient bundles ofpractices to this unobserved philosophy or management approach.
The implication for the practitioner is that there are no magicalsolutions or quick-fixes; the philosophy needs to be in place.Indeed, this may not be surprising when we consider how muchacademics and practitioners have written about Toyota. Thechallenge remains to fully embrace the philosophy, be it qualitymanagement, integrated manufacturing, just-in-time manufactur-ing or lean production. In fact, the need for integration betweenOM and HRM has been acknowledged in descriptions of success aswell as failures of quality management strategies. Boudreau et al.(2003) argued that in spite of a practical need for integrationbecause they are fundamentally related, the disciplines of HRMand OM tend to be taught, researched and practiced separately,often drawing on distinct disciplinary foundations. Consequently,more can be learned from addressing the interface, since OM andHRM can explain and moderate the effect of each other, in whichcase integration is crucial for competitive advantage.
Given that we had no evidence of a continuous latent variablethat would measure the underlying philosophy, latent class
tion of human resource and operation management practices andtions Manage. (2010), doi:10.1016/j.jom.2010.01.002

L.M. de Menezes et al. / Journal of Operations Management xxx (2010) xxx–xxx14
G Model
OPEMAN-688; No. of Pages 17
models enabled the identification of clusters and significantlyreduced the number of performance equations that were analyzedwhen compared to previous studies on synergies, without the needfor either arbitrary criteria or pre-specified bundles. This type ofmodel may also capture the non-linear association betweenpractice and performance that has often been mentioned. Theanalysis can be extended to ordinal or continuous manifestvariables, allowing for different levels of measurements andrestrictions to be added. If necessary, the assumption that thecorrelation between practices is only due to the philosophy beingmeasured can be relaxed. Hence, latent class models are powerfulclustering tools that can be used in future studies on large samples.In fact, if the pattern of low versus high implementation that hasbeen observed in the literature persists, such models may be morerobust than factor analysis when analyzing data that measure theextent of use. This is particularly important when addressing thelink with performance, as recent empirical work has usedstructural equation models, which assume that the data arereasonably well distributed.
We observed that some firms moved between clusters so that inthe final years only two clusters might as well have been identified.Indeed, this pattern, which is observed after 2000, is consistentwith previous research where samples were generally split intotwo groups: basic–advanced users, early–late implementers. In thepresent study, however, this pattern stems from an integrated(correlated) use of practices and its evolution, and not from anarbitrary cutting-point (e.g. use of 2/3 of practices at least 50% oftimes—Callen et al., 2003) or quality criterion (e.g. award winners).It is possible that such a pattern might have resulted from focusingon the set of the most widely used practices in a single industrysector, because similarities between firms could have facilitatedthe spread of practices and thus favor a two-way classification: use,no-use. Although the lower-usage cluster became smaller withtime, some firms have lagged behind the majority. In which case,they are either more resistant to innovations or lack theinvestment capacity. Given our data, we are unable to identifyfactors that could explain this perceived stagnation and we lookforward to further work on different industries with a wider set ofpractices and firm characteristics to clarify these findings.
Our results indicate that high usage and integration of OM andHRM practices are linked with productivity. They support previouswork on similar data (Birdi et al., 2008), which concluded thatexpectations based on the lean production concept were supportedby the data: pairwise combinations of the OM and HRM practicestended to be positively associated with productivity, while OMpractices on their own were not; supply-chain partneringpositively interacted with the other OM practices; and teamworkinteracted with most practices. In all, Birdi and his colleaguesconcluded that adopting empowerment and extensive trainingwas the key to productivity. In our view, the implication thatempowerment alone is best practice is misleading, since a clearoperational focus can be critical to its success. Nonetheless, theyalso argued that ‘‘there is no practice that does not appear to havesome effect when combined with one or more practices’’ (Birdiet al., 2008: 496). We cannot directly compare the size of effects,due to sampling variations in the models. There is no evidence,according to them, to suggest that firms using any of the sevenpractices without an individual effect on productivity should stopadopting them. Hence, they seem to have recommended thatpractices should be used as a package, in spite of some havinglarger effects. In our results, as indicated by the gaps between thecurves of each cluster in Fig. 2d, the estimated probabilities ofadopting practices in different clusters suggest that empowermentand teamwork may discriminate between medium- and high-usage firms, whereas supply-chain partnership may discriminateat the bottom end. As matter of fact, when we consider the higher-
Please cite this article in press as: de Menezes, L.M., et al., The integraits link with performance: A longitudinal latent class study. J. Opera
usage that we found to be the most productive cluster, asillustrated in Table 3 in the last year studied (2003), all firms hadintroduced empowerment and teamwork, while 15.6% had notintroduced JIT and 4.6% had not introduced supply-chain partner-ing.
We specifically examined whether there were sustainableeffects by modeling the stages of adoption. Based on the diffusionof each practice in the sample, we classified firms according towhen they adopted practices. The data unveiled three groups:early adopters, intermediate adopters and late adopters. At the endof the period, intermediate adopters had not only caught up withearly adopters but were even making more use of practices, as weillustrate in Table A2 where the actual use of practice by thedifferent groups in different years is shown. In contrast with 1990,when late and intermediate adopters rarely used the practices(median number of practices used were, respectively, 0 and 1), in2003 more practices were widespread in these groups. Neverthe-less, early adopters, a relatively small group (12.28% of the sample),outperformed the others. This final result supports the initialclaims that led to the spread of quality management as aphilosophy, which is that a cohesive management system andcontinuous improvement can become sources of competitiveadvantage. It could be that some of the early adopters in oursample were initially high performers, but since we controlled forinitial productivity and considered alternative models, we do havean indication of potential first-mover’s advantage and long-lastingeffects. It seems that benefits are sustainable over the long termand thus we were unable to observe the productivity gains of theintermediate adopters because their use of practices only caughtup with early adopters near the end of the period studied. Thisshould be further investigated within the more encompassingconcept of lean production, and preferably beyond manufacturing.In which case, we would like to stress the need for futurelongitudinal studies that include all elements of lean production,other factors that may influence the learning experience, and thediffusion of management practices.
6. Conclusion
This is the first longitudinal study on the integration betweenOM and HRM practices and firm performance in Britishmanufacturing. It contrasts with previous work, which tendedto investigate potential effects of either individual practices orspecific combinations, and focuses on the association betweenpractices and its link with productivity.
We argued that the integration of practices would reflect amanagerial approach that combines OM and HRM, as advocated inthe quality management and lean production literatures. Conse-quently, it is the integration of practices that would have the abilityto achieve multiple goals and result in superior firm performance.We used ordered restricted latent class models to identifyhomogeneous clusters of firms and established a positive linkwith performance. In addition, our analysis of the diffusion of eachpractice resulted in an alternative classification that describesthree stages of adoption, and we found that earlier integration isindeed associated with performance. Overall, the benefits appearto be sustainable. An integrated managerial philosophy ispotentially a source of competitive advantage, highlighting theimportance of continuous improvement and learning that is oftenallied to the lean production concept.
We lack information as to the extent of the use of practices andrely on single-item measures, but generally our results are quitepositive and give us insights into the potential evolution of leanproduction in British manufacturing. Moreover, we rely on just onemeasure of performance – productivity – though it may be morereliable than financial performance indices, which are more likely
tion of human resource and operation management practices andtions Manage. (2010), doi:10.1016/j.jom.2010.01.002

L.M. de Menezes et al. / Journal of Operations Management xxx (2010) xxx–xxx 15
G Model
OPEMAN-688; No. of Pages 17
to reflect several economic factors that cannot be controlled by anyindividual company and thus lead to far more complex models. Weregret not having access to data on quality and lead-time, which inour view are key outcomes.
An additional limitation is the focus on core practices that arethe most used in British manufacturing and as such by the end ofthe study period are widespread in the sample. Yet our results of apositive link between an integrated use of OM and HRM practicesand performance are consistent with more recent findings byacademics and consultants based on a cross-section of 730manufacturing firms in France, Germany, the UK and the US(Bloom et al., 2005). An index of 18 practices (OM and HRM) waspositively associated with productivity, return on capitalemployed, sales per employee, sales growth and growth in marketshare. These findings should encourage future work on moredetailed data that would allow for multi-item measures of a widerrange of practices and implementation.
In all, this research introduces a framework and statisticalmodels that are not traditionally used in empirical analysis of
Table A1Latent class growth models.
Practice Class Estimated regressio
Intercept
Empowerment 1 0.65
2 0.43
3 �1.08
ICT 1 0.46
2 0.13
3 �0.59
JIT 1 0.36
2 0.30
3 0.21
4 �0.87
Learning Culture 1 0.52
2 0.28
3 �0.80
Supply-chain 1 0.66
2 0.03
3 �0.68
Teamwork 1 0.94
2 0.38
3 �0.35
4 �0.97
TQM 1 0.60
2 0.30
3 �0.90
Table A2Observed percentage of practice use per type of adopter in three years of the study.
Practice 1980 1990
Late Intermediate Early Late
Empowerment 0.00 2.72 20.00 2.87
ICT 0.48 4.89 7.27 5.74
JIT 2.87 5.98 23.64 9.57
Learning CULTURE 0.00 2.72 36.36 2.87
Supply-chain partnering 2.39 4.89 23.64 9.57
Teamwork 1.44 2.72 27.27 4.31
TQM 0.48 2.17 16.36 2.39
Mean no. of practices 0.08 0.24 1.55 0.37
Median no. of practices 0 0 1 0
Minimum no. of practices 0 0 0 0
Maximum no. of practices 2 3 6 4
Sample size = 448; No. of early adopters = 55; No. of intermediate adopters = 184; No. o
Please cite this article in press as: de Menezes, L.M., et al., The integraits link with performance: A longitudinal latent class study. J. Opera
potential performance effects, but are fit to address the integrationof management practices in large samples. It gives evidence intothe evolution of core OM and HRM practices in Britishmanufacturing and shows that integration, early adoption andcontinuous improvement may be linked to organizational perfor-mance.
Acknowledgements
For giving access to the data, the authors are very grateful toKamal Birdi, Chris Clegg, Malcolm Patterson, Andrew Robinson andToby Wall. The authors also thank for their comments on previousversions, Canan Kocabasoglu-Hilmer, Mohan Sodhi, four anony-mous referees, and an anonymous associate editor.
Appendix A
See Tables A1 and A2.
n coefficients R-square Class size
Epoch
6.85 0.80 50.40%
3.68 0.51 40.60%
1.63 0.40 9.00%
3.82 0.77 48.50%
5.89 0.64 34.50%
4.88 0.59 17.00%
5.08 0.19 32.40%
6.48 0.82 30.40%
2.79 0.72 27.80%
�2.52 0.06 9.40%
6.96 0.80 48.80%
2.57 0.54 38.20%
4.24 0.41 13.00%
3.95 0.78 55.80%
5.56 0.53 29.60%
4.39 0.39 14.60%
3.16 0.71 50.30%
6.43 0.86 28.50%
1.42 0.01 13.80%
�2.84 0.10 7.40%
6.98 0.80 51.10%
3.02 0.57 37.60%
4.46 0.58 11.30%
2003
Intermediate Early Late Intermediate Early
18.48 43.64 77.03 97.28 69.09
35.87 45.45 84.21 95.65 87.27
35.33 54.55 63.64 88.04 65.45
22.16 72.73 83.73 98.91 85.45
17.39 81.82 81.34 95.11 83.64
19.57 58.18 81.82 91.85 67.27
13.59 69.09 85.17 98.91 78.18
1.82 3.78 5.55 6.65 6
1 4 6 7 6
0 1 2 4 4
7 7 7 7 7
f late adopters = 209.
tion of human resource and operation management practices andtions Manage. (2010), doi:10.1016/j.jom.2010.01.002

L.M. de Menezes et al. / Journal of Operations Management xxx (2010) xxx–xxx16
G Model
OPEMAN-688; No. of Pages 17
References
Abdi, F., Shavarini, S., Hoseini, S., 2006. Glean lean: how to use lean approach inservices industries? Journal of Services Research 6, 191–206.
Abernathy, F., Dunlop, J., Hammond, J., Weil, D., 2000. Control your inventory in aworld of lean retailing. Harvard Business Review, November/December, 169–176.
Anderson, J.C., Rungtusanatham, M., Schroeder, R., 1994. A theory of qualitymanagement underlying the Deming management method. Academy of Man-agement Review 19 (3), 472–509.
Andruff, H., Carraro, N., Thompson, A., Gaudreau, P., Louvet, B., 2009. Latent classgrowth modelling: a tutorial. Tutorials in Quantitative Methods for Psychology5 (1), 11–24.
Arthur, J.B., 1994. Effects of human resource systems on manufacturing perfor-mance and turnover. Academy of Management Journal 7, 670–687.
Bailey, T., 1993. Discretionary Effort and the Organization of Work: EmployeeParticipation and Work Reform since Hawthorne. Mimeo, Teachers College,Columbia University.
Balakrishnan, R., Linsmeier, T.J., Venkatachalam, M., 1996. Financial benefits fromJIT adoption: effects of costumer concentration and cost structure. The Ac-counting Review 71 (2), 183–205.
Bartholomew, D.J., Knott, M.K., 1999. Latent Variable Models and Factor Analysis,2nd ed. Arnold, London.
Bartholomew, D.J., Steele, F., Moustaki, I., Galbraith, J.I., 2002. The Analysis andInterpretation of Multivariate Data for Social Scientists. Chapman & Hall/CRC,Boca Raton.
Becker, B.E., Huselid, M.A., 2006. Strategic human resources management: where dowe go from here? Journal of Management 32 (6), 898–925.
Becker, G., Gerhart, B., 1996. The impact of HRM on organizational performance:progress and prospects. Academy of Management Journal 39 (4), 779–801.
Beer, M., Spector, B., Lawrence, R., Mills, D., Walton, R., 1984. Managing HumanAssets. The Free Press, New York.
Birdi, K., Clegg, C., Patterson, M., Robinson, A., Stride, C.B., Wall, T.D., Wood, S.J.,2008. The impact of human resource and operational management practices oncompany productivity: a longitudinal study. Personnel Psychology 61, 467–501.
Bloom, N., Dorgan, S., Dowdy, J., Rippin, T., Van Reenen, J., 2005. Managementpractices: the impact on company performance. CentrePiece, summer issue, 2–6.
Bou, J.C., Beltran, I., 2005. Total quality management, high-commitment humanresource strategy and firm performance: an empirical study. Total QualityManagement 16 (1), 71–86.
Boudreau, J., Hopp, W., McClain, J.O., Thomas, L.J., 2003. On the interface betweenoperations and human resources management. Manufacturing & Service Opera-tions Management 5 (3), 179–202.
Bryson, A., Gomez, R., Kretschmer, T., Willman, P., 2007. The diffusion of workplacevoice and high-commitment human resource management practices in Britain,1984-1998. Industrial and Corporate Change 16 (3), 395–426.
Callen, J.L., Fader, C., Krinsky, I., 2000. Just-in-time: a cross-sectional plant analysis.International Journal of Production Economics 63 (3), 277–301.
Callen, J.L., Morel, M., Fader, C., 2003. The profitability-risk tradeoff of just-in-time manufacturing technologies. Managerial and Decision Economics 24,393–402.
Capelli, P., Neumark, D., 2001. Do ‘high-performance’ work practices improveestablishment-level outcomes? Industrial Labor Relations Review 54 (4),737–775.
Carter, J.R., Narasimhan, R., 1996. Purchasing and supply chain management: futuredirections and trends. International Journal of Purchasing and Materials Man-agement 32 (1), 2–12.
Carter, P., Carter, J.R., Monczka, R.M., Slaight, T.H., Swan, A.J., 2000. The future ofpurchasing and supply: a ten year forecast. Journal of Supply Chain Manage-ment 36 (1), 14–26.
Challis, D., Samson, D., Lawson, B., 2002. Integrated manufacturing, employee andbusiness performance: Australian and New Zealand evidence. InternationalJournal of Production Research 40 (8), 1941–1964.
Chandler, G.N., McEvoy, G.M., 2000. Human resource management, TQM, and firmperformance in small and medium enterprises. Entrepreneurship Theory andPractice 25 (1), 43–47.
Croon, M.A., 1990. Latent class analysis with ordered latent classes. British Journalof Mathematical and Statistical Psychology 44, 315–331.
Cua, K.O., McKone, K.E., Schroeder, R.G., 2001. Relationships between implementa-tion of TQM, JIT, and TPM and manufacturing performance. Journal of Opera-tions Management 19 (2), 675–694.
Datta, D., Guthrie, J., Wright, P., 2005. Human resource management and laborproductivity: does industry matter? Academy of Management Journal 48, 135–145.
Dean Jr., J.W., Bowen, D.E., 1994. Management theory and total quality: improvingresearch and practice through theory development. Academy of ManagementReview 19 (3), 392–418.
Dean, J.W., Snell, S.A., 1991. Integrated manufacturing and job design: moderatingeffects of organizational inertia. Academy of Management Journal 34 (4), 776–804.
Delery, J.E., Shaw, J.D., 2001. The strategic management of people in workorganizations: review, synthesis and extension. In: Rowland, K.M., Ferris,G.R. (Eds.), Research in Personnel and Human Resource Management. JAIPress, Greenwich CT, pp. 165–197.
Please cite this article in press as: de Menezes, L.M., et al., The integraits link with performance: A longitudinal latent class study. J. Opera
Deming, W., 2000. Out of the Crisis: Quality, Productivity and Competitive Position.The MIT Press, Cambridge MA.
Dennis, P., 2002. Lean Production Simplified. Productivity Press, New York.DeSarbo, W.S., Di Benedetto, C.A., Jedidi, K., Song, M., 2006. identifying sources of
heterogeneity for empirically deriving strategic types: a constrained finite-mixture structural-equation methodology. Management Science 52 (6), 909–924.
Diamantopoulos, A., Siguaw, J.A., 2006. Formative versus reflective indicators inorganizational measure development: a comparison and empirical illustration.British Journal of Management 17 (4), 263–282.
Dow, D., Samson, D., Ford, S., 1999. Exploding the myth: do all quality managementpractices contribute to superior quality performance? Production and Opera-tions Management 8 (1), 1–27.
Dwyer, G., 2002. Quality management initiatives and people management strate-gies. International Journal of Quality and Reliability Management 19 (3), 524–539.
de Menezes, L.M., 1999. On fitting latent class models for binary data: the estima-tion of standard errors. British Journal of Mathematical and Statistical Psychol-ogy 52 (2), 149–168.
de Menezes, L.M., Wood, S., 2006. The reality of flexible work systems in Britain.International Journal of Human Resource Management 17 (2), 106–138.
Easton, G.S., Jarrell, S.L., 1998. The effects of total quality management oncorporate performance: an empirical investigation. Journal of Business 71(2), 253–307.
Flynn, B.B., Flynn, E.J., 2005. Synergies between supply chain management andquality management: emerging implications. International Journal of Produc-tion Research 43 (16), 3421–3436.
Flynn, B., Sakakibara, S., Schroeder, R., 1995. Relationship between JIT and TQM:practices and performances. Academy of Management Journal 38 (5), 1325–1360.
Freitas, I.M.B., 2008. Sources of differences in the pattern of adoption of organiza-tional and managerial innovations from early to late 1990s in the UK. ResearchPolicy 37 (1), 131–148.
Fullerton, R.R., McWatters, C.S., Fawson, C., 2003. An examination of the relationshipbetween JIT and financial performance. Journal of Operations Management 21(4), 383–404.
George, S., 1992. The Baldrige Quality System. Wiley, New York.Goldstein, H., 2003. Multilevel Statistical Models, Third Edition. Edward Arnold,
London.Goodman, L.A., 1974. Simple models for the analysis of association in cross-
classifications having ordered categories. Journal of the American StatisticalAssociation 74 (367), 537–552.
Hart, C., Schlesinger, L., 1991. Total quality management and the human resourceprofessional: applying the Baldrige framework to human resources. HumanResource Management 30 (4), 433–454.
Heinen, T., 1996. Latent Class and Discrete Latent Trait Models: Similarities andDifferences. Sage Publications, Thousand Oaks.
Hendriks, K.B., Singhal, V.R., 2001. Firm characteristics, total quality managementand financial performance. Journal of Operations Management 19 (3), 269–285.
Hopp, W.J., Spearman, M.L., 2004. To pull or not to pull: what is the question?Manufacturing and Service Operations Management 6 (2), 133–148.
Huselid, M.A., 1995. The impact of human resource management practices onturnover, productivity, and corporate financial performance. Academy of Man-agement Journal 38 (3), 635–672.
Jung, T., Wickrama, K.A.S., 2008. An introduction to latent class growth analysis andgrowth mixture modeling. Social and Personality Psychology Compass 2 (1),302–317.
Juran, J., 1993. Made in USA: a renaissance in quality. Harvard Business Review,July–August, 42–50.
Kato, T., Morishima, M., 2002. The productivity effects of participatory employmentpractices: evidence from new Japanese panel data. Industrial Relations 41 (4),487–520.
Kaynak, H., 2003. The relationship between total quality management practices andtheir effects on firm performance. Journal of Operations Management 21 (4),405–435.
Kinney, M.R., Wempe, W.F., 2002. Further evidence on the extent and origins of JIT’sprofitability effects. The Accounting Review 77 (1), 203–225.
Kollberg, B., Dahlgaard, J.J., Brehmer, P., 2007. Measuring lean initiatives in healthcare services: issues and findings. International Journal of Productivity &Performance Management 56 (1), 7–24.
Koufteros, X.A., Vonderembse, M.A., 1998. The impact of organizational structure onthe level of JIT attainment: towards theory development. International Journalof Production Research 36 (10), 2863–2878.
Kufidu, S., Vouzas, F., 1998. Human resource aspects of quality management:evidence from MNEs operating in Greece. International Journal of HumanResource Management 9 (5), 818–830.
Lawler, E.E., Mohrman, S.A., Ledford Jr., G.E., 1995. Creating High PerformanceOrganizations. Jossey-Bass, San Francisco CA.
Lazarsfeld, P.F., Henry, N.W., 1968. Latent Structure Analysis. Houghton-Mifflin,New York.
Lewis, M., 2005. Research note: a dynamic programming approach to customerrelationship pricing. Management Science 51 (6), 986–994.
Li, S., Rao, S.S., Ragu-Nathan, T.S., Ragu-Nathan, B., 2005. Development and valida-tion of a measurement instrument for studying supply management practices.Journal of Operations Management 23 (6), 618–641.
tion of human resource and operation management practices andtions Manage. (2010), doi:10.1016/j.jom.2010.01.002
L.M. de Menezes et al. / Journal of Operations Management xxx (2010) xxx–xxx 17
G Model
OPEMAN-688; No. of Pages 17
MacDuffie, J.P., 1995. Human resource bundles and manufacturing performance:organizational logic and flexible production systems in the world auto industry.Industrial and Labour Relations Review 48 (2), 197–221.
Martinez-Lorente, A., Dewhurst, F., Dale, B., 1998. Total quality management:origins and evolution of the term. The TQM Magazine 10 (6), 378–386.
McCutcheon, A.C., 1987. Latent Class Analysis. Sage Publications, Beverly Hills.Mehra, S., Inman, A.R., 2004. Purchasing management and business competitive-
ness in the coming decade. Production Planning and Control 15 (7), 710–718.Muthen, B.O., 2001. Second-generation structural equation modeling with a com-
bination of categorical and continuous latent variables: new opportunities forlatent class/latent growth modeling. In: Collins, L.M., Sayer, A. (Eds.), NewMethods for the Analysis of Change. American Psychological Association,Washington DC, pp. 291–322.
Muthen, B.O., 2004. Latent variable analysis: growth mixture modelling and relatedtechniques for longitudinal data. In: Kaplan, D. (Ed.), Handbook of QuantitativeMethodology for the Social Science. Sage Publications, Newbury Park CA, pp.345–368.
Nahm, A., Vonderembse, M.A., Koufteros, X., 2003. The impact of organizationalstructure on time-based manufacturing and performance. Journal of OperationsManagement 21 (3), 281–306.
Nahm, A., Vonderembse, M.A., Koufteros, X., 2004. The impact of organizationalculture on time-based manufacturing and performance. Decision Sciences 35(4), 579–607.
Narasimhan, R., Swink, M., Kim, S.W., 2004. Disentangling leanness and agility: anempirical investigation. Journal of Operations Management 24 (5), 421–439.
Nesselroade, J.R., 1991. Interindividual differences in intraindividual change. In:Collins, L.A., Horn, J.L. (Eds.), Best Methods for the Analysis of Change. AmericanPsychological Association, Washington DC, pp. 92–106.
Ohno, T., 1988. Toyota Production System: Beyond Large Scale Production. Produc-tivity Press, Cambridge MA.
Parker, S., 2003. Longitudinal effects of lean production on employee outcomes andthe mediating role of work characteristics. Journal of Applied Psychology 88 (4),620–634.
Patterson, M.G., West, M.A., Wall, T.D., 2004. Integrated manufacturing, empower-ment and company performance. Journal of Organizational Behavior 25 (5),641–665.
Powell, T.C., 1995. Total quality management as competitive advantage: a reviewand empirical study. Strategic Management Journal 16 (1), 15–37.
Reed, R., Lemak, D.J., Montgomery, J.C., 1996. Beyond process: TQM content and firmperformance. Academy of Management Review 21 (1), 173–202.
Rogers, E.M., 1983. Diffusion of Innovations, 3rd ed. Free Press, New York.Rost, J., Langeheine, R., 1997a. Applications of Latent Trait and Latent Class Models
in the Social Sciences. Waxmann, New York.Rost, J., Langeheine, R., 1997b. A guide through latent structure models for cate-
gorical data. In: Rost, J., Langeheine, R. (Eds.), Applications of Latent Trait andLatent Class Models in the Social Sciences. Waxmann, New York.
Samson, D., Terziovski, M., 1999. The relationship between total quality manage-ment practices and operational performance. Journal of Operations Manage-ment 17 (5), 393–409.
Scherrer-Rathje, M., Boyle, T.A., Deflorin, P., 2009. Lean, take two! Reflections fromthe second attempt at lean implementation Business Horizons 52 (1), 79–88.
Please cite this article in press as: de Menezes, L.M., et al., The integraits link with performance: A longitudinal latent class study. J. Opera
Shah, R., Ward, P.T., 2003. Lean manufacturing: context, practice bundles, andperformance. Journal of Operations Management 21 (2), 129–150.
Shah, R., Ward, P.T., 2007. Defining and developing measures of lean production.Journal of Operations Management 25 (4), 785–805.
Snell, S.A., Dean, J.W., 1992. Integrated manufacturing and human resource man-agement: a human capital perspective. Academy of Management Journal 35 (3),467–504.
Snell, S.A., Dean, J.W., 1994. Strategic compensation for integrated manufacturing:the moderating effects of jobs and organizational inertia. Academy of Manage-ment Journal 37 (5), 1109–1140.
Spear, S., Bowen, H.K., 1999. Decoding the DNA of the Toyota production system.Harvard Business Review 77 (9), 97–106.
Swank, C., 2003. The lean service machine. Harvard Business Review 81 (10), 123–129.
Terziovski, M., Sohal, A., Samson, D., 1996. Best practice implementation of totalquality management: multiple cross-case analysis of manufacturing and ser-vice organizations. Total Quality Management 7 (5), 459–482.
Vermunt, J.K., 1999. A general class of non-parametric models for ordinal categori-cal data. In: Sobel, M., Becker, M. (Eds.), Sociological Methodology, vol. 29, 187–224.
Vermunt, J.K., Magidson, J., 2005. Technical Guide for LatentGold 4. 0: Basic andAdvanced. Statistical Innovations Inc., Belmont MA.
Wall, T.D., Wood, S.J., 2005. The romance of HRM and business performance, and thecase for big science. Human Relations 58 (4), 429–462.
Walton, M., 1986. The Deming Management Method. Pedigree, New York.Wang, M., 2007. Profiling retirees in the retirement transition and adjustment
process: examining the longitudinal change patterns of retirees’ psychologicalwell-being. Journal of Applied Psychology 92 (2), 455–474.
Waterson, P., Clegg, C.W., Bolden, R., Pepper, K., Warr, P.B., Wall, T.D., 1999. The useand effectiveness of modern manufacturing practices: a survey of UK industry.International Journal of Production Research 37 (10), 2271–2292.
Wejnert, B., 2002. Integrating models of diffusion of innovations: a conceptualframework. Annual Review of Sociology 28 (1), 297–326.
Wickens, P., 1987. The Road to Nissan: Flexibility, Quality, Teamwork. Macmillan,Houndmills.
Womack, J., Jones, D., 1994. From lean production to the lean enterprise. HarvardBusiness Review 72 (1), 93–104.
Womack, J., Jones, D., Roos, D., 1990. The Machine that Changed the World. Rawson,New York.
Wood, S.J., 1996. How different are human resource practices in Japanese ‘‘trans-plants’’ in the United Kingdom? Industrial Relations 35 (4), 511–525.
Wood, S.J., de Menezes, L.M., 1998. High commitment management in theUK: evidence from the Workplace Industrial Relations Survey, and Employ-ers’ Manpower and Skills Practices Survey. Human Relations 51 (4), 485–515.
Wood, S.J., Stride, C.B., Wall, T.D., Clegg, C.W., 2004. Revisiting the use and effec-tiveness of modern management practices. Human Factors and Ergonomics inManufacturing 14 (4), 415–432.
Youndt, M.A., Snell, S.A., Dean, J.W., Lepak, D.P., 1996. Human resource manage-ment, manufacturing strategy, and firm performance. Academy of ManagementJournal 39 (4), 836–866.
tion of human resource and operation management practices andtions Manage. (2010), doi:10.1016/j.jom.2010.01.002