THE INTEGRATED GREEN ECONOMY MODELLING FRAMEWORK - … · 2 A GREEN IO-SAM MODEL An IO model is a...
20
THE INTEGRATED GREEN ECONOMY MODELLING FRAMEWORK An Overview
Transcript of THE INTEGRATED GREEN ECONOMY MODELLING FRAMEWORK - … · 2 A GREEN IO-SAM MODEL An IO model is a...

THE INTEGRATED GREEN ECONOMY MODELLING FRAMEWORKAn Overview

Copyright © United Nations Environment Programme, 2017, on behalf of PAGE
The report is published as part of the Partnership for Action on Green Economy (PAGE) – an initiative by the United Nations Environment Programme (UN Environment), the International Labour Organization (ILO), the United Nations Development Programme (UNDP), the United Nations Industrial Development Organization (UNIDO) and the United Nations Institute for Training and Research (UNITAR).
This publication may be reproduced in whole or in part and in any form for educational or non-profit purposes without special permission from the copyright holder, provided acknowledgement of the source is made. The PAGE Secretariat would appreciate receiving a copy of any publication that uses this publi-cation as a source.
No use of this publication may be made for resale or for any other commercial purpose whatsoever without prior permission in writing from the PAGE Secretariat.
Disclaimer This publication has been produced with the support of PAGE funding partners. The contents of this publication are the sole responsibility of PAGE and can in no way be taken to reflect the views of any Government. The designations employed and the presentation of the material in this publication do not imply the expression of any opinion whatsoever on the part of the PAGE partners concerning the legal status of any country, territory, city or area or of its authorities, or concerning delimitation of its frontiers or boundaries. Moreover, the views expressed do not necessarily represent the decision or the stated policy of the PAGE partners, nor does citing of trade names or commercial processes constitute endorsement.
This document was produced with the financial assistance of the European Union. The views expressed herein can in no way be taken to reflect the official opinion of the European Union.
Citation PAGE (2017), The Integrated Green Economy Modelling Framework: An Overview.
Cover Photos © UN Women/Flickr
AcknowledgementsThe Integrated Green Economy Framework was conceptualized and developed by José Pineda, Gisèle Mueller and Ronal Gainza under the guidance of Sheng Fulai of UN Environment’s Resources and Markets Branch. Substantive technical contribution for the methodological framework and simulation of results was provided by Xin Zhou (Institute for Global Environmental Strategies), Roy Boyd (Ohio University), Maria Eugenia Ibarrarán (Universidad Iberoamericana Puebla) and Steven Arquitt (Millennium Institute). Katharina Bohnenberger and Laura Russo provided excellent research assistance. This paper also greatly benefited from a workshop held in 2016 and UN Environment appreciates the technical inputs from all participants. UN Environment would also like to thank the following people, who sent written comments on a previous version of the paper, which helped to improve the final version: Nicola Cantore (UNIDO); Matthias Kern and Dorothee Georg (UN Environment); Rafael Alexandri (Subsecretaría de Planeación y Transición Energética, SENER, Mexico); Marisol Rivera; Aguirre Gómez (INECC, Mexico); Jamal Srouji (UN Environment); and Olivia Clink (UN Environment). This overview of the framework was developed under the guidance of Chiara Moroni. Design and layout by Abel Gerrits and Jessica Hyne. PAGE gratefully ac-knowledges the support of all its funding partners: European Union, Germany, Finland, Norway, Republic of Korea, Sweden, Switzerland and the United Arab Emirates.
PAGE promotes environmentally sound
practices globally and in its own activities. This report is printed on
100% recycled paper, using vegetable - based inks and other eco-friendly
practices. Our distribution policy aims to reduce PAGE’s carbon footprint.
PAGE is grateful to the European Union for providing the funding support to this project.

The Integrated Green Economy Modelling Framework
An Overview


1WHAT IS AN INCLUSIVE GREEN ECONOMY?An Inclusive Green Economy is one where growth is driven by investments that 1) reduce carbon emissions and pollution, 2) enhance energy and resource efficiency, 3) prevent the loss of biodiversity and ecosystem services, 4) increase the number of decent jobs, and 5) ensure equitable distribution of income and wealth. It is a vehicle for delivering the Sustainable Development Goals, responding to three sets of challenges facing humanity today: persistent poverty, inequitable sharing of prosperity, and overstepped planetary boundaries.
WHAT IS A MODEL?A model is a simplified representation of com-plex relationships in reality. For example, there are many factors driving climate change, but a model can relate global warming mainly to the burning of fossil fuels, thereby helping to focus policy interventions.
A model can be theoretical or empirical. In the above example, the theory states that as people use more fossil fuels, the world will get warmer. We can test this by observing wheth-er the world is actually getting warmer due to increased burning of fossil fuels.
WHAT IS THE INTEGRATED GREEN ECONOMY MODELLING FRAMEWORK?Different models exist to answer different questions. A model named “Input/Output-So-cial Accounting Matrix” (IO-SAM), for exam-ple, is often used to answer questions such as how renewable energy contributes to the over-all economy including employment and how it interacts with other industries. Another model named “Computable General Equilibrium” (CGE) is typically used to answer questions like how a fossil fuel subsidy reform is likely to impact productivity in the renewable ener-gy sector and what the implications of such a reform are on production, employment, trade, government revenue, and income distribution. A further example is a System Dynamics (SD) model, which is good at tracking a policy change’s system-wide economic, social and environmental effects.
A transition to an Inclusive Green Economy requires a combination of policy interventions with crosscutting impacts. A single model, therefore, is often inadequate to answer all the essential questions. For example, an SD mod-el may help us track the impacts of renewable energy investments on total economic output, carbon emissions and access to clean energy, but it is not so good at showing the short-term impacts on jobs across sectors. In this case, the use of IO-SAM in combination with a CGE model can make up for that deficiency.
This is the logic for our effort to integrate three major modelling tools: IO-SAM, CGE, and SD. The purpose is to help answer a wide range of questions that we often come across in the making of green economy policies. In what follows, we will describe each individual model and their integration with an example from Mexico.

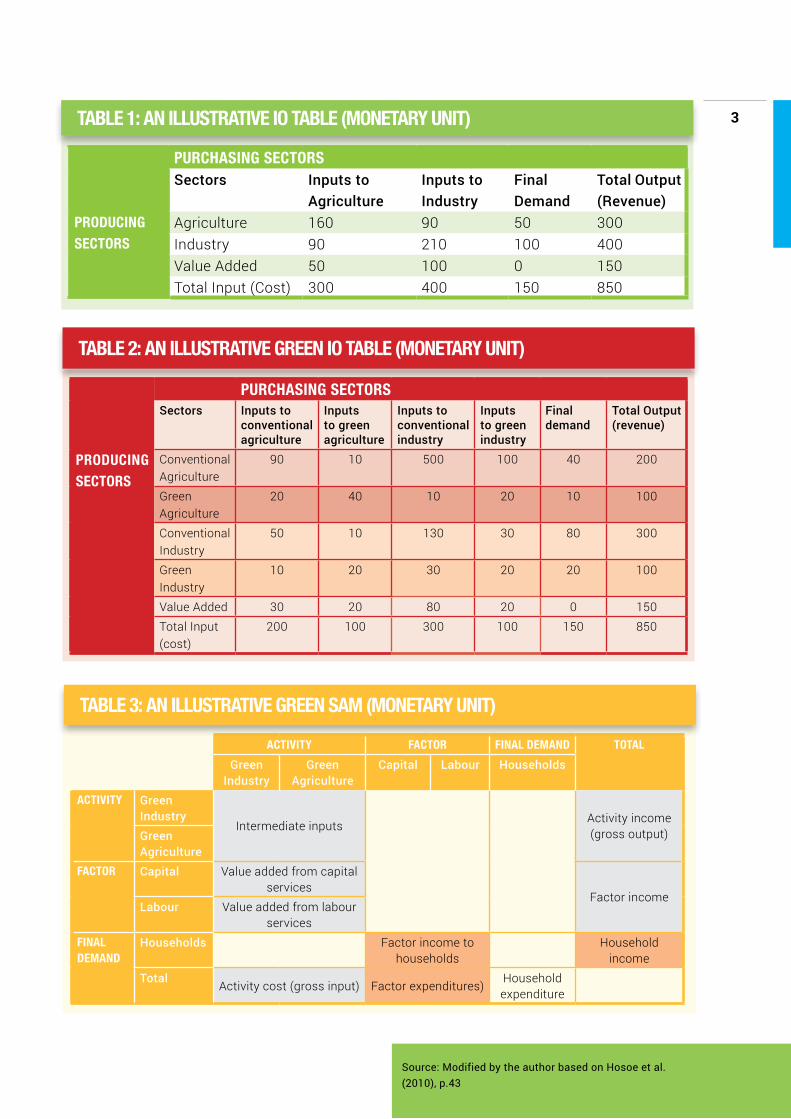
2 A GREEN IO-SAM MODELAn IO model is a table that tracks the relation-ship between the total input into production (such as labour, raw materials, energy, informa-tion, etc.) and the corresponding total output of goods and services. Table 1 illustrates an IO table with agriculture and industry sectors, which can be disaggregated (or “greened”) by their respective green components (see Table 2), distinguished from other components that use conventional technologies and practices. The “final demand” in the tables refer to things produced for final consumption.
In addition, a SAM, which is embedded in the IO table, presents the structure of a country’s overall economy, providing information on buyers in columns and producers in rows (see Table 3). Columns and rows can also be disag-gregated by “factors of production” (i.e. land, labour and capital), households, companies, and governments (the latter two are omitted in Table 3 for simplicity). A SAM’s main objec-tive is to identify who pays and who receives money.
Almost all the data in a SAM can be obtained directly or derived from the corresponding IO table. In Table 3, the grey cells can be directly obtained from Table 2. The column sum and row sum entries in white are calculated by summing across row entries or across column entries for each relevant agent. The entries shaded in orange can be calculated directly by using the row-sum and column-sum equality rule for each agent. For example, “Factor in-come” equals “Factor expenditure”, based on which “Factor income to households” can be calculated.
A GREEN CGE MODELA CGE model simulates how an economy might react to changes in policy (e.g. a tax or subsidy), technology (e.g. renewable energy) or other external factors (e.g. changes in tariff rates). The model provides information on the levels of supply and demand as well as the price that is supposed to bridge any gap between the two across various markets. The model analyses how a policy’s impact trans-mits through multiple markets.
We construct a green CGE model by incorpo-rating the latest data available in the green SAM (i.e. a SAM with disaggregated green sectors). We then disaggregate the data from the new IO tables and subsequently construct a special “green” production sector. For example, there is a different treatment of the water sector since water is not only a consumer good but also a major input to the agricultural and manufacturing sectors. To account for this added role of water in the model, the “green” IO-SAM mentioned above is used to treat water as a primary input in the green CGE model. A similar disaggregation is done for those manufacturing, refining, and chemical subsectors where environmentally efficient technologies (such as wind turbines, solar panels, efficient lights, etc.) are expect-ed to occur.
Figure 1 is an illustration of a CGE model. On the right-hand side, there are different con-sumption goods, for example: food, household goods, consumption services, energy, private and public transport, gasoline, housing and water. These are produced by combining the outputs of the producing sectors through a green IO matrix (as discussed in the previous
3
PURCHASING SECTORSSectors Inputs to
AgricultureInputs to Industry
Final Demand
Total Output (Revenue)
PRODUCING SECTORS
Agriculture 160 90 50 300Industry 90 210 100 400Value Added 50 100 0 150Total Input (Cost) 300 400 150 850
TABLE 1: AN ILLUSTRATIVE IO TABLE (MONETARY UNIT)
PURCHASING SECTORSSectors Inputs to
conventional agriculture
Inputs to green agriculture
Inputs to conventional industry
Inputs to green industry
Final demand
Total Output (revenue)
PRODUCING SECTORS
Conventional Agriculture
90 10 500 100 40 200
Green Agriculture
20 40 10 20 10 100
Conventional Industry
50 10 130 30 80 300
Green Industry
10 20 30 20 20 100
Value Added 30 20 80 20 0 150Total Input (cost)
200 100 300 100 150 850
TABLE 2: AN ILLUSTRATIVE GREEN IO TABLE (MONETARY UNIT)
ACTIVITY FACTOR FINAL DEMAND TOTAL
Green Industry
Green Agriculture
Capital Labour Households
ACTIVITY Green Industry
Intermediate inputsActivity income (gross output)Green
AgricultureFACTOR Capital Value added from capital
servicesFactor income
Labour Value added from labour services
FINAL DEMAND
Households Factor income to households
Household income
TotalActivity cost (gross input) Factor expenditures)
Household expenditure
TABLE 3: AN ILLUSTRATIVE GREEN SAM (MONETARY UNIT)
Source: Modified by the author based on Hosoe et al. (2010), p.43

4 section). On the left-hand side, consumers supply factors of production (such as labour and capital) to firms while demanding goods and services from them, whereas firms in the middle of the diagram demand factors of production and supply good and services, all through market mechanisms. Consumers are divided into four groups from 1 to 4 where the lowest income agents are represented in group 1 (20% poorest) and highest income agents in 4 (20% richest).
Production allows for different degrees of substitution between labour (formal and infor-mal), capital, energy, and non-energy inputs. Technical progress is external to the model (i.e. not determined by the interactions of the factors within the model). The government collects revenues derived from all taxes and tariffs and spends its revenues on goods and services generated from the various private production sectors through markets.
Figure 1 A CGE Model
Source: Ibarrarán et al 2015.

5A GREEN SD MODELAn SD model allows us to explore the intercon-nections among various components of a so-cioeconomic system. Each of the components (e.g. population, industry, and environment) connects others by:
• Flows: a flow can be thought of as a fau-cet and pipe assembly that fills a stock, e.g. the yearly amount that a government spends in excess of its revenues;
• Stocks: a stock can be thought of as a bathtub, e.g. the debt of a country which is the accumulation of all the previous deficits;
• Internal feedback loops: e.g. an increase in the amount of interest paid per year on the national debt will cause the overall national debt to increase. In the same way, an increase in the level of national debt will increase the amount of the interest paid each year;
• Time delays: the time lag between cause and effect.
Figure 2 shows the SD model structure with policy elements in place. Dashed arrows indi-
cate the policy information linkages. The poli-cy shown is a carbon tax policy that influences energy demand, and government expenditures for health and education.
For green economy policy analysis, the SD model is capable of connecting the following three dimensions of sustainable development:
• Economic (production and energy demand sectors);
• Social (population and fertility, education, roads infrastructure, health and mortality, and poverty sectors);
• Environmental (land-use, water demand and supply, and electricity generation and emissions sectors).
The SD component of our integrated frame-work focuses on green economy policy analysis. This green version of the SD model – which covers not only environmental sectors but also involves the use of a green IO-SAM - develops the sector structure needed to ad-dress the green economy policies under con-sideration while keeping the model flexible for interlinking with the CGE and IO components of the framework (see Figure 3).
Figure 2 System dynamic: macro structure including policy elements
Production
Working age
population
Water Supply & Demand
Health & Mortality
Policy
Electricity Generation &
Emissions
Energy Demand
Poverty Roads Infrastructure
EducationLand Use
Population Ave. years of education
Ave. life expectancy
PopulationPopulation Population Population Population
Agriculture land GDPGDP
GDP, CapitalRoad density
Ave. years of education
Ave. lifeexpectancy
Carbon taxExpenditure
Expenditure
Expenditure
GDP
Emis
sion
s
Ener
gy D
eman
d

6
APPLICATION OF THE IGEM FRAMEWORKThis section describes how the IGEM frame-work responds to major policy questions. It also presents two approaches to applying the framework.
In Figure 3, the arrows indicate the linkages between the three-component models of the integrated framework. The solid line arrows indicate explicit linkages while the dashed line arrows between the IO-SAM and SD indicate indirect linkages that occur through the CGE model. Table 4 pairs the framework’s compo-nents with the key policy questions gathered from country-level practitioners.
We can apply the framework through a tar-get-driven or policy-driven approach. Either way, the reader will have an idea of how to implement the IGEM framework in order to answer a policy question and evaluate the impacts of a target- or policy-driven approach on the different sectors of an economy.
We should note that the illustrations below abstracts from a policy’s timing dimensions (e.g. one-time change, progressive and steady change, or change biased towards the end). In applying either approach, we should take into account this important issue.
Figure 4 The framework and its components
Figure 3 The structure of the integrated green economy modelling framework

7
POLICY QUESTIONSIGEM COMPONENTS
CGE SD IO-SAM1. What are the impacts (new and shifted) of policies and investments?
X X
2. What benefits might investments and policies generate across sectors in terms of economic opportunities, inclu-siveness and environmental sustainability?
X X X
3. Are the impacts likely to be short- or long-term? X X X4. How will green subsidy reforms (e.g. feed-in tariffs) likely impact productivity in Green Economy sectors?
X X X
5. How will green tax reforms and removing fossil fuel sub-sidies mobilize domestic revenues for green investment? What will be the implications of such reforms on environ-mental, economic/fiscal and social fronts?
X X X
6. How do trade policies and regulations enhance invest-ments in Green Economy sectors?
X X
7. Which labour interventions deliver more (quantity) and better (quality including decency) green jobs? Which ap-proaches create better access for the unemployed and underemployed?
X X
8. What types of industrial policy measures are in place to support the transition towards a green economy?
X X
Table 4 Policy questions for modellers
TARGET-DRIVEN APPROACHA target-driven approach focuses on the outcome of a policy. In Figure 4, the desired outcome is the reduction of CO2 emissions. This outcome will serve to drive investments required to achieve it (at a level equal to the avoided cost of pollution so as to be economically efficient). In other words, the modelling constraint is set by the objective of a policy, which will then determine the means of implementation (i.e. imposing a carbon tax equal to the avoided cost of pollution, with tax revenue to be invested as required to reduce CO2 emissions).
As shown in the Figure 4, a target-driven approach could be the following: “achieve a target of an X per cent reduction of CO2 emissions by 2030 (compared to baseline year of 2015)”. We can then use this constraint to
calibrate the green CGE model and the green SD model along with other assumptions. Notice that we can implement a target-driven approach by trying different investment levels and by analysing how the simulated results come closer to the specific target.
POLICY-DRIVEN APPROACHIn some cases, the modeller needs to adopt a policy-driven approach to answer the question regarding a specific policy’s impacts.
As shown in Figure 5, the approach focuses on the ways of implementing a policy outcome (not necessarily quantified). The modelling constraint in this case is typically set by a financial factor (e.g. green investment, carbon tax or subsidies to renewables).

8Figure 4 Target-driven approach
Figure 5 Policy-driven approach
GREEN CGE
2) Translate emission target into an “Avoided cost of pollution” (e.g. estimated price or shadow price of an avoided metric tonne of CO2)
3) Calculate different tax rates to be applied to energy sector, using extensions to the model from IO and SAM
4b) Look at impacts in other sectors of the CGE model following the implementation of the carbon tax (redistribution of tax revenues, production, trade, employment effects, etc.)
GREEN SYSTEM DYNAMICS
1) Target: Reduction in CO2 emissions
4a) Look at impacts in other sectors of the SD model following the implementation of the carbon tax (redistribution of tax revenues, impact on physical units - e.g. on emissions and health)
(1)
(2)
GREEN CGE
1) Calibrate the model to include the tax rate of Y USD/tonne on CO2 emissions
2) Calculate economic impacts following the implementation of the carbon tax (redistribution of tax revenues, production, trade, employment effects, etc.)
5) Use SD simulation results to estimate productivity impacts in the CGE
GREEN SYSTEM DYNAMICS
3) Insert variables predicted by the CGE in SD to evaluate impact on SD sectors following the implementation of the carbon tax (redistribution of tax revenues, impact on physical units)
4) In particular, calculate how many CO2 emissions will be reduced and what are the health impacts
(1)
(2)

9
Mexico is the world’s 13th largest CO2 emitter and projected to be the 5th largest economy in 2050.1 It introduced a carbon tax on fossil fuel production in 2014. The approximate price of carbon was set at USD3.5/tCO2eq (i.e.
a policy-driven approach). Table 5 shows the different scenarios of carbon tax and how two of the integrated modelling tools (CGE and SD) can be used jointly to enrich the analysis.
1 https://www.gov.uk/government/publications/export-ing-to-mexico/exporting-to-mexico
2 The word ‘feebate’ describes a system whereby ener-gy-efficient or environmentally friendly practices receive the revenues generated from the carbon tax. In this case study, the feebate scenario includes a carbon tax that is used to subsidize the renewable energy sector. This system is oppo-site to a rebate system, in which revenues from the carbon tax are given back to consumers as a lump sum. However, in both cases, the carbon tax is revenue neutral. This means that the total tax collection is spent by the government, so that the fiscal position is not affected (the policy does not generate fiscal deficits or surpluses).
SCENARIO TAX RATE CGE SDSCENARIO 1: Feebate scenario2 with low tax rate
USD3.5/tCO2eq 1) Estimate the economic effects of feebate sce-narios compared to a rebate and a business-as-usual scenario
3) Use results from the SD to estimate effects of increased longevity on produc-tivity
2) Estimate the social and environmental impacts resulting from the CGE sim-ulation (health and emissions)
SCENARIO 2: Feebate scenario with high tax rate
USD25/tCO2eq
REBATE SCENARIO: (lump sum) with high (RH) and low (RL) tax rates
USD3.5 and USD25/tCO2eq
BUSINESS-AS-USUAL SCENARIO (BAU)
No carbon tax
Table 5 Mexico’s carbon tax: different scenarios by 2036
MODELLING FOR GREEN ECONOMY POLICY-MAKING: THE MEXICO CASE

10The following analysis (see Table 6) presents the results from running the CGE model in conjunction the SD model and using output gathered from the SD model to supplement and adjust the CGE input parameters. Since the burning of fossil fuels generates particu-lates and other harmful waste, a carbon tax would have positive impacts on the health of the population, which in turn should increase productivity as healthier individuals typically
work more and produce more. Based on these assumptions, the integrated framework con-siders any increase in longevity equal to an increase in productivity, and uses the average longevity of Mexican workers as one metric of the carbon tax’s health impacts.
SCENARIO RH WITH LONGEVITY VS BAU
RH WITH LONGEVITY VS RH WITH NO LONGEVITY
FBH WITH LONGEVITY VS FBH WITH NO LONGEVITY
GDP -2.5608% 0.3332% 1.2949%INVESTMENT -2.7583% 0.7796% 3.8981%GOVERNMENT -1.3718% 0.1916% 0.3705%
CAPITAL STOCK -2.0615% 0.2945% 1.7113%WELFARE
Agent 1 (20% poorest) -0.5612% 0.0614% 0.0709%
Agent 2 (3-5 deciles) -0.8088% 0.0585% 0.0938%
Agent 1 (6-8 deciles) -0.9121% 0.0525% 0.1438%
Agent 1 (20% richest) -1.1663% 0.0533% 0.2468% Aggregate welfare agents 1-4
-0.9912% 0.0545% 0.1786%
Government welfare 0.0583% 0.0542% 0.0471%
SELECTED SECTORS Agriculture -2.2540% 0.5032% 0.4238% Manufacturing -3.3250% 0.7797% 0.5180% Oil -19.4086% 0.3080% -1.4591% Natural Gas -18.6950% 0.3195% -1.2141% Mining -48.2412% 0.2921% 0.0974% Refining -16.7771% 0.3899% -0.1950% Electricity -5.8425% 0.4676% 23.7461%
Table 6 Results from combined use of the CGE and SD models

11We first run each model separately and then we combine them. Both models use similar assumptions and starting points for the fee-bate scenario whereby a USD25/tCO2eq tax is levied on Mexican emissions. The CGE model gives information on the economic impact, which is in turn used by the SD model to pro-vide results on longevity. Then, the CGE model uses these SD’s longevity results as inputs for the CGE productivity measurement.
The results indicate that in a scenario in which the two models are linked to capture the effects on longevity, GDP rises by about 1.3 percentage points more relative to when lon-gevity gains were not taken into account. Most of this additional rise in GDP can be attributed to increased investment, which is consistent with a feebate policy under which carbon tax revenues are re-invested in renewable energy.
In this scenario, all consumers would experi-ence welfare gains but the percentage gains would be slightly higher for higher income agents with capital income (agents 3 and 4). Most production sectors experience slight gains when longevity is considered, with the highest gains occurring in the electricity sector (where most carbon tax funds are re-invest-ed). The only production sectors that show any production declines are those related to the extraction and refining of fossil fuels.
The results suggest that in the long term, a feebate with high carbon tax rate (USD25/tCO2eq) has a positive impact on the eco-
nomic productivity and welfare at the sectoral level, particularly for the electricity sector (+23.75%). In addition, the share of renewables in total electricity generation reached in 2036 is much higher (approximately 85%). This last result highlights that productivity gains following increased longevity in the high tax feebate scenario result in the greatest impact for renewable energy development.
LOOKING FORWARDThe IGEM is the initial step we have made to integrate major modelling tools in support of policy making in the green economy space and beyond. We hope that it will provide mod-ellers with a better framework to conduct pol-icy analysis in a more integrated manner. The Mexican case study serves to illustrate how a combined application of different models can provide additional insights. Moving ahead, we look forward to working with interested part-ners to apply this framework to support policy making in specific countries.
On the technical side, we would also like to expand this framework by integrating it with additional tools such as biophysical and GIS-based models, which are critical for ana-lysing a broader set of relationships between policies and targets concerning landscapes, biodiversity and ecosystems.
The main report and supplementary materials can be accessed from -http://web.unep.org/greeneconomy/resources/publication
For requests or questions, please contact -
PAGE Secretariat UN Environment, Economics and Trade Branch

12 NOTES & REFERENCES1. Adedayo, O. A., & Anthony, E. A. (2016), “Threshold Effects between Longevity, Labour Productivity and Econom-
ic Growth in sub-Saharan Africa (SSA): a Non-dynamic Panel Data Analysis”, 3rd International Conference on African Development Issues (CUI-ICADI 2016).
2. Aghion, P., Howitt, P., & Murtin, F. (2010), “The relationship between health and growth: when Lucas meets Nelson-Phelps (No. w15813)”, National Bureau of Economic Research.
3. Ballard, C. L., Fullerton, D., Shoven, J. B., & Whalley, J. (1985). A general equilibrium model for tax policy evalua-tion, University of Chicago Press, Chicago.
4. Bergman, L. (2005), “CGE modeling of environmental policy and resource management”, Handbook of environ-mental economics 3, 1273-1306.
5. Boyd, R., & Ibarrarán, M. E. (2009), “Extreme climate events and adaptation: an exploratory analysis of drought in Mexico”, Environmental and Development Economics 14, 371-395.
6. Boyd, R., & Ibarrarán, M. E. (2002), “Cost of compliance with the Kyoto Protocol: a developing country´s per-spective”, Energy Economics 24, 21-39.
7. FAO, http://faostat.fao.org
8. Burniaux J., Truong T. “GTAP – E: an energy – environmental version of the GTAP E model”, https://www.gtap.agecon.purdue.edu/resources/download/1203.pdf
9. Caron, J., Metcalf, G., Reilly, J., 2014. The CO2 Content of Consumption Across US Regions: A Multi-Regional
10. Input-Output (MRIO) Approach. MIT Joint Program on the Science and Policy of Global Change Report No. 266. Cambridge: Massachusetts Institute of Technology (MIT).
11. Consejo Nacional de Evaluación de la Política de Desarrollo Social (2014), Metodología para la medición multidimensional de la pobreza en México (segunda edición). México, DF: CONEVAL.
12. Ibarrarán, M. E., & Boyd, R. (2006), Hacia el Futuro: Energy, Economics and the Environment in 21st Century Mexico, Springer, The Netherlands.
13. Ibarrarán, M. E., Boyd, R., & Moreno L. (2011), “Costly commitments: climate change policy in Mexico”, Latin American Policy 2 (2), 222–233.
14. Instituto Nacional de Estadistica y Geografia, INEGI (2003), Input-Output Matrix for Mexico 2003, Mexico.
15. Institute of Developing Economics, Japan External Trade Organization (IDE-JETRO), 2003. Multi-regional Input-Output Model for China 2000. IDE Statistical Data Series, No. 86.
16. Hasegawa, R., Kagawa, S., Tsukui M., 2015. Carbon footprint analysis through constructing a multi-region input–output table: A case study of Japan. Journal of Economic Structures, 2015 4:5.
17. Hosoe, N., Gasawa, K., Hashimoto, H., 2010. Textbook of Computable General Equilibrium Modelling: Program-ming and Simulation. England: Palgrave Macmillan.
18. IPCC, 2006. IPCC Guidelines for National Greenhouse Gas Inventories, http://www.ipcc-nggip.iges.or.jp/public/2006gl/
19. Lenzen, M., Pade, L.L., and Munksgaard, J., 2004. CO2 Multipliers in Multi-region Input-Output Models. Econom-ic Systems Research 16, 391-412.

1320. Leontief, W., 1936. Quantitative input-output relations in the economic system of the United States. Review of
Economics and Statistics, 18, 105-125.
21. Leontief, W., 1941. The Structure of American Economy 1919-1939. New York: Oxford University Press.
22. Lindberg, G., Hansson, H., 2009. Economic impacts of livestock production in Sweden: An input-output ap-proach. Department of Economics, Swedish University of Agricultural Sciences, Working Paper Series 2009/1.
23. Lindner, S., Legault, J., Guan, D.B., 2012. Disaggregating input–output models with incomplete information. Economic System Research, 24 (4), 329-347.
24. Lindner, S., Legault, J., Guan, D.B., 2012. Disaggregating the electricity sector of China’s input output table: Application to environmental-economic life cycle analysis. Full paper presentation at the 20th International Input-Output Conference, Bratislava, Slovakia, June 24-29, 2012. Available at: https://www.iioa.org/confer-ences/20th/papers/files/989_20120229060_Lindner_etal_IIIOAConference.pdf
25. Lofgren, H., Harris, R.L., Robinson, S., 2002. A Standard Computable General Equilibrium (CGE) Model in GAMS. International Food Policy Research Institute.
26. Miller, R. E., Blair, P.D., 2009. Input-Output Analysis: Foundations and Extensions (Second Edition). New York: Cambridge University Press.
27. Ministry of General Affairs of Japan, 2002. Chapter VI Concept, definition and scope by sector. Available at: http://www.soumu.go.jp/main_content/000327482.pdf.
28. Ministry of the Environment of Japan (MOEJ), 2012. Regarding the Revision of Environmental Industry Classi-fications (環境産業分類の改訂について). Available at: http://www.env.go.jp/policy/keizai_portal/B_industry/1-1.bunruikaitei.pdf. 75
29. Ministry of the Environment of Japan (MOEJ), 2014. Estimation of the Market Size of the Environment Industry and Examination of Environmental Business Promotion Measures Made on a Commission Basis in Fiscal 2013. Available at: http://www.env.go.jp/policy/keizai_portal/B_industry/b.houkoku2.pdf.
30. Organization of Economic Cooperation and Development (OECD). 1999. The Environmental Goods and Services Industry: Manual for Data Collection and Analysis. Available at: http://www.oecd-ilibrary.org/industry-and-ser-vices/the-environmental-goods-and-services-industry_9789264173651-en.
31. Peters, G.P., Hertwich, E.G., 2008. CO2 embodied in international trade with implications for global climate policy. Environmental Science & Technology 42(5), 1401-1407.
32. Quesnay, F., 1758. Tableau Économique.
33. Ramsey, F. (1928), “A mathematical theory of saving”, Economic Journal 38, 543-559.
34. Rutherford, Thomas F., W. David Montgomery and Paul M. Bernstein (1997), “CETM: a dynamic general equilib-rium model of global energy markets, carbon dioxide emissions and international trade”, University of Colorado Discussion Paper in Economics 97-3.
35. Sheng, F. (2016), “An Emerging Theory of an Inclusive Green Economy.” Web log post. Http://web.unep.org/greeneconomy/. N.p., 26 Jan. 2016. Web. <http://web.unep.org/greeneconomy/blogs/emerging-theory-inclu-sive-green-economy>.
36. Suh, S., Huppes, G., 2009. Chapter 14 Methods in the Life Cycle Inventory of a Product. In: Suh, S. (Ed.), Hand-book of Input-Output Economics in Industrial Ecology, Eco-Efficiency in Industry and Science 23. Springer.

1437. Swift, R. (2011), “The relationship between health and GDP in OECD countries in the very long run”, Health
economics 20(3), 306-322.
38. UNEP (2011), “Towards a Green Economy: Pathways to Sustainable Development and Poverty Eradication”, Geneva: UNEP.
39. UNEP (2012), “Measuring Progress towards an Inclusive Green Economy”, Geneva: UNEP.
40. UNEP (2013), “Green Economy Scoping Study: South African Green Economy Modelling Report (SAGEM) – Focus on Natural Resource Management, Agriculture, Transport and Energy Sectors”, Geneva: UNEP.
41. UNEP (2014a), “A Guidance Manual for Green Economy Policy Assessment”, Geneva: UNEP.
42. UNEP (2014b), “Using Indicators for Green Economy Policymaking”, Geneva: UNEP.
43. UNEP (2014c), “Green Economy Assessment Report – Kenya”, Geneva: UNEP.
44. UNEP (2014d), “Green Economy Assessment Study - Senegal”, Geneva: UNEP.
45. UNEP (2014e), “Green Economy Assessment Study – Burkina Faso”, Geneva: UNEP.
46. UNEP (2015), “Indicators for Green Economy Policymaking – A Synthesis Report of Studies in Ghana, Mauritius and Uruguay”, Geneva: UNEP.
47. U.S. Energy Information Administration (EIA) (2015), Levelized Cost and Levelized Avoided Cost of New Generation Resources in the Annual Energy Outlook 2015. https://www.eia.gov/forecasts/aeo/pdf/electrici-ty_generation.pdf
48. Wiedmann, T., (2009),“A review of recent multi-region input–output models used for consumption-based emission and resource accounting”, Ecological Economics 69, 211-222.
49. WIOD website: http://www.wiod.org/new_site/database/wiots.htm.
50. Wissema, W., and Dellink, R. (2007). “AGE analysis of the impact of a carbon energy tax on the Irish economy”, Ecological Economics 61.4, 671-683.
51. Wolsky, A.M., (1984), “Disaggregating Input-Output Models”, The Review of Economics and Statistics 66 (2), 283-291.
52. Zhou, X., (2010), Chapter 14 Environmentally Extended Multi-Region Input-Output Model: Sharing Responsibility Across the Globe. In Murray, J., Wood, R. (Eds.): The Sustainability Practitioner’s Guide to Input-Output Analysis. Common Ground Publishing LLC., Champaign, Illinois, 165-176.
53. Zhou, X., Liu, X.B., Kojima, S., (2010), Carbon Emissions Embodied in International Trade: An assessment from the Asian perspective. IGES Research Report 2010. Hayama: Institute for Global Environmental Strategies (IGES).
54. Zhou, X., Imura, H., (2011), “How does consumer behavior influence regional ecological footprints? An empirical analysis for Chinese regions based on the multi-region input-output model”, Ecological economics 71, 171-179.
55. Zhou, X., Ambiyah, A., Kojima, S., Shirakawa, H., (2013), “Accounting for the carbon footprints and embodied primary resources using multi-region input-output analysis”. Full paper presentation at the 21st International Input-Output Conference, 9-12 July 2013, Kitakyushu, Japan. Available at: http://pub.iges.or.jp/modules/envirolib/upload/4529/attach/Section_2.2_MRIO_20130130.pdf.
56. Zhou, X., Yano, T., Kojima, S., (2013), “Proposal for a national inventory adjustment for trade in the presence of border carbon adjustment: Assessing carbon tax policy in Japan”, Energy Policy 63, 1098-1110. 77
57. Zhou, X., Li, D.W., Chang, M., (2015), “Renewable Energy in China: Life cycle impact assessment based on firm-level survey”, IGES Working Paper July 2015. Hayama: Institute for Global Environmental Strategies (IGES).
58. Zhou, X., Moinuddin, M., (2015), “Economic and Employment Impact Assessment of Green Investment: A case study on Environmental Goods and Services Sector (EGSS) in Japan”, IGES Working Paper, July, 2015. IGES: Hayama. Accessed at: http://pub.iges.or.jp/modules/envirolib/view.php?docid=6541.
59. Zhou, X., Mustafa, M., (2015), “Economic and Employment Impact Assessment of Green Investment:
60. A case study on Environmental Goods and Services Sector (EGSS) in Japan”, IGES Working Paper July 2015. Hayama: Institute for Global Environmental Strategies (IGES).

15
PAGE gratefully acknowledges the support of all its funding partners:
European Union
Federal Ministry for the Environment, Nature Conservation, Building
and Nuclear Safety, Germany
Ministry for Foreign Affairs of Finland
Norwegian Ministry of Climate and Environment
Ministry of Environment, Republic of Korea
Government Offices of Sweden
Swiss Confederation, State Secretariat for Economic Affairs SECO

PAGE brings together the expertise, convening power and networks of five UN agencies – UN Environment, InternationalLabour Organization, UN DevelopmentProgramme, UN Industrial Development Organization, and UN Institute for Training and Research – to support countries in addressing one of the most pressingchallenges of the 21st century: transforming their economies and financial systems into driversof sustainability and social equity.
The Partnership supports nations and regions in reframing economic policies and practices around sustainability to foster economic growth, create income and jobs, reduce poverty and inequality, strengthen the ecological foundations of their economies and achieve the SustainableDevelopment Goals.
For further information:PAGE SecretariatUN EnvironmentEconomics and Trade Branch11-13 Chemin des AnémonesCH-1219 [email protected]
@PAGEExchange
@GreenEconomyUNEP
www.un-page.org
un-page.org/newsletterwww.un-page.org