
THE INSURABILITY AND MARKETABILITY OF RISK · THE INSURABILITY AND MARKETABILITY OF RISK While it...
17
4 THE INSURABILITY AND MARKETABILITY OF RISK While it may seem quite obvious, insurance is only a viable solution for those risks that are insurable and that yield insurance products that are marketable. What makes a risk insurable and an insurance product marketable? Insurable means that an insurance company can set a premium that accurately reflects the applicable risk. Marketable means that there must be enough individuals or businesses willing to buy coverage for the risk at a premium that covers costs and yields a profit for in- surers. The two phases of the process-<ietermining whether the risk is insurable and whether the insurance product is marketable-are usually considered in parallel rather than sequentially. The discussion of Insurability in Section I and Marketabil- ity in Section II implies no linear order. Section III of the chapter outlines how an insurer determines what premium to set based on insurability and marketability criteria and what role reinsurance plays in making certain coverages possible. I. TWO INSURABILITY CONDITIONS Insurers require the fulfillment of two primary conditions before providing coverage against an uncertain event. The first condition is the ability to identify and, possibly, quantify the risk. Insurers must know that it is possible to estimate what losses they are likely to incur when providing different levels of coverage. The second condi- tion is the ability to set premiums for each potential customer or class of customers. This requires some knowledge of the customer's risk in relation to others in the population of potential insureds. P. K. Freeman et al., Managing Environmental Risk Through Insurance © Kluwer Academic Publishers 1997
Transcript of THE INSURABILITY AND MARKETABILITY OF RISK · THE INSURABILITY AND MARKETABILITY OF RISK While it...
4
THE INSURABILITY AND MARKETABILITY OF RISK
While it may seem quite obvious, insurance is only a viable solution for those risks that are insurable and that yield insurance products that are marketable. What makes a risk insurable and an insurance product marketable? Insurable means that an insurance company can set a premium that accurately reflects the applicable risk. Marketable means that there must be enough individuals or businesses willing to buy coverage for the risk at a premium that covers costs and yields a profit for insurers.
The two phases of the process-<ietermining whether the risk is insurable and whether the insurance product is marketable-are usually considered in parallel rather than sequentially. The discussion of Insurability in Section I and Marketability in Section II implies no linear order. Section III of the chapter outlines how an insurer determines what premium to set based on insurability and marketability criteria and what role reinsurance plays in making certain coverages possible.
I. TWO INSURABILITY CONDITIONS
Insurers require the fulfillment of two primary conditions before providing coverage against an uncertain event. The first condition is the ability to identify and, possibly, quantify the risk. Insurers must know that it is possible to estimate what losses they are likely to incur when providing different levels of coverage. The second condition is the ability to set premiums for each potential customer or class of customers. This requires some knowledge of the customer's risk in relation to others in the population of potential insureds.
P. K. Freeman et al., Managing Environmental Risk Through Insurance© Kluwer Academic Publishers 1997
38 MANAGING ENVIRONMENTAL RISK THROUGH INSURANCE
An insurable risk satisfies both the first and second conditions, but does not guarantee a profitable line of business. If it is not possible to specify a rate where there is sufficient demand to yield sufficient profit for insurers to supply coverage, there will be no market for this type of coverage.
Condition 1: Identifying the Risk
Satisfying this condition requires estimates of (I) the frequency of specific events occurring, and (2) the magnitude of the loss should the event occur. Three examples illustrate the type of data used to identify the risk. In some cases this may enable the insured to specify a set of estimates on which to base an insurance premium. In other cases the data may be much less specific.
A. Fire
Rating agencies typically collect data on all the losses incurred over a period of time for a particular risk and an exposure unit. Suppose the hazard is fire and the exposure unit is a well-defined entity, such as a wood frame home to be insured for one year in California. The typical measurement is the pure premium (PP), given by:
PP = Total Losses/Exposure Unit' (4.1)
Suppose the rating agency has collected data on 100,000 wood frame homes in California and has determined that the total annual losses from fires in these types of homes over the past year is $20 million . Analysis of the collected data provides the foundation for determination of the probability and magnitude of loss that will occur. If this data is representative of the expected loss to these same 100,000 units next year, then, PP is:
(I) PP = $20,000,000/100,000 = $200
This figure is simply an average. It does not differentiate between the locations of wood frame homes in the state, the distance of each home from a fire hydrant, or the quality of the fire department serving different communities. Underwriters often take all of these factors into consideration when setting final rates. In doing so, underwriters calculate a premium that reflects the risk to particular structures.
, The pure premium nonnally considers loss adjustment expenses for settling a claim. We will assume that this component is part of total losses. For more details on calculating pure premiums see Launie, J., J. Lee, and N. Baglini, Principles of Property and Uability Underwriting (Third Edition), Insurance Institute of America, Malvern, PA, 1986.
THE INSURABILITY AND MARKETABILITY OF RISK 39
B. Earthquakes
If there were considerable data available on annual damage to wood frame homes in California from earthquakes of different magnitudes, underwriters might use a method similar to the one described above to determine the probability and magnitude of loss. Due to the infrequency of earthquakes and the relatively few number of homes insured against the earthquake peril, however, this type of analysis is not feasible at this time. Instead, insurance providers would need to turn to scientific studies by seismologists and geologists to estimate the frequency of earthquakes of different magnitudes as well as the damage that is likely to occur to different structures from such disasters. Even then, insurers may only be able to identify the risk in a rather crude way.
Figure 4.1 (page 40) depicts the type of information required to determine the pure premium for a wood frame house subject to earthquake damage in California. The x-axis (Magnitude of Loss) would be the amount of damage an earthquake might cause to a wood frame home of a given value. The y-axis (Probability) specifies the annual probability that a wood frame home in a specific region of California would suffer a specified amount of loss from an earthquake.
If these data are available from scientific studies, the pure premium in this case would be equivalent to the expected loss (E(L» which is given by the area under the curve in Figure 4.1 .
The considerable damage data collected by seismologists and engineers since the Alaskan earthquake of 1964 has increased our understanding of the performance of various types of buildings and structures in earthquakes of different magnitudes. 2
While seismologists and geologists cannot predict with certainty the probability of earthquakes of different magnitudes occurring in specific regions of California, they can provide conservative estimates of the risk. For example, it is possible to develop a worst case scenario as shown by point *A in Figure 4.1.
Where the coordinates are the probability assigned by seismologists to the most severe earthquake they consider credible, and the engineers' best estimate of the maximum likely damage to a wood frame house from such an earthquake.
C. Underground Storage Tanks (USTs)
Suppose that an insurer wants to identify the risk and to estimate the pure premium for a new technological advance, such as an improved design for USTs. Since there are no historical data associated with the risk, the insurer would have to rely on scientific studies to estimate the probabilities (Pi) and cleanup costs (1-;) associated with a particular type of defect (i) in the tank that causes a leak.
Insofar as the insurer has some confidence in these scientific estimates of the performance of the tank and the costs of the cleanup from leaks of different magnitudes, it should be able to identify the risk. If, on the other hand, the insurer is highly uncertain about the frequency or loss estimates, it may conclude that it would
2 Shah. Haresh et al.. "Managing Seismic Risk." Journal of Risk and Uncertainty. (in press).

40 MANAGING ENVIRONMENTAL RISK THROUGH INSURANCE
Figure 4.1. Determining Expected Loss to a Wood Frame House from an Earthquake in California.
(Worst Case Scenario)· A
Magnitude of Loss
be difficult to characterize the risk with any degree of accuracy. In this case it would consider USTs an uninsurable risk.
Condition 2: Setting Premiums for Specific Risks
Once a risk is identified and, in some cases, quantified, the insurer can determine what premium must be charged in order to make a profit. There are a number of factors that come into play in determining this dollar figure. 3
A. Ambiguity of Risk
Not surprisingly, the higher the uncertainty regarding the probability and magnitude of a specific loss, the higher the premium will be. As shown by a series of empirical studies, actuaries and underwriters are ambiguity-averse and risk-averse
3 A comprehensive review of the theoretical literature on the impact of these factors on the pricing of insurance and the viability of insurance markets can be found in the paper by Georges Dionne and Scott Harrington entitled "An Introduction to Insurance Economics" in Dionne. Georges and Scott Harrington. Foundations of Insurance Economics. K1uwer Academic Publishers. Boston. 1992. as well as in the other papers in the volume that the two authors have edited.
THE INSURABILITY AND MARKETABILITY OF RISK 41
so that they tend to utilize worst case scenarios, as well as estimates of expected losses, in determining what premiums to set.4
One study mailed a questionnaire to 896 underwriters in 190 randomly chosen property and casualty insurance firms to determine the pure premiums5 they would set for the risk of earthquake or a leaking UST. The earthquake scenario involved insuring a factory against property damage from a severe earthquake. The UST scenario involved liability coverage for owners of a tank containing toxic chemicals if the tank leaks. A neutral risk scenario acted as a reference point for the two contextbased scenarios. It simply provided probability and loss estimates for an unnamed peril.
For each scenario, the questionnaire presented four cases, each reflecting the degree of ambiguity and uncertainty surrounding the probability and loss as shown in Table 4.2. A well-specified probability (p) referred to a situation in which there are considerable past data on a particular event that enable "all experts to agree that the probability of a loss is p." An ambiguous probability (Ap) refers to the case where "there is wide disagreement about the estimate of p and a high degree of uncertainty among the experts." A known loss (L) indicates that all experts agree that, if a specific event occurs, the loss will equal L. An uncertain loss (UL) refers to a situation where the experts' best estimate of a loss is L, but estimates range from L.nin to L.nax.
Case I reflects well-known risks for which large actuarial databases exist, e.g. life, automobile, and fire insurance. Satellite accidents are an example of a Case 2 risk, since there is normally considerable uncertainty regarding the chances of their occurrence. If they do happen, however, the satellite is destroyed and the loss is well-specified. Playground accidents illustrate Case 3 risk, since there are good data on the chances of an accident occurring, but considerable uncertainty as to the magnitude of the liability award should a person be injured or killed. Finally, there is considerable ambiguity and uncertainty related to earthquake and UST risks so they are appropriately classified as Case 4.
In the questionnaire to the underwriters, Case I was represented by providing a well-specified probability (p=.Ol) and a well-specified loss (L=$I million). The other three cases introduced ambiguity and uncertainty. For example, the case where L=$I million, the uncertain estimates were said to range from L=$O to L=$2 million.
Forty-three insurance companies (22.6 percent of those solicited) returned one hundred seventy-one completed questionnaires (19.1 percent of the total mailed). Table 4.3 shows the average ratio of the premiums for the three cases where there is uncertainty and ambiguity in either p and/or L compared to Case I where both p and L are known. The data reveal that underwriters will charge a much higher premium when there is ambiguity and uncertainty regarding probabilities and/or losses.
4 For more details on the survey and the analysis of findings see Kunreuther, Howard, Jacqueline Meszaros, Robin Hogarth and Mark Spranka, "Ambiguity and Underwriter Decision Processes," Journal r Economic Behavior and Organization, 26, 1995, pp. 337-352.
The questionnaire instructions stated that pure premiums should exclude "loss adjustment expenses, claims expenses, commissions, premium taxes, defense costs, profits, investment return and the time valuation of money."

42 MANAGING ENVIRONMENTAL RISK THROUGH INSURANCE
Table 4.2. Classification of Risks by Degree of Ambiguity and Uncertainty
Known Loss Unknown Loss
Well-Specified Case I Case 3 Probability p.L p. UL
Life. Auto. Fire Playground Accidents
Ambiguous Case 2 Case 4 Probability Ap.L Ap.UL
Satellite. New Products Earthquake. USTs
Table 4.3. Ratio of Average Pure Premiums Specified by Underwriters Relative to Well-Specified Case (Case 1) ( P = .01; L = $1 million).
Scenario p,L Ap, L p,UL Ap, UL Case 1 Case 2 Case 3 Case 4
Neutral (N = 24) I 1.5 1.1 1.7
Earthquake (N = 23) I 1.2 1.3 1.5
UST (N = 32) I 1.5 1.4 1.8
N = Number of Respondents
Source: Kunreuther, Meszaros, Hogarth and Spranken (1995)
For example, as shown in Table 4.3, the premium for the UST scenario (Case 4) was 1.8 times higher than for the well-specified Case I scenario.
Why do actuaries and underwriters price uncertain and ambiguous risks higher than well-specified risks? In two very insightful papers,6 Stone describes insurer motivation in setting premiums for any particular risk. Insurers remain concerned about the impact of their actions on the stability and solvency of their firm.7 Insurers measure stability by the loss ratio (LR), i.e., paid losses versus written premiums for a particular risk. In order to achieve stability, a probability of less than some specified level p' (e.g., p' =.05) is required, so that the loss ratio exceeds a certain target level LR* (e.g., LR*= 1).
Insurers measure solvency by the survival constraint that relates aggregate losses for the risk in question to the current surplus, plus premiums written. It requires that the probability of insolvency be less than p" (e.g. p"= 1 in 100,000). Berger and Kunreuther have shown that, if underwriters and actuaries are mindful of the two
6 Stone, John, "A Theory of Capacity and the Insurance of Catastrophic Risks: Part I," and ..... Part II," Journal of Risk and Insurance, 40, 1973, pp. 231-243 (Part I) and 40, 1973, pp. 339-355 (Part II). 7 This model of underwriter behavior is consistent with recent analyses as to why insurance finns want to purchase reinsurance. For more details see Doherty, Neil and S. M. Tinic, "A Note on Reinsurance under Conditions of Capital Market Equilibrium," Journal of Finance. Vol. 36. 1982. pp. 949-953. and Myers. David and Clifford Smith, "On Corporate Demand for Insurance: Evidence from the Reinsurance Market," Journal of Business. 63, 1990. pp. 19-40.
THE INSURABILITY AND MARKETABILITY OF ruSK 43
constraints of stability and solvency, they will normally set higher premiums as specific risks become more ambiguous and uncertain.8
B. Adverse Selection
If the insurer cannot distinguish between the probability of loss for different risk categories, it faces the problem of adverse selection . What this means is that if the insurer sets a premium based on the average probability of a loss using the entire population as a basis for this estimate, only the poorer risks will want to purchase coverage. As a result, the insurer expects to lose money on each policy sold.
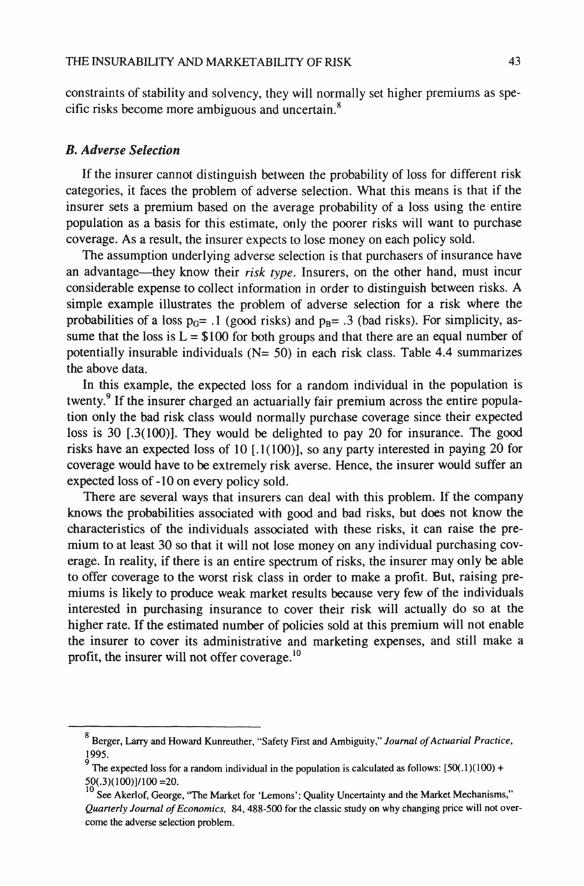
The assumption underlying adverse selection is that purchasers of insurance have an advantage-they know their risk type. Insurers, on the other hand, must incur considerable expense to collect information in order to distinguish between risks. A simple example illustrates the problem of adverse selection for a risk where the probabilities of a loss PG= .1 (good risks) and PB= .3 (bad risks). For simplicity, assume that the loss is L = $100 for both groups and that there are an equal number of potentially insurable individuals (N= 50) in each risk class. Table 4.4 summarizes the above data.
In this example, the expected loss for a random individual in the population is twenty.9 If the insurer charged an actuarially fair premium across the entire population only the bad risk class would normally purchase coverage since their expected loss is 30 [.3(100)]. They would be delighted to pay 20 for insurance. The good risks have an expected loss of to [.1(100)], so any party interested in paying 20 for coverage would have to be extremely risk averse. Hence, the insurer would suffer an expected loss of -lOon every policy sold.
There are several ways that insurers can deal with this problem. If the company knows the probabilities associated with good and bad risks, but does not know the characteristics of the individuals associated with these risks, it can raise the premium to at least 30 so that it will not lose money on any individual purchasing coverage. In reality, if there is an entire spectrum of risks, the insurer may only be able to offer coverage to the worst risk class in order to make a profit. But, raising premiums is likely to produce weak market results because very few of the individuals interested in purchasing insurance to cover their risk will actually do so at the higher rate. If the estimated number of policies sold at this premium will not enable the insurer to cover its administrative and marketing expenses, and still make a profit, the insurer will not offer coverage. 10
8 Berger, Larry and Howard Kunreuther, "Safety First and Ambiguity," Journal of Actuarial Practice, 1995. 91be expected loss for a random individual in the population is calculated as follows: [50(.1)(100) + 50(.3)(100)]/100 =20. 10 See Akerlof, George, '''The Market for 'Lemons': Quality Uncertainty and the Market Mechanisms," Quarterly Journal of Economics. 84, 488-500 for the classic study on why changing price will not overcome the adverse selection problem.
44 MANAGING ENVIRONMENTAL RISK THROUGH INSURANCE
Table 4.4. Data for Adverse Selection Example.
I Good Ri." B.d '"',
pc= .1 L= 100 N=50
PB= .3 L= 100 N =50
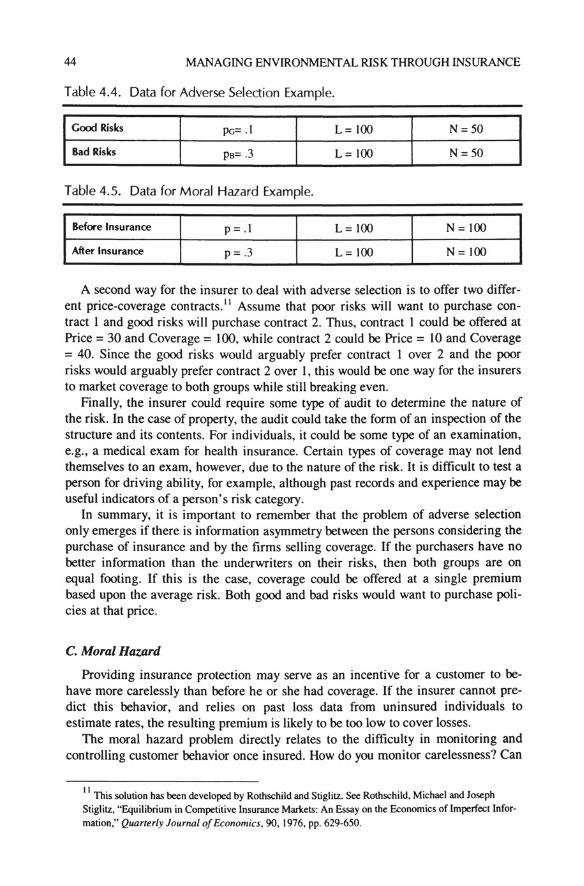
Table 4.5. Data for Moral Hazard Example.
Before Insurance P= .1 L= 100 N= 100
After Insurance P =.3 L= 100 N= 100
A second way for the insurer to deal with adverse selection is to offer two different price-coverage contracts. II Assume that poor risks will want to purchase contract 1 and good risks will purchase contract 2. Thus, contract 1 could be offered at Price = 30 and Coverage = 100, while contract 2 could be Price = 10 and Coverage = 40. Since the good risks would arguably prefer contract lover 2 and the poor risks would arguably prefer contract 2 over I, this would be one way for the insurers to market coverage to both groups while still breaking even.
Finally, the insurer could require some type of audit to determine the nature of the risk. In the case of property, the audit could take the form of an inspection of the structure and its contents. For individuals, it could be some type of an examination, e.g., a medical exam for health insurance. Certain types of coverage may not lend themselves to an exam, however, due to the nature of the risk. It is difficult to test a person for driving ability, for example, although past records and experience may be useful indicators of a person's risk category.
In summary, it is important to remember that the problem of adverse selection only emerges if there is information asymmetry between the persons considering the purchase of insurance and by the firms selling coverage. If the purchasers have no better information than the underwriters on their risks, then both groups are on equal footing. If this is the case, coverage could be offered at a single premium based upon the average risk. Both good and bad risks would want to purchase policies at that price.
C. Moral Hazard
Providing insurance protection may serve as an incentive for a customer to behave more carelessly than before he or she had coverage. If the insurer cannot predict this behavior, and relies on past loss data from uninsured individuals to estimate rates, the resulting premium is likely to be too low to cover losses.
The moral hazard problem directly relates to the difficulty in monitoring and controlling customer behavior once insured. How do you monitor carelessness? Can
II This solution has been developed by Rothschild and Stiglitz. See Rothschild, Michael and Joseph Stiglitz, "Equilibrium in Competitive Insurance Markets: An Essay on the Economics of Imperfect Infor
mation," Quarterly Journal of Economics, 90, 1976, pp. 629-650.

THE INSURABILITY AND MARKETABILITY OF RISK 45
you determine when a person decides to collect more on a damage claim than he or she deserves, e.g., making false reports or moving old furniture to the basement just before a flood hits the house?12
The example used above to illustrate adverse selection can also demonstrate moral hazard. With adverse selection, the insurer cannot distinguish between good and bad risks. Moral hazard exists because the insurer must estimate the premium based on the probability of a loss before the insurance purchase, but the actual probability of a loss may be much higher after a policy sells. Table 4.5 on the preceding page depicts these data for the case in which there are 100 individuals, each of whom face the same loss of 100. The probability of a loss, however, increases from p=.1 before insurance to p=.3 after the sale of coverage.
If the insurance company does not know moral hazard exists, it will sell policies at a price of 10 to reflect the estimated actuarial loss (.1 x 1(0). The expected loss, however, will be 30, since p increases to .3 after the insurance purchase. Therefore, the firm will lose -20 on each policy it sells.
One way to avoid the problem of moral hazard is to raise the premium to 30 to reflect the increase in the probability (p) that occurs after a policy sale. In this case, there will not be a decrease in policies sold, as there was in the adverse selection example. Those individuals willing to buy coverage at a price of 10 will still want to buy a policy at 30, since they know that their probability of a loss with insurance is .3.
Another way to avoid moral hazard is to introduce deductibles and coinsurance as part of the insurance contract. A deductible of 0 dollars means that the insured party must pay the first 0 dollars of any loss. If 0 is sufficiently large, there will be little incentive for the insureds to behave more carelessly than they did prior to purchasing coverage, because they must cover a significant portion of the loss themselves.
A related approach is to use coinsurance, which means the insurer and the firm share the loss together. An 80 percent coinsurance clause in an insurance policy means that the insurer pays 80 percent of the loss (above a deductible) and the insured pays the other 20 percent. As with a deductible, this type of risk-sharing encourages safer behavior, because the insureds want to avoid having to pay for some of the losses. 13
A fourth way of encouraging safer behavior is to place upper limits on the amount of coverage an individual or enterprise can purchase. If the insurer will only provide $500,000 worth of coverage on a structure and contents worth $1 million,
12 This is an example of ex post moral hazard where the insurer does not know the nature of the accident and hence cannot detennine whether the damage claim is exaggerated. For a more detailed discussion of ex post moral hazard in the context of insurance problems. see Spence. Michael and Richard Zeckhauser. "Insurance. Infonnation and Individual Action." American Economic Review. 61. 1971. pp.380-387 . 13 For more details on the role of deductibles and coinsurance in reducing the chances of moral hazard. see Pauly. Mark. ''The Economics of Moral Hazard: Comment." American Economic Review. 58. 1968. pp.531-536.

46 MANAGING ENVIRONMENTAL RISK THROUGH INSURANCE
then the insured knows he or she will have to incur any residual costs of losses above $SOO,OOO.14
Even with these clauses in an insurance contract, the insureds may still behave more carelessly than they would if they did not have coverage, simply because of their protection against a large portion of the loss. For example, they may decide not to take precautionary measures otherwise adopted without insurance. The insured may view the cost of these measures as too high relative to the dollar benefits potentially received from this investment.
If the insurer can learn in advance the relative likelihood that an insured develops less interest in loss reduction activity after purchasing a policy, then it can charge a higher insurance premium to reflect this increased risk - or require specific protective measure(s) as a condition of insurance. In either case, the insurer overcomes moral hazard.
D. Correlated Risk
By correlated risk we mean the simultaneous occurrence of many losses from a single event. Natural disasters, such as earthquakes and floods, are illustrations of events where the losses in a community are highly correlated; many homes in the affected area may be damaged or destroyed by a single disaster.
If insurers are concerned with the possibility of insolvency and face highly correlated risks from one event, they may want to charge a higher premium to protect themselves against the possibility of experiencing catastrophic losses. An insurer will face this problem if it has many eggs in one basket, such as mainly providing earthquake coverage to homes in Los Angeles County rather than diversifying across the entire state of California.
To illustrate the impact of correlated risks on the distribution of losses and the possibility of insolvency, assume that there are two policies sold against a risk where p= .1, L= 100 and the insurers assets are 70 prior to charging any premiums. The actuarial loss for each policy is 10. Table 4.6 on the following page depicts the probable distribution of losses for the two policies, when the losses are independent of each other and when they are perfectly correlated. 15
The expected loss for both the correlated and uncorrelated risks is 20. However, since the variance associated with the correlated risks will always be higher than uncorrelated risks having the same expected loss, insurers concerned with insolvency will want to charge a higher premium for the correlated risk. More specifically, if the insurer charges less than IS per risk, its total assets will be less than 200. If it experiences 2 losses during the year, it will be forced to declare insolvency. The probability of this happening will be .0 I if the risks are independent and .10 if the risks are perfectly correlated.
14 We are assuming that the finn will not be able to purchase a second insurance policy for $500,000 to supplement the first one and, hence. be fully protected against a loss of $1 million (except for deductibles and insurance clauses). 15 'The probabilities for the independent events were calculated as follows. l;:() occurs if neither policy suffers a loss which occurs with p=(9 X .9)= .81; L=IOO occurs if either policy I or 2 suffers a loss which has P=(2 X.I X .9)= .18; L=200occurs if both policies I and 2 suffer losses which have p=(.1 X .1)= .01.

THE INSURABILITY AND MARKETABILITY OF RISK 47
Table 4.6. Data for Correlated Risk Example.
Risks L=O L = 100 L = 200
Independent p = .81 P = .18 p= .01
Perfectly Correlated p = .9 p= .1
Empirical data on the impact of correlated risks on premium-setting behavior comes from a mail survey of professional actuaries who were members of the Casualty Actuarial Society.16 Of the 1165 individuals receiving questionnaires, 463, or 40 percent, returned valid responses. Each of the actuaries evaluated several scenarios involving hypothetical risks with loss probability either known or ambiguous. One of these scenarios involved a manufacturing company that wanted to determine the price of a warranty to cover the $100 cost of repairing a component of a personal computer. The questionnaire asked each actuary to estimate premiums for both non-ambiguous and ambiguous probabilities, with losses either independent or perfectly correlated, and p=.OOI, .01 and .10.
The impact of correlated risks appears when examining the median values of the premiums the actuaries estimated they would charge. If the actuaries express more concern about highly correlated risks than independent ones, it should be reflected in increased premiums. Greater concern for underwriters means an expectation of greater losses. One can compute the ratio of prices charged for correlated risks relative to those for independent risks, for either well-specified or ambiguous risks. Should the actuaries perceive no difference between correlated and independent risks, the premiums would be the same and the ratio of prices would be I. Should the actuaries perceive reason for concern about correlated risks, the ratio would be greater than I.
The data presented in Table 4.7 below suggest a great deal of concern about correlated risks. The median premiums for the correlated risks always proved higher than the non-correlated ones, except for well-specified risks with few expected losses and a low probability (p= .(01). The ratios became dramatically higher when the risks were ambiguous. In fact, when p= .0 I, the median premiums for correlated risks were more than 5.5 times that of independent risks.
E. Administrative Costs
The insurer must also be able to recover the costs of analyzing, underwriting, selling and distribution, claim-paying, and meeting the regulatory requirements of issuing insurance policies. Insurers usually calculate these costs, collectively referred to as "administrative expenses," as a percentage of premium dollars paid by an insured.
16 Hogarth, Robin and Howard Kunreuther, "Pricing Insurance and Warranties: Ambiguity and Correlated Risks," The Geneva Papers on Risk and Insurance Theory, 17, 1992, pp. 35-60.

48 MANAGING ENVIRONMENTAL RISK THROUGH INSURANCE
Table 4.7. Ratio of Premiums Estimated by Actuaries for Correlated Risks.
Probability level
Nature of Probability .001 .010 .100
Well-specified (p) .91 1.2 1.3
Ambiguous (Ap) 2.0 5.6 2.0
II. MARKET ABILITY CONDITIONS
Even if an insurer determines that a particular risk meets insurability conditions. the insurer will not invest the time and money to develop a product unless convinced that there is sufficient demand to cover the cost.
Demand for Coverage
There are several factors that normally trigger a business' interest in purchasing insurance. Businesses that have limited assets and/or are risk averse are anxious to transfer the risk of high consequence events to another party rather than bearing it themselves. For example. a company considering the purchase of property may be reluctant to buy if it knows it will have to pay the costs of cleanup should groundwater contamination be discovered on the property in the future.
If the property promises to yield attractive profits. the company may be willing to pay a premium in excess of the actuarially fair cost for having an insurer provide coverage against large future losses. As was discussed earlier. by having this financial protection. firms may be willing to engage in certain activities that they would otherwise avoid if they knew they were subject to a potentially catastrophic loss.
Demand for insurance also stems from third party considerations. Firms seeking capital to invest in certain activities. such as the purchase of property. must demonstrate the security of their financial position to potential lenders. In general. lenders are wary of uninsured losses. For example. banks and financial institutions normally require proof of fire insurance as a condition for issuing a mortgage. They wish to ensure that the owners can payoff the loan if a fire occurs. Similarly. banks and financial institutions sometimes require proof of insurance to cover future environmental cleanup as a condition for issuing a mortgage. They wish to ensure that the owners can payoff the loan under these conditions as well.
The demand for insurance by firms or individuals can also arise from financial responsibility requirements (FRRs). Today. motor vehicle bureaus in many states require individuals to show proof of automobile insurance as a condition for registering their cars or trucks. The Federal Insurance Administration (FIA) requires flood coverage for those residing in specially-designated flood areas who are ap-

THE INSURABILITY AND MARKETABILITY OF RISK 49
plying for a federally-insured mortgage. The U.S. EPA imposes FRRs on firms storing waste in underground storage tanks to ensure that they have sufficient funds to compensate victims for environmental damage and/or to restore the surrounding area to its former condition in the event of a tank leak.
There is an additional reason for an owner of a UST to purchase insurance to cover the costs of a leak and the replacement of the tank. Such coverage is likely to serve as a signal to potential customers and other interested parties that the tank is safe. If an insurance company puts its capital on the line by agreeing to cover potentiallosses from UST leaks, others could interpret insurance as a seal of approval for the tank. 17
An lfIustrative Example
A hypothetical example illustrates how insurance can meet the demands of a commercial enterprise. Alpha Company, a relatively small firm with assets of $100 million, is considering developing and marketing safer underground storage tanksones with a much lower probability of leaking than current models. Designing this new tank will require an up-front investment of approximately $1 million. Alpha is so confident that its new tanks will not leak that it is willing to market tanks with the guarantee that, should leakage occur within five years, Alpha will cover the buyer's cost of groundwater cleanup. Alpha's management knows that there is still a chance that one or more of its new tanks will leak during the next five years.
Because Alpha is a closely-held corporation, the owners have a large percentage of their wealth tied up in the firm. They know that any large cleanup expenditures could result in the bankruptcy of the firm. Thus, they are anxious to transfer this risk to an insurance company and are willing to pay a premium somewhat in excess of the actuarially fair value of expected future cleanup costs.
In order to obtain the capital to develop and market this new tank, Alpha must provide a guarantee to its lender that the firm will be able to cover cleanup costs in the event of a leak. One way to meet this third party concern is through the purchase of an insurance policy to cover any groundwater contamination caused by Alpha's tanks.
The potential customers interested in purchasing these tanks also are concerned with the ability of Alpha to pay for the costs of cleanup should a tank leak. Unless these customers remain confident that Alpha is financially sound, they are unlikely to trust the guarantee, or to purchase the product. The fact that Alpha has purchased insurance to cover groundwater cleanup costs could convince potential purchasers of the tank that the product is of high quality. In other words, insurance serves as a seal of approval.
17 Of course, the purchase of insurance by itself does not say anything about the magnitude of the risk. If the tank were risky, the insurer would charge a high premium that the insured could still choose to purchase. The concept of "seal of approval" used here is based solely on the availability of insurance, not the price of coverage.

50 MANAGING ENVIRONMENTAL RISK THROUGH INSURANCE
If Alpha can purchase insurance coverage to satisfy its needs, and those of other interested parties, then both Alpha and the general public benefit. Alpha engages in a new activity that it would not otherwise undertake-i.e., making new tanks. And, the probability and magnitude of groundwater contamination from leaking storage tanks is reduced when new, safer tanks replace old ones.
Role of the Broker
Before concluding this section on marketability, it is important to understand the role of the insurance broker in marketing policies. As we shall see in Chapter 6, distribution can consume almost half of the total costs required for insurance administration. Insurance companies normally rely on brokers to help market their product to commercial enterprises. Most insurance brokers are comfortable with the vast array of traditional products available to corporate customers. However, for coverage against certain risks, e.g., natural hazards and technological or environmental damage, the core of the product may rely upon extensive engineering information, which is often foreign to the non-specialty insurance broker and to the corporate risk manager.
In addition, if coverage relies upon environmental regulations, brokers must familiarize themselves with a new body of knowledge. Changes in regulations and new interpretations by the courts of both environmental law and insurance coverages present an additional sales barrier that brokers must overcome.
Brokers may also have to present environmental insurance options to an entirely new set of corporate decision-makers. Traditionally, the insurance purchase is the sole purview of the corporate risk manager, who selects the insurance based on the options presented by the broker. In the case of coverages such as environmental insurance, a whole new group of managers becomes involved, any of whom may have more authority and decision-making capability than the risk manager. General counsel; operations managers; and vice presidents of acquisition, finance, marketing, or business development may all have a vote in the final purchase of environmental insurance coverage.
Since these policies are new, and limited awareness of their importance exists within corporate structures, companies often neglect the cost of this protection in their budget. Money must often be diverted from other corporate endeavors for insurance. Even more likely, the decision to buy environmental risk insurance remains postponed until money becomes available and corporate decision-makers become more comfortable with the entire concept. This is especially true with voluntary insurance coverage not connected to a specific corporate event, such as the sale of a property.
It is largely the learning and educating tasks, which specialty brokers must perform in order to achieve sales of the environmental insurance product, that determine the level of commissions specialty brokers demand.
THE INSURABILITY AND MARKET ABILITY OF RISK 51
III. PRICING THE INSURANCE PRODUCT
The premium that the insurer charges depends on the size of the market for coverage. The size of the market, in tum, depends on the existence of a measurable baseline standard of behavior accepted by all potentially insured parties. Without this standard, it is difficult for the insurer to develop a market for its coverage.
The insurance company will normally not be the one to impose the standard on the market and have it accepted by the relevant parties. Rather, government regulation (e.g., Occupational Safety and Health Administration (OSHA) and EPA specifications for the number of permissible asbestos fibers in the air), industry standards (product specifications by trade associations), or financial institution requirements (e.g., that radon levels must be below a pre-specified level before issuing a mortgage) can all establish uniform standards.
Theoretical Analysis
In specifying a price for its product, the insurance firm relies on its insurability and marketability analyses. The process involves the following two steps:
Step 1: Estimating the Underwriting Premium
This step uses data from the insurability analysis. To initiate this step, there must be some quantification of risk by the insurer. This enables the firm to calculate an underwriting premium. The underwriting premium is defined as the expected loss from a given risk without any consideration of the costs of developing and/or marketing coverage. Denote the underwriting premium by R*. If there is considerable uncertainty associated with the risk, then R* also will reflect the dollar amount that the insurer feels it will have to charge given its attitude toward ambiguity and its degree of risk aversion.
Step 2: Specifying the Breakeven Curve
Once R* is determined, the insurer calculates the set of premiums it must charge to cover its administrative costs (F) and to make a large enough profit to justify the time and expense invested in obtaining scientific data. The administrative costs include obtaining a statistical database for estimating the risk, calculating the underwriting cost associated with setting the premium using the statistical database, obtaining the necessary regulatory approval to market a policy, and the marketing and distribution costs using a sales force to promote the product.
Define R*; as the breakeven premium as a function of the need quantity of insurance sales (Q*;) over the lifetime of the product. Figure 4.8 below depicts the set of breakeven premiums (R*;>R*) for different values of Q*; that the insurer will have to charge when the underwriting premium is R*=$600 and the fixed costs of developing and marketing are F=$l,OOO,OOO. The set of these points comprise the breakeven curve.
52 MANAGING ENVIRONMENTAL RISK THROUGH INSURANCE
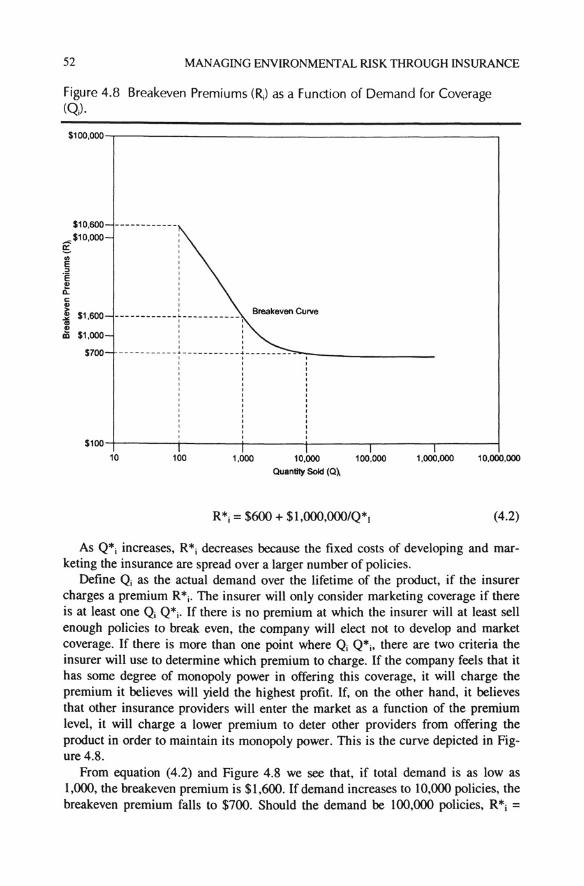
Figure 4.8 Breakeven Premiums (Rj) as a Function of Demand for Coverage (Qj).
$100,000-,---------------------------.,
$10,600 -----------..... $10,000 ~ <f)
E .~
£ co ., ~ $1,600 ... '" !!
$1,000 CD
$700 ----------- -------- -- - ---------~-~--------------------------
$100-r----r----4-----+----r----,----~
10 100 1,000 10.000 Quantity Sold (Q~
100,000
R*i = $600 + $I,OOO,OOO/Q*1
1.000,000 10,000,000
(4.2)
As Q*i increases, R*i decreases because the fixed costs of developing and marketing the insurance are spread over a larger number of policies.
Define Qi as the actual demand over the lifetime of the product, if the insurer charges a premium R*i. The insurer will only consider marketing coverage if there is at least one Qi Q*i. If there is no premium at which the insurer will at least sell enough policies to break even, the company will elect not to develop and market coverage. If there is more than one point where Qi Q*i' there are two criteria the insurer will use to determine which premium to charge. If the company feels that it has some degree of monopoly power in offering this coverage, it will charge the premium it believes will yield the highest profit. If, on the other hand, it believes that other insurance providers will enter the market as a function of the premium level, it will charge a lower premium to deter other providers from offering the product in order to maintain its monopoly power. This is the curve depicted in Figure 4.8.
From equation (4.2) and Figure 4.8 we see that, if total demand is as low as 1,000, the breakeven premium is $1,600. If demand increases to 10,000 policies, the breakeven premium falls to $700. Should the demand be 100,000 policies, R*i =
THE INSURABILITY AND MARKETABILITY OF RISK 53
$610, only slightly higher than the underwriting premium. 18 On the basis of an insurer's analysis of the market for UST insurance, for example, the insurer can now estimate whether the demand for coverage at different premiums is likely to exceed the breakeven quantities determined in equation (4.2). If the answer is "yes," UST insurance is developed and marketed. If the answer is "no,~' the insurer considers the risk uninsurable under the current system.
IV. SUMMARY
This chapter began with an examination of the two broad conditions which must be satisfied for a risk to be insurable. The first condition requires the insurer to set a pure premium by quantifying the frequency and magnitude of loss associated with specific events comprising the risk . The second condition specifies a set of factors important to consider, such as adverse selection and moral hazard, when the insurer determines what premium and coverage (e. g., maximum limits, nature of deductible) to offer.
In determining whether there is a market for insurance, it is necessary to examine the factors that influence the demand and supply of coverage. Demand normally occurs because the potential policyholder is risk averse and willing to pay a relatively small premium for protection against a large loss. Third parties and financial responsibility requirements also generate demand. Insurers become willing to supply coverage if they can estimate the expected loss from a given risk, and can do so without any consideration of the costs of developing and marketing coverage. They then need to determine whether they can set a premium that will generate enough revenue to cover both the expected loss as well as other costs.
18 Total demand refers to the number of policies sold over a number of years. If a policy is sold in the fu· ture it needs to be discounted to the present since the costs of developing and marketing the insurance are assumed to be incurred today. Given a 10 percent discount rate, 1,000 policies sold one year from now would be treated as if only 900 policies were sold.