The Institutional Arrangement and Performance … Institutional...The Institutional Arrangement and...
23
1 The Institutional Arrangement and Performance Measure of National Priority Science and Technology Programs in Taiwan Julie C. L. SUN Biotechnology Industry Study Centre, Taiwan Institute of Economic Research, Taiwan, ROC Yi-Ju Huang Biotechnology Industry Study Centre, Taiwan Institute of Economic Research, Taiwan, ROC Abstract Taiwan government has initiated several National Priority Science and Technology Programs (NPSTPs) since 1997, namely Hazards Mitigation, Telecommunications, Agricultural Biotechnology, Pharmaceuticals and Biotechnology, Genomic Medicine, Digital Archives, Systems on Chip, Nanotechnology, and e-Learning, through coordinating and integrating R&D resources nationwide. Distinguished from other government-funding R&D projects, they are formed by special institutional arrangements, across different government agencies at cabinet level, and their budgets have first priority to claim. This paper is aimed to analyze the performance of each NPSTP in terms of efficiency. Keyword: S&T policy, R&D, KPI, efficiency
Transcript of The Institutional Arrangement and Performance … Institutional...The Institutional Arrangement and...

1
The Institutional Arrangement and Performance Measure of
National Priority Science and Technology Programs in Taiwan
Julie C. L. SUN Biotechnology Industry Study Centre, Taiwan Institute of Economic Research, Taiwan, ROC
Yi-Ju Huang Biotechnology Industry Study Centre, Taiwan Institute of Economic Research, Taiwan, ROC
Abstract
Taiwan government has initiated several National Priority Science and Technology Programs (NPSTPs) since 1997, namely Hazards Mitigation, Telecommunications, Agricultural Biotechnology, Pharmaceuticals and Biotechnology, Genomic Medicine, Digital Archives, Systems on Chip, Nanotechnology, and e-Learning, through coordinating and integrating R&D resources nationwide. Distinguished from other government-funding R&D projects, they are formed by special institutional arrangements, across different government agencies at cabinet level, and their budgets have first priority to claim. This paper is aimed to analyze the performance of each NPSTP in terms of efficiency.
Keyword: S&T policy, R&D, KPI, efficiency

2
1. Introduction
In order to enhance national competitiveness, Taiwan government has initiated
several National Priority Science and Technology Programs (NPSTPs) since 1997,
namely Hazards Mitigation, Telecommunications, Agricultural Biotechnology,
Pharmaceuticals and Biotechnology, Genomic Medicine, Digital Archives, Systems
on Chip, Nanotechnology, and e-Learning, through coordinating and integrating
research and development (R&D) resources nationwide. They are mission-oriented to
meet the specific goals within a decade, including building up technological capacity,
addressing major social and economic issues, and nurturing emerging industries.
Distinguished from other government-funding R&D projects, they are formed by
special institutional arrangements, across different government agencies at cabinet
level, and their budgets have first priority to claim. In 2008 the funding of NPSTPs is
NT$11.24 billion, approximately US$350 million, and it accounts for 14.6% of
Executive Yuan Science and Technology budget.
Because of the particularity and importance of NPSTPs, in this paper, we will
try to introduce the mechanism design and some important features of these programs.
On the other hand, we will like to know the performance and efficiency of NPSTPs.
Considering the characteristic of multi-outputs and the limitation of program number,
Data envelopment analysis (DEA) is employed in this paper to proceeds the efficiency
comparison.
The remainder of this paper is organized as follows. Section 2 introduces some
important features of NPSTPs, including development history and mechanism design.
Section 3 presents the Empirical data and methodology of DEA and Malmquist
productivity index. Section 4 reports the empirical results, including efficiency score
of each NPSTP in different subset of output. The results of productivity change also
reported in Section 4. Concluding remarks and policy implications are summarized in
the final section.

3
2. National Priority Science and Technology Programs (NPSTPs)
NPSTPs should have clear and long term goals for developing innovative
technology and significant contribution to industrial competitiveness and social
welfare. Besides, NPSTPs should be those that need interdepartmental and
interdisciplinary efforts and to be directed by the government with long term supports.
Furthermore, NPSTPs should be those that engender great and vast impact,
implemented through the cooperation and integration of R&D resources in academic,
research, industrial and governmental instructions and formulated with international
and perspective vision.
Each NPSTP has a Steering Committee and Working Group. Steering Committee
is co-chaired by the Chairman of National Science Council (NSC) and a Minister
without Portfolio, the Executive Yuan. The members of the committee are Vice
Ministers and Deputy Directors responsible for R&D of related agencies of central
government. The mission of the committee is appointing the Director-General,
approving the members of Working Group, giving R&D direction, and organizing
Consultation Group to assist its program plan preparation and implementation. As for
Working Group, its mission is planning, coordinating, integrating, managing, and
reporting progress to the steering committee and the NSC’s Board Meeting. NPSTP’s
plans approved by NSC’s Board meeting shall receive top priority in budget allocation,
funded by NSC and related ministries or government agencies. NSC takes charge of
schedule control, progress audit and performance evaluation.

4
Source: Planning & Evaluation Division, National Science Council, R.O.C.

5
National Priority Science and Technology Programs
Program Name Participating Agencies Scope and Content
Telecommunications (1998~2008)
MOEA, MOTC, MOE, NSC
Broadband Internet • DWDM (dense wavelength division
multiplexing) • Broadband Access • QoS Oriented Networking • Broadband Application Wireless Communication • WB-CDMA WLL(wide band code division
multiple access systems for wireless local loop)
• 3G Mobile Radio Systems • Wireless Internet and High Speed Wireless
Local Area Network National Broadband Experiment Network
(NBEN)
Systems on Chip (2003~) MOEA, MOE, NSC
To establish the new design environment for SoC design
To establish the new service model for SoC design
To promote IP Mall service To promote platform service To promote innovative design
Nanotechnology (2003~)
MOEA, NSC, MOE, Academia Sinica
Academic Excellence Research Program • Basic research on nanoscience • Synthesis, assembly and processing of
Nanomaterials • Development of manipulation techniques
and fabrication of functional nanodevices • Nano-biotechnology • Energy applications Nanotechnology Industrialization Program • To enhance core facility and network • To speed up the development of
nanotechnology • To develop and apply novel properties of
nano-materials • To leverage the existing industrial
knowledge and create new opportunities • To integrate new technical findings into the
most competitive technologies and industries in Taiwan
Education Program Core Facilities Program
Agricultural Biotechnology (1999~2008)
COA, Academia Sinica, NSC, MOEA
Floral (Chrysanthemum and orchids) Chinese herb based functional food. Shrimp, Cobia, Grouper and Taiwan tilapia Swine and chicken Animal vaccine and adjuvant Post-harvest technology for vegetables and
fruits Stress tolerant varieties, bio-fertilizers
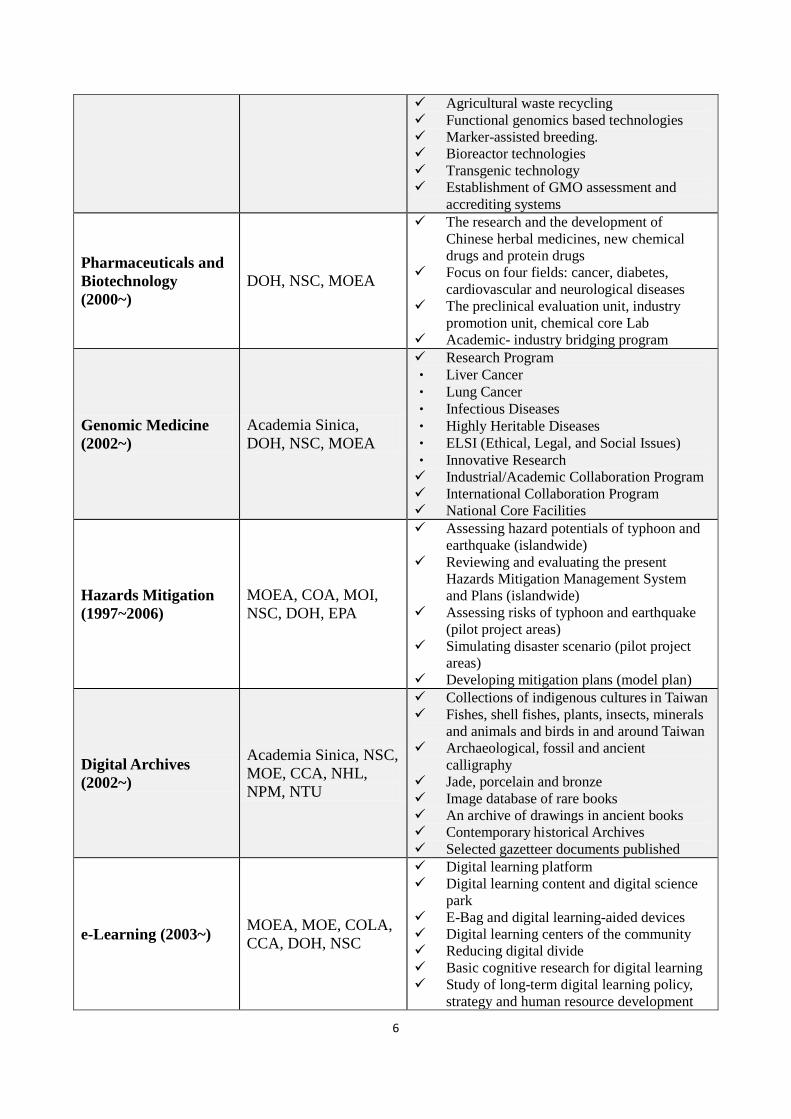
6
Agricultural waste recycling Functional genomics based technologies Marker-assisted breeding. Bioreactor technologies Transgenic technology Establishment of GMO assessment and
accrediting systems
Pharmaceuticals and Biotechnology (2000~)
DOH, NSC, MOEA
The research and the development of Chinese herbal medicines, new chemical drugs and protein drugs
Focus on four fields: cancer, diabetes, cardiovascular and neurological diseases
The preclinical evaluation unit, industry promotion unit, chemical core Lab
Academic- industry bridging program
Genomic Medicine (2002~)
Academia Sinica, DOH, NSC, MOEA
Research Program • Liver Cancer • Lung Cancer • Infectious Diseases • Highly Heritable Diseases • ELSI (Ethical, Legal, and Social Issues) • Innovative Research Industrial/Academic Collaboration Program International Collaboration Program National Core Facilities
Hazards Mitigation (1997~2006)
MOEA, COA, MOI, NSC, DOH, EPA
Assessing hazard potentials of typhoon and earthquake (islandwide)
Reviewing and evaluating the present Hazards Mitigation Management System and Plans (islandwide)
Assessing risks of typhoon and earthquake (pilot project areas)
Simulating disaster scenario (pilot project areas)
Developing mitigation plans (model plan)
Digital Archives (2002~)
Academia Sinica, NSC, MOE, CCA, NHL, NPM, NTU
Collections of indigenous cultures in Taiwan Fishes, shell fishes, plants, insects, minerals
and animals and birds in and around Taiwan Archaeological, fossil and ancient
calligraphy Jade, porcelain and bronze Image database of rare books An archive of drawings in ancient books Contemporary historical Archives Selected gazetteer documents published
e-Learning (2003~) MOEA, MOE, COLA, CCA, DOH, NSC
Digital learning platform Digital learning content and digital science
park E-Bag and digital learning-aided devices Digital learning centers of the community Reducing digital divide Basic cognitive research for digital learning Study of long-term digital learning policy,
strategy and human resource development

7
3. Methodology and Empirical data
3.1. Methodology of DEA
Data envelopment analysis (DEA) is known as a mathematical procedure which
Coelli (1996) use a linear programming technique to assess the efficiencies of
decision-making units (DMUs). DEA also construct a non-parametric piecewise
frontier of DMUs that owns optimal efficiency over datasets for the comparative
efficiency measurement. Those DMUs which located at the efficiency frontier have
their maximum outputs generated among all DMUs by taking the minimum level of
inputs, are efficient DMUs, and own the best efficiency among all DMUs. The
advantages of DEA do not need to specify either the production functional form or
weights on different inputs and outputs and offer the detailed information on the
efficiency of the unit to specific efficient units which can be identified as comparators
(Hawdon, 2003; Lovell and Schmidt, 1993).
DEA models can be divided into the CCR model and the BCC model. The
distinction between the two models lie in the assumption on returns to scale. The
CCR model, which is the first DEA model suggested by Charnes et al. (1978),
assumes constant returns to scale; whereas, the BCC model proposed by Banker et al.
(1984) assumes variable returns to scale. DEA models are also distinguished by the
objective of a model: maximize outputs or minimize inputs.
In the output-orientated CRS DEA model, we can assume there are data on K
inputs and M outputs for each of N firms. For the i-th firm these are represented by
the column vectors x i and y i . The K×N input matrix X and the M×N output matrix
Y represent the data for all N firms. The output-oriented CRS DEA model then
solves the following linear programming problem for i firm in each year:
,max θθλ
,0.. ≥+− λθ Yyts i (1)
8
,0≥− λXxi
,0≥λ
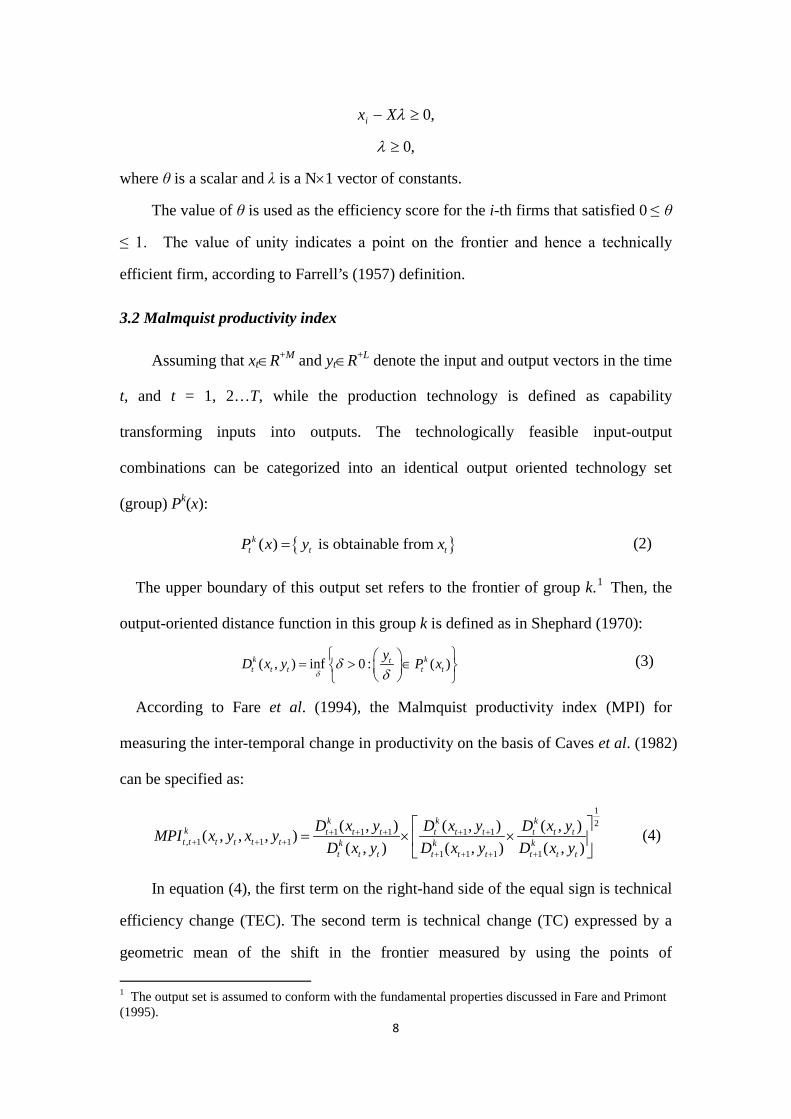
where θ is a scalar and λ is a N×1 vector of constants.
The value of θ is used as the efficiency score for the i-th firms that satisfied 0 ≤ θ
≤ 1. The value of unity indicates a point on the frontier and hence a technically
efficient firm, according to Farrell’s (1957) definition.
3.2 Malmquist productivity index
Assuming that xt∈R+M and yt∈R+L denote the input and output vectors in the time
t, and t = 1, 2…T, while the production technology is defined as capability
transforming inputs into outputs. The technologically feasible input-output
combinations can be categorized into an identical output oriented technology set
(group) Pk(x):
{ }( ) is obtainable from =kt t tP x y x (2)
The upper boundary of this output set refers to the frontier of group k.1 Then, the
output-oriented distance function in this group k is defined as in Shephard (1970):
( , ) inf 0 : ( )δ
δδ
= > ∈
k ktt t t t t
yD x y P x (3)
According to Fare et al. (1994), the Malmquist productivity index (MPI) for
measuring the inter-temporal change in productivity on the basis of Caves et al. (1982)
can be specified as:
12
1 1 1 1 1, 1 1 1
1 1 1 1
( , ) ( , ) ( , )( , , , )( , ) ( , ) ( , )
+ + + + ++ + +
+ + + +
= × ×
k k kk t t t t t t t t tt t t t t t k k k
t t t t t t t t t
D x y D x y D x yMPI x y x yD x y D x y D x y
(4)
In equation (4), the first term on the right-hand side of the equal sign is technical
efficiency change (TEC). The second term is technical change (TC) expressed by a
geometric mean of the shift in the frontier measured by using the points of
1 The output set is assumed to conform with the fundamental properties discussed in Fare and Primont (1995).
9
input-output combinations of periods t and t+1 as reference.
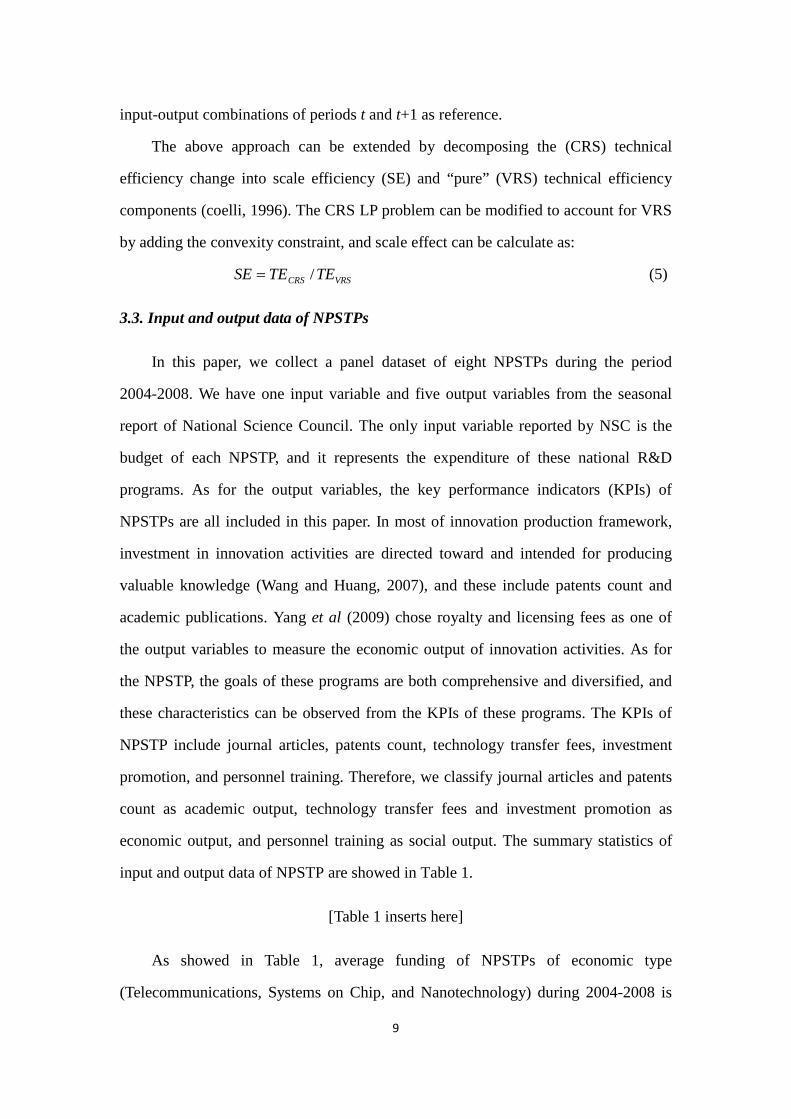
The above approach can be extended by decomposing the (CRS) technical
efficiency change into scale efficiency (SE) and “pure” (VRS) technical efficiency
components (coelli, 1996). The CRS LP problem can be modified to account for VRS
by adding the convexity constraint, and scale effect can be calculate as:
VRSCRS TETESE /= (5)
3.3. Input and output data of NPSTPs
In this paper, we collect a panel dataset of eight NPSTPs during the period
2004-2008. We have one input variable and five output variables from the seasonal
report of National Science Council. The only input variable reported by NSC is the
budget of each NPSTP, and it represents the expenditure of these national R&D
programs. As for the output variables, the key performance indicators (KPIs) of
NPSTPs are all included in this paper. In most of innovation production framework,
investment in innovation activities are directed toward and intended for producing
valuable knowledge (Wang and Huang, 2007), and these include patents count and
academic publications. Yang et al (2009) chose royalty and licensing fees as one of
the output variables to measure the economic output of innovation activities. As for
the NPSTP, the goals of these programs are both comprehensive and diversified, and
these characteristics can be observed from the KPIs of these programs. The KPIs of
NPSTP include journal articles, patents count, technology transfer fees, investment
promotion, and personnel training. Therefore, we classify journal articles and patents
count as academic output, technology transfer fees and investment promotion as
economic output, and personnel training as social output. The summary statistics of
input and output data of NPSTP are showed in Table 1.
[Table 1 inserts here]
As showed in Table 1, average funding of NPSTPs of economic type
(Telecommunications, Systems on Chip, and Nanotechnology) during 2004-2008 is

10
NT$2.27 billion, higher than that of bio type (NT$1.16 billion for Agricultural
Biotechnology, Pharmaceuticals and Biotechnology, and Genomic Medicine) and
social type (NT$0.68 billion for Digital Archives, and e-Learning). As for the output
variables, NPSTPs of economic type are also much higher the other two types,
especially in terms of economic outputs. However, higher input and output values do
not mean more efficiency. Therefore, before turning into the econometric analysis, it
is useful for us to have a rough understanding about the input and output relationship
between eight NPSTPs through a simple graphical analysis. Figure2-6 shows the
output/input value of each output variable (or KPI) for the eight NPSTPs.
[Figure 1-5 inserts here]
As expected, NPSTPs of economic type perform better in terms of economic
outputs, especially in investment promotion. As showed in Figure 4, one dollar input
can induce about NT$19 and NT$11 of investment respectively in
Telecommunications and Systems on Chip, and the output/input value of the other 6
programs are less than one dollar. In the respect of technology transfer fees, NPSTPs
of economic type also have better performance than those of bio type and social type
as showed in Figure 5.
As for the output variable of journal articles, e-Learning has the highest
output/input value among eight NPSTPs, and Agricultural Biotechnology and
NPSTPs of economic type have almost the same value as well. In the respect of
personnel training, Agricultural Biotechnology has the highest output/input value,
followed by the e-Learning and Systems on Chip program.
To sum up, NPSTPs of economic type outperform in the respect of investment
promotion, technology transfer fees and patent count; while NPSTPs of bio type and
social type perform better in the respect of journal articles and personnel training.
Therefore, to measure the over-all efficiency of NPSTPs of different types, one shall
take into account of all of output variables (KPIs) together at the same time.

11
4. Empirical results
4.1. Efficiency analysis of DEA model
As the objective of NPSTPs is supposed to maximize the outputs given budget
constraints rather than to minimize the inputs, the output-oriented models are
employed in this paper. As mentioned above, five output variables are reclassified
into three subsets (academic, economic and social output), and efficiency scores are
calculated in each case. We report the results of CCR and BBC model, but the
discussion will mainly focus on CCR model. Table 2 shows the average efficiency
score of eight NPSTPs in the three subsets of output during 2004-2008. As for the
measure of academic output, Telecommunications, Nanotechnology and e-Learning
outperform the other 5 programs, and their efficiency scores are all higher than 0.9.
Genomic Medicine shows inefficiency in academic output, and has the lowest
efficiency score of 0.39 particularly.
[Table 2 inserts here]
In terms of economic output, the average efficiency score of Telecommunication
is 1, much higher than the other programs, so it implies that Telecommunication is
robustly efficient unit. The efficiency scores of Genomic Medicine and Digital
Archives are however less than 0.1. In fact, these results are not surprising and can
respond to the phenomenon observed in Figures 3 and 4. The performance of
Telecommunication is much better than the other programs in terms of economic
output, and the gap is so huge that it causes the extreme result in efficiency scores.
As for the results of social output, Agricultural Biotechnology has the highest
average efficiency score of 0.949, followed by e-Learning and System on Chip with
0.777 and 0.716 respectively. The efficiency scores of the other five programs are all
lower than 0.5, which implies inefficiency.
In order to make a more comprehensive comparison, we calculate the efficiency
score made up of the five outputs as showed in Table 3. Although we suffer from the

12
problem of deficient DMUs2, these results still can provide a rough measure of
efficiency score. It shows that Telecommunication has the optimal efficiency during
2004-2008 particularly; System on Chip, Nanotechnology, Agricultural
Biotechnology and e-Learning are all in the leading group with higher efficiency
score as well; Pharmaceuticals and Biotechnology, Digital Archives and Genomic
Medicine have inefficiency results in the combined measure of the five outputs
however. In sum, although NPSTPs of economic type are not relatively impressive in
terms of social output, they still outperform the other programs in a comprehensive
comparison.
[Table 3 inserts here]
4.2. Malmquist productivity index
Malmquist productivity index is used to measure productivity change and to
decompose this productivity change into technical change and technical efficiency
change. Technical change (TC) means the movement of frontier, and at the firm level,
the shift out of frontier means technical progress. In this paper, the shift out of frontier
can be viewed as the improvement in the institutional arrangement, mechanism design
or operation of program. On the other hand, technical efficiency change is
decomposed into scale efficiency change (SEC) and “pure” technical efficiency
change (TEC). In this subsection, we will observe the change of efficiency and total
factor productivity (TFP), and discuss the dynamic development of each NPSTP in
terms of different output respectively.
Table 4 shows the results of TEC, TC, SEC and TFP in terms of academic output.
The average technical efficiency change of these programs except Nanotechnology
and Agricultural Biotechnology shows a downturn trend during 2004-2008.
Particularly, the average change rate of Digital Archives is -29.7% annually, which
implies that its technical efficiency becomes much worse during this period. The
2 Golany and Roll (1989) proposed that the number of DMUs must at least be twice of input and output variables. Deficient DMUs will result in overestimation of efficiency score.

13
average technical change rate is slightly increasing except Telecommunications. For
System on Chip, Pharmaceuticals and Biotechnology, and e-Learning, the positive
effect of technical change offsets the downturn of technical efficiency change, which
results in a slight growth of TFP.
[Table 4 inserts here]
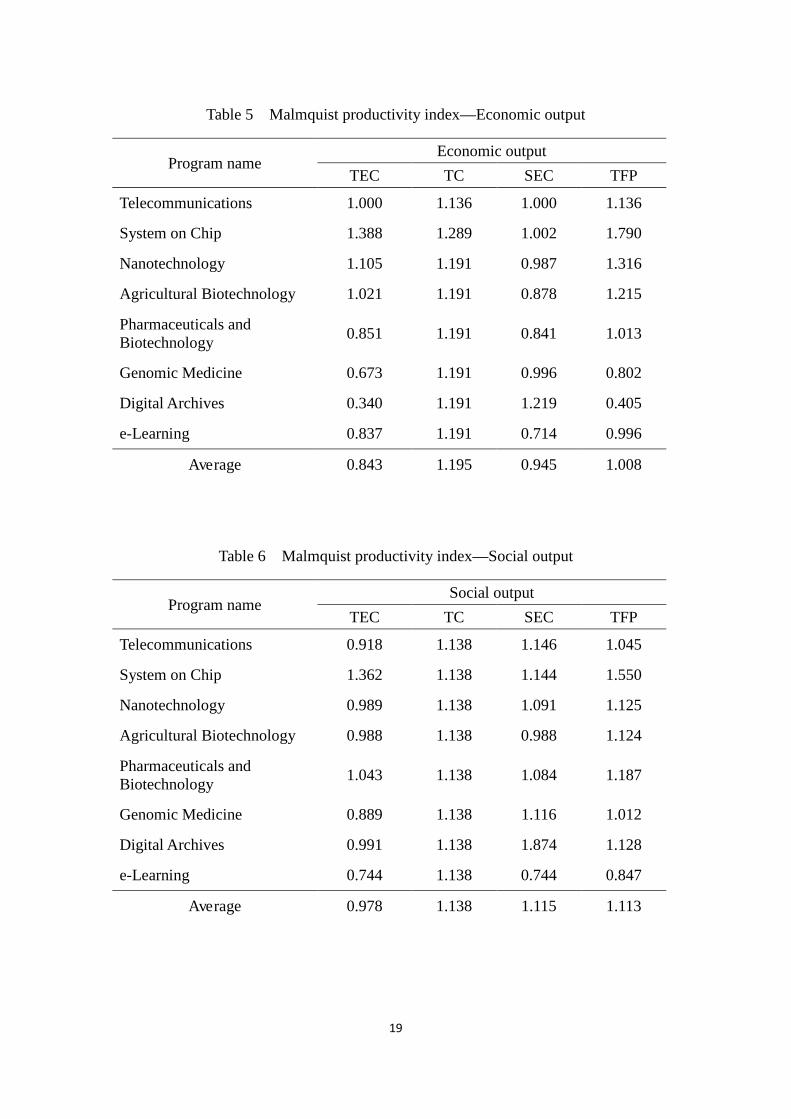
Turning to the result of economic output, one can see from Table 5 that NPSTPs
of economic type have positive technical efficiency change and technical change
growth rate, and thus have increasing TFP during 2004-2008. Agricultural
Biotechnology has the same pattern as those of economic type. For Pharmaceuticals
and Biotechnology, Genomic Medicine, Digital Archives, and e-Learning, all decline
in technical efficiency change but increase in technical change at the same pace.
Particularly, although its annual efficiency score shows inefficiency in section 4.1,
Pharmaceuticals and Biotechnology still has positive TFP growth in terms of
economic output because the decline in technical efficiency change is less than the
increase in technical change growth.
[Table 5 inserts here]
As for the result of social output, System on Chip outperforms the other
programs in the cross-period comparison. With 36.2% technical efficiency change
growth and 55% TFP growth, System on Chip shows a significant improvement in
personnel training. Pharmaceuticals and Biotechnology also improves both in
technical efficiency change and in technical change. In short, all of NPSTPs except
e-Learning show an increase in TFP, meaning that these programs have productivity
growth in personnel training during 2004-2008.
[Table 6 inserts here]
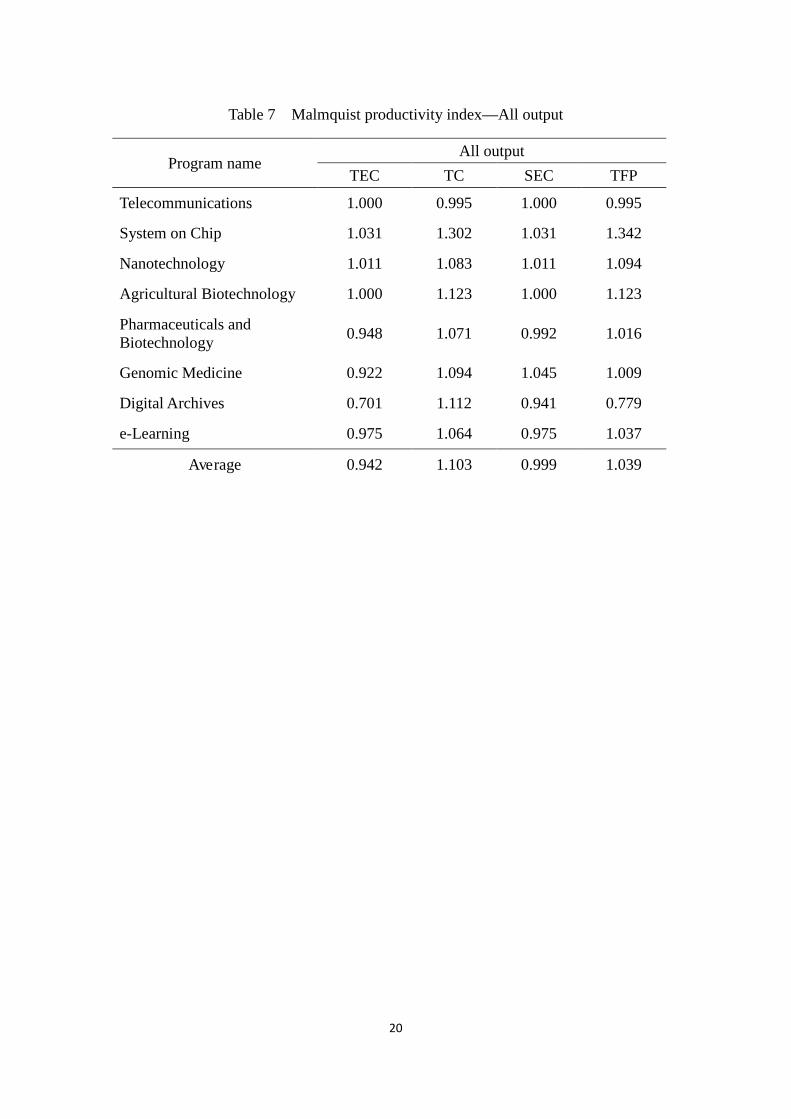
Finally, we look at the results of five outputs combined altogether. As showed in
Table 7, technical efficiency change rate is -5.8% and technical change rate is 10.3%
on average for the eight NPSTPs. Consequently, most of these programs have
improvement in TFP except Telecommunications and Digital Archives. To sum up,

14
TFP has a slight growth rate of 3.9% on average, meaning that the productivity of
NPSTPs keeps growth during 2004-2008. In other words, NPSTPs have been
running altogether in the right direction in the period of time
[Table 7 inserts here]
5. Concluding remarks and policy implication
As for the empirical results, NPSTPs of economic type significantly outperform
the other two types in terms of academic and economic outputs. The reasons might be
that most of the output variables, KPIs of NPSTPs, belong to short-term performance
indexes, and these short-term indexes would favor those related to the
well-established industries in most cases. These might explain the outstanding
performances of Telecommunications, Systems on Chip, and Nanotechnology.
Besides, Taiwan used to be well known for agricultural technology, so Agricultural
Biotechnology has higher efficiency score in many aspects.
In contrast, Digital Archives, Pharmaceuticals and Biotechnology and Genomic
Medicine have relatively lower efficiency score among eight NPSTPs. Their impacts
and contributions could hardly be quantified, and thus would result in the lower
efficiency score when measured by short-term performance indexes. The results come
from efficiency analysis might provide some ideas in government resources allocation,
however, in the decision-making process of science and technology policy, one shall
consider more comprehensive factors to plan the long-term development for the
sustainable growth of the economy.

15
References
1. Caves, D. W., L. R.Christensen, and W. E. Diewert (1982), The Economic Theory
of Index Numbers and the Measurement of Input, Output and Productivity,
Econometrica,50, 1393−1414.
2. Charnes, A., W.W. Cooper and E. Rhodes (1978), Measuring Efficiency of
Decision Making Units, European Journal of Operational Research, 2,
pp.429-444.
3. Coelli, T.J. (1996), A Guide to Deap Version 2.1: A Data Envelopment Analysis
(Computer) Program. Department of Econometrics, University of New England,
Armidale, Australia.
4. Fare, R., and D. Primont (1995), Multi-output Production a Duality: Theory and
Applications, Boston: Kluwer Academic Publishers.
5. Fare, R., S. Grosskopf, M. Norris and Z. Zhang (1994), Productivity Growth,
Technical Progress, and Efficiency Change in Industrialized Countries. American
Economic Review, 84, 66−83.
6. Farrell, M.J. (1957), The Measurement of Productive Efficiency, Journal of the
Royal Statistical Society, Series A, General, 120, Part 3, 253-281.
7. Hawdon, D. (2003), Efficiency, Performance and Regulation of the International
Gas Industry – a Bootstrap DEA Approach, Energy Policy, 31, pp.1167-1178.
8. Lovell, A.K. and S.S. Schmidt (1993), Production Frontiers and Productive
Efficiency, the Measurement of Productive Efficiency: Techniques and
Applications. Oxford University Press, New York.
9. Wang, E.C. and W.C. Huang (2007), Relative Efficiency of R&D Activities: A
Cross-country Study Accounting for Environmental Factors in the DEA Approach,
Research Policy, 36, pp.260-273.
10. Yang, C.H., J.L. Hu and C.P. Chen (2009), Innovation Environment and Different
Output-oriented Innovation Efficiency Indexes, working paper.

16
Table 1 Summary Statistic of Input, Output variable of NPSTP, 2004-2008
Program type Program name Input fund (thousand
dollar)
Academic output Economic output (thousand dollar) Social output
journal articles
patents count
technology transfer fees
investment promotion
personnel training
Economic
Telecommunications 1,799,689 944 139 140,008 34,023,065 456
System on Chip 1,995,693 971 77 78,622 22,205,040 1,991
Nanotechnology 3,019,215 1,481 217 159,472 1,759,691 1,766
Biotechnology
Agricultural Biotechnology 682,568 355 9 20,856 49,342 825
Pharmaceuticals and Biotechnology 1,218,479 428 34 15,341 315,224 193
Genomic Medicine 1,582,176 447 9 2,025 8,601 421
Social Digital Archives 709,935 240 5 1,693 15,873 82
e-Learning 656,120 478 7 11,848 621,470 612
Average 1,457,984 668 62 53,733 7,374,788 793

17
Table 2 Average Efficiency Score of NPSTPs—Academic, Economic and Social Output
Program type Program name Academic output Economic output Social output
CCR BBC CCR BBC CCR BBC
Economic
Telecommunications 0.970 0.977 1.000 1.000 0.206 0.267
System on Chip 0.785 0.836 0.630 0.656 0.716 0.825
Nanotechnology 0.961 1.000 0.681 0.898 0.467 0.815
Biotechnology
Agricultural Biotechnology 0.717 0.845 0.416 0.818 0.949 0.999
Pharmaceuticals and Biotechnology 0.543 0.662 0.166 0.225 0.138 0.171
Genomic Medicine 0.390 0.446 0.018 0.020 0.218 0.276
Social Digital Archives 0.523 0.604 0.049 0.215 0.084 0.271
e-Learning 0.932 0.975 0.243 0.776 0.777 1.000
Average 0.728 0.793 0.400 0.576 0.444 0.578

18
Table 3 Average Efficiency Score of NPSTPs— All output
Program name All output
CCR BCC Telecommunications 1.000 1.000 System on Chip 0.977 1.000 Nanotechnology 0.992 1.000 Agricultural Biotechnology 0.995 1.000 Pharmaceuticals and Biotechnology 0.543 0.664 Genomic Medicine 0.390 0.470 Digital Archives 0.526 0.604 e-Learning 0.981 1.000
Average 0.800 0.842
Table 4 Malmquist productivity index—Academic output
Program name Academic output
TEC TC SEC TFP
Telecommunications 0.966 0.993 0.997 0.959
System on Chip 0.987 1.059 1.009 1.046
Nanotechnology 1.047 1.012 1.047 1.059
Agricultural Biotechnology 1.000 1.062 1.000 1.062
Pharmaceuticals and Biotechnology 0.948 1.071 0.997 1.016
Genomic Medicine 0.922 1.080 1.013 0.996
Digital Archives 0.703 1.111 0.944 0.780
e-Learning 0.998 1.092 0.979 1.090
Average 0.941 1.059 0.998 0.996
19
Table 5 Malmquist productivity index—Economic output
Program name Economic output
TEC TC SEC TFP
Telecommunications 1.000 1.136 1.000 1.136
System on Chip 1.388 1.289 1.002 1.790
Nanotechnology 1.105 1.191 0.987 1.316
Agricultural Biotechnology 1.021 1.191 0.878 1.215
Pharmaceuticals and Biotechnology 0.851 1.191 0.841 1.013
Genomic Medicine 0.673 1.191 0.996 0.802
Digital Archives 0.340 1.191 1.219 0.405
e-Learning 0.837 1.191 0.714 0.996
Average 0.843 1.195 0.945 1.008
Table 6 Malmquist productivity index—Social output
Program name Social output
TEC TC SEC TFP
Telecommunications 0.918 1.138 1.146 1.045
System on Chip 1.362 1.138 1.144 1.550
Nanotechnology 0.989 1.138 1.091 1.125
Agricultural Biotechnology 0.988 1.138 0.988 1.124
Pharmaceuticals and Biotechnology 1.043 1.138 1.084 1.187
Genomic Medicine 0.889 1.138 1.116 1.012
Digital Archives 0.991 1.138 1.874 1.128
e-Learning 0.744 1.138 0.744 0.847
Average 0.978 1.138 1.115 1.113
20
Table 7 Malmquist productivity index—All output
Program name All output
TEC TC SEC TFP
Telecommunications 1.000 0.995 1.000 0.995
System on Chip 1.031 1.302 1.031 1.342
Nanotechnology 1.011 1.083 1.011 1.094
Agricultural Biotechnology 1.000 1.123 1.000 1.123
Pharmaceuticals and Biotechnology 0.948 1.071 0.992 1.016
Genomic Medicine 0.922 1.094 1.045 1.009
Digital Archives 0.701 1.112 0.941 0.779
e-Learning 0.975 1.064 0.975 1.037
Average 0.942 1.103 0.999 1.039

21
Figure 1 Output/input ratio of Journal articles per NT$ million
Figure 2 Output/input ratio of Patent count per NT$ million

22
Figure 3 Output/input ratio of Technology transfer fees per NT dollar
Figure 4 Output/input ratio of Investment promotion per NT dollar

23
Figure 5 Output/input ratio of Personnel training per NT$ million