The Innovation Group was hired by the New York … · The Innovation Group was hired by the New...
12
-
Upload
nguyendiep -
Category
Documents
-
view
214 -
download
0
Transcript of The Innovation Group was hired by the New York … · The Innovation Group was hired by the New...
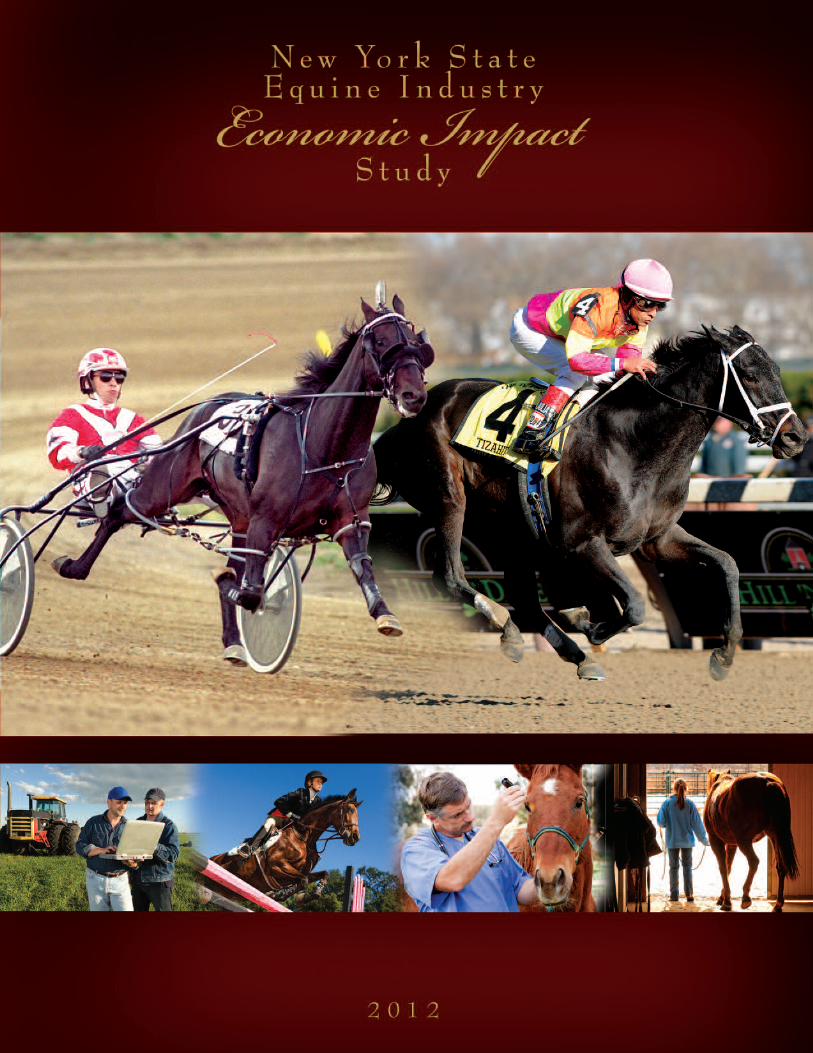

The Innovation Group was hired by the New York Horse Racing and Agriculture Industry Alliance to assess the economic value of the horse industry in the State of New York,
focusing on economic benefits and jobs. The horse industry significantly contributesto the economy, primarily through racing, recreational horse ownership, and horse showing.
The economic contributors on the racing side include the racetracks, breeders, trainers, owners of racehorses, and simulcast wagering entities.
The major contributors on the recreation and showing side include commercial horse enterprises,recreation horse owners, and show organizers and participants. These front-line entities support many other area industries, most notably agriculture, construction and horse-related services.
Members of the New York Horse Racingand Agriculture Industry Alliance
Empire State Harness Horsemen’s Alliance • 914-968-3599Finger Lakes Horsemen Benevolent Protective Assoc. • 585-924-3004Harness Horse Association of Central NY • 315-829-3872Harness Horse Breeders of New York State • 518-785-5858Monticello Harness Horsemen’s Association • 845-791-7747New York Farm Bureau • 518-436-8495New York Thoroughbred Breeders, Inc. • 518-587-0777New York Thoroughbred Horsemen’s Association • 516-488-2337Saratoga Harness Horseperson’s Association • 518-577-6901Standardbred Owners Association of NY • 914-968-3599Western NY Harness Horsemen’s Association • 716-648-3577

ECONOMIC IMPACT
EQUINE DIVISION DIRECT INDIRECT TOTAL
Total $1,747,578,933 $2,450,044,153 $4,197,623,086
JOBS IMPACT
EQUINE DIVISION DIRECT INDIRECT TOTAL
Total 12,903 20,088 32,991
BREAKING NEWS: Economic Impact generated by the New YorkEquine Industry reached $4.2 billion in 2011, yielding roughly 33,000 full-time equivalent jobs.
New York Equine Industry – a 62-County Story
There isEquineActivity in every
county inNew York.

Introduction
Racing DivisionFront-Line Entities• Major Racetracks
• Simulcast Wagering Entities
• Breeders, Trainers andOwners of Racehorses
• Fair Racing Programs
• Horsemen and BreederAssociations and the New YorkState Racing & WageringBoard (“NYSRWB”)
New York boasts roughly 23,100 Racing Division horses.
Over 2,300 breeding, training and racing enterprisescall New York home.
Approximately 13,700 horse owner licenses were issued to racehorse owners
around the country in 2011.New York hosts the only two ‘Hall of Fame’
racing museums in the country.
HIGHLIGHTS

Direct Impact Summary
Breeders, Trainers, and Owners of Racehorsesaccount for 64% of direct impact and 52% of jobs.
• Expenditures are heavily weighted towardsFarm Care and Horse Care.
• Expenditures are primarily funded by purses,but also by stallion fees, boarding fees, horsesales and trainer fees.
• These enterprises, on average, break abouteven after factoring in capital expenditures.
New York’s 11 Major Racetracks generate thesecond highest proportion of economic impactat 23% of the total.
• Expenditures and jobs are centered onpresenting live racing, offering pari-mutuelwagering, and maintaining the grandstandand backside facilities.
• Expenditures are principally funded bycommissions from race wagering.
OTB Corporations account for 10% of direct impact.
• These entities make wagering moreconvenient for New Yorkers, offering nearly200 betting outlets around the state.
• Expenditures are primarily funded bycommissions from race wagering.
• Labor intensive due to the staffing ofbranches.
Fair Racing puts horse racing in the public eye.
• 22 fairs present racing in 21 counties.• Provides opportunity for locally based
horsemen.
Definition of Direct Impact:Direct Expenditures by Front-Line Industry Entities or Customers of Front-Line Entities in the Local Community.
Direct Expenditures include Operating Costs as well as Average Annual Capital Expenditures
Study Resources:• NYSRWB Annual Report • NYRA Annual Report• Comprehensive Industry Survey• Industry Standard Implan Model, which applies
state-specific multipliers to direct expendituresacross numerous spending categories.
RACING DIVISION - DIRECT IMPACT SUMMARYIndustry Component Direct Economic Impact % of Total FTE Jobs Impact % of Total
Major Racetracks $221,550,878 23.0% 1,867 27.1%
OTB Corporations $ 95,551,375 9.9% 1,269 18.4%
Breeders, Trainers, Owners of Racehorses $614,331,371 63.6% 3,604 52.2%Fair Racing $ 3,784,110 0.4% 21 0.3%
Horsemen and Breeder Associations and NYSRWB $ 30,274,756 3.1% 141 2.0%
Total $965,492,490 100.0% 6,902 100.0%

Impact & Jobs Summary
Racing Division yields $92,100 of economicimpact per horse and 80 jobs per 100 horses.• Indirect and Induced totaled $1.16 billion, implying a
multiplier of about 2.2 times against direct impact.• The Breeders, Trainers, and Owners of Racehorses
showed a strong multiplier of about 2.4 times,
yielding approximately $849 million of indirect andinduced impact.
• Indirect jobs totalled about 10,500, implying amultiplier of about 2.5 times against direct jobs.
• The Breeders, Trainers, and Owners of Racehorsesaccounts for about 81% of indirect and induced jobs,with a multiplier of 3.3 times against direct jobs.
Definition of Indirect Impact:The economic spin-off of the directexpenditures of the racing entities as localvendors expand their business. This expansionpushes additional revenue throughout theeconomy in a rippling effect.
Definition of Induced Impact:The positive impact of higher household incomesresulting from direct employment in racing entities.This money is reinvested into the economy viahousehold spending patterns, spurring further localeconomic activity. Induced impact also results fromincreased tourism as new visitors spend at areabusinesses, such as gas stations and restaurants.
RACING DIVISION - TOTAL IMPACT SUMMARYIndustry Component Direct Indirect & Induced Total Impact Indirect & Induced Multiplier
Major Racetracks $221,550,878 $ 172,960,848 $ 394,511,726 1.78
OTB Corporations $ 95,551,375 $ 132,471,097 $ 228,022,472 2.39
Breeders, Trainers, Owners of Racehorses $614,331,371 $ 848,537,998 $1,462,869,369 2.38
Fair Racing $ 3,784,110 $ 6,862,779 $ 10,646,889 2.81
Horsemen and Breeder Associations and NYSRWB $ 30,274,756 $ 2,549,874 $ 32,824,630 1.08
Total $965,492,490 $1,163,382,596 $2,128,875,086 2.20
RACING DIVISION - TOTAL JOBS SUMMARYIndustry Component Direct Indirect & Induced Total Jobs Indirect & Induced Multiplier
Major Racetracks 1,867 1,095 2,962 1.59
OTB Corporations 1,269 879 2,148 1.69
Breeders, Trainers, Owners of Racehorses 3,604 8,451 12,055 3.34
Fair Racing 21 51 72 3.43
Horsemen and Breeder Associations and NYSRWB 141 22 163 1.16
Total 6,902 10,498 17,400 2.52

Introduction
• According to Recreation Horse Owner Survey, roughly 50% ofrecreation horse owners participate in shows/competitions.
• Open shows are usually 1-day events while sanctioned showscan run 5 to 6 days.
Recreation and ShowingDivision Front-LineComponents
• Commercial Horse Enterprises
• Recreation Owners with Farm/Stable
• Recreation Owners without Farm/Stable
• Show/Competition
• Equine Education and Science
Commercial HorseEnterprises:• Boarding Stables• Training Centers• Breeding Farms• Riding Academies• Recreational Ranches• Sales/Rental Barns
Equine EducationalPrograms:• Cazenovia College• State University of
New York Cobleskill• State University of New York
Ag & Tech at Morrisville• State University of
New York Canton• Cornell Horse
Program, Ithaca• Houghton College
RECREATION DIVISION HORSE COUNTOwner Categories Horse Count % of Total
SHOW/COMPETITION EVENT AND PARTICIPANT COUNTEvent Annual Average TotalCategory Count Participants Participation
Commercial Horse Enterprises 14,785 11%
Private Farm Owners 96,743 72%
Owners without Farm 21,910 16%
College Programs 1,005 1%
Total 134,443 100%
Sanctioned 120 175 21,000
Open Shows 360 55 19,800
Total/Average 480 85 40,800
Source: The Innovation Group
Direct Impact Summary
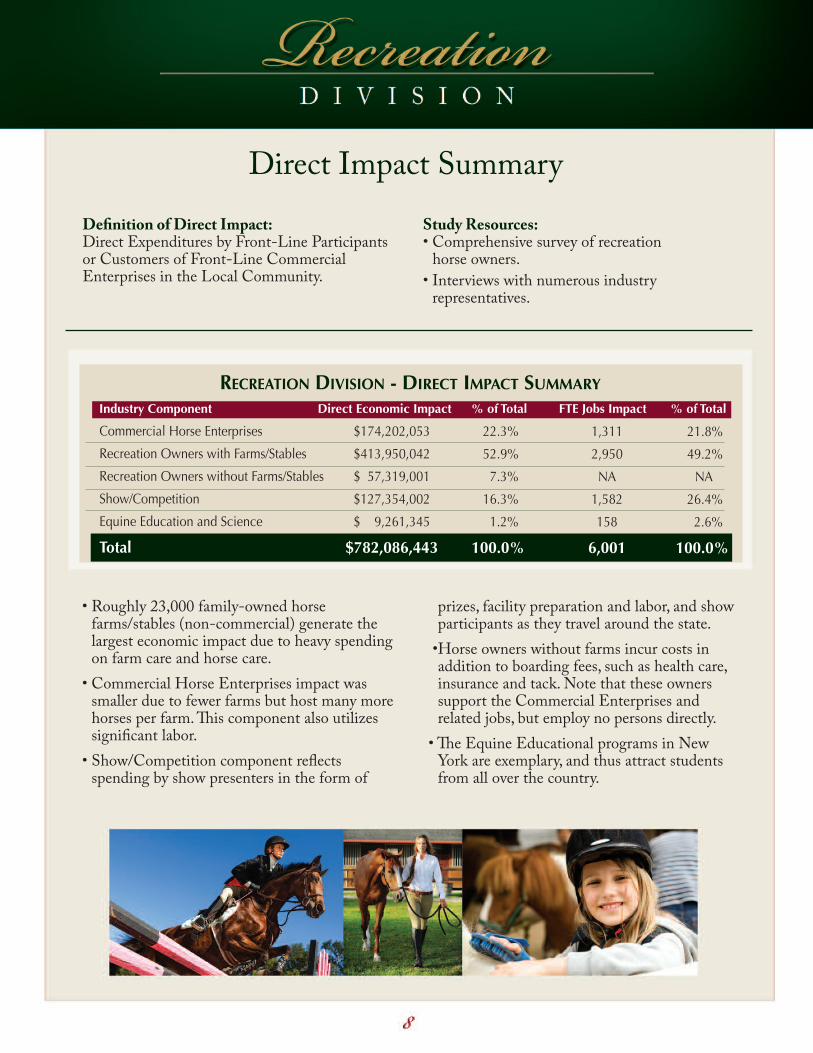
• Roughly 23,000 family-owned horsefarms/stables (non-commercial) generate thelargest economic impact due to heavy spendingon farm care and horse care.
• Commercial Horse Enterprises impact wassmaller due to fewer farms but host many morehorses per farm. This component also utilizessignificant labor.
• Show/Competition component reflectsspending by show presenters in the form of
prizes, facility preparation and labor, and showparticipants as they travel around the state.
• Horse owners without farms incur costs inaddition to boarding fees, such as health care,insurance and tack. Note that these ownerssupport the Commercial Enterprises andrelated jobs, but employ no persons directly.
• The Equine Educational programs in NewYork are exemplary, and thus attract studentsfrom all over the country.
Definition of Direct Impact:Direct Expenditures by Front-Line Participantsor Customers of Front-Line CommercialEnterprises in the Local Community.
Study Resources:• Comprehensive survey of recreation
horse owners.• Interviews with numerous industry
representatives.
RECREATION DIVISION - DIRECT IMPACT SUMMARYIndustry Component Direct Economic Impact % of Total FTE Jobs Impact % of Total
Commercial Horse Enterprises $174,202,053 22.3% 1,311 21.8%
Recreation Owners with Farms/Stables $413,950,042 52.9% 2,950 49.2%
Recreation Owners without Farms/Stables $ 57,319,001 7.3% NA NA
Show/Competition $127,354,002 16.3% 1,582 26.4%
Equine Education and Science $ 9,261,345 1.2% 158 2.6%
Total $782,086,443 100.0% 6,001 100.0%
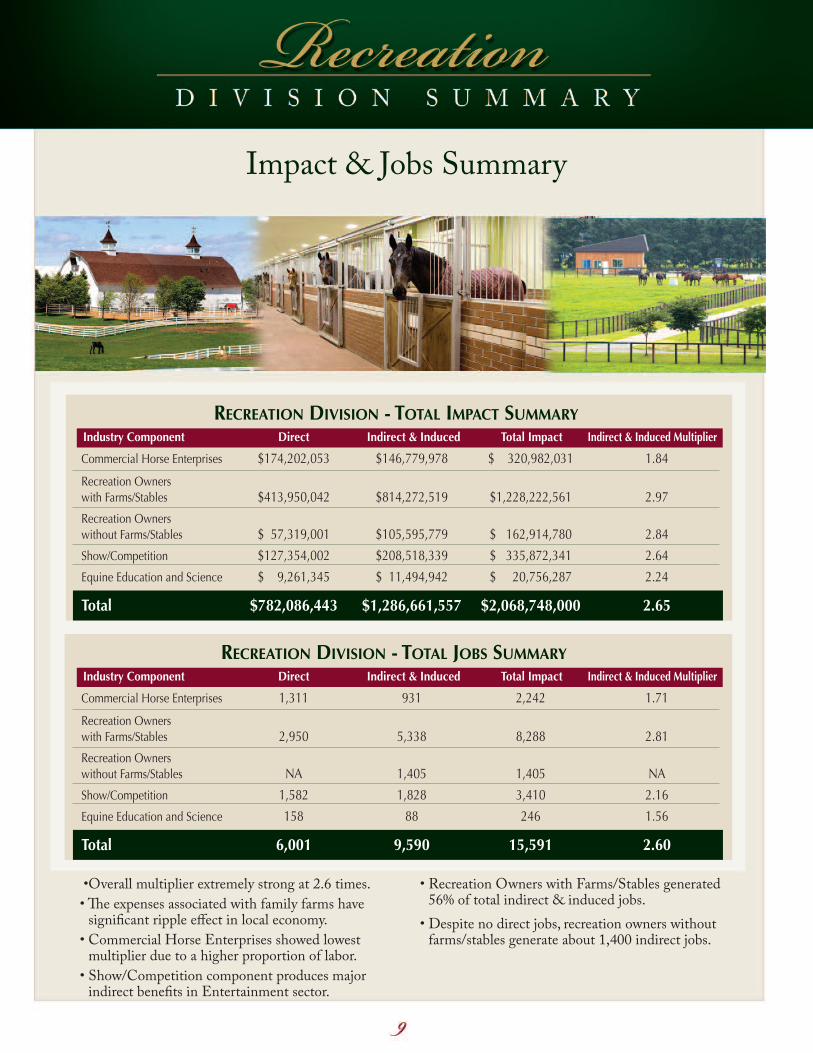
Impact & Jobs Summary
• Overall multiplier extremely strong at 2.6 times.• The expenses associated with family farms have
significant ripple effect in local economy.• Commercial Horse Enterprises showed lowest
multiplier due to a higher proportion of labor.• Show/Competition component produces major
indirect benefits in Entertainment sector.
• Recreation Owners with Farms/Stables generated56% of total indirect & induced jobs.
• Despite no direct jobs, recreation owners withoutfarms/stables generate about 1,400 indirect jobs.
RECREATION DIVISION - TOTAL IMPACT SUMMARYIndustry Component Direct Indirect & Induced Total Impact Indirect & Induced Multiplier
Commercial Horse Enterprises $174,202,053 $146,779,978 $ 320,982,031 1.84
Recreation Owners with Farms/Stables $413,950,042 $814,272,519 $1,228,222,561 2.97
Recreation Owners without Farms/Stables $ 57,319,001 $105,595,779 $ 162,914,780 2.84
Show/Competition $127,354,002 $208,518,339 $ 335,872,341 2.64
Equine Education and Science $ 9,261,345 $ 11,494,942 $ 20,756,287 2.24
Total $782,086,443 $1,286,661,557 $2,068,748,000 2.65
RECREATION DIVISION - TOTAL JOBS SUMMARYIndustry Component Direct Indirect & Induced Total Impact Indirect & Induced Multiplier
Commercial Horse Enterprises 1,311 931 2,242 1.71
Recreation Owners with Farms/Stables 2,950 5,338 8,288 2.81
Recreation Owners without Farms/Stables NA 1,405 1,405 NA
Show/Competition 1,582 1,828 3,410 2.16
Equine Education and Science 158 88 246 1.56
Total 6,001 9,590 15,591 2.60

• Retired racehorses make excellent show andcompetition horses
• Racing attracts out-of-state horsemen thatalso utilize recreation businesses
• Racing revenue attracts and supportsveterinarians, farriers and other serviceproviders that are also utilized byrecreation owners
• A thriving Equine Industry promotes maintenanceand reclamation of agricultural land
• Horse industries are major consumers of agricultureproducts
• Combined horse population supports healthieragriculture industry
• Larger horse population brings down the cost of feed,hay and straw due to the economies of scale
• Recreation Farmland provides homes forretired racehorses
• Recreation Farmland provides base ofoperations for some trainers and owners ofracehorses
STRONGEQUINE
INDUSTRY
RACING
AGRICULTURE
• Horse Industry provides job opportunities for graduatesfrom equine educational programs
• Equine Educational Programs lead to innovations thatsupport Racing and Recreation
• Championship horse shows and scenic horseback ridesdraw spectators and tourists to New York
• Thoroughbred and Harness racing attract fans andtourists from around the world
EDUCATION & AGRITOURISM
RECREATION
SIGNIFICANT DIRECT EXPENDITURE CATEGORIES OF EQUINE INDUSTRIESLABOR
AccountantsAdministrative AssistantsAdmissions PersonnelCleaning Crew
Communication SpecialistsConstruction Workers
DriversExecutives
Facilities Maintenance CrewFarm HandsFarriers
Food Service PersonnelGrooms
Human Resource PersonnelInformation Techs
JockeysLawyers
Marketing SpecialistsOutriders
Pari-Mutuel TellersSecurity PersonnelTrack Hands
Track Maintenance CrewVeterinarians
Video Production Techs
HORSE CAREBoarding FeesFarrier CostsFeed
Grooming SuppliesHay/Straw
Health Care SuppliesSupplements
TackVeterinarian Costs
FARM/STABLE CAREFarm EquipmentFarm TractorsFencing
Fertilizer/TreatmentsGas/Oil
Irrigation SuppliesLumberRepair &
Maintenance SuppliesSeed/TurfToolsTop SoilWater
OTHER OPERATINGBreeding EquipmentEntry/Sustaining/Nomination FeesFacility RentalsFood & Beverage
Licensing Fees/PermitsManure Removal
PrizesRepair &
Maintenance SuppliesRiding Gear
Subscriptions/MembershipsTote Expense
Travel & LodgingUniforms
OVERHEADBank ChargesCable Contract
Charitable ContributionsEnergy
Garbage RemovalInsurance
Marketing & AdvertisingUtilities
Professional ServicesTelecommunications
TOP 10 INDIRECT INDUSTRY SECTORS
Financial/Insurance/Real Estate
Products & EquipmentManufacturing
Food Manufacturing
Wholesale Trade
Legal & Accounting/Professional Services
Entertainment
Construction
Agriculture
Veterinarian
Health Care
About the New York Horse Racing andAgriculture Industry Alliance
The mission of the New York Horse Racing and Agriculture Industry Alliance is to secure support for the protection of the horse racing and agriculture industries. This group, which brings together the
New York State horsemen, breeders, farmers and agriculture industryrepresentatives, is an informal alliance charged with protecting the
current and future interests of the horse racing and agriculture industries that are responsible for 33,000 jobs across New York State.
About The Innovation GroupThe Innovation Group is the premier provider of consulting services
for the gaming, racing, entertainment and hospitality industries. Our inventive, forward-looking staff of professionals is recognized
throughout the industry for the accuracy of our analysis and forecasts, the diversity of our services and our timely response to client needs. Services include feasibility studies, market assessments, economic
impact studies, strategic and financial planning, economic diversification, legislative and government advisory, litigation and
expert witness, and online gaming strategy/research. The Innovation Group has been associated with more than $75 billion in investment decisions specific to our core industries throughout the past 20 years. Our leadership has helped bring many of the world’s largest entertainment and hospitality developments to fruition, and
we have been exposed to industry best practices across six continents and 78 countries. Multi-billion dollar organizations, government entities, global financial institutions, professional associations and private equity investors are just a few of the client segments that
have made prudent economic, financial, social and political decisions based on our analysis, advice and support.
This study was made possible through the generous support of the New York Horse Racing and Agriculture Industry Alliance.