The Initial Impact of WTO Membership on China’s Trade
23
The Initial Impact of WTO Membership on China’s Trade Performance in Primary Agricultural And Processed Food Products Liu Xue 1 , Brian J Revell 2 , Fu Zetian 1 1 China Agriculture University, Beijing P.R. China, ( [email protected] ) 2 Harper Adams University College, Newport, Shropshire, UK ( [email protected] ) Contributed paper prepared for presentation at the International Association of Agricultural Economists Conference, Gold Coast, Australia, August 12-18, 2006 Copyright 2006 by Liu X, B J Revell and Fu Z. All rights reserved. Readers may make verbatim copies of this document for non-commercial purposes by any means, provided that this copyright notice appears on all such copies. 1
Transcript of The Initial Impact of WTO Membership on China’s Trade

The Initial Impact of WTO Membership on China’s Trade Performance in Primary
Agricultural And Processed Food Products
Liu Xue1 , Brian J Revell2 , Fu Zetian1
1 China Agriculture University, Beijing P.R. China, ( [email protected] ) 2 Harper Adams University College, Newport, Shropshire, UK ( [email protected] )
Contributed paper prepared for presentation at the International Association of Agricultural Economists Conference, Gold Coast, Australia,
August 12-18, 2006
Copyright 2006 by Liu X, B J Revell and Fu Z. All rights reserved. Readers may make verbatim copies of this document for non-commercial purposes by any means, provided that
this copyright notice appears on all such copies.
1

Abstract
There has been much analysis of the potential impact of China’s membership of the WTO on
world trade in agricultural products but few studies of the actual effects thus far on China’s
trade performance. This paper compares changes in the competitiveness of China’s trade in
primary agricultural food and processed food products over the period 1998 to 2003 through a
range of comparative advantage measures, the preferred being Revealed Symmetric
Comparative Advantage. It also decomposes changes in China’s export market share of these
products over the period into structural and performance components and identifies where
shifts in the global regional distribution of its exports have contributed to changes in its overall
market share.
Key words: China, agricultural, processed foods, exports, competitiveness.
JEL Codes:- Q17, O13
1 Introduction
A number of studies attempted ex ante predictions analyses of the impact of China’s WTO
membership in December 2001 on world trade in agricultural products, though little has been
written about processed food products in this context. Precise comparisons and more general
conclusions from such modelling simulations are problematic for a number of reasons. First the
underlying assumptions differ regarding both the degree and stage of implementation of
China’s initial commitments under the URAA bound tariffs, and under any subsequent final
Doha Round agreement the WTO reaches, and are often presented as a number of scenarios.
2

Second, prediction baselines are often different. Third, model structures and methodologies
differ, with some models giving dynamic adjustment paths whilst others present comparative
static long run CGE solutions.
Fuller et al (2001), using the FAPRI model, suggested a small initial rise in China’s net cereals
imports (by volume) subsequently increasing until 2009-10; net imports of soyabeans
increasing by over 50% during the same period; increases in net imports of soyabean and
rapeseed oils; a small increase in net exports of vegetables; beef net exports would rise
immediately post WTO and then fall back; net imports of poultry would increase and those of
pork remain relatively stable. Yu and Frandsen (2002), using the GTAP model, similarly
predicted a significant increase in Chinese grain imports, and a small deterioration in net trade
for many other agricultural commodities. Gilbert and Wahl’s (2001) CGE modelling suggested
a 4 percent increase in wheat imports and 10 percent for other grains, a 5 percent increase in
beef and 20 percent increase in other meat imports. Huang and Rozelle (2002) pointed to a
significant immediate impact on maize import levels, and to a longer run deterioration in net
trade in soyabeans and sugar, but improved net trade for products where China has a
comparative advantage such as rice, fruit, vegetables, and some meats. More recent GTAP
modelling by Conforti and Salvatici (2004) suggested that as a baseline small net cereals
exporter, China would become a net cereals importer (excluding rice) under strong
liberalization and only a marginal net exporter under weak liberalization. As a baseline net
importer of oilseeds, imports were predicted to rise marginally under weak liberalization, and
more under strong liberalization, with similar tendencies for vegetable oils and sugar.
3

Whilst most of the above studies implicitly suggest that China has a comparative trade
disadvantage in those products which are labour extensive, and a comparative advantage in
those products for which there is relatively high labour intensity in production, a point
emphasised by Lin (2000), none, however, has attempted to measure it directly. Given their
longer-term trade focus, they clearly shed little light on more immediate and contemporaneous
developments in China’s comparative advantage and trade competitiveness since its WTO
accession. Nor do they examine changes in the balance between unprocessed and processed
products, and in the structure and direction of China’s trade. As Rae and Josling (2003)
observed, trade in processed products could represent significant gains for developing and
emerging economy countries under trade liberalisation. This paper therefore attempts to fill
some of this gap and explores how China’s comparative advantage and trade performance has
developed over the more recent period 1998-2003, embracing the crucial years before and after
its WTO membership. This is a period over which Johnson (2000) expressed the view that the
short run trade effects would be modest at best.
2 Methodology
Huang and Rozelle (2002), indicated that the determination of representative internal market
prices in estimating protection rates in China was not straightforward. By extension, estimates
of its domestic resource costs (DRC) would be complex and data demanding, though we note
some pre-WTO membership accession estimates by Tuan and Tingjun (2001). They concluded
that pigs, beef and poultry meat had a degree of comparative advantage whilst wheat and maize
4

were at a comparative disadvantage. We therefore opt for a number of trade-based measures
deriving from Balassa’s (1965) revealed comparative advantage (RCA:-
RCA isX isX it
X wsX wt
1
.
(1)
where
, X ws
1
n
i
X is= and
X wt1
m
s
X ws=
X it1
m
s
X is=
and X represents exports, i is a specific country (i=1…n), s is a commodity group (s=1…m), t
is the set of m commodities, and w is the world and sum of n countries. Country i has a
comparative advantage in trade in s if RCA>1 and a comparative disadvantage where RCA<1.
However, as the RCA measure is not symmetric about unity Laursen (1998) argued that
revealed symmetric comparative advantage (RSCA) is generally a preferable measure, where
(2) RSCA is RCA is 1 RCA is 1 1.
A number of other measures have been proposed including relative trade advantage (RTA),
Vollrath (1991), relative comparative advantage measure, defined as the ratio of a country’s
product export share of its exports to the corresponding product import share of its total
imports and the export specialisation index (XSP) which eliminates the bias arising where the
5

own-country may make a significant contribution to commodity and total world trade.
The range of RCA measures, however, reveal little about the underlying determinants of
changes in comparative advantage in a country’s trade, nor whether such changes are due to
changes in the country market composition shares of world trade as opposed to the exporter’s
intrinsic competitiveness. Trade shares accounting and decomposition developed by Gehlhar
and Vollrath (1997) enables us to identify these elements and also the bi-lateral changes in
aggregate market shares for the exporting country.
Dropping the s subscript for a specific commodity or commodity group.
Define exporting country i share of country j’s market for s as
AMS iw
j
X ij X ww1.
6
p ijX ijX wj
. (3)
Define Pj as the structural share of importing country j, i.e. its share of world trade in s.
P jX wjX ww (4)
by definition j
P j 1
Let country i’s aggregate market share (AMS) of total world trade in s be :-
X iwX ww

= (5)
i.e. :-
AMS iwj
p ij P j. (6)
and if for simplicity, if we let AMSij = pijPj. then (6) can be expressed as:-
(7) AMS iwj
AMS ij
Over a period of time τ between a base period τ =β and final period τ = Φ, the total effect (TE)
of a change in i’s AMS can be decomposed into its individual country shares as follows:-
T E iwτ
j
E ijτ
(8)
where and ∆ AMS ijτ AMS ij
φ AMS ijβ
(9) E τ ∆ ijτ
ij AMS
The change in AMS can also be decomposed into the sum of two effects, a structural effect
(SE) reflecting changes in structural shares of world trade (i.e. within the share mix of
importing countries) relative to the base period, and a performance effect (PE), reflecting the
changes in i’s country shares of trade. Three separate measures of the AMS are needed: what
the AMS would have been with fixed base-period country shares and final period structural
shares (Eq.10), together with the base and final period AMS. Equations 10-12 define them:-
7

AMS iwfβ
j
p ijβ P j
φ. (10)
AMS iwβ
j
p ijβ P j
β. (11)
AMS iwφ
j
p ijφ P j
φ. (12)
The structural effect is given by:-
SE iwτ AMS iw
fβ AMS iwβ (13)
the performance effect by:-
(14) PE iwτ AMS iw
φ AMS iwfβ
and the total effect by
TE iwτ SE iw
τ PE iwτ (15).
Equations (9) and (15) represent alternative views of the changes in the AMS, with Equation
(15) reflecting both changes in the composition of global trade and changes in i’s export market
shares adjusted for compositional global trade share change.
3 Data
This study uses the HS system 2 digit commodity trade categories (by value) from the UN
Comstat database over the period 1998-2003. These categories we define as broadly relating to
8

primary or unprocessed agricultural food products (pafps)2, and processed food products
(prfps), although the distinctions within the 2 digit level categories between unprocessed, semi-
and processed/prepared foods is not perfect3. Pafps are:-
• HS 02 Meat and edible meat offal
• HS 04 Dairy products, eggs, honey, other edible animal products
• HS 07 Edible vegetables and certain roots and tubers
• HS 08 Edible fruit, nuts, citrus peel and melons
• HS 10 Cereals
• HS 12 Oilseeds, oleagic fruits, other grains, seeds and fruits.
And prfps are:-
• HS 11 Milling products
• HS 16 Meat, fish and seafood4
• HS 17 Sugar and sugar confectionary
• HS 19 Cereals, flour and milk preparations
• HS 20 Vegetable, fruit and nut preparations
• HS 21 Miscellaneous edible products
2 Hence we exclude fibres, animal fats etc and by-product categories for non-food uses
3 a more complete analysis would require analysis and re-aggregation from 6 digit code categories.
4 We recognise a problem in that meat products comprise only 36% and 30% respectively of world and China’s
trade in HS 16 .
9

China’s exports have been measured as third country imports from China, and world trade as
world imports.
Changes in China’s regional trade in pafps and prfps were also analysed. Regional aggregates5
were identified which together accounted for 85 percent of China’s exports of pafps and 94
percent of its prfps. These were:-
• East Asia
• S E Asia
• EU15
• N America
• Russian Federation
A catch-all Rest of World (ROW) region was also defined. The world trade total was adjusted
for China’s exports to eliminate own-country bias.
4 China’s Trade in Agricultural and Food Products
Table 1 shows trend growth in world trade in pafps and prfps rising by some 3.4 to 4.4 percent
annually, and China’s exports of these products rising by 4.4 percent and 11.3 percent
respectively. The share of prfps in total trade rose by around 1 percentage point over the period.
However, in contrast, there was a sharp increase in the share of prfps in China’s total
agricultural and food exports.
5 Details can be supplied by the authors on request
10

China’s share of world export markets in Table 2 is relatively small for meat and dairy products,
but significant for vegetables (Liu et al (2003, 2004)), with an 8.1percent share of the world
total. Its shares in oilseeds, and cereals accounted for around 3.6 and 4.2 percent of world
exports of pafps in 1998. China’s export shares for meat, dairy and vegetables have declined
since its WTO membership, whilst that of cereals has risen sharply. For prfps, China’s world
market share for meat fish and seafood and vegetable fruits and nuts are significant (the former
largely reflecting marine food products), though overall, for both pafps and prfps, China’s
share of world trade in 2003, post WTO membership, was higher than in 1998.
The regional distribution of China’s trade (Table 3) in pafps and prfps in 1998 and 2003
reveals a relative decline in China’s traditional and largest r E Asian regional market with
compensating shift in pafps exports to the ROW , and some shift in China’s share of prfps
between E Asia into N America over the period.
5 Changes in China’s Comparative Advantage
The range of comparative advantage measures outlined in Section 2 of the paper were all
highly correlated6 over the study period. Hence we present below only those results for the
RSCA index of competitiveness as a preferred measure.
6 r≥0.99
11

Figure 1 shows China’s positive but declining comparative advantage for vegetables since
WTO membership, despite an a priori advantage in labour intensive products.. It reveals a
sharply rising comparative advantage in cereal exports and a small comparative advantage,
though diminishing, for oilseed products. The relative trade disadvantage in meat was sharply
exacerbated, ameliorated marginally for fruit ,and weakened for dairy products. However, there
is little evidence for fruit and dairy products that this is due to a WTO-specific effect, as both
have exhibited gentle consistent trends since 1998. There is no clear sign of any significant
changes in the RSCA for most of China’s prfps exports, except sugar and confectionery
products. Nevertheless, the changes between pre and post WTO membership appear relatively
small (Figure 2). Overall, China has a comparative advantage only for processed meat and fish
(primarily due to fish) and vegetable and fruit products.
6 Decomposition of China’s Trade and Competitive Performance
We now examine the underlying determinants of change in China’s trade performance since its
WTO membership. The definition of a common base period year can be problematic if there
are differing trends amongst the various commodity groups and atypical years. The study
therefore decomposes and compares the changes in China’s AMS over two periods, between
1998 and 2001, and between 2001 and 2003. Table 4a summarises the structural and
performance and effects over these two time periods as well as the individual regional
contributions to changse in China’s AMS for pafps. Table 4b presents the comparable analysis
for prfps..
12

In general the pre-to post WTO effects for pafps have been quite small7, with China’s AMS
increasing for the pafp group of products as a whole by only one third of a point since WTO
membership, compared with an overall decline pre-WTO. The increase in AMS post WTO has
been entirely due to an improved trade performance effect, offsetting a negative structural
effect8. It is clear that there has been some re-alignment of its market share growth between E
Asia and SE Asia.
For meats and offal, WTO membership has accelerated the decline in its AMS in which the
negative performance effect was both dominant and deteriorated after 2001. Contrary to
expectations that the WTO would exert a major effect on China’s dairy sector, there is little
short-term evidence that China’s trade competitiveness has deteriorated significantly since
2001. Although the pre-WTO accession upward trend in China’s AMS for vegetables has
reversed since WTO membership, this is largely due to negative structural changes in world
trade in vegetables, offsetting a positive (though weakening) performance effect. Much of the
decline has been located within the E Asian (particularly the Japanese) market where there has
been a continuing trade dispute over Chinese vegetable exports. China’s export performance in
fruit products has improved post WTO membership despite a small adverse structural shift in
world trade. China’s cereal exports increased their AMS by 4 percentage points since 2001,
7 Supporting Johnson (2000) op cit.
8 and dominated by changes in cereals exports.
13

performance led, and strongly focused into its regional E Asian and ROW markets. Finally,
whilst China’s AMS in oilseeds has declined since 2001, this has been primarily due to
negative changes in the structural composition of world trade and a slight weakening in
China’s competitiveness in specific markets.
Table 4b presents the decomposition of changes in China’s AMS for prfps. Since WTO
membership, there is evidence of an overall slowing in its AMS growth. Although the
performance effect improved for the prfps group as a whole, for some key product areas such
as meat and fish, vegetable and fruit products, China’s performance weakened relative to the
four preceding years. Again, this reflects a deterioration in export penetration into its traditional
E Asian markets.
7 Discussion and Conclusions.
Despite the relative short period since China has become a member of the WTO, it is possible
to discern some changes in its trade performance in both pafps and prfps. In virtually all of the
product groups examined, between 2001 and 2003, the structural changes in trade in these
markets were exerting an adverse effect on China’s AMS. It suggests that China may need in
future to seek to shift the balance in its regional export markets over time, given that its
labour-cost advantages reflected in the positive performance contribution to AMS change are
barely keeping ahead of the impact of structural changes in world trade. With the exception of
meat products, the performance effects for pafps have been positive both before and after 2001,
14

whereas in general, they have deteriorated for most individual prfps except sugar and
confectionery. Although China’s cereal exports have become significantly more competitive
since WTO membership, there has otherwise been a weakening in trade performance in meat,
vegetables, fruit and oilseeds. Furthermore, China’s export penetration of pafps (with the
exception of cereals) has fallen in its largest regional market of E. Asia. with no clear pattern of
realignment into other markets. It would require further disaggregated analysis of the cereals
product group to identify whether the performance gains there have been in the more labour
intensive rice, or in the more labour extensive wheat, maize and coarse grains. Moreover, there
is no strong evidence of significant contributions to the AMS gains for prfps overall that derive
from developed country markets of the EU and N America. The best that can e said is that the
negative contribution to change has been halted since China became a WTO member.
Thus far, China’s brief WTO membership appears not to have significantly favoured its export
performance in relatively labour intensive unprocessed products, for which it would ostensibly
appear to possess a comparative advantage, nor has it made significant gains in market share
for exports of many processed food products (where lower labour costs would be a relatively
smaller, yet still significant component of the overall product cost). So whilst the share of
China’s agricultural and food export earnings from processed products has increased over the
period 1998-2003, as has its share of world trade in processed products, most of this growth
took place prior to its WTO membership.
References.
15

Balassa B. (1965) Trade Liberalization and Revealed Comparative Advantage. The Manchester
School of Economic and Social Studies 32 pp 99-123
Conforti P and Salvatici L. (2004) Agricultural Trade Liberalization In The Doha Round.
Alternative Scenarios And Strategic Interactions Between Developed And Developing
Countries. FAO Commodity and Trade Policy Research Working Paper No. 10
Fuller F, Beghin H, De Cara S, Fabiosa J, Fang C and Matthey H. (2001). China’s Accession to
the WTO: What is at Stake for Agricultural Markets? Working Paper 01-WP 276, CARD, Iowa
State University.
Huang J. and Rozelle S. (2002). The Nature of Distortions to Agricultural Incentives in China
and Implications of WTO Accession. Working Paper No. 02-006, California Agricultural
Experiment Station, Gianni Foundation for Agricultural Economics.
Gehlhar M.J. and Vollrath T.L. (1997). U.S. Export Performance in Agricultural Markets.
Economic Research Service, U.S. Department of Agriculture Technical Bulletin No. 1854.
Gilbert J and Wahl T. (2001). China’s Accession to the WTO and Impacts on Livestock Trade
and Production Patterns. Paper presented at the International Agricultural Trade Research
Consortium, Auckland, New Zealand.
Johnson D. Gale (2000). The WTO and Agriculture in China. China Economic Review 11 pp
402-404. North Holland.
Laursen K. (1998) Revealed comparative advantage and the Alternatives as Measures of
International Specialisation. DRUID Working Paper No. 98-30, Danish Research Unit for
Industrial Dynamics.
16

Lin J.Y. (2000) WTO Accession and China’s Agriculture. China Economic Review 11, pp
405-408. North Holland
Liu X., Revell B.J. and Fu Z. (2003). Measuring the Competitiveness of China’s Export Trade
in Vegetables: A Strategic Management Approach. Poster paper presented at the 25th
International Conference of Agricultural Economists, Durban, 16-22 August 2003
Liu X, Revell B.J., Fu Z. and Mu W. (2004). Measuring the Export Performance of China’s
Vegetable Sector. Journal of Modern Agricultural Studies 12 . in Chinese
Rae A. and Josling T. Processed Food Trade and Developing Countries: Protection and Trade
Liberalization. Food Policy 28 pp 147-166
Tuan F. C. and Tingjun, P. (2001). Structural Changes in China’s Livestock and Feed
Production: Trade Implications. Paper presented at the International Agricultural Trade
Research Consortium, Auckland, New Zealand.
Utkulu U. and Seymen D. (2004). Revealed Comparative Advantage And Competitiveness:
Evidence For Turkey Vis À Vis The Eu/15. Paper presented at the European Trade Study Group
6th Annual Conference, Nottingham, United Kingdom
Vollrath T.L. (1991). A Theoretical Evaluation of Alternative Trade Intensity Measures of
Revealed Comparative Advantage. Welwirtshaftliches Archiv 127 pp 265-280.
Yu W. and Frandsen S. (2002). China’s WTO Commitments in Agriculture: Does the Impact
Depend on OECD Agricultural Policies? Danish Research Institute of Food Economics. FOI
Working Paper No 15.
17

TABLES
Table 1 Trade in Primary Agricultural and Processed Food products 1998-2003
1998 2003 trend %p.a.
World Trade Total $ m US
Unprocessed 176,397 214,340 3.4%
Processed 87,294 111,569 4.4%
Processed share 33.1% 34.2%
World Imports from China
Unprocessed 5,617 7,496 4.4%
Processed 3,262 5,878 11.3%
Processed share 36.7% 44.0%
18

Table 2 China’s Share (%) of World Trade in Primary and Processed Food Products
1998 2003 Changea
98-03
HS 02 Meat 2.3% 1.2% -1.1%
HS 04 Dairy 0.8% 0.7% -0.1%
HS 07 Vegetables 8.1% 8.1% 0.0%
HS 08 Fruit 1.7% 2.1% 0.4%
HS 10 Cereals 3.6% 6.2% 2.6%
HS 12 Oilseeds 4.2% 4.5% 0.3%
TOTAL PAFPs 3.2% 3.5% 0.3%
HS 11 Milling products 1.8% 2.2% 0.4%
HS 16 Meat, fish, seafood 9.4% 12.3% 2.9%
HS 17 Sugars, confect. 1.0% 1.7% 0.7%
HS 19 Cereal, flour etc 1.9% 2.7% 0.8%
HS 20 Veg, fruit nuts etc 5.6% 8.4% 2.8%
HS 21 Misc. prods 1.5% 2.2% 0.7%
TOTAL PRFPs 3.7% 5.3% 1.5%
a in percentage points. NB rounding to nearest decimal point.
19
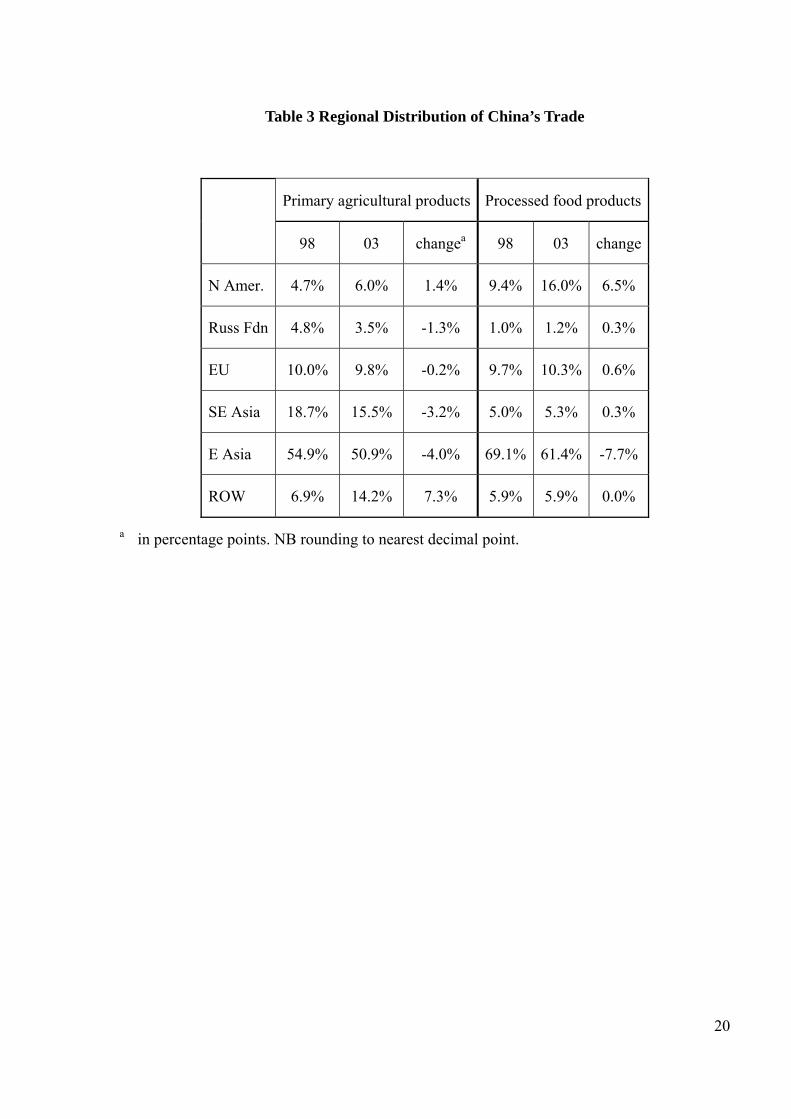
Table 3 Regional Distribution of China’s Trade
Primary agricultural products Processed food products
98 03 changea 98 03 change
N Amer. 4.7% 6.0% 1.4% 9.4% 16.0% 6.5%
Russ Fdn 4.8% 3.5% -1.3% 1.0% 1.2% 0.3%
EU 10.0% 9.8% -0.2% 9.7% 10.3% 0.6%
SE Asia 18.7% 15.5% -3.2% 5.0% 5.3% 0.3%
E Asia 54.9% 50.9% -4.0% 69.1% 61.4% -7.7%
ROW 6.9% 14.2% 7.3% 5.9% 5.9% 0.0%
a in percentage points. NB rounding to nearest decimal point.
20

Table 4a Decomposition of Changes in China’s AMS in PAFPS in percentage points
HS Category Period Structural Effect
Performance Effect
Total AMS Effect
E ASIA S.E.ASIA N AMERICA
EU RUSSIANFDN
ROW
98-01 0.17% -0.44% -0.27% -0.13% 0.09% 0.01% 0.07% -0.46% 0.15%Meat HS 02
01-03 -0.11% -0.81% -0.93% -0.72% -0.08% 0.00% -0.13% 0.12% -0.12%
98-01 0.02% -0.04% -0.03% 0.06% 0.01% 0.00% -0.13% 0.00% 0.04%Dairy HS 04
01-03 -0.07% 0.02% -0.05% 0.02% 0.00% 0.05% -0.13% 0.00% 0.01%
98-01 -0.91% 2.07% 1.16% 0.48% 0.16% 0.04% 0.09% 0.01% 0.37%Vegetables HS 07
01-03 -1.66% 0.53% -1.13% -1.52% 0.11% 0.14% -0.06% 0.11% 0.09%
98-01 0.18% 0.05% 0.23% -0.01% 0.19% 0.05% 0.00% 0.01% -0.02%Fruit HS 08
01-03 -0.23% 0.42% 0.19% -0.19% 0.05% 0.03% 0.18% 0.07% 0.05%
98-01 -0.53% -0.61% -1.14% 0.11% -1.48% 0.00% -0.01% -0.01% 0.23%Cereals HS 10
01-03 -0.16% 4.14% 3.98% 2.13% 0.97% 0.11% 0.03% 0.07% 0.68%
98-01 -0.23% 0.75% 0.52% 0.11% 0.05% -0.05% 0.12% 0.02% 0.26%Oilseeds HS 12
01-03 -0.29% 0.08% -0.21% -0.30% -0.05% 0.04% 0.06% 0.01% 0.04%
98-01 0.06% -0.10% -0.04% 0.08% -0.22% 0.01% 0.10% -0.10% 0.09%All of the above
01-03 -0.22% 0.60% 0.38% -0.04% 0.17% 0.05% -0.07% 0.07% 0.20%
21

Table 4b Decomposition of Changes in China’s AMS For PAFPS
HS Category Structural
Effect Performance Effect
Total AMS Effect E ASIA S.E.ASIA
N AMERICA EU
RUSSIAN FDN ROW
98-01 -0.02% 0.53% 0.50% 0.07% 0.38% -0.01% 0.02% -0.03% 0.07%Milling Products HS11 01-03 -0.18% 0.30% 0.12% -0.09% 0.01% 0.14% 0.01% 0.12% -0.06%
98-01 1.55% 2.59% 4.14% 3.11% 0.19% 0.64% 0.25% -0.06% 0.01%Meat, Fish, Seafood HS 16 01-03 -1.93% 1.43% -0.50% -1.04% -0.08% 0.80% -0.13% 0.03% -0.07%
98-01 -0.03% 0.36% 0.34% 0.11% -0.06% 0.10% 0.08% 0.00% 0.10%Sugar, confectionary HS17 01-03 -0.09% 0.46% 0.38% 0.08% 0.13% 0.18% 0.04% 0.00% -0.07%
98-01 0.03% 0.75% 0.79% 0.59% 0.01% 0.05% 0.10% -0.03% 0.06%Cereal, flour, etc HS 19 01-03 0.33% -0.31% 0.02% -0.05% 0.03% 0.03% -0.02% 0.00% 0.03%
98-01 0.39% 2.28% 2.67% 1.60% 0.15% 0.34% 0.37% 0.04% 0.16%Veg, fruit, nut prods. HS 20 01-03 -1.07% 1.62% 0.55% -0.63% -0.01% 0.67% 0.29% 0.09% 0.13%
98-01 0.14% 0.38% 0.53% 0.33% 0.05% 0.05% -0.03% 0.01% 0.10%Misc. Edible Pros. HS 21 01-03 -0.24% 0.40% 0.16% 0.05% 0.02% 0.01% 0.03% 0.02% 0.03%
98-01 5.35% -3.82% 1.53% -2.67% -0.18% -0.29% -0.38% -0.06% 0.02%All of above 01-03 -0.51% 0.67% 0.15% -0.29% 0.02% 0.32% 0.06% 0.04% 0.01%
22

FIGURES
Figure 1 Revealed Symmetric Comparative Advantage For China’s Pafps Exports
-0.80
-0.60
-0.40
-0.20
0.00
0.20
0.40
0.60
1998 1999 2000 2001 2002 2003
Rev
eale
d Sy
mm
etric
Com
para
tive
Adv
anta
ge Vegetables
Milk and Dairy
Cereals
Meat
Fruit
Oilseeds
WTO
Figure 2 Revealed Symmetric Comparative Advantage For China’s Prfps Exports
-0.80
-0.60
-0.40
-0.20
0.00
0.20
0.40
0.60
1998 1999 2000 2001 2002 2003
Rev
eale
d Sy
mm
etric
Com
para
tive
Adv
anta
ge
Meat, Fish, Seafoods HS 11
Sugars, confectionary HS 19
Veg, fruit, nuts HS 20
Misc products HS 21
Milling Products HS 11
Cereal, flour etc HS 19
WTO
23