
The influence of tropospheric irregularities on the ... INFLUENCE OF TROPOSPHERIC IRREGULARITIES ON...
184
The influence of tropospheric irregularities on the dynamic behaviour of microwave radio systems Herben, M.H.A.J. DOI: 10.6100/IR67 Published: 01/01/1984 Document Version Publisher’s PDF, also known as Version of Record (includes final page, issue and volume numbers) Please check the document version of this publication: • A submitted manuscript is the author's version of the article upon submission and before peer-review. There can be important differences between the submitted version and the official published version of record. People interested in the research are advised to contact the author for the final version of the publication, or visit the DOI to the publisher's website. • The final author version and the galley proof are versions of the publication after peer review. • The final published version features the final layout of the paper including the volume, issue and page numbers. Link to publication Citation for published version (APA): Herben, M. H. A. J. (1984). The influence of tropospheric irregularities on the dynamic behaviour of microwave radio systems Eindhoven: Technische Hogeschool Eindhoven DOI: 10.6100/IR67 General rights Copyright and moral rights for the publications made accessible in the public portal are retained by the authors and/or other copyright owners and it is a condition of accessing publications that users recognise and abide by the legal requirements associated with these rights. • Users may download and print one copy of any publication from the public portal for the purpose of private study or research. • You may not further distribute the material or use it for any profit-making activity or commercial gain • You may freely distribute the URL identifying the publication in the public portal ? Take down policy If you believe that this document breaches copyright please contact us providing details, and we will remove access to the work immediately and investigate your claim. Download date: 13. Jun. 2018
-
Upload
nguyenkhuong -
Category
Documents
-
view
215 -
download
1
Transcript of The influence of tropospheric irregularities on the ... INFLUENCE OF TROPOSPHERIC IRREGULARITIES ON...

The influence of tropospheric irregularities on thedynamic behaviour of microwave radio systemsHerben, M.H.A.J.
DOI:10.6100/IR67
Published: 01/01/1984
Document VersionPublisher’s PDF, also known as Version of Record (includes final page, issue and volume numbers)
Please check the document version of this publication:
• A submitted manuscript is the author's version of the article upon submission and before peer-review. There can be important differencesbetween the submitted version and the official published version of record. People interested in the research are advised to contact theauthor for the final version of the publication, or visit the DOI to the publisher's website.• The final author version and the galley proof are versions of the publication after peer review.• The final published version features the final layout of the paper including the volume, issue and page numbers.
Link to publication
Citation for published version (APA):Herben, M. H. A. J. (1984). The influence of tropospheric irregularities on the dynamic behaviour of microwaveradio systems Eindhoven: Technische Hogeschool Eindhoven DOI: 10.6100/IR67
General rightsCopyright and moral rights for the publications made accessible in the public portal are retained by the authors and/or other copyright ownersand it is a condition of accessing publications that users recognise and abide by the legal requirements associated with these rights.
• Users may download and print one copy of any publication from the public portal for the purpose of private study or research. • You may not further distribute the material or use it for any profit-making activity or commercial gain • You may freely distribute the URL identifying the publication in the public portal ?
Take down policyIf you believe that this document breaches copyright please contact us providing details, and we will remove access to the work immediatelyand investigate your claim.
Download date: 13. Jun. 2018

THE INFLUENCE OF TROPOSPHERIC IRREGULARITIES
ON THE DYNAMIC BEHAVIOUR OF MICROWAVE RADIO SYSTEMS
M.H.AJ. Herben

THE INFLUENCE OF TROPOSPHERIC IRREGULARITIES
ON THE DYNAMIC BEHAVIOUR OF MICROWAVE RADIO
SYSTEMS
PROEFSCHRIFT
ter verkrijging van de graad van doctor in de
technische wetenschappen aan de Technische
Hogeschool Eindhoven, op gezag van de rector
magnificus, prof.dr. S.T.M. Ackermans, voor
een commissie aangewezen door het college van
dekanen in het openbaar te verdedigen op
vrijdag 3 februari 1984 te 14.00 uur
door
~ffiTHIEU HENDRIKUS ADRIANUS JOSEPHUS HERBEN
geboren te Klundert

DIT PROEFSCHRIFT IS GOEDGEKEURD
DOOR DE PROMOTOREN
prof. dr. J.C. Arnbak
en
prof. ir. L. Krul
CIP-gegevens
Herben, Mathieu Hendrikus Adrîanus Josephus
The influence of tropospheric irregularities on the dynamic behaviour of microwave radio systems I Mathieu Hendrikus Adrianus Josephus Herben. - [S.l. : s.n.] - Fig. -Proefschrift Eindhoven. -Met lit. opg., reg. ISBN 90-9000584-6 SISO 539.1 UDC 537.87 UGI 650 Trefw.: elektromagnetische golfvoortplanting I antennes.

Aan mijn moeder
en ter nagedachtenis
aan mijn vader

Contents
Abstract
1. General introduetion
1.1. Background and scope
1.2. Brief survey
2. Review and extension of the theoretical description of
propagation on tropospheric radio paths
2.1. Introduetion
2.2. Large-scale refraction and reflection on the 30 GHz
l.o.s. path
2.2.1. Reflection at the earth surface
2.2.2. Temporal and spatial variatien of the k-factor
2.2.3. Amplitude and phase distortien
2.2.4. Ray tracing
2.3. Tropospheric scintillation
2.3.1. Weak-scattering theory
2.3.2. Application of weak-scattering theory
2.4. Precipitation
2.4.1. A model for the propagation medium in the presence
of rain
2.4.2. Attenuation, depolarisation and signal distartion
2.4.3. Rain-induced scintillations
3. Instrumentation of experiments
3.1. Introduetion
3.2. The 30 GHz measuring system
3.3. The local weather station
3.4. Baseband signal processing and data colleetien
4. Experimental verification of theory
4.1. Introduetion
4.2. Large-scale refraction and reflection on the 30 GHz
l.o.s. path
4.2.1. Signal fluctuations, depolarisation and distortien
4.2.2. Angle-of-arrival measurements
4.2.3. Ray tracing
4.3. Scintillation
4.3.1. Amplitude and phase scintillation measurements on
8.2 km line-of-sight path at 30 GHz (reprint)
3
3
5
7
7
8
8
10
13
15
18
18
21
23
23
24
32
41
41
41
43
44
45
45
45
47
59
59
61
63

4.3.2. Amplitude scintillations on the OTS-TM/TM beacon (reprint) 68
4.3.3. A camparisen of radio-wave and in-situ observations of
tropospheric turbulence and wind velocity {reprint) 74
4.3.4. Evaparatien derived from optica! and radio-wave
scintillation (reprint) 93
4.4. Precipitation 105
4.4.1. Signal fluctuations, depolarisation and distartion 107
4.4.2. Rain-induced amplitude scintillation on 8.2 km line-of-
sight path at 30 GHz (reprint) 116
5. The dynamic propagation medium as part of a telecommunication
system 127
5. 1. Introduetion 127
5.2. Review of adaptive cross-polarisation eliminatien 128
5.2.1. Cross-polarisation eliminatien networks 128
5.2.2. Cross-polarisation eliminatien at 30 GHz 130
5.3. Carrier tracking in the presence of scintillation noise 131
5.3.1. Comparison of the impact of scintillation noise and
thermal noise on coherent detection of PSK signals
5.4. Antenna pattern degradation due to phase errors in the
131
antenna aperture 135
5.4.1. Cross-polarisation properties of reflector antennas with
random surface errors (reprint) 135
5.4.2. Cross-polarisation properties of reflector antennas in
the presence of tropospheric turbulence
5.5. Interference reduction by antenna sidelobe suppression
5.5.1. Improved orbit utilisation by interferometric sidelobe
suppression (reprint)
5.5.2. Stationary phase methad for far-field computation of
defocused reflector antennas (reprint)
5.5.3. Influence of turbulence-induced scintillations on the
realised interference reduction
6. Summary and conclusions
Heferences
Appendix
Korte samenvatting
Toelichting
Dankwoord
Curriculum Vitae
140
145
145
150
155
161
167
173
175
177
179
181

- 1 -
Abstract
This thesis sets out with a theoretica! description for a line-of-sight
microwave radio path. Three dynamic mechanisms are dealt with:
refraction and reflection, tropospheric turbulence, and precipitation.
The existing theoretica! descriptions are extended, in order to approxi
mate the measured reality closer. The theory is applied to the specific
experimental 8.2 km line-of-sight path at 30 GHz. The theoretica! des
cription of tropospheric turbulence is also adapted to the experimental
11.575 GHz Orbital Test Satèllite (OTS) space-to-earth link operated by
Eindhoven University of Technology (THE). The measuring system is brief
ly described, and the measured results are presented and compared with
expectations based on the theory. A tropospheric probing experiment,
per~ormed in cooperation with the Royal Netherlands Meteorological
Insti•tute (KNMI), is described and the results are presented and dis
cussed. A method to compensate part of the system degradations imposed
by the troposphere is proposed. Finally, the impact of some of the
measured dynamic propagation phenomena on the radiation properties of
reflector antennas and on the functioning of coherent receivers has been
assessed.

- 3
1. GENERAL INTRODUCTION
1.1.
Relations between the propagation of radio waves and meteorological
parameters of the troposphere have been investigated extensively. Various
theories have been developed to predict the performance of a microwave
radio link from available meteorological data. It has been possible for
a long time, for instance, to base reliable statistica! predictions of
attenuation on empirical evidence of the statistica! distribution of
rain intensity. The design requirements of a specific radio link, in
order to achieve a prescribed cumulative service reliability, may thus
be derived from an - often more readily available knowledge of the
corresponding local rain statistics. The underlying statistica! propa
gation investigations require correlative measurements over a long period,
typical 3 5 years.
This thesis restricts itself to event analysis of radiometeorological
phenomena and relations. From such analysis, relations between radio
wave and meteorological data aan be obtained and compared with ex
pectations based on theory. Only with the restrietion to relatively
short time periods can a high sampling rate be used in the measuring
system. Accordingly, the dynamio behaviour of bath the radio-wave and
the meteorological parameters can be resolved by speetral analysis.
Dynamic behaviour is of importance for proper design of various adap
tive control systems which are now being introduced or considered in
the operatien of more cost-effective radio systems. Adaptive systems
are capable of adjusting themselves to the instantaneous aperational
environment, rather than being designed once and for all for a certain
worst-case environment.
Event analysis also permits a more detailed investigation of the aoup
ling of radio equipment (including antennas) to the physiaal aommuni
aation ahannel - a very complicated matter, because signals must be
related to fields and waves in a fluctuating medium. Finally, event
analysis offers the possibility to derive, from measured radio signal
fluctuations, certain operative meteorological parameters.
Millimeter waves are particularly strongly affected by certain tropo
spherieal phenomena. The conditions prevailing in the troposphere, s~ch

- 4 -
as temperature inversions 1 turbulence and precipitation, are therefore
of great importance for ground-located communication links using milli
meter waveléngths. Since 1982 1 CCIR reports are separately devoted to
the large-scale and small-scale effects of variations {both temporal and
spatial) of refraction on radio-wave propagation and radio equipment,,
including antennas.
Large-scale temperature inversions and associated meteorological effects
can be responsible for multipath pPopagation. Destructive interference
of several waves reaching the receiving antenna along different paths
causes severe sional fading. Because of the individual time delays of
the various waves, the communications channel may become highly dis
tarting; this obviously influences the design of wideband radio communi
cation systems. Due to the off-axis cross-polar mainlobes of reflector
antennas, the various waves may be responsible for depolarisation and
thereby limit frequency reuse due to co-channel interference from a
cross-polarised signal.
Channel distortien can be reduced by the use of adaptive amplitude and
phase equalisers at the receiver. The application of adaptively con
trolled antennas or polarisers to suppress the strengest distarting or
interfering wave(s) is also a viable proposition. In either event,
knowledge of the dynamic bbhaviour of the propagation medium in the com
munication channel is therefore essential.
Tropospheric turbulence causes rapid amplitude and phase fluctuations,
due to random small-scale temporal and spatial variations of the refrac
tive index. Such signal seintillation may affect the methods of design
of reliable radio communication systems. In contrast to additive thermal
noise 1 scintillation noise is multiplicative. This makes it impossible
to reach the optimum performance of a radio communication system simply
be increasing the transmitted power. For instance 1 phase scintillations
may be a limiting factor for carrier-recovery circuits in synchronous
demodulators for digital radio links and cause synchronisation problems
with certain time-division multiple access (TDMA) techniques for satel
lite networks. An antenna can be used as a spatial filter to suppress
interfen:!nce c,by nulling; scintillations may 1 however 1 degrade the in
tended suppression by "filling in" the null pointed towards the inter
ference. And even though depolarisation caused in the turbulent trapo
spbere itself may be neglected1 the concomitant phase errors introduced

- 5 -
over an aperture may still decrease the antenna's cross-polarisation
discrimination, and thereby limit frequency reuse by means of orthogonal
polarisations, just as reflector surface errors do. Thus, the existence
of scintillation noise suggests a lower specificatien limit on reflector
antenna surface errors, since a better approximation of the desired
reflector surface shape would not result in improved cross-polarisation
discriminatien in the presence of tropospheric scintillation.
During precipitation the radio channel becomes perturbed by a random
distribution of discrete scatterers. Signa! fluctuations due to frozen
particles, such as snow and hail, are generally smal!, whereas wet snow
and rain cause much larger signa! fadings. The channel medium filled
with asymmetrie raindrops is obviously anisotropic and therefore depola
rises the transmitted signa!. Rapid amplitude and phase scintillations
can occur due to Doppler shifts introduced by the falling raindrops.
Site diversity and adaptive power control are increasingly used to cam
bat severe precipitation fadings. Adaptive cancellation networks to
restare orthogonality in frequency-reuse systems are also being devel
oped. Again, the time constants of the natura! communication channel in
the troposphere is highly significant.
In all these radio systems, whether for telecommunications or for tropo
spheric probing, the short-term.dynamics of the communicati0n channel is
thus of potential importance. Therefore, this thesis is dedicated to a
theoretica! and experimental study of the short-term dynamica! behaviour
of millimeter-wave propagation in the troposphere. vlhere necessary, the
longer-term mean values around which these fluctuations occur are also
analysed.
1.2.
The thesis sets out with a theoretica! description for a line-of-sight
radio path. Three dynamic mechanisms are dealt with: clear-air refraction
or reflection, tropospheric turbulence, and precipitation. The existing
theoretica! description is extended, mainly to approximate the measured
reality closer. This description is adapted to the specific experimental
30 GHzradio link dealt with. lts path profile is shown in Fig. 1.1.
This is a pure line-of-sight path for all realistic values of the re
fractive-index gradient. The tropospheric turbulence theory is also

- 6
adapted to the experimental 11.575 GHz Orbital Test Satellite space-to
earth link operated by Eindhoven University of Technology (THE).
The measuring system is briefly described. This system is unique in
that it offers the possibility to measure the complete set of complex
transmission parameters of the propagating path.
The measured results are presented and compared with expectations based
on theory. A tropospheric prohing experiment, performed in cooperation
with the Royal Netherlands Meteorological Institute (KNMI) , is described
and the results are presented and discussed.
Finally, the impact of some measured propagation phenomena on the radi
ation properties of reflector antennas and the functioning of receivers
will be assessed. A method to compensate part of the system degradations
imposed by the troposphere will be presented.
The thesis includès eight papers or letters previously published by the
author in the course of this investigation. These reprints have been
incorporated and annotated in the context of the relevant theoretica!
model, experimental validation, or technical application discussed in
this thesis.
first Presnel zone} k=4/ 3 100 Eindhoven
line-of-sight
80
s 60
~ ~ ~ ~ w ~ 40
20
0
0
Fig. 1.1
--k=0.06
2 4 6 8
distance, km
Path geometry of the experimental 30 GHz line-of-sight
link Mierlo-Eindhoven. Standard refraction (k 4/3)
and extreme subretraction (k = 0.06).

- 7
2.1.
In this chapter a radio communications channel will be modelled. Tropo
spheric radio-wave propagation depends strongly on the weather con
ditions which differ widely from time to time. Therefore it is virtually
impossible to give one universa! theoretica! description of the tropo
spheric radio channel. Typical meteorological conditions in the tropo
sphere are temperature inversions, turbulence and precipitation. Por
each of these three conditions a theoretica! model will be presented
v7hich makes it possible to predict the channel behaviour from measured
meteorological data. In practice these weather conditions can occur
simultaneously; in the theoretica! description of the radio channel,
however, they are assumed to occur separately.
Large-scale temperature inversions and associated meteorological effects
can result in the existence of more than one wave between transmitter
and receiver, and in an abnormal divergence or convergence of waves.
The resulting signa! fluctuations and the amplitude and phase distar
tion of the channel signals will be examined for the specific line-of
sight path under investigation.
In a turbulent troposphere, the refractive index varies in a random way
as a function of time and position. This results in a random variatien
of both amplitude and phase of the received signa!. An existing theory,
which assumes a plane wave incident on the turbulent troposphere (as in
case of space-earth paths), is extended so that it can also be used for
a spherical wave, in order to allow proper investigation of terrestrial
line-of-sight paths, where both transmitter and receiver are within the
turbulent troposphere.
An existing theory for radio-wave propagation through a medium filled
with rain particles is applied to the 30 GHz line-of-sight path and ex
tended so that amplitude fluctuations and depolarisation can be computed
taking into account the dropsize distribution, the canting angle distri
bution of drops, and the varying rain intensity along the propagation
path. This all results in a theoretica! model which approaches reality
closer. An existing theory to determine the variances of amplitude and

- 8
phase scintillations introduced by a medium filled with discrete scatter
ers is extended to the determination of the scintillation spectra. For
literature reviews of multipath propagation, tropospheric scintillations
and EM-wave propagation through rain, see [1], [2,3] and [4,5,6], res
pectively.
2.2. Large-scale refraction and reflection on the 30 GHz l.o.s. path
The theory concerning the general influence of large-scale refraction
and reflection on radio-wave propagation is described in several text
books [e.g. 7, 8). In this sectien the theory will be applied to the
30 GHz terrestrial propagation path. First the possibility of coherent
and incoherent (diffuse scattering} reflections at the earth surface will
be investigated. Then signal fluctuations due to large-scale variations
of the refractive-index gradient and thus of the associated k-factor [7]
are assessed.
Severe multipath fading may occur, most frequently during clear summer
and autumn nights when temperature inversions and associated meteorolo
gical effects produce locally large vertical gradients in the refractive
index of the atmosphere. Often the occurrence of temperature inversions
are accompanied by a fog layer near the earth surface, with an almest
discontinuous variatien of humidity and, consequently, of the refractive
index at the top of the layer. By modelling this as a discontinuity in
the refractive index modulus N [9), it is possible to define a reflection
and transmission coefficient for such a layer. The influence of this on
the co- and cross-polar component of the received signa! will be investi
gated. The amplitude and phase characteristics cf the resulting frequency
selective radio-channel, of great significanee to wideband radio communi
cation systems, are analysed.
A ray tracing program has been written to estimate the received signa!
strength numerically, in cases where an arbitrary N profile makes it
impossible to derive an analytica! expression for the field fluctuations.
2.2.1. Reflection at the earth surface
The magnitude of the signal coherently reflected at the earth surface,
relative to the directly received signal depends strongly on the spe
cific path geometry (see Fig. 1.1) and antenna radiation patterns (see
the appendix). For the terrestrial propagation pathunder consideration,
the contribution of the coherent component to the total received power

- 9 -
can be neglected because
-as shown in Fig. 2.1 the part of the first Presnel zone (of the re
flected wave) at the ground surface that is illuminated by the trans
mitter is not seen by the receiver, while the part seen by the receiver
is not illuminated by the transmitter. This is caused by the shadows of
a cluster of flats situated near the reflection point.
- the receiving and transmitting antennas jointly suppress this second
wave approximately 10 dB relative to the direct wave.
- the earth surface can be considered very irregular which reduces its
coherent reflection coefficient. The ensemble average of this reduc
tion factor,assuming a Gaussian distribution of surface roughness, is
given by [8]
(2 .1)
with
~h the mean height of the irregularities
~ the grazing angle relative to the mean surface.
-<- Eindhoven Mierlo ....
* distance to receiver (km)
Fig. 2.1. Blockage in the first Fresnel zone (of the reflected wave)
at the ground surface, caused by the shadows of a cluster
of flats situated near the reflection point on the Mierlo
Eindhoven link.
Table 2.1 shows Rr for the propagation pathand frequency considered
for different values of ~h. It is clear that the reduction at 30 GHz
is substantial.

Table 2.1
- 10
The reduction factor R for different values r
of 8h at 30 GHz
M (m) R r
0 1
0.05 4.11 10-1
0.10 2.85 10-2
0.15 3.34 10-4
0.20 6.61 10-7
Besides this coherent component the incoherent component may be im
portant, sirree for this component not only the first Fresnel zone, but
the whole ground area seen by the receiving antenna and illuminated by
the transmitting antenna is important. According to Beckmann and Spizzi
chino [8] the contribution of this incoherently reflected field, for the
above mentioned Gaussian surface model, is determined by the quantity
with
2 =L
L the lenqth of the propagation path
(2.2)
ht~ hr the height above local ground of the transmitter and receiver,
respectively
at, ar the 3 dB beamwidth of the transmitting and receiving antenna,
respectively.
For our propagation path this leads to Ka= 0.86, which corresponds to
a negligibly small value for the diffuse reileetion coefficient (see Fig.
12.11 of [8]).
Due to slow variations in time of the refractive index gradient, the
angle-of-departure at the transmitting antenna and the angle-of-arrival
at the receiving antenna will vary, resulting in a variatien of the re
ceived power. This phenomenon, too, depends strongly on path geometry
and antenna patterns. Fig. 2.2 shows the expected signal fluctuations
as a function of the k-factor. It is assumed that bath antennas are

-15
rl
~-10 01 ..... Ul
).; lll
.--1 0 p, I
g -5
~ ..... .., lll
.--1
& 0
Fig. 2.2
- 11 -
Relative co-polar signal as function of lkl
(k-factor fading) for the 30 GHz l.o.s. link.
aligned perfectly during standard atmospheric conditions (k = 4/3).
Signa! fluctuations are seen to be negligibly small if lkl > 0.3. More
over, the percentage of time that lkl < 0.3 is also negligible [10].
A discontinuity (8N) in the refractive-index modulus profile will have
a greater influence. The reflection coefficient
nuity is given by [9]
at such a disconti-
(2. 3)
Fora given height h (see Fig. 1.1) of the discontinuity, the maximum
and minimum received power are computed. The result is shown in Fig.
2.3 for Ml = 10, according to [9] the largest value of 8N that
may occur. It is observed from this figure that, due to the large sup
pression by the antennas and the small reflection coefficient (R ) for e

- 12 -
large grazing angles (~), the influence of this discontinuity becomes
important only if the layer approaches the height of the antennas. (To
show the influence of the ántenna patterns alone, the curves for R e -1 (total reflection independent of the grazing angle wl are included
in Fig. 2.3). It is assumed in the analysis that the top of the layer
is a plane parallel to the earth surface; in this situation it can be
proved that the propagation medium itself will not give rise to any
depolarisation [11]. However, due to the off-axis cross-polar lobes in
4
0
Pl 'Ö
.-1 <U -4 a Ö'
·.-! (I)
"" <U .-1 0 0. -8 I 0 {)
(J)
:> ·.-! .j.l <U -12 .-1 Q) tl:
-18
Fig. 2. 3
p max.....,. - -- === - - .........
Pmin ..
20 30 40 50
Maximum and minimum received power (Pmax
and P . ) as a function of the height (h) m~n
of a discontinuity (~NalO)
in the refractive index profile.
-- with assumed specular reflection (Re= 1)
with the actual reflection coefficient {as
given by Eq. 2.3).
the antenna patterns the reflected wave may be responsible for some
depolarisation. A quantitative study of this is impossible in the ab-

- 13 -
sence of the cross-polar patterns of the antennas. However, this contri
bution is expected to be small because, as seen above, the secend wave
becomes important only if the layer approaches the antenna height. In
that case, however, the off-axis angle of the secend wave, and hence
the cross-polar field of each antenna, is small.
During multipath conditions with two waves the electromagnetic field
E(f) at the receiver is multiplied by a factor of the form
E{f) - 1 + a exp{ja{f)} (2.4)
with
a(f) = (2.5)
AS the path-length difference of the two rays along which the two waves
propagate
a the ratio of the field strength of the secend wave and that of the
direct wave, at the receiver
a the velocity of light.
This gives for the received power the expression
P(f) - 1 + a2 + 2a cos(2nfAS) a
(2.6)
The frequency spacing FA between a minimum and a maximum of Eq. 2.6 is
given by
(2.7)
Let the occupied bandwidth be B, and define the function
1 for
{B) = (2.8)
[nBM { (-2a ) cos (rrBM)}] sin --· + arcsin --a l+a2 o
for B < FA

- 14 -
Then amplitude distortien arises due to a maximum in-band variatien
The phase of Eq. 2.4 is given by
<IJ(f) arctan -a sin(21TfM;
l a t 21r M 1 + a cos(-~-) a
(dB) (2. 9)
(2 .10)
The minimum frequency spacing FQJ between a maximum and a minimum value
of <fl(f) is given by
F<P = 1T~S arccos (a) (2.11)
Phase distortien arises due to a maximum in-band variatien
2 arctan( h) for B :: F<P (2 .12)
\' 1-a
Dep =
2 arctan t: sin(TIBMJ a } for B <Fep (2.13)
1rBM -a cos(--)
a
Both amplitude and phase distortien for a radio signal occupying a
bandwidth B are thus a function of the relative strength (a) of the
second wave and the path length difference (~S) between the two rays
along which the two waves propagate. For the profile with a disconti
nuous jump in the refractive-index modulus as described in the pre
ceeding section, a and ~S are known when the height h of the disconti
nuity is known.
Fig. 2.4 shows the maximum in-band amplitude and phase variations for
B = 500 MHz and ~N = 10. It is seen from this figure that for small h
the distortien is small, which is due to the large suppression of thè
secend wave by the antennas, and the small value of the reflection co
efficient because of the relatively large grazing angle. With increasing
h the antenna suppression decreases and the reflection coefficient in
creases, resulting in increased distortion. The in-band amplitude and

Fig. 2.4
- 15 -
1.2
0.8
p::j '0
!:::)~ 0.4
0.0
8
6
UI 4 Q) Q) ~ Ö' Q) 'Ö
2 -e-
Q
(b) 0
20 30 40 50
h, m
Signal distartion within a 500 MHz bandwidth as a
function of the height (h) of a discontinuity
(fiN 10) in the refractive index profile.
a. maximum in-band amplitude variatien
b. maximum in-band phase variatien D~
phase variations exhibit a maximum value and decrease for a further in
crease of h, because the bandwidth B becomes smaller than the frequency
separations defined in Eqs. 2.7 and 2.11. Comparison of Fig. 2.3 with
Fig. 2.4 shows that large temporal signal fluctuations are not neces
sarily related to large signal distortion.
The simple profile used in the preceeding two sections will, in practice,
only be an approximation. Nevertheless, it is easy to obtain analytica!
estimates with this theory. In dealing with a measured profile, however,
this can have an arbitrary shape within wide limits allowed by meteoro-

- 16 -
logy. Then it is necessary to treat the problem numerically. For a ter
restrial line-of-sight propagation path it is not necessary to use a
full-wave description [12], which is of high accuracy but impose for
midable demands in implementation. Then a ray tracing approach is much
simplar in application and, if due care is taken, will provide a reason~
able estimate of the required quantities [13].
A ray tracing program has been written for which the troposphere is
divided in layers parallel to the earth surface. Each layer has its own
refractive index gradient. The number of layers depends on the number
of heights at which the refractive index is known.
The different wave paths are found by tracing rays from the transmitting
antenna towards the receiving antenna at different angles, in order to
see whether the ray "hits" the receiving antenna. For all such rays the
angle at the receiver and transmitter are used to take the suppression
by the antennas into account.
The phase of each ray at the receiver is simply obtained by adding the
phase shift obtained in each layer passed by the ray. The amplitude of
the ray can be obtained by werking with pencils of rays, and applying
power conservation within each ray tube. A profile measured in the UK
[14] and shown in Fig. 2.5a can be used to demonstrata that beSfdes multi
path caused by refraction and reflection, other phenomena may be respon
sible for large signal fluctuations, namely divergence and convergence.
The lengthof the propagation path is 7.5 km, while the height of bath
antennas is 25 m above local surface. It is seen from Fig. 2.5b that
there are three ray pencils leaving the transmitting antenna and ar
riving at the receiving antenna. The received power is calculated to
be 8.25 dB above the level expected during standard atmospheric con
ditions (k = 4/3). Such an upfade has indeed also been observed (point
A in Fig. 2.5a). If the entire profile is hypothetically shifted 15 m
downwards, it appears that there is only one ray pencil left. Due to
divergence of the eerrasponding wave, the recéived power is now 15 à 17
dB below the level expected during standard atmospheric conditions. This
anomalously large signal reduction was also observed and is indicated
at point B in Fig. 2.5a.
Thus it would appear that not only multipath can give rise to large
signal fluctuations, but also divergence and convergence. However, such
very large signal variations will occur only if the height of the trans-

Ql u <U
4.; l-l ;:l lil
.-1 <ll u 0
.-1
<IJ
~
40
36
32
28
.j.l 24 -§, .....
<IJ .<::
20 0
Fig. 2. 5
- 17 -
excess poth loss A GMT B
1 _ t 0>00 """" oooo+a.oo oooo oooo
m 2300 o" 1041~--, 1J-20 ·~
-40 36GHz Crowfleld-to-Mendlesnam 75km link
I
70 I
s \ I
' I Ql 60 I u l <U
4.; Ik 4/3 l-l ;:l 50 I (J) l
.-1 I
IC I u I 0 l
.-1
Ql 30 \ 5 I
,.Q I <ll 20 \ .j.l I -§, I ..... 10 I Ql (a) I .<:: I
0 300 310 320
refractive index modulus, N-units
(b)
2 4 6
distance, km
Signal fluctuations caused by multipath and divergence.
a. Simultaneous measurements of the refractive index
modul u!'! profile and fading at 36 GHz on 7. 5 km l.o. s.
link in UK [14).
b. Rays corresponding to profile shown in Fig. 2.5a as
determined by the ray tracing program.

18 -
mitting and receiving antenna are nearly the same [15]. Hence these
large signal fluctuations are not expected on the experimental 30 GHz
l.o.s. link (for which the height above local surface of the transmitting
antenna is almost twice as large as the height of the receiving antenna
(see Fig. 1.1)).
2.3. Tropospheric scintillation
Weak-scattering theory for radio-wave propagation in the turbulent trope
spbere was first described by Tatarski [16] and later modified by Lee and
Harp [17] and extended by van Weert [18]. Weak scattering implies that
the scattered field component is much smaller that the incident field
component. In this sectien the known expressions for the co-polar field
component obtained from this theory are quoted and a formula is presented
for the cross-polar component. The existing theory which assumes plane
electromagnetic waves (and is therefore best suited for a satellite
earth propagation path), is extended to spherical waves; soit is also
applicable for line-of-sight terrestrial propagation paths. Both plane
and spherical wave representations are used to predict the scintil
lations on the 11.575 GHz downlink from the Orbital Test Satellite (OTS)
and on the 30 GHz line-of-sight link (Mierlo-Eindhoven).
The theoretical derivation given by van Weert [18] is based on a metbod
described earlier in the literature by Lee and Harp [17], and makes
extensive use of the plane-wave representation of the electromagnetic
field [19]. The use of this representation offers the possibility of
more readily substituting practical antenna apertures. Single-scattering
and linearly polarised incident fields are assumed. Single-scattering
bere implies that the field scattered from one thin tropospheric slab
(perpendicular to the propagation path) will not be scattered a second
time at any other slab [18].
The variances of amplitude scintillation (a~/A) and phase scintillation
(a~~~ of a wave with wave number Band the corresponding power density
spectra S8A/A(Q) and S~~(Q) were found to be [18]

with
- 19 -
L 00 2 2 = J ds J dK {J (K) K 1l {K) (K SJ 0 M/A a n
q_ 8
0 0
L 00 2 2 J ds f dK {J (K) 'Îl {K) (K 8)
(Jörp K q+ a n 8 0 0
2 L co
}_ 213 f ds f dK g (K)
Vi TI 0 Q a
4J (K) n K---q ~+
V Ku-Qu
(), q + (. ) 1 + cos (. )
ga{K) the normalised antenna gain function (G (K)/G (o)) a a Vi wind velocity component transverse to the propagation path
4ln(K) the three-dimensional power spectrum of the refractive index
fluctuations
A the mean value of the amplitude of the received signal
K wave number of spatial Fourier·component.
(2.14)
(2 .15)
( 2. 16)
(2.17)
(2. 18)
(2.19}
In this study the von Kármán representation of the Kolmogorov spectrum
[18] is adopted
with
L the outer scale of turbulence 0
Z the inner scale of turbulence. 0
for 2TI
K <
A typical value of
millimeters.
is 10 m [18] and Z0
is in the order of a few
(2.20)
It should be noted that the structure constant c2 used by van Weert no

20 -
[18] is, due toa difference in notation, a factor 8.19 larger than the 2 structure constant C more commonly used elsewhere in literature. In
this thesis both c2 n~d c2 will be used. nD n
For ease of numerical computation, the normalised antenna gain function
is assumed to be Gaussian and given by
(2. 21)
Here, ar is a measure of the physical dimensions of the antenna. If we
compare this antenna with one having a diameter D and a uniform illumi
nation, then the two antennas will have the same directive gain for
D 4ar. This approximation is reasonable for mainlobe effects. In the
event of sidelobe studies, antenna patterns with more fine-structure are
required (see Sectien 5.5).
To obtain the spectra use is made of Taylor's frozen turbulence hypo
thesis [20]. This assumes that the turbulent airmass moves with the wind
velocity V without any change of its statistical properties.
This theory is now extended by the calculation of the varianee of the
cross-polar scintillation noise component (a2 ). This component is n, cross
obtained following a derivation similar to that described by van Weert 2 .
[18] for the co-polar scintillation noise power (a ), and is given by n,ao
2 1 2 L 00
5 a = --2 A f ds f dK ga(K) K q>n(KJ n, aross 16~8 0 0
{2.22)
while van Weert bas found for the co-polar scintillation noise power [18]
82 2 L "" a2 = 2n A I ds I dK g (K)K $ (K) n,ao
0 0 a n
(2.23)
It fellows from computations that a2 is generally more than 70 dB n,aross below the undisturbed field power A2
• Thus, the cross-polarisation
introduced by tropospheric turbulence can be neglected. This is in
agreement with the qualitative statement made by Lee and Harp [17].
Following the distinction between wave types in [17] the derivation of
van Weert [18] is now extended so that it can also be used for a spheri
cal wave, by a proper modification of the phase distribution in a medium
slab perpendicular to the propagation direction and of the corresponding

- 21 -
field strength. The variances of amplitude scintillation (a~/A) 2
phase scintillation fcr6~J and the corresponding spectra S6A/A(Q)
s6~(Q) given in Eqs. 2.14 - 2.17 are then replaced by
2 B2 L oo { 2 (L- )l f d f d ( ) K ~n(K) q+ K BBL s OÓ~ = 4~ 8 K ga K ~ 0 0
s6A/AmJ
2 L co 2 !..__ 26 f ds J dK g (K) K --::=:;;::::;:=== q+ {K 8 i L-L sJ! V~ ~ o QL a • /2 2 ~ f s- 'V._K __ s __ Q2
L2
and
and
(2.24)
(2.25)
(2.27)
With the theoretica! results summarised above both amplitude and phase
scintillation spectra together with the corresponding scintillation
noise variances, can be computed for the 30 GHz line-of-sight path
using Eqs. 2.24 - 2.27. The amplitude scintillation spectrum and the
amplitude scintillation noise varianee for the 11.575 GHz OTS downlink
are obtained from Eqs. 2.14 and 2.16.
As input parameters for the numerical calculations it is assumed that
L 10 mand c8 5.10- 12 m- 2/ 3 (strong turbulence [18]). An expo-
a no nential decrease of the strength of turbulence with height is adopted
for the satellite downlink [18]. The results are shown in Fig. 2.6.
Because the slope of the high-frequency part of the spectrum is frequency
independent [21) and the same for the spherical and plane-wave repre
sentations, the slopes of the amplitude spectra can be directly com
pared. It appears that the slope of.the spectrum for the satellite
downlink is steeper than that for the line-of-sight link; this is caused
by the larger averaging effect of the 8 m Gregorian antenna, used in the
University's ground station,compared with the 0.5 m front-fed paraboloid,
used on the 30 GHz line-of-sight link.

- 22 -
-20 -30
·.-1 -.-1 ·.-1 ~
1-1 -40 H
.B -30 0 4-<
~ ~ 'Ö 'Ö
s a
-40 -50 ~
i :;] Ü)
-1 -1 ~ ~
-50 -60
(a)
10-2 10-l 10° 101
2nf/v .1' -1
m
104
N
Ul (!)
102 (!)
H 01 (!)
'Ö
a
10°
-1 ;::,
10-2 (b)
10- 2 10-l -1
10° 101
2nf/v .1' m
Fig. 2.6 Theoretica! scintillation power density spectra
a. amplitude for
(i) 30 GHz l.o.s. link (û~/A -27.4 dB)
(ii) 11.575 GHz OTS downlink (û~/A -38.2 dB)
b. phase for the 30 GHz l.o.s. link (ûA~ ~ 15 degrees).

23 -
2.4. Precipitation
The signal fluctuations caused by a propagation medium perturbed by
frezen particles such as snow and hail are, in general,small [5]. How
ever, wet snow and notably rain are expected to result in much larger
signal fluctuations.
In this section a model for the propagation path in the preserree of rain
is presented. The existing theory to predict attenuation, depolarisation
and distartion will be extended so that the theoretica! results are more
realistic. Finally, a new theory is described to determine the spectra
of amplitude and phase scintillations induced by rain.
2.4.1. A model tor the propagation medium in the preserree of rain \ ----------------------------------------------------------
To determine the propagation properties of a medium with falling rain
drops it is not sufficient to model the extent of the rain shower; it
also appears to be necessary to model the ensemble of raindrops. Important
aspects are:
(i) the raindrop size distribution at a given rain intensity.
Unfortunately, there is no unique agreed distribution. At fre
quencies below 40 GHz, the Laws and Parsons distribution [22] is
generally used, while at frequencies above 40 GHz the Marshall
and Palmer distribution [23] gives the most realistic results.
Furthermore, three different models for widespread rain, drizzle
and thunderstorm were proposed by Joss et al. [24].
(ii) the fall velocity of a raindrop with a given size, which is tabu
lated in [25].
(iii) the flatterring of a falling raindrop, caused by the air pressure
from below, as a function of its size, discussed by Oguchi [26].
(iv) the canting angle caused by any gradient of wind velocity with
height. Unfortunately, there is no unique canting angle distri
bution. Chu [27] defines a mean absolute value for the canting
angle and dorrects the received field strengths, computed with
this model, with a certain factor to take the imbalance between
positive and negative canting angles into account. Some ether in
vestigators assume a Gaussian distribution with different values
for the mean and the standard deviation. In a recent experiment
Dilworth and Evans [28] determined this mean value and standard
deviation by cross-polar measurements using both linearly and cir-
- 24 -
cularly polarised waves. They found a mean value of 8.5 degrees
and a standard deviation of 43 degrees.
To take the non-uniform rain intensity along the propagation path into
account one ofte:~ uses a so-called effective path length, which depends
on the actual path length and the rain intensity measured at a single
point between transmitter and receiver. Note that this effective path
length is obtained experimentally from a spot measurement.
However ,_ to determine the attenuation theoretically and to include the
determination of the cross-polar component, it is necessary to know the
rain intensity at every point on the propagation path. The only avail
able model which gives the rain distribution along the propagation path
for a spot measurement of rain intensity is the model introduced by
Crane [29}, obtained from rain intensity measurements with a large num
ber of raingauges along a line. The application of this model to deter
mine the cumulative distribution of attenuation from a known cumulative
distribution of rain intensity, as done by Crane [29], has been criti
cised by other investigators [30]: this model leads to erroneous results
especially for low rain intensities. However, for our event analysis,
low rain intensities are nat interesting, so this model will be used
here.
To determine the polarisation-dependent attenuation and depolarisation,
our starting point is a single-scattering theory described by van de
Hulst (31). According to Medhurst [25], such a single-scattering theory
may be used if the mean distance between individual raindrops is at least
five times their diameter. This is true for all normal rainshowers. From
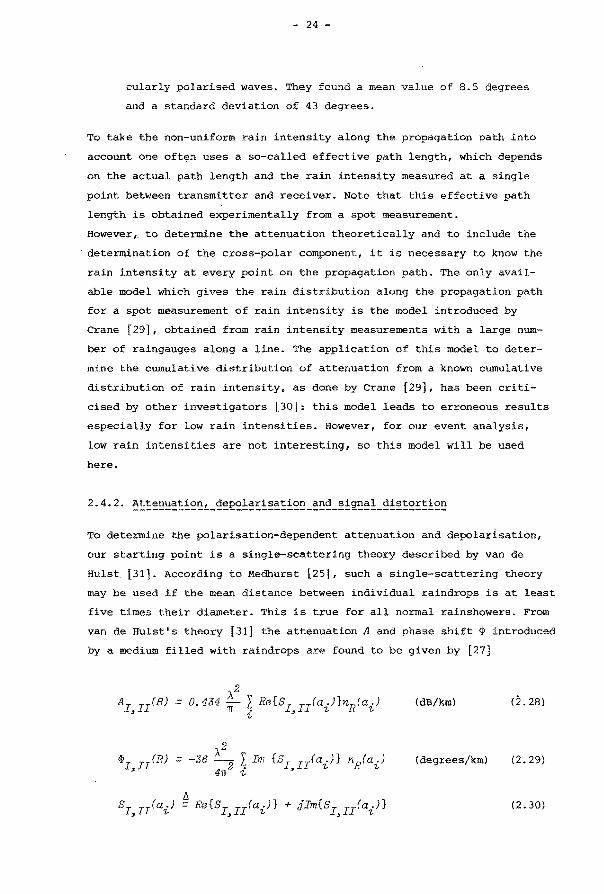
van de Hulst's theory [31] the attenuation A and phase shift ~ introduced
by a medium filled with raindrops are found to be given by [27)
(dB/km) <2. 28)
(degrees/km) (2.29)
( 2. 30)

25 -
where À is the wavelength in centimeters and nR(ai) the number of drops
with equivolumic radius a. per cubic meter [27] at a given rain intensity 1.,.
R. SI(ai) and SII(ai) are the complex forward scattering functions {at
the temperature considered) of a raindrop with equivólumic radius ai [26],
for the two polarisations I and II. These are perpendicular and parallel,
respectively, to the plane containing the axis of symmetry of the rain
drop and the direction of propagation of the incident wave {see Fig. 2.7).
Numerical tables of these forward scattering functions are given by
Morrison and Cross [32] for a temperature of 20° C.
It is now assumed that all raindrops are canted with respect to the
vertical direction, by the same canting angle eaa {see Fig. 2.7).
Fig. 2.7
y
I
canted oblate spheroidal raindrop.
Chu [27] calculated for this configuration the attenuation and depolari
sation resulting from the anisotropic rain medium. In practice, dual
polarisation radio communication systems employ either two orthogonal linear
polarisations, or two circular polarisations with opposite sense of ro
tation. The orthogonal linear polarisations are usually aligned in the
vertical and horizontal directions for terrestrial paths. For multiple-
link satellite networks, this is not generally possible. The relation-
ship between input (transmitted) and output (received) polarisations
for the rain medium can be given on the form (27]
(2. 31)

- 26 -
Here, Etx and Ety are the transmitted horizontally and vertically pola
rised waves, respectively; E and E are the received horizontally and rx ry vertically polarised waves, respectively,
axx TI cos2
8 + TII sin2eaa ca (2.32)
a = TII cos2e + TI sin
2e yy ca a a (2.33)
a a = sin(28 ) xy yx ca (2.34)
and TII are the transmission coefficients for á harmonie plane wave
propagating along a path of length L, for polarisations I and II, res
pectively, and are given by
exp {-(ai+ (2.35)
= exp (2.36)
The attenuation coefficients aii and phase shift coefficients SI'
SII may be obtained directly from AI~ and ~I~ ~II given by Eqs.
2.28 - 2.30. For our 30 ~~z propagation experiment, using vertical pola
risation, the excess rain attenuation and cross-polarisation discrimi
nation are then given by
2 attenuation = -10 log ia I (dB)
yy (2. 37)
XPD = -10 log l:yxl2) (dB} YY
(2.38)
Here the factor E is introduced as a substitute for the real canting
angle distribution to take the imbalance between positive and negative
canting angles into account.
Fig. 2.8 shows the attenuation as a function of rain intensity and the
XPD as a function of attenuation, taking the canting angle eaa equal to
its mean absolute value <18 I> a a 25 degrees and E = 0.14. These nomina!
values of eaa and E were obtained by Chu by fitting theoretica! and ex
perimental results. Furthermore, the Laws and Parsons dropsize distri
bution was adopted

120
100
80
til 'Ö
60 !::: 0
.,..; .j..l m ::l 40 !::: (1) .j..l .j..l m
20
0
60
50
40
til 'Ö
0 30 p.. :><:
20
10
Fig. 2.8
0
0
- 27 -
ii
40 80 120
rain intensity, mm/hr
ii
(b}
40 80 120
attenuation, dB
Attenuation as a function of rain-intensity (a) and
cross-polarisation discrimination (XPD) as a function
of attenuation {b) for 30 GHz l.o.s. path {Laws and
Parsons dropsize distribution).
{i) Chu's uniform rain model with <Ie I> ca and E 0.14
25 degrees
{ii) Crane's rain model with 8.5 degrees and
43 degrees.

- 28 -
In reality, the rain intensity is not constant along the propagation
path. Furthermore, the introduetion of a reduction factor E will not be
necessary if the canting angle distribution is known. So it is expected
that the actual situation may be approximated more closely if we allow
the rain intensity to vary along the propagation path and introduce a
canting angle distribution. Therefore the model adopted by Crane [29]
is used to generate,at a given point measurement of rain intensity, a
rain intensity profile along the propagation path,and the canting angle
is taken to be Gaussian distributed.
A computer program was written using the model adopted by Crane. From
the rain intensity at a given point of the propagation path, the corres
ponding dropsize distribution is computed by interpolation between known
distributions at distinct rain intensities (as tabulated in [22-24]).
Then the attenuation coefficients ai and aii and the phase shift coeffi
cients BI and BII are computed from AI, AII, ~I and (given by Eqs.
2.28- 2.30). Now, the contribution of an infinitesimal portion of the
propagation path to attenuation and phase shift is known. The resulting
attenuation and phase shift coefficients for the complete propagation
path are obtained by adding all these individual contributions. Then the
transmission coefficients TI and TII are computed using Eqs. 2.35 - 2.36.
Finally, knowing the canting angle distribution, the attenuation and
depolarisation introduced by the complete propagation path are obtained ~
from Eqs. 2.32- 2.34 and Eqs. 2.37- 2.38 (E 1).
Results obtained with this computer program are also included in Fig. 2.8,
assuming the mean value and standard deviation of the Gaussian canting
angle distribution found by Dilworthand Evans [28], viz. 8.5 and 43 de
grees,respectively.
Comparison of these results with these obtained from Chu's uniform rain
model shows that for small rain intensities the attenuation is larger
while for large rain intensities the attenuation is smaller (Fig~ 2.8a).
This may be explained by the fact that at high point rain rates the most
intense rain is likely to occur close to the observation point.
Away from this point, the rain intensity is expected to be lower. So the
uniform rain model will overestimate the attenuation. At low point rain
rates, higher rain rates are more likely at some distance from the samp
ling location. So in that case the uniform rain model wil! underestimate
the attenuation. Furthermore it can be seen from Fig. 2.8b that the XPD,

120
100
80
~
~ 60
0 ..-1 .j.) «J ;:l ~ ())
40 .j.) .j.) «J
20
0 0
60
50
40
30 al '1:1
0 p.
20 x
10
0
Fig. 2.9
- 29 -
40
rain intensity, mm/hr
V i t i i t iii
40
(b)
80 attenuation, dB
iv
120
Attenuation as a function of rairr intensity (a)
and cross-polarisation discriminatien (XPD) as
a function of attenuation (b) for 30 GHz l.o.s.
path (Crane's rain model; <6aa> 8.5 degrees,
a6
= 43 degrees)·. a a
(i) Laws and Parsons
(ii) Marshall and Palmer
(iii) Joss et al. widespread
(iv} Joss et al. drizzle
(v) Joss et al. thunderstorm.

60
50
ll:l 'Ö 40
ei 0.. :><:
30
20
10 0
60
50
40 ll:l 'Ö
Cl 30 0.. :><:
20
10 0
Fig. 2.10
- 30 -
(a)
40 80
attenuation, dB
(b)
40 80
attenuation, dB
120
<8 > 8. ca
120
Cross-polarisation discriminatien (XPD) as a
function of attenuation for 30 GHz l.o.s. path
(Crane's rain model; Laws and Parsons dropsize
distribution)
a. a8
= 43 degrees; ca
b. <Bca> = 8.5 degrees;
is a parameter
is a parameter.

- 31 -
taken as a function of attenuation, is not much different for bath models.
The results shown in Fig. 2.8 are for a Laws and Parsons dropsize dist~i
bution. The influence of various dropsize distributions is shown in Fig.
2.9. In this case, too, the attenuation (as a function of rain intensity)
is more sensitive to a variatien in dropsize distribution than the curves
giving XPD versus attenuation. The latter curves, however, are extremely
sensitive to variations in canting angle distribution as shown in Fig.
2.10. Unfortunatel~no relation between mean value and standard devi
ation of the canting angle distribution is known from the literature.
Thus our measured XPD versus attenuation curves may actually fit more
than one theoretical curve.
To estimate the signal distartion due to amplitude and phase varlation
over a given bandwidth, Eqs. 2.28 2.30 can be used. Unfortunately, the
complex forward scattering functions II are available for only a
limited number of frequencies,viz. 4, 11, 18.1 and 30 GHz [32]. There
fore, we must assume them to be constant within the frequency band of
4
"' 'ti
ç:: Q)
'ti 0 2 ;::l . ..; .jJ .jJ . ..; r()
..... ._.;
~ ;.., ro !> ((l 0
0
Fi'g. 2. 11
i 40
ii
20
0 40 80 120
attenuation, dB
Rain-induced signal varlation over a 500 MHz
bandwidth around 30 GHz (computed for the 30 GHz
l.o.s. path), as a function of excess attenuation
(i) amplitude varlation
(ii) phase variation.
ç:: 0
._.; .jJ r() . ..; ;.., <ti !>
Q) (fl <ti -a
interest. Fig. 2.11 shows amplitude and phase varlation over a 500 MHz
bandwidth around 30 GHz, as a function of attenuation. It appears that
both amplitude and phase varlation are generally small for rain fading
up to 60 dB (the dynamic range of our measuring system}.
(fl Q) Q) ;.., til Q)
'ti

- 32 -
2.4.3. Rain-induced scintillations
During rain, the electromagnetic field at the receiver will be composed
not only of the coherently scattered field but also of incoherently
scattered field components. Here the coherently scattered part is the
short-term average field observed at the receiver, while the incoherent
component causes the fluctuations around this average [33]. The coherent
component was dealt with in the preceding section. In this section the
incoherent component will be investigated.
Capsoni et al. [33] derived expressions for the magnitude of the expected
amplitude and phase scintillation. In their single-scattering theory the
incoming radiation from each elementary volume of the rain medium is con
sidered to be uncorrelated with respect to the radiation coming from any
other volume, and consequently the individual powers of the various con
tributions are added. The variances of amplitude and phase scintillations
are then obtained from the in-phase and quadrature components of the total
received signa! as
4n L L [Re{S(a.)}]2 nR(a~) "2 GTöJ . . 1- " v a t-•
(2.39)
4n L \ [Im{S(a.)}] 2 nR(a.) 82 G}OJ ~ 1- 1-
(2.40)
with S(ai) the complex forward scattering function of a raindrop with
radius ai as tabulated in [32].
Fig. 2.12 shows the results of computations basedon Eqs. 2.39- 2.40
for our 30 GHz l.o.s. path, assuming a Laws and Parsons dropsize dis
tribution. It is seen that the total rain-induced scintillation noise
is generally small compared to the scintillation noise introduced by
tropospheric turbulence. The importance for telecommunications and re
mote sensing, however, does not only depend on the varianee of the sein
tillation noise but also on its speetral distribution. To compute this
speetral distribution· a model can be used similar to the one adopted in
mobile communication to determine the rece~ved power by a moving vehicle
in an urban environment [34]. The difference between these contigura
tions is that in our case the scatterers (raindrops) are moving and the
terminals are fixed, while in case of mobile communication the scatter
ers (buildings, trees, etc.) are fixed and the terminals are moving. The

0
Fig. 2.12
33 -
1.2
0.8
0.4
40 80 120
rain intensity, mm/hr
Rain-indueed scintillation as a tunetion of
rain intensity for the 30 GHz l.o.s. path
(i) the varianee of the amplitude seintillation
(ii) the standard deviation of the phase
seintillation.
model used is shown in Fig. 2.13.
Ul <!) <J) ~ tJ> cv
'Ö
-0-<J
0
Let us denote by p(O)dO the fraction of the total ineoming power within
dO of the angle e, and assume that the reeeiving antenna has a power gain
pattern Ga(O) with the maximum gain in the 0 0 direction. The differ-
ential variatien of the reeeived power with angle is then G (0)p(O)d0; . a we equate this to the differential variatien of received power with
frequeney by noting that the relation between frequency and angle is
Fig. 2.13
x
moving scatterer
z
y
Model used by Jakes [32]. The reeeiving antenna,
located in the origin, points along the z-axis.

- 34
given by:
f(8) = X sin8 + (2. 41)
with:
the carrier frequency of the transmitted signal
V velocity of the moving scatterer.
The first term at the r.h.s. of Eq. 2.41 represents the Doppler shift
introduced by the moving scatterer. The differential variatien of power
with frequency may be expressed as
The relation between df and d8 is obtained from Eq. 2.41 as
df V À cos8 d8
Thus Eq. 2.42 yields
(f)
= 0 for
p{8)G (8) a
>.!::. À
for lf-fcl <.!::. - À
(2.42)
(2.43)
(2.44)
The simplest assumption for the distribution of incoherent power p(8)
with arrival angle 8 is a uniform distribution
p(8) 1 2'IT
for -'fT 8 < 1T
Purthermere a eosine antenna pattern is used, defined by (35]
for
elsewhere
Then Eq. 2.44 becomes
(2.45)
(2.46)

s n
0
- 35 -
for
using Eq. 2.41 we can write case as
case ;--(f ---y---)2
\! 1 - c
v/lt
So Eq. 2.47 yields
s (f) n
2(n+1
0 for
1 2ïT
>.!::.. À
for
for I < V -À
(2.47)
(2.48)
(2.49)
This equation represEomts the contribution of scatterers (raindrops) in
the plane y = 0 and falling in the -x direction. In reality there are
also raindrops falling outside the plane y 0. To include their contri-
bution it is necessary to introduce in the xy-plane an angle ~' with
respect to the x-axis. Then Eq. 2.41 becomes
f(O,~) - ~ sinO cos~'+ - ), (2.50)
and Eq. 2.49 is extended to
ïTI2 ( ) 2(n+1 .r Ki' s f - ---."---'- .
n • 0 v) d~' (2.51)
with
[ 7 { f' } 2 ( n-1 J I 2 { , } 1 1 v " - (v/ltJcos~' ] I (vllt)cos~ for f <À cos ~ 1
K(f,v) (2.52)
0 for lf] > Ï cos~'
Until now it was assumed that all scatterers are identical. As seen
earlier we are, in practice, dealing with drops of different dimensions
with different complex forward scattering functions and fall velocities.

N 0::
' co 'Ö
.:::::. ti)~
Fig. 2.14
- 36 -
0
-10
-20
- _)lii
-30 -.__ viii \ ·,
-40
\ ~(a)
-50 'i'''
10°
Computed spectra for rain-induced amplitude
scintillation (a) and phase scintillation (b)
for various uniform rain-intensities R along
the 30 GHz l.o.s. path. (Reflector diameter
of the receiving antenna 0.5 m + n • 8510).
(i) R -= 150 mm/hr (vi) R= 5 mm/hr
(ii) R = 100 mm/hr (vii) R = 2.5 mm/hr
(iii) R= SO mm/hr (viii) R 1. 25 mm/hr
(iv) R= 25 mm/hr (i x) R 0.25 mm/hr.
(v) R = 12.5 mm/hr

N :rl ...... § ' ~
\J.l~
N :rl ......
N ~
10 Gl
~ OI Gl 'tl ~
' -e-\J.l<J
Fig. 2.15
- 37 -
Q
-10
-20
-30
-40
-50
101
10°
-10
-10
-10
10-
(b) -10
10° 101 10
2
f, Hz
Computed spectra for rain-induced amplitude seintil
lation (a) and phase scintillation (b) at a uniform
rain intensity R 150 mm/hr over the 30 GHz l.o.s.
path for various receiving antenna reflector dia
meters D.
(i) D
(ii) D
(iiil D
0.25 m, (n • 2127).
0.5 m, (n • 8510).
1 m, (n • 34043).

Fig. 2.16
- 38 -
f, Hz
Computed spectra for rain-induced amplitude seintil
lation (a) and phase scintillation (b} for various
uniform rain intensities, if all the raindrops are
moving with 20 m/s in an horizontal direction trans
verse to the 30 GHz l.o.s. path. (Reflector diameter
of the receiving antenna 0.5 m}.
(i) Fl = 150 mm/hr (vi) Fl 5 mm/hr
(ii) R 100 mm/hr (vii) Fl 2.5 mm/hr
(iii)R 50 mm/hr (viii} R 1.25 mm/hr
(ivl R 25 mm/hr (ix} R 0.25 mm/hr
(v) R 12.5 mm/hr

- 39 -
For a given rain intensity and type of raindrop size distribution the
actual raindrop size distribution is known, and Eq. 2.51 can be written
as
S (f) _ 2(n+l n
(2.53)
The amplitude and phase spectra are obtained by taking the in-phase and
quadrature components of the total received signal, as demonstrated for
the scintillation variances by Capsoni et al. [33]. In order to campare
these spectra with those obtained for turbulence-induced tropospheric
scintillation (see Section 2.3), these spectra are shifted in frequency
to baseband by setting f: f - f0
• The amplitude and phase scintillation
spectra are then found to be given by
'lf/2 S (f) 2(n+l) J I [Re{S(a.)}] 2no(a.) K(f~ v(a.))d~' M/A - n2 O i t. n -z- -z-
(2.54)
n/2 I (2.55) 0
Fig. 2.14 shows the computed results for the 30 GHz l.o.s. path for
various rain intensities, using the Laws and Parsons dropsize distribution.
All computed spectra are shown relative to the speetral component at 1 Hz
for R 150 rnm/hr and D = 0.5 m. A normalisation of these spectra would
be possible, using the relation 2.39 or 2.40 which give the area under
the amplitude and phase scintillation spectrum, respectively. It appears
that, compared with turbulence-induced tropospheric-scintillation, the
rain-induced scintillation is distributed over a wider frequency band.
Furthermore, the slope of the spectrum at the higher frequencies is
steeper. Fig. 2.15 shows that the cut-off frequency of the spectra
strongly depends on the diameter D of the receiving antenna aperture.
Note that the results shown in these figures are valid if the wind velo
city is zero, i.e. when the Doppler shift is introduced purely by the
vertical movement of the raindrops (ranging from 2.1 to 9.1 m/s fordrop
diameters of 0.05 to 0.7 cm [25]).
Wind, however, will introduce a horizontal movement and thereby an
additional Doppler shift. Fig. 2.16 shows the spectra if all raindrops
are rnaving with 20 m/s in an horizontal direction (no fall). It appears

- 40 -
that the scîntillation is distributed over a larger frequency band,
while the varianee of the scintiliation remains the same. The same was
found for turbulence-induced scintillations (see Sectien 2.3).

- 41 -
3. INSTRUMENTATION OF EXPERIMENTS
3.1. Introduetion
The theory presented in the preceding chapter bas been experimentally
validated by coherent radio measurements at 30 GHz on an 8.2 km line
of-sight path between Eindhoven and Mierlo, and by satellite (OTS) link
measurements at 11.575 GHz. In this chapter, the former measuring system
and the weather station are briefly described. The processing of the
baseband signals from the 30 GHz measuring system and the method applied
for collecting the data are also treated. For a description of the OTS
receiving earth terminal see [36].
3.2.
Fig. 3.1 shows the block diagram of the measuring system. With this
system it is possible to determine the complex transmission parameters
of the radio propagation path. A 30 GHz c.w. signal is transmitted from
Mierlo to Eindhoven using a 0.5 m front-fed parabolle reflector antenna
with a scalar feed (this antenna is described in more detail in the
appendix).
Fig. 3.1. Block diagram of the 30 GHz measuring system.

- 42 -
The 30 GHz signal is received in Eindhoven using an identical antenna
and mixed with a 29.560 GHz signal from a voltage-controlled oscillator
(VCO) phase-locked to the incoming signal by means of a 50 MHz reference
source. Thus the amplitude of the downconverted signal available at
point (A) in Fig. 3.1 is a measure of the amplitude of the received
30 GHz radio signa!.
The 29.560 GHz signal is sent from Eindhoven back to Mierlo. The 440 MHz
PLL bandwidth is chosen sufficiently wide to assure that the retrans
mitted signal still contains the phase fluctuations of the received 30
GHz signal. In Mierlo, the received 29.560 GHz signa! is mixed with the
pure 30 GHz signa! souree to farm a 440 MHz reference, which is subse
quently transmitted to Eindhoven. Here, the received 440 MHz reference
is downconverted to 10 MHz in two stages using the 50 MHz reference
source. The phase between the two 10-MHz signals at point (A) and (B}
is measured by means of a vector voltmeter and is divided by two to ob
tain the phase fluctuations of the 30 GHz radio signa!. The amplitude of
the 440 MHz reference (which is proportional to the amplitude of the
29.560 GHz signa! as received in Mierlo) is measured using a 10 MHz PLL
receiver.
The principle of phase measurement adopted here has been described in
more detail by Thompson and Vetter [37]. In order to include larger long
term phase fluctuations the range of the vector voltmeter is extended
electronically from 360 degrees to 11520 degrees.
All transmitted signals are vertically polarised. In Eindhoven the re
ceived horizontal (cross-polar) component of the 30 GHz signal is iso
lated from the vertical (co-polar) component by means of an orthomode
coupler (OMC). The amplitude of the co-polar component (at point (A)J
and the cross-polar component (at point (C)), and the phase between
these two components, are measured by means of a 10 MHZ PLL system
basedon the principle described in [38].
To allow phase-difference measurements between two horizontally sepa
rated receiving antennas, the 30 GHz cross-polar signa! can be replaced
by the signal received by an additional antenna, using an electronically
controlled, mechanical microwave switch. Alternatively, it is also
possible to replace the 30 GHz-cross-polar signal by a signal from a
small horn placed below the receiving antenna in order to measure the
angle-of-arrival in the vertical plane.

43 -
Summarising, there is a total of five baseband signals possible with the
30 GHz measuring system, namely:
- the amplitude of the co-polar signal (point (A); linearand logarithmic
output)
- the phase of the co-polar signal (between point (A) and (B))
the amplitude of the cross-polar signal (point (C); logarithmic output)
- the phase between co- and cross-polar signal components.or, alterna
tively, the phase difference between signals received by two separate
30 GHz antennas (between point (A) and {C))
- the amplitude of the 440 MHz reference (point (B); linear output).
3.3.
The facilities of the University weather station are schematically shown
in Fig. j,2. This figure shows only the equipment used for evaluating
the experiments described in this thesis. Rain is measured with a cumu
lative raingauge [39] . A cup anemometer and a vane are used to measure
the wind speed and wind direction at 10 m above local ground. Tem~era
ture (T), water-vapour pressure (e) and atmospheric-pressure (p) sen
sors are located at 1.5 m above local ground. A second thermometer at
11.5 m is used to indicate tem9erature inversions. Additional temperature
Fig. 3.2. Block diagram of the local weather station.

44 -
and water-vapour pressure sensors are located at 9, 16.5 and 24.5 m
above local ground, to obtain crude information about the variatien
of refractivity with height.
All signals are recorded on a multi-channel strip chart recorder.
3.4. Baseband signal processing and data collectie~
The block diagram of the baseband signal processing and data colleetien
system is shown in Fig. 3.3. Most of the baseband signals are digitised
with a 8-bit A/D-convertor at a sampling rate of 2 Hz, using an M6800
microprocessor system. Sixth-order Chebyshev anti-aliasing filters wit~
a cut-off frequency of 0.75 Hz are adopted. Because of the relatively
small memory of the microprocessor system, the collected data is trans
mitted every 15 minutes to a NOVA 3/12 minicomputer system. A 12-bit A/D
convertor is used to digitise the signals from which spectra are needed.
Because of the rather high sample rate (40-50Hz per signal), the sampled
data is then fed directly to the NOVA minicomputer and saved on magnetic
tape. For these signals, sixth-order Chebyshev filters with 10 Hz cut
off frequency are used to avoid aliasing.
MULTI
PLEXEA
8·bit A/U M6800 CONVERTOR MICRO· f8
.. 2HtJ
CHANNEL
NOVA3/12
~~PUTER TAPE·UECK
Fig. 3.3 Bleek diagram of the baseband signal processing
and data colleetien system.

- 45 -
4. EXPERIMENTAL VERIFICATION OF THEORY
4.1. Introduetion
In Chapter 2 three theoretica! models for the radio communication chan
nel were introduced. These models were presented in order to predict
the radio channel behaviour from measured meteorological data during
three prevailing meteorological conditions in the troposphere, viz.
temperature inversions, turbulence and precipitation. In the present
chapter results of measurements on the 30 GHz experimental l.o.s. link
are presented to verify the theoretica! models.
In Sectien 4.2 the occurrence of multipath propagation will be compared
with the aceurenee of temperature inversions. Some multipath events are
discussed in detail. The long-term variations o.f the mean value of the
signals are analysed. The short-term signal fluctuations around this
mean value are studied by speetral analysis.
Section 4.3 describes the results of measurements during tropospheric
turbulence in the absence of multipath and precipitation. As in these
conditions the long-term signal variations are negligibly small, they
are not analysed. Also some results of amplitude scintillation measure
ments on the 11.575 GHz beacon of the Orbital Test Satellite (OTS) are
included in Sectien 4.3.
In Section 4.4 the measured results during precipitation are presented.
To aid comparison, this is done in a similar form as inSection 4.2 for
multipath propagation.
From these measurements it will be seen that the three typical meteo
rological conditions considered separately in Chapter 2 can occur si
multaneously. However, it wil! be possible to separate the effects of
these different meteorological phenomena, by supposing the tropospheric
processes to be linear, using long-termand short-termsignal analyses.
4.2. Large-scale refraction and reflection on the 30 GHz l.o.s. path
Temperature inversions are an important indication for the occurrence
of multipath propagation (see Sectien 2.2). They are detected at the
University's weather station by means of two vertically spaeed thermo-

- 46 -
meters, 1.5 and 11.5 m above local ground level, respectively {see
Section 3.3). Temperature inversions were detected for all observed
multipath propagation events.
Fig. 4.1 shows the temperature inversions recorded in the peried 1
February 1981 until 1 February 1982. Inversions occurred most frequently
during the menths August and September 1981 and January 1982. The large
number of inversiens in January 1982 is not representative for this
month. This is mainly caused by the many hours of sunshine namely 81
{49 is the average for this month).
Note that the number of minutes indicated in Fig. 4.1 during which a
given temperature difference was exceeded, only qualitively suggests
the occurrence of multipath; a given temperature difference may cerres
pond to widely different temperature gradients and signal variations. A
certain temperature difference over a small distance will obviously give
rise te larger signal variations than the same temperature difference
over a larger distance, even though in both situations the measured
temperature difference over 10 m can be the same.
Multipath conditions can also be detected by camparing the measured phase
variatien of the received co-polar signal with the phase variatien com
puted from the water-vapour pressure e, temperature T and atmospheric
pressure p (as measured at the University's weather station} using Eq. 5
of the paper reprinted in Section 4.3.4. When the shape of the refrac
tive-index profile does not change as a function of time, then the phase
variatien of the 30 GHz signal, as determined by the refractive index
n at 60 m, sheuld equal the phase variatien computed from e, T and p at
1.5 m. This ceases to be true if this shape suddenly changes, as in
case of an inversion. An example is shown in Fig. 4.2.(The noisy appear
ance of the computed curve (ii} is caused by the aggregation of quanti
satien noise from the e, p and T signals.) The small long-term differ
ences between both curves (Fig. 4.2a} can be explained by a long-term
(large scale) variatien of k. Camparing the two curves, it is seen that
during the night of 14-15 August 1982 their shapes become different.
Fig. 4.2b shows the temperature difference between the two vertically
spaeed thermometers; as expected a temperature inversion is detected
during the night of 14-15 August 1982. (An occasional negative tempera
ture gradient appearing during the day, as seen in Fig. 4.2b is caused
by the fact that the lower thermometer was illuminated by the sun while

>:: ·.-I :>
.-1 QJ
.!<:
s IJ")
8
s U)
..... ..... 8
- 47 -
5 l - -2 1
4 ~ -
11 -1 86 22 2 57
8 1 27 52 358 143 213 19 297 3
2 146 12E 224 21 211 189 329 908 151 760
43 35 486 44 384 155 1010 2834 578 1552 41 763 2
423 131 1079 115 1155
.,~M"' 1094 2270 78 ~706
1420 518 1986 251 1996 3157 893 1785 3111 1256 5866
~415 1150 2686 470 2761 5343 6907 558 2585 4253 247 ~252
1981 F A M J J A s 0 N D J 1982
Fig. 4.1 : Temperature inversions recorded in the period 1 February
1981 until 1 February 1982
~ *: number of minutes that a given temperature
difference between two vertically spaeed
thermometers (1.5 mand 11.5 m above local
ground) was exceeded.
the upper thermometer appeared to be in the shadow of the University's
8 m Gregorian antenna).
The virtue of tracking the temperature difference with time (as in Fig.
4.2b}, is that more quantitative evidence of the importance of a certain
measured temperature difference for multipath propagation becomes avail
able in some cases. This can be understood as follows: assuming a "frozen"
temperature profile to move upwards (or downwardsl with a constant velo
city, rapid variations of the temperature difference measured with the
two spaeed sensors are likely to be associated with large temperature
gradients, resulting in relatively large signal fluctuations.
The largest recorded signal fluctuations during any multipath event were
+3.5 dB and -6.7 dB. Fig. 4.3 shows the co-polar signal recorded during

>:: .... >
.-I (!! ~
e ll"l
E-,
s ll"l
E-,
- 48 -
12000 degrees
(a)
2
~~ I \ ÎM 0
tl\ r ~~~ , -1 I I
i' -2
~ -3 (b)
13/8/82 14/8/82 15/8/82
time, days
Fig. 4.2: neteetion of multipath conditions
a. Measured phase variation of 30,GHz co-polar signal
(i) and phase variation of 30 GHz co-polar signal
computed from measured w~ter-vapour pressure e,
temperature Tand atmospheric pressure p (ii}.
b. Temperature difference between two 10 m spaeed
thermometers T(ll.S m) - T(1.5 m).

- 49 -
the night of 16-17 September 1982 (Fig. 4.3a}, and the corresponding
measured temperature difference (Fig. 4.3b}. It is seen that a relatively
large inversion, of almest 4 kelvin over 10 m, caused signal fluctuations
between +2.5 and -6 dB.
The part of the record with the most intense multipath propagation has
been analysed in detail and is shown in Fig. 4.4a. Figs. 4.4b and 4.4c
show the corresponding XPD as function of time, and the scatter diagram
of XPD versus co-polar signal strength, respectively. It is seen that
the discriminatien of the cross-polar signal is always better than 38
dB. The XPD values greater than approximately 47 dB (which is the in
herent decoupling of the measuring system) are believed to be due to
accidental cancellati.nn of the system cross-polarisation by the one in
troduced by the multipath propagation phenomena.
Fig. 4.5 shows the rate of change of the co-polar signal in dB/sec as a
function of time, fora sample period of 2 and 5 seconds (Fig. 4.5a}, to
gether with the corresponding cumulative distributions (Fig. 4.5b} and
scatter diagrams (Fig. 4.5c). The influence of quantiaation noise on the
computed rate of change is reduced as much as possible by software fil
tering of the co-polar amplitude data with a filter characteristic similar
to that of the hardware anti-aliasing filter adopted befare sampling (see
Sectien 3.4). It appears that the rate of change depends strongly on the
sample period but that it does not exceed 0.5 dB/sec. The largest rate of
change of the co-polar signal observed during the entire measuring period
is 0.66 dB/sec. The amplitude difference measured between two tones spa
eed 440 MHz apart (30 GHz co-polar amplitude in dB, less amplitud~ of the
440 MHz phase reference signal in dB) is shown in Fig. 4.6 for the same
event. This dispersion is rather small as indeed expected from the theory
presented in Section 2.2.3. Note that it is assumed that any fluctuations
of the 440 MHz signal itself can be neglected. Therefore the difference
presented in Fig. 4.6 also includes any signal fluctuations of this kind.
Using the theory from Section 2.2 it is easy to see that by moving up a
layer, representing a certain discontinuity in N, the amplitude of the
30 GHz signal will vary roughly 30000/440 times faster than the amplitude
of a 440 MHz signal; whether the variatien of the 440 MHz signal itself
may be neglected depends therefore on the record length. The measured
amplitude differences confirm that we are dealing with multipath propa
gation (and not with divergence or converganee of a single pencil of
rays; see Section 4.2.3).

~ <.-I
<tl §.
..-! (ll .. «J
..-! 0 p. I 0 u q) :> ·ri ..., <tl rl $ i-;
>:: ·ri :> ..-! (i)
.><:
e U1
!3-.
ê U1 ... .... !3-.
50 -
2
0
-2
-4
-6 (al 16/9/82 82
4
3 ;
2 I I
? r l 1
/ 0 (b)
\!
Fig. 4. 3
16/9/82 17/9/82
16 20 24 4
time, hours GMT
Multipath event on 16-17 September 1982.
a. co-polar signal
b. temperature difference between two 10 m
spaeed thermometers T(11.5 m) - (1.5 m).

@ 2
-.-i
~ 0 b">
·.-! UJ
H 1\l C! -2 0. I 0 ()
(IJ -4 :>
·..! +.l m .-i
~ -6
GO
70
60
CQ 'Ö
.. 50 0 p. :><
40
30
- 51
(a) 16/9/82
I
.~~ (b)
16/9/82
19.40 20.00 20.20 20.40
time, hours GMT
Fig. 4.4 : Multipath event on 16 September 1982
a. co-polar signal
b. cross-polarisation discriminatien (XPD).

H ((j
.--1 0 0. I 0 u (!)
:5 4-1 0
~ u (I)
c {I) <ó ' .<:: I§ u
4-1 0 .--1
<ó (I) c +J 0> ((j ·rl H {I)
- 52 -
80
70
60 I§
Q il< 50 >::
40
16/9/82 (c)
30 2 0 -2 -4 -6
relative co-polar signa!, dB
Fig. 4.4 Multipath event on 16 September 1982
(cont.} c. scatter diagram of XPD versusco-polar signa!.
0.3
-0.3
0.3
-0.3
19.40
Fig. 4.5
At 5 sec.
(a)
20.00 20.20 20.40
time, hours GMT
Rate of change of the co-polar signa! for multipath
event in Fig. 4.4
a. rate of change in dB/Sec using sample periods
(6t) of 2 and 5 seconds.

1.0
0.8
s:: 0 ..... .j..l ~ 0.6
..Q ..... 1-l .j..l lil ·rl '0 0.4 Q) !> .,.j .j..l (fj
.--1 0.2 ~ El ~ ()
0
).< 0.4 (fj .--1 0 0. I 0 0.2 u Q)
:5 ~ 0 0
Q) 0 bl<li s:: lil nl'-. .<::lil -0.2 U'O ~ 0.--1
nl (!) s:: .j..l "' -0.4 nl...! 1-l lil
Fig. 4. 5
(cont.)
- 53 -
' --~~~:::->
I I
sec._,.".-1. ·"-At At = 5 = 2 sec.
l
l -1
(b) ~·: .. -- 16/9/82
-0.4 -0.2 0 0.2 0.4
rate of change of co-polar signa!, dB/sec
At = 2 sec.
16/9/82 (cl
2 0 -2 -.4 -6
relative co-polar signa!, dB
Rate of change of the co-polar signal for multipath
event in Fig. 4.4.
b. cumulative distribution of the rate of change,
ót = 2 and 5 seconds
c. scatter diagram of rate of change versus co-polar
signal for /:,t 2 seconds.

'"' 0.4 (fj ..... 0 0.. I 0 u 0.2 (IJ
iJ 4-1 0 0 (!) u O><lJ r:: Ul (Ij'
tl~ -0.2 4-1 0.-i
(fj <lJ r:: +J 0> -0.4 (Ij . ...;
'"' Ul
Fig. 4.5
(cont.)
1.6
~ 0.8
(!) 0 c: <lJ 0 '"' <lJ
4-1 4-1 . ...; 'Ó
(!) -0.8
'Ó ::;l +J . ...; .....
-1.6 ~ <tl
- 54
5 sec.
16/9/82 (d)
2 0 -2 -4 -6
relative co-polar signal, dB
Rate of change of the co-polar signal for multipath
event in Fig. 4.4.
d. scatter diagram of rate of change versus co-polar
signal for !J,t 5 seconds.
t ' ~~ ~r' 16/9/82
19.40 20.00 20.20 20.40
Fig. 4.6
time, hours GMT
Amplitude difference measured between two tones
spaeed 440 MHz apart (30 GHz co-polar amplitude
in dB, less amplitude of 440 MHz phase reference
signal in dB) for multipath event in Fig. 4.4.

- 55 -
For an analysis of the short-term fluctuations of the co-polar signal,
power density spectra are computed from both amplitude and phase using
the data records in the two time periods (i) and (ii) indicated in Fig.
4.4a. To avoid problems with the quantisation noise for the small, ra
pidly varying component (BPF-signal) of the linear co-polar signal, this
component is first separated from the large~ slowly varying component
(LPF-signal) using the circuit shown in Fig. 4.7. The ratio of the
selected amplification of the BPF-signal and that of the LPF-signal is
64.5, so the quantisation noise for the relatively small BPF-signal is
reduced by 36.2 dB. The power density spectra of the LPF- and BPF-signals
are computed by spectrum averaging, as described inSection 4.3.1. For
the computation of an individual spectrum belonging to a particular
record part, the LPF- and BPF-signals are divided by the mean value A
of the LPF-signal during that part of the record. The power density
spectrum of the amplitude scintillation ~/A is obtained by adding the
amplitude of the frequency components of the LPF- and BPF-spectra. Befare
this is done the frequency components of the LPF-spectrum representing
quantisation noise are set to zero.
The power density spectra computed in this way are shown in Fig. 4.8.
Cernparing these amplitude scintillation spectra with those presented in
Section 4.3.1 for tropospheric turbulence it is seen that the low fre
quency components are larger; the spectra do nat exhibit a flat part at
the low frequency side any longer. This is reflecting the fact that
during multipath the mean value of the signal also varies. The slopes
of the spectra for higher frequencies differ only slightly from those
found for tropospheric turbulence in Sectien 4.3.1. So it is believed
that these higher frequency components are not caused by the multipath
propagation phenomena but by the simultaneous presence of weak tropo
spheric turbulence. This necessitates consideration of both phenomena,
which can only be separated by reference to both longer-term temporal
analyses (Figs. 4.3-6) and short-ter~ speetral analyses (Fig. 4.8).
In the early morning of 16 September 1982, the most intense multipath
event was recorded. Fig. 4.9 shows the co-polar signal and the spectra
of two selected record parts. Cernparing these spectra with those ana
lysed for the multipath event during the night of 16-17 September 1982
(Fig. 4.8) it is seen that the high-frequency components are now much
smaller. This can be explained by an absence of tropÓspheric turbulence.
The statement that tropospheric turbulence was generally small during

- 56 -
a LPF-signal
Hz
linear co-polar signal
----1
Fig. 4.7
-20
N lil '- -40 .!f}
0'> -60 0
.-I
0 N
10- 1
Fig. 4.8
BPF-signal
filter =10 Hz
Circuit for seperating the LPF- and BPF-signals
a. 6th-order Bessel-filter with 0.2 Hz cut-off frequency
b. all-pass filter with the same phase characteristic as the
Bessel filter (a)
c. 6th order Bessel-filter with 10 Hz cut-off frequency (anti
aliasing filter)
" " " (a)
10°
f• Hz
(b)
10°
f, Hz
Power density spectra for two selected periods of multipath event
in Fig. 4.4
a. amplitude scintillation spectrum for record (i)
b. amplitude scintillation spectrum for record (ii)
--- measured spectrum
slope of the spectrum for scintillation caused by
tropospheric turbulence (see Section 4.3.1).

N lil
' N
Ul (!) <ll 14 0> Q)
~
N
-e-<l
10°
10-4
10-l
Fig. 4.8
(cont.)
4
Ol 'Ö
2 ' .....
lil .:: 0>
·.-1 0 Ul
14 !1:1 ..... 0 -2 p, I 0 0
Q! -4 :> ·.-I +' lil ..... (!) -6 14
Fig. 4.9
(c)
f, Hz
- 57
1 -1 10 10
(dl
f, Hz
Power density spectra for two selected periods of
multipath event in Fig. 4.4.
c. phase scintillation spectrum for record (i)
d. phase scintillation spectrum for record (ii)
--- measured spectrum
slope of the spectrum for scintillation
caused by tropospheric turbulence (see
Section 4.3.1).
I I I
l~v1ft\ . :~ ! I t l
\IJ V t11 I IP\1\ ~ I ~ \ i) I I I I I \I I
.I ~I \ I I '\ • i
I I 1j i
(a) 16/9/82
7.20 7.40 8.00
time, hours GMT
Multipath event on 16 September 1982.
a. co-polar signal

"' ::Il
' N
Ul (!) (!) 1-1 Öl
~
N
-e-<l
Öl 0 .-I
0
-30
-50
N -70
10°
10-2
10-4
10-l
Fig. 4.9
(cant.)
(b)
(d)
100
f, Hz
- 58 -
(e)
10°
f, Hz
Multipath event on 16 September 1982.
b. amplitude scintillation spectrum for record (i)
c. amplitude scintillation spectrum for record (ii)
d. phase scintillation spectrum for record (i)
e. phase scintillation spectrum for record (ii)
theevent 16-17 September 1982 and completely absent in the early
morning of 16 September 1982 is confirmed by registrations of wind
velocity giving an average value of 1 and 0 m/sec, respectively.

- 59 -
Ta obtain some indication about the angle-of-arrival variatien at the
receiver, a small horn is positioned 88 cm below the receiving para
beleid. A rough estimate of the angle-of-arrival can then be deduced
from the measured phase between horn and paraboloid.
Fig. 4.10 shows the linear co-polar signaland the corresponding angle
of-arrival for the multipath event on 27 October 1982 (the angle-of
arrival cannot be shown for theevents analysed in Sectien 4.2.1, be
cause it is impossible to measure angle-of-arrival and cross-polar
component simultaneously; see Sectien 3.2). The observed angle-of-arri
val variatien of 0.08° tagether with the known radiation patterns of the
antennas used (83
dB ~ 1.46°; see the appendix) cannot explain the observed
amplitude variatien of 3.6 dB. This, tagether with the observed in-band
distartion indicates that we are most likely dealing with multipath pro
pagation and not with ray bending(k-factor fading; see Sectien 2.2.2).
200
~ 0 ~ ~ ill ~ ~ 0 u
150 0
' ~ ~ ~ ~ ~ ~ 0
100
Fig. 4.10
degrees (ii}
27/10/1982
20.00 22.00 time, hours GMT
Linear co-polar signal (i) and simultaneously measured
angle-of-arrival (ii) for multipath event on 27 October 1982.
The ray tracing program described in Sectien 2.2.4 can be used to predict
the co-polar amplitude fluctuations from refractivity measured at differ-
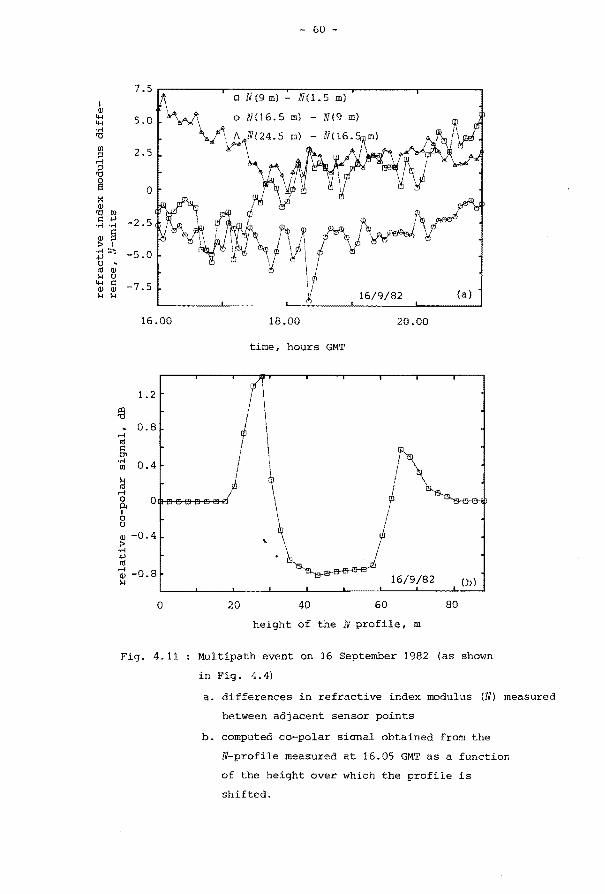
I (!)
4-1 4-1 ·.-! 'Ö
{fJ
::l ..-! ::l
'Ö
~ x (!)
'Ö {fJ s:: ..., .,.; .,.;
~ § I
:o~ Q
"' (!) 14 Q
4-1 s:: (!) (!) 14 ,...
7.5
5.0
2.5
0
-2.5
-5.0
-7.5
16.00
1.2
~ 0.8
..-!
"' s:: I:J\ .,.;
0.4 {fJ
~ ..-!
t Q
(!) -0.4 !> ·.-! ..., ({j
~ -0.8 ,...
0
Fig. 4.11
- 60 -
o N (9 m) N(1.5 m)
m) - N(9 m)
16/9/82 (a)
18.00 20.00
time, hours GMT
I
I I \ I
~ \ I
\ 16/9/82 (b)
20 40 60 80
height of the N profile, m
Multipath event on 16 September 1982 (as shown
in Fig. 4.4)
a. differences in refractive index modulus (N) measured
between adjacent sensor points
b. computed co-polar sianal obtained from the
N-profile measured at 16.05 GMT as a function
of the height over which the profile is
shifted.

- 61
ent heights. This, however, requires a sufficiently detailed profile of
the refractive index variations. The refractive index modulus N is cal
culated from the atmospheric pressure p,temperature Tand water-vapeur
pressure e measured at 1.5, 9, 16.5 and 24.5 m above local ground (see
Sectien 3.3) using Eq. 5 of the paper reprinted in Section 4.3.4.
As an example the multipath eventof 16-17 September 1982, discussed in
Sectien 4.2.1, has been analysed. Fig. 4.11a shows the differences in N
at two adjacent sensor points as a function of time. The largest inver
sion (7 N-units over 8 m) occurred at 16.05 GMT and was detected by the
sensors at 16.5 and 24.5 m.
Because there are no sensor points above 24.5 m, the coarse profile
measured at 16.05 GMT is shifted upwards to the height of the propaga
tion path. The received co-pclar signal is then computed as a function of
the height of this hypothetical profile, usingthe ray tracing program,
and shown in Fig. 4.11b.
The computed co-polar fluctuations (-0.8 dB up to +1.4 dB) are exclusively
due to divergence and convergence of one pencil of rays; no secend pencil
of rays is found. The measured co-polar fluctuations were much larger (-6dB
up to 2.5 dB; see Fig. 4.4a); moreover multipath propagation was also in
dicated by the occurrence of amplitude distortien (see Fig. 4.6).
This discrepancy is due to the fact that the number of sensors is too
small (4) and consequently the sensor spacing too large (7.5 - 8 m)
resulting in a poor representation of the actual refractive index profile.
The computed convergence and divergence are partly due to the abrupt
change of the N gradient caused by linear interpolation in obtaining the
refractive index profile.
4.3. Scintillation
Most of the results of the scintillation experiment have already been
published. For easy reference, four papers are included at the end of
this Sectien (4.3.1-4.3.4) and are only briefly surveyed here. In the
first paper entitled "Amplitude and phase scintillation measurements on
8.2 km line-of-sight path at 30 GHz" [40], results are summarised of
scintillation measurements made in the absence of precipitation and
multipath. It is demonstrated that both the slopes of the scintillation
spectra and their probability density functions agree with expectations
basedon the weak-scattering theory described in Sectien 2.3.

62 -
Results of amplitude scintillation measurements using a satellite c.w.
beacon at 11.575 GHz are described in the secoud paper entitled "Ampli
tude scintillations on the OTS-TM/TM beacon" [41]. In this paper it is
shown how small, slow variations of the mean amplitude occurring during
one uata record (ca. 30 minutes) can disturb the probability density
function of the amplitude scintillation. Further the averaging effect
of the receiving antenna aperture, described in Sectien 2.3.2., is de
monstrated by oomparing the results ox this experiment, using a large
8 m Gregorian antenna, with those at 30 GHz, using the small (0.5 m)
parabcleid reflector described in the appendix.
In the third paper "A comparison of radio-wave and in-situ observations
of tropospheric turbulence and wind velocity" [42], a theory is pre
sented to derive the refractive-index structure parameter (C2J and wind n
velocity (V) from radio-wave scintillation and in-situ measurements of
temperature, humidity, wind speed and wind direction. It is demonstrated
tha~ the wind veloeities determined from amplitude scintillation spectra
agree rather well with in-situ measured wind speed and wind direction. The
values of c2 derived from in-situ measurements appear to be a factor 3 n
too small as compared with those determined from amplitude scintillations
measured at 30 GHz. This factor 3 may indicate that the adopted free
convection (-4/3) height sealing of ~ [43] does not apply to our mea-n
surements. This sealing is necessary because the height of the sensor
location is 10 m above local ground level (Fig. 3~2), whereas the mean
height of the propagation path is 60 m above local surface (Fig. 1.1).
Furthermore, it is demonstrated that at 30 GHz the contributions to C2 n
from the humidity structure parameter (C~) and the structure parameter
of temperature-humidity (CTQ) are dominant, while the contribution of 2
the temperature structure parameter (CT) may be neglected.
This difference of a factor 3 observed between the in-situ measured ~ n values and those derived from the amplitude scintillations at 30 GHz is
discussed in the paper entitled "Evaporation derived from optical and
radio wave scintillation" [44]. A calculation, presented in this paper,
of the evaporation from the observed radio wave scintillation appears
to yield good agreement with the evaparatien obtained from the net ra
diation measured at a meteorological station in Cabauw, which is located
70 km from Eindhoven.
63 -
Irukxing terru: Radio links, ScintiiiGtionmeasuremmts
The letter summarises rcsults of amplitude and pbase aciDtillation measurements at 30 GHz on an 8·2 km line-of-sipt patb in tbe Netberlands. The measured rcsults oompare favourably witb tbose obtained from weak-scattering tbeory.
Introduction: The transfer fundion of a radio link is inftuenced by meteorological parameters. Atmospheric turbulence can cause rapid amplitude and phase variations. 1 In addition to transit-time ftuctuations introduced by the propagation medium, Doppier shifts may be introduced by movement of the structures supporting the transmil and receive antennas. Phase ftuctuations are a limiting factor in carrier recovery circuits, e.g. in intercity digital radio communications2 and satellite systems for digital communications or navigation. With certain TDMA and COMA techniques, such phase ftuctuations might also cause bit slips or even misframing.
In order to verify theoretical models of the tropospheric transfer function, a measuring system bas been developed and built. Measurements of the complete transfer function at 30 GHz of an 8·2 km line-of-sight path between the Eindhoven University (receiver 44 m above local ground) and the Netherlands PTI tower in Mierlo (transmitter 77 m above local ground) are performed. One tbird of the path is across the city of Eindhoven. The principle of phue measure.ment adopted was first described by Thompson and Vetter.3 Tbis letter summarises the results of recent amplitude and pbase sc.intillation measurements in the absence of precipitation and multipath. The weak-scattering theóry described by van Weert, • wbich is based on the welt known theory by Lee and Harp, 5 is verified.
Measurements and data acquisition: From March 1981, more than 25 scintillation events, each with a minimum duration of 15 min, were recorded and analysed. Tbc strongest scintillations occur after rain showers on hot days. At night, the sein tillation is, in general, small. F or each event, the mean value (A) of the amplitude of the received signal is removed. Tbe remaining amplitude scintillation (AA) and phase seintillation (Al/>) signals are lowpass filtered, multiplexed and digitised using a 12-bit A/D convertor. To minimise quantisation .
* Reprinted from Electranies Letters, 1982, Vol. 18, pp. 287-289.

- 64
noise, these signals are first properly ampJified. The station- . arity of the signal is checked. Then the probability density function for AA/ A is computed and compared with the zeromeao Gaussian one defined by the varianee
:z .A. 1 ~ (AA1)1
O'(AA/A)- N- 1 i~l A (1)
where N is the number of samples. In order to determine the power density spectra of AA/ A
and Al/>, the record was divided in somewhat overlapping parts, 6 from which the mean value and linear trend are removed by means of a least-squares procedure. The power density spectrum of each part was computed by means of an FFT procedure using a eosine tapcring. Tbc power dcnsity spectrum of tbc complete record was obtaincd by avcraging all these individual spectra. 7 Thcn the probability density runction for Al/> is computed and compared with the zero-mean Gaussian one defined by the varianee
(2)
V erification of theory: Figs. 1 and 2 show the probability dcnsity functions and power dcnsity spectra of a typical seintiJlation cvent on 22nd September 1981 after a raio showcr. lt is seen from Figs. la-b that tbc amplitude and phase seintillation probability density functions follow tbc Gaussian distributión rather well, in agreement with most weak..scattering thcories. 1 Figs. 2a-b show tbc power dcnsity spectra and a1so include the speetral slopcs obtained from tbc thcory descrjbed in Rcference 4, applying von Kármán's represcntation of the Kolmogorov refractivc-indcx spectrum. 8 Input parameters for this theoretical model are tbc outer scalc ·of turbulcnce, L0 = 10 m, and tbc diameter of tbc rcceive antcnna apert ure, D = O·S m. Note that tbc experimcntal and theorctical slopes agree well. Tbc pcaks of tbc pbase sein tillation spectrum at 0.5 and 1 Hz are the eigenfrequcncies of tbc movements of the PIT tower and tbc University building, respcctively. These beoomes more pronounced during windy periods.
Conclusions: The measured results confirm the expectations basedon a weak..scattering theory. Doppier shifts due to mechanical oscillations of the buiJdings supporting the transmit and receive antcnnas are observed. Phase scintillations meas-

65 -
•
--::! 10 <(
~ 0.8
6
4 a
2
0 -0·12 -0·04 0 004 0·12
b.A/A
0·08
007
0·06
0{)5
;o<>t. a.
0{}3
0·02 b
0·01
0 -30
b. •• degrees
À&- I Probability density fimctions for seintillotion event on 22nd Sept· ember 1981
a Amplitude scintillation • measured values - Gaussian distribution (variance obtained from eqn. 1)
b Phase scintillation • measured values - Gaussian distribution (variance obtained from eqn. 2)
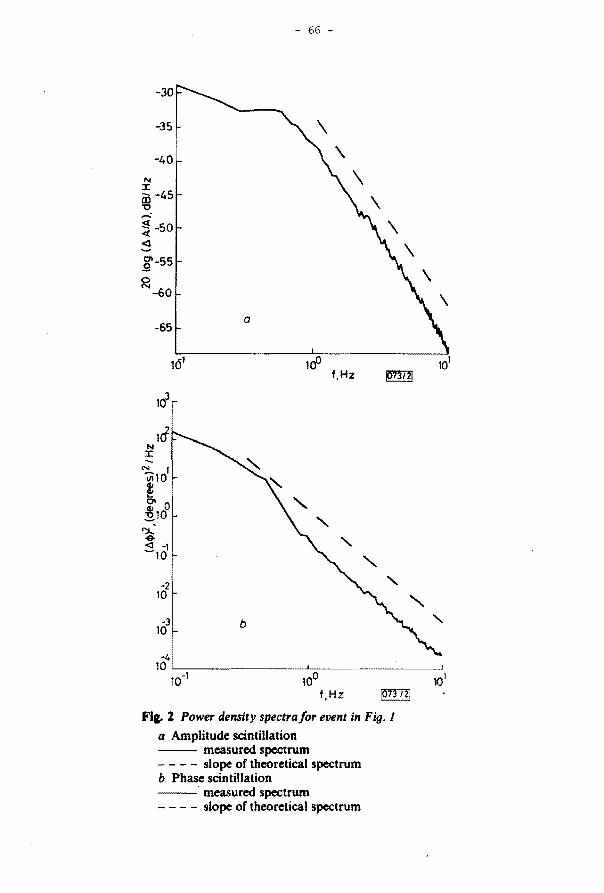
- 66 -
-35
-40
N :r: à5 -45 "'0 ~
~-50 <(
<l .._ 01 -55 .9
~-60
-65
1Cf
~ <l -1 ~10
-2 10
-3 10
-4
1ó1
a
f,Hz ~
b
10 '---:--------'--::--------__j 10-1 10°
f,Hz
Fi&- :Z Power density spectrafor eventin Fig. 1
a Amplitude scintillation -- measured spectrum - - - - slope of theoretica! spectrum b Phase scintillation --· measured spectrum
slope of theoretica! spectrum

67 -
ured in Eindboven are much smaller tban those reported by Vilar and Matthews for London at 36 GHz9 but agree well with those reported by Janes et al. for an overwater path between the islands of Maui and Hawaii at 34 GHz. 10 Amplitude and phase scintillations are also measured in the presence of multipath and raio and will be rcported later.
M. H. A. J. HERBEN
Eindhoven U niversity of Technology Department of Electrical Engineering T elecommunications Division PO Box 513,5600 MB Eindhoven, Netherlands
Refereaces
22nd December 1981
1 FANTE. R. L.: 'Eiectromagnetic beam propaption in turbulent media: an update', Proc. IEEE, 1980,68, pp. 1424-1443
2 DINN, N. F.: 'Digital radio: its time bas come', IEEE Commun. Mag., 1980,18, pp. 6-12
3 THOMPSON, M. c., and VEn:mt., M. J.: 'Sinpe patb pbase measuring system for tbree-centimeter radio waves', Rev. Sci. lnstrum.., 1958, 19, pp. 148-lSO
4 VAN WEERT, w. J. M.: 'Tbe inftuence offrequency and receiver aperture on tbe scintillation noise power'. Agard Conf. Proc. 159, 1975, paper 12
5 LEB, a.w., and HARP, 1. c.: 'Weak scattering in random media. witb applications to remote probing', Proc. IEEE, 1969, S?, pp. 375-406
'i OTNES, R. K., and ENOCHSON, L.: 'Applied time series analysis'. Vol. 1 (Jobn Wiley, 1978). pp. 343-345
1 BENDAT, J. S., and PIERSOL, A. G.: 'Random data: analysis and measurements procedures' (Jobn Wiley, 1971), pp. 327-329
8 TATARSKI, v. 1.: 'Wave propagaûon in a turbulent medium' (McGraw-Hill, 1961). p. 34
9 V1LAR, E., and MATTHEWS, P. A.: 'Summary of scintillaûon observations in a 36 GHz link across London'. lEE Conf. Publ. 169, Pt. 2, 1978,pp.36-40
10 IANI!S, H. B., 'I'HOMPSON, M. C., SMJTH, D., and IC.IRDATRI~ A. W.: 'Comparison of simultaneous line-of-sigbt sipals at 9·6 and 34·5 GHz', IEEE TrtiiU., 1970, AP-11, pp. 447-451

*
- 68 -
This letter summarises results of amplitude scintillation measurements using the OTS-TM/TM beacon at 11.575 GHz. The presented probability density function, cumulative distribution and power density spectrum justify the use of weak-scattering theory. The averaging effect of the 8 m receive-antenna aperture is demonstrated.
Amplitudenszintillation auf dem OTS-TM /TM-Träger
Diese Mitteilung faBt einige Resultate von Amplitudenszintillationsmessungen an dem 11 ,575-GHz-OTS-TM/TM Träger zusammen. Die Wahrscheinlichkeitsdichtefunktion, kumulierte Wahrscheinlichkeitsverteilung und das Leistungsdichtespektrum. die hier präsentiert werden, stimmen gut überein mit Ergebnissen auf der Basis der Theorie schwacher Streuungen. Der Mittelungseffekt der 8-m-Empfangsantennenapertur wird gezeigt.
1. Introduetion
Scintillation noise. caused by tropospheric turbulence. is important in order to determine the reliability limit of efficient radio communication systems in the absence of ra in and multipath [I]. Because of the multiplicative character of the scintillation noise. it is impossible to imprave the performance of the system by increasing the transruit power. In this. scintillation noise differs from the (additive) thermal noise on a radio link. There is a large number of papers dealing with theories describing the influence of tropospheric turbulence on radio wave propagation [2]. However, the number of experiments to verify these theories is still very limited. Therefore it is not yet possible to assess the characteristics of this type of fading with adequate reliability for telecommunications purposes [3].
This letter suinmarises the results of an experiment. set up at Eindhoven University. to determine the probability density function. the cumuialive distribution and the power density spectrum of amplitude scintillations on the OTS-TM/TM beacon at
Reprinted from AEO, 1983, Vol. 37, pp. 130-132.

- 69 -
11.575 GHz. The satellite is viewed at an elevation angle of 31 o. The measured results are compared with those obtained from weak-scattering theory [4], {5]. The averaging effect of the receive-antenna aperture is demonstraled by comparing the results of this experiment, using a large Gregorian antenna, with those obtained at 30 G Hz, using a small paraboloid reflector [6].
2. Measurements and Data Acquisition
A block diagram of the receiving earth terminal is given in [7]. The 1.5 m front-fed antenna described there, has been replaced by an 8 m Gregorian antenna.
The scintillation events are in the first instance, atter elimination of their mean value A, recorded on magnetic tape. Later the recorded scintillation component L1A is )ow-pass filtered and digitized using a 12-bit AID converter. A computer program has been written to check the stationarity and to determine the probability density function, the cumulalive distribution and the power density spectrum of the records. The computed probability density function and cumulative distribution are compared with those· derived from the zero-mean Gaussian distribution defined by the varianee
1 I N (L1A;) 2
0(,1AIA) ~N-I {;-, A (I)
with N the number of samples. To determine the power density spectrum each
record is divided in somewhat overlapping parts [8]. The length of these parts is determined by the lowest frequency component of interest, chosen to be 0.049 Hz. The power density spectrum of e&ch part is computed by means of an FFT procedure using a eosine tapering. The power density spectrum of the complete record is then obtained by averaging all these individual spectra [9].

- 70 -
3. Results
Fig. I shows the probability density function and cumulative distribution of a typical scintillation event on June 15. 1981 with a duration of 29.9 minutes. Also shown in this figure are the theoretica! curves of the Gaussian distribution with varianee given by eq. (I). Inspeetion of this figure shows that the amplitude scintillation probability density runction and cumulative distribution agree with the Gaussian distribution. This is confirmed by a Chisquare goodness-of-fit test between the experimental and theoretica! Gaussian distribution curves shown in Fig. I a, leading to acceptance of the hypothesis of normality at the 5 percent level of signi ficance (X 2 = 5.0 ~ A9. o.os) [9]. The discrepancy around the point AAl A= 0, which is more pronounced in the probability density function than in the cumulative distribution. may be explained by the smal! and slow variation of the mean value of the signa! during the 29.9 minute event caused by varying cloud attenuation. This was indicated by a stationarity test gi ving 37 runs for 133 record segments of equal length ( 13.5 seconds each) [9] and leading to rejection of the stationarity hypothesis at the 5 percent level of significance, meaning that the total assembly of data should be considered nonstationary.
However. because of the slow variation of the mean value, its influence will be reduced by dividing the total (29.9 minute) record in smaller parts, as required to compute the power density spectrum of the event. With the lowest frequency of interest chosen to be 0.049 Hz, the record is divided in 88 somewhat overlapping parts. It appears that 84 of the 88 record segments satisty the statwnarity check. Thus the remaining (short term) amplitude scintillation can be taken to be Gaussian distributed, in agreement with the expectations based on most weak scattering theories [2] and the most recent experimental analysis of Moulsley et al. [ l 0].
The power density spectrum of the 29.9 minute record, computed from the individual ~pectra of the

- 71 -
t 12
-0.08 0 0.08 0.16 JA/A-
Fig. I. Probability density function (a) and cumulative distri bution function (b) for sein tillation event on June 15, 1981; • measured values, Gaussian distri bution (variance obtained from eq. (I)).
88 record parts in the way mentioned above, is shown in Fig. 2. For low frequencies the spectrum is flat but for higher frequencies the spectrum drops very fast. Averaging over 88 speçtra results in a nor-

-32
dB/Hz
t
= N
-36
-44
--
W_ -48
0.06 0.1
- 72 -
"' I r'vl'v-
lv
\I\ \ \
I \\ i \ \ i l \lil \iiil I
I \t \I 0.2 0.4 0.6 2 Hz 4 ,_
Fig. 2. Amplitude scintillation power density spectrum for event in Fig. I;
measured spectrum; -(i) slope of theoretica! spectrum; diameter of antenna
aperture is 8 m, (LIAIA)2 ""'f-5.02,
--(i i) slope of theoretica! and measured spectrum obtained from [6], diameter of antenna aperture is 0.5 m, (LIAIA) 2 -f- 28~.
malized standard error for (AAl A)2 equal to 0.107, corresponding to a random error smaller than 0.5 dB for 20 log (AA/A) [9]. Consequently, the error in the slope of the spectrum is very smal!. As shown in Fig. 2 this slope agrees with that computed from the weak scattering theory described in [5], applying von Kármán 's representation of the Kolmogorov refractive-index spectrum [11]. The input parameters for this theoretica] model are the outer scale of turbulence (L0 = 10 m) and the diameter of the receive antenna aperture (D::;:: 8 m). Furthermore, an exponential deercase of the strength of turbulence with height is assumed [5].
Because the slope of the spectrum is frequency independent [ 12], we can compare the results of this experiment with those obtained at 30 GHz, using a 0.5 m front-fed parabolic reflector antenna [6]. The slope of the spectrum of the latter experiment is also drawn in Fig. 2. It is seen that the slope of the

- 73 -
spectrum from the experiment using the 8 m Gregorian antenna is steeper. This agrees with the larger averaging effect of the 8 m receive-antenna aperture (5].
4. Conclusions
The measurements presenled in this letter support the use of weak-scattering theory to describe amplitude scintillations of satellite signals for an elevation angle of 31 °. The measured amplitude scintillation is Gaussian distributed, while the slope of the power density spectrum depends on the dimensions of the receive-antenna apert ure.
(Received October 4th, 1982.)
Ir. Mathieu H. A. J. Herben Eind hoven Uni versity of Technology Department of Electrical Engineering, Telecommunications Division P.O. Box 513, NL-5600 MB Eindhoven
Keferences
[I] Crane, R. K., Fundamental limitations caused by RF propagation. Proc. IEEE 69 [ 1981], 196- 209.
[2] Fante, R. L, Electromagnetic beam propagation in turbulent media: an update. Proc. IEEE 68 [1980], 1424-1443.
[3] CCIR, XIVth Plenary Assemb!y, Rep. 564-l. Part V (I TU, Gen eva, 1978).
[4] Lee, R. W. and Harp, J. C., Weak scattering in random media, with applications to remote probing. Proc. IEEE 57 [1969], 375-406.
[5] van Weert, M. J. M., The influence of frequency and receiver aperture on the scintillation noise power. Agard Conf. Proc. 159, 1975, paper 12.
[6] Herben, M. H. A. J., Amplitude and phase scintillation measurements on 8.2 km line-of-sight path at 30 GHz. Electron Letters 18 [ 1982], 287-289.
[7] Dijk, J., Hansen, C. N. F., and Maanders, E. J., OTS propagation measurements at Eindhoven University, Netherlands. Agard Conf. Proc. 284, 1980, paper 17.
[8] Otnes, R. K. and Enochson, L., Applied time series analysis, Vol. l. J. Wi!ey & Sons, New York 1978, pp. 343-345.

- 74
[9] Bendat, J. S. and Piersol, A. G.; Random data: analysis and meastirements procedures. J. Wiley & Sons, New York 1971, eh. 4 and 9.
[JO] Moulsley, T. J. et al., Measurement and modeHing of the probability density function of amplitude scintillations on an X-band satellite down-link. Electron. Letters 17 [1981], 625-626.
[11] Tatarski, V. 1., Wave propagation in a turbulent medium. McGraw-Hill Book Co. New York 1961, p. 34.
[12] Ishimaru, A., Temporal frequency spectra of multifrequency waves in turbulent atmosphere. Transact IEEEAP-20[1972], 10-19.
Note: As noted in Chapter 2 (Fig. 2.6) the slope of the theoretica!
amplitude scintillation spectrum, corresponding to the OTS-TM/TM beacon
signal received by an 8 m antenna, varies slightly with frequency ~
(= 2rrf/VL). The slope of the theoretical spectrum shown in Fig. 2 of the
above paper was obtained by equating the measured spectrum normalised to
the measured variance, and the theoretical spectrum normalised to the
theoretical varianee (see Sectien 2.3.2). The transverse wind velocity
VL is found in this way, and the normalised theoretical spectrum is
known as a function of f (= VL~/2rr). Since the measured range of 20 log
(~/A) for which the slope should be determined is rather small (~ 10
dB) this slope has been considered to be constant within this range.
*
M.F.A.J. Herben
Eindhoven University of Technology Department of Electrical Engineering Findhoven, Netherlands.
ABSTRACT
1,1 Kohsiek
Royal ~'etherlands 'leteoroloRical Institute De Rilt, Netherfands.
The im~ortance of radio-wave scintillations intro-nueed by turbulence for both tele-comrnunication and meteorological research is indi-cated. Amnlitude, and phase-difference Measurements of scintillation were performed at 30
Reprinted from ESA SP-194, 1983, pp. 79-87.

- 75 -
GHz on an 8.2 km line-of-s nath. In-situ measurements of tem~erature and humidity fluctuations and wind velocity and direction were done about midway on the propa:;ation nath. The measuring systems are described, and theory is ~resented to derive the refractive-index structure parameter C~ and wind velocity v from radio-wave scintillations and the in-situ measurernents. Formulas are p,iven to scale C~ and v with hei~ht. Finally, results of the experiments are nresented and discussed.
l(eyvJOrds: l1adio links, scintillntion !'1easurernents, troposnheric turbulence, structure oarameters, wind velocity.
RESUME
On montre 1 'im~ortance des scintillations des ondes radio introduites oar la ttirbulence troTJosry]-Jérique tant nour les télécom~unications aue pour la recherche On a effectué des mesures en amolitude, en ~hase et en différence de phase de la scintillation à 30 GHz sur une lia.ison en visibilité de 8,2 Km. Des mesures in situ des fluctuations de temnérature et d'humidité et de la vitesse et la direction du vent ont été faites à peu _orès à mi-chemin du de nrooagation. On décrit les sys-tèmes de mesure et on présente la théorie aui J?ermet d'obtenir le de structure de 1 'indice de ré!'raction et la vitesse du vent v à partir des scintillations d'ondes radio et de mesuresin situ. Des formules sant données oour déduire la variation de r~ et de v avec la hauteur. Finallement, on sente et on discute les résultats des expériences.
~ots clés : liaisons radio, mesures des scintillations, turbulence trooos_nhérique, Daramètres de structure, vitesse du vent.
l . INTR0DUCTION
~easurements of trouosoheric turbulence are important in both telecommunication and meteorological research. At frequencies above JO GHz, the amplitude and phase scintillations introduced by tropoSDheric turbulence may he imuortant for the design of reliable radio communication systems. In contrast to additive thermal noise, scintillation noise is multiplicative and makes it imnossible to imprave

- 76 -
the ryerforMance of a radio communication system simnly by increasing the transmit power. Phase scintillations may be a limiting factor for carrierrecovery circuits in di~ital radio cornmunication systems or cause synchronization nroblems v:ith certain TDMA techniques. Hhen an antenna is used as a spatial filter to suopress interference by nullin~ (Refs. l ,2), scintillations may degrade the suopression by fillin~ un the null pointed towards the interference. P.lthou:o:h the depolarisation caused in the turbulent trooosphere may be neglected (Ref. 3) the phase errors introduced over the aperture of the antenna may decrease its cross-polarisation discrimination, and thereby liMit frequency reuse by means of orthop,onal polarisations, just as reflector surface errors do (Ref. 4). Thus, the existence of scintillation noise pronoses a lower limit to surface manufacturinR tolerances in reflector antennas; an antenna with an even srnoother surface does not result in better cross-polarisation discrimination.
In ordér to deterrnine the magnitude and dynamic character of this scintillation noise, a measuring systern has been developed and built. Amnlitude and phase scintillations measured at 30 GFz on an 8.2 km line-of-sight nath between the Eindhoven University (receiver 44 m above local Ç,round) and the Netherlands PTT tower in Mierlo (transmitter 77 m above local "round) have demonstrated that bath the slopes of the scintillation sneetra and their probability density functions aqree with exnectations based on weak-scatterin~ theory (Ref. 5). It appears that the von Kármán renresentation of the Folmo~orov refractive-index snectn1m (Ref. 6) can be adopted for the turbulent troposphere. ~nowing the relation between the measured scintillations and the hehaviour of the meteorological :>arameters of the turbulent troposphere, it is also possihle to derive information about these meteoraloRical varameters frorn scintillation rneasurements. Consequently, the scintillation measurement system ~ay be used also for remote-sensing ourposes. In contrast to point-prohing measurements, this radio metbod gives a line-averaged measurement, which is aften desirabie for, e.g., water-balan~e studies and other mescseale meteorological investigations.
In the present paper, point-probinp, and line-averaged measurements of the refractive-index structure parameter (C~) and the wind velocity (v) will be corn-

- 77 -
pared. The relative contributions of temperature and humidity fluctuations to c~ will be discussed in view of the possibility of deriving both latent heat flux (evaporation) and sensible heat flux (vertical heat flux from the earth surface to the atmosphere) from scintillation measurements using radio waves and optical radiation sourees (Refs. 7,8). In Section 2, the measuring system will be described. Then the theory needed to relate the refractiveindex structure parameter and the wind velocity to the measured data is treated. Finally, results from the experiments will be presented.
2. THE MEASURING SYSTEH
Figure I shows a block diagram of the measurin~ system. The principle of phase measurement used was first described by Thompson and Vetter (Ref. 9). The signal transmitted from Mierlo at 30 GFz is re~eived and mixed in Eindhoven with a 29.560 GHz signal from a VCO (Voltage Controlled Oscillator) phase-locked to the incoming signal by means of a 50 MHz reference source. Thus the amplitude of the 10 MEz signal at point (a) is a measure for the amplitude of the received 30 GHz si8nal. The 29.560 GHz signal is retransmitted from Eindhoven to Mierlo. The 440 MHz PLL bandwidth is chosen sufficiently wide to ensure that the 29.560 GHz signal still contains the phase fluctuations of the received 30 GHz signal. In Mierlo the received 29.560 GHz signal is mixed with the 30 GHz signal to forrn a 440 MHz reference, which is transmitted to Eindhoven. The received 440 MRz reference is downconverted to 10 MHz in Findhoven in two stages, usinp, the 50 MHz reference source. The phase between the 10 MHz signals at point (a) and (b) is measured by means of a vector voltmeter, and is equa1 to the sum of the phase fluctuations of the 30 GHz and the 29.560 GHz signals. The sum is nearly equal to twice the phase fluctuations of the 30 GHz signa]. A secend antenna was added at the receiver site to measure also the phase difference between two horizontally spaeed apertures in a plane transverse to the propagation path. For the point-prohing measurements, a 10 m high mast was erected about midway on the propagation path carrying on top a fast temperature sensor (2.5 ~m Platinium wire), a fast humid sensor (based on the absorption of the Lyman-a emission line of hydrogen) and a propeller vane. The block diagram of this measurinp, system is also shown in Figure I .

-20
-30
"' " ~ -40
'· ~
",""' ;I
-50
a. -60
- 78
~ i Om.
0.0016 Hz
Fig.ure 1: Block diagram of the mê.asuring system above: radio system below: point-prohing systern.
inertial subrange
~
·<> "' ,;1
104
to3
Jf)2
!OI
tn°
!O-I
1()-2 b.
Figure 2: Theoretica! Dmver densitv sneetra for C~ f;.l J('J-l3 m-?_/ 3 (stron~ turbulence {Ref. 10)). a. amplitude. b. phase

- 79 -
The 10 m mast was located in a rye field, whereas the radio link runs over a landscape of smali-scale meadows. erop fields, woods and some suburban areas.
3. TPFORY
For the computation of scintillation spectra the weak-scattering theory described by van Weert (Ref. 10), which is only valid in case of a plane wave, has been modified so that it can also be anulied to a spherical wave. Figure 2 shows the computed amplitude and phase scintillation power density spectra for the 8.2 km line-of-sight path at 30 GHz. Inuut parameters for the theoretical model are the outer scale of turbulence, L
0 = 10 m (Ref. JO), and
the diameter of the receive antenna auerture, D = 0.5 m. In addition, the von Kármán representation of the Kolmogorov refractive-index spectrum and Taylor's frozen turbulence hypothesis are used (Ref. 6). The power density is proportional to C~ and, as seen from Figure 2, for a given C~ inversely pronortional to the transverse wind veloc1ty v~, whilP the frequency f is proportional to v~. Thus, if v~ increases the scintillation power is distri~ buted over a wider frequency band. The variances of amplitude and phase scintillation are obtained by integrating the spectra shown in Figure 2. After integration the v~ dependance disappears, so the variances of thP amplitude and phase scintillation, for a ~iven path length and frequency, only depend on the structure varameter C~ and are found to be
2 a~A/<A> = 10 log
a~ = 1.6 1014 c~
(3.0 109 c2) n
2 (degrees)
where < > denotes the time average.
dR ( l )
(2)
The varianee of the observed amplitude scintillation thus allows calculation of the corresponding refractive-index structure parameter C~, using the theoretica! exuressions given above. Knowing C~, the transverse wind velocity v~ is obtained by equating the inertial subranges (Fig. 2a) of the theoretica! and measured amulitude scintillation spectra.
To determine C~ and the refractive-index power density suectrum S from the point-prohing measureMents of temperatuPe T (in K) and absolute humidity Q (in gm-3) use is made of the relation (Ref. I l)

- 80 -
AT A !:In =- 11T + _.9. /1Q
T Q (3)
tvith
AT x 1 o6 -77.6 ~- 1723~
AQ x Jé 1723~ (4)
In these equations the atmosoheric pressure p is taken in mbar. These expressions follow from (Ref. 12)
(n-l)x 106 ~ 77.6 (p + 4810 e) T
where e is the water vanour pressure in mbar.
( 5)
The structure parameter~ C~,· c2 and ca were calculated frorn a single ooint in tte inertial subrange of the corresponding spectra Sn, ST and SQ using the relation (Ref. 13)
C2 = 4Sn,T,II (f) (~) KS/3 (6) n, T, Q '1. 2TI
with K = ~TI f; v: v.'Înd velocity, -S/J assuning that those sneetra behave as f in the inertial subrange (corresnonding to the Kolmogorov snectrum). They can also be nbtained from the samples n(t), T(t) and Q(t) using the relation
? c
n
<{n(t ) - n(t +T)} 2> 0 0
(7)
and correspondingly for ei and c6 by renlacing n by T and Q approoriate. Here vT should be taken somewhere in between the inner scale and outer scale of turbulence. This relation follows directly from the definition of the structure parameters and the assumotion of Taylor's frozen turbulence hypothesis. The temnerature-humidity co-soectrum STQ ~as comnuted from the known Sn' Sr and SQ' us1ng Equation 3, leading to
s -T
(8)
The structure parameter of the correlation between temperature and humidity fluctuations Crq ma~ be

- 81 -
obtained either from STQ' in the same way as described above for the determination of C~ from Sn• or from an expression similar to Equation 7, namely
<{T(t ) - T(t +T)}{Q(t ) - O(t +T)}> c = 0 0 0 . 0 (9)
TQ (vT)2/3
Because of the difference in height of the in-situ sensors location (10 m) and the prooagation path (mean height approximately 60 m), C~ and v have to be scaled with height for comparisons. For c;, use ~s made of the relation (Ref. 14)
c2 n;30 GHz 2 c . . n; ~n-s~tu
(I n)
with ~ = 4/3. This is a semi-empirical relation, which has only been verified for surfaces much smoother than the present one. The exoonent (-4/3) holds for moderately to highly unstable atmospheres (that is, conditions with appreciable uuward heat fluxes, and moderate to low wind speeds). For a neutral atmosphere (no vertical heat flux), a= 2/~ For the height sealing of v, the log profile is used (Ref. 15)
with
1 - {ln k z
0
l + l+x2 .,." ? ln( 2x) 1 ( ) " .• _ + n - 2- -2arctan x + 2
! x (1 - 16 h/L) 4
which leads to
60 1.08~ ln(-) -v30 GHz z
0
"' 1.08~ v. ln(.!.Q) ln-situ z 0
( 11)
(12)
where z is the roughness length of the surface and L the Mgnin-Obukhov length, defined by
v3T * L ( 13)

- 82 -
Here v* is the friction velocity, k = 0.4 the von Karman constant (Ref. 16) and g the acceleration of gravity. Further
Q0
= <w'T'> (14)
where w' is the fluctuating ~art of the vertical wind velocity, and T' that of the temnerature. The roughness length z is determined from the wind speed fluctuations at ~0 m height, following a procedure given by Wieringa (Ref. 17). Q0 is estimated from (Ref. 7)
Q0 = o.ss h /glT (ci) 314 (IS)
Then Lis calculated with Eouations 11 and 13 by an iterative procedure.
4. DATA ACQUISITION AND RESULTS
During ~1ay and June, I OR2, 20 events ( each with a duration of IS minutes) were recorded and analysed. The three baseband signals of the 30 GHz experiment, renresenting the amnlitude A and phase ~ of the received signal and the nhase difference ~d between the signals of two horizontally spaeed receive antennas, were low-pass filtered using a sixthorder Chebyshev filter with 10 Hz cut-off frequency, multiplexed and digitized by means of a 12-bit A/D converter. Before sampling, the mean value <A> of the amplitude signal was removed, while the remaining amplitude scintillation öA was suitably amplified so as to use the full dynamic range of the A/D converteL The two in-situ signals, renresenting temperature T and humidity Q were recorded on an Ampex recorder (Fig. I) and were subsequently digitized using the same equinment as for the ~0 GHz baseband signals. The refractive index n was comnuted from T and Q according to Equation 3. In order to determine the nower density sneetra of A/<A>, ~. ~d• n, T and Q, the record was divided in somewhat overlapping parts (Ref. 18), from which the mean value and the linear trend were removed by means of a least-squares procedure. The power density spectrum of each part was computed by means of a FFT procedure using a eosine tapering. The power .density spectrum of the comnlete record was obtained by averaging all these individual spectra (Ref. 19). The temperaturehumidity co-spectrum SrQ was comouted from Sn, Sr and SQ by means of Equation 8.

- 83 -
Figure 3 shows all the spectra for a typical scintillation event on 26 May, )Q82. The slopes of the amnlitude and uhase scintillation sneetra (Fig. 3a-b) agree with the measured and theoretica! slopes presented in Reference 5 and included in Figure 3a-b. The peaks in the nhase scintillation spectrum at 0.5 Hz and I Hz are eigenfrequencies of the movements of the PTT tower and the University building respectively. As seen from Figure 3b-c, the nhase-difference spectrum s~ falls below the single receiver nhase spectrum d S~ for low fre~uencies but becomes twice as large for higher frequencies. This may be exnlained in the following wav. If one assumes a frozen turbulent troposphere movin~ across the pronagation nath with transverse ~vind velocitv v~ (i.e., Taylor's frozen turbulence hynothesis), the low-frequency components are caused by large turbulent eddies while the higher frequencv comnonents are due to smaller turbulent eddies. If the dimensions of these eddies are larger than the antenna spacing (here 5.16 m) the nhase fluctuations caused by these eddies will be well correlated at both antennas, so the phase difference uill become small. However, if the dimensions of the eddies are considerably smaller than the antenna spacing, the phase fluctuations at bath antennas will be uncorrelated and result in spectrum comnonents in the phase-difference power density snectrum that are twice as large as the corresponding components in the phase spectrum. The frequency which separates the correlated and uncorrelated region is, for a given antenna snacing, proportional to the transverse wind velocity v~ (Ref. 20). Nevertheless, it is seen from Figure 3c that this freouency is not well defined so it may be difficult to determine v~ accurately from the phase-difference spectrum. Figure 3d shows the phasedifference suectrurn for an event with almast the same transverse wind velocity v~ but a much smaller antenna snacing (2.42 m). It is seen that the frequency seperating the correlated and uncorrelated region increases for decreasing antenna spacing, in agreement with Taylor's frozen turbulence hvnothesis. The Doppler shifts due to mechanical oscill~tions of the buildings supporting the transmit and receive antennas are the same for the two receive antennas. Therefore the peaf-_s at 0. 5 Hz and I Hz are absent in the phase-difference spectra. The spectra of the in-situ signals shown in Figure 3e-h follow f-5/3 in their inertial subranges, so the application of the Kolmogorov refractive-index

- 84 -
103
-30 102
\. ' -40 I
N 101 ' I N ~ "' :r ~ "' \. " 10° "" ' -50
~
;._ ~ ...
' "' ..,
10-l :::..
~
< ~ ' "' ~ -60 J(l-~ "'
-70 I0-3
a. I0-4 b.
10-l IQo f lOl 10-l 10° 101
' Hz f, Hz
103 103
102 102
' ' 'ï 10
1
' I 10 1
' N
"' ;r;
' "' '-~~ 10°
" -;; 10° ~
" ~
' 10-l ...
10-l "' ~
" ~
"" I0- 2
." I0- 2 .".
<'> "' "' 10-J IO-J
lo-4 c. I0-4 d.
10-1 100 1n 1 w-~ 1011
f, Hz 10 1
f. H7.
10 JO'"
' 10-12 ' JO-l ' ' ' ' ï
10-13 10-z
:i! I
N
"' ." 10-14 "' "' I0- 3
"' ut'
10-l<; I 0-4
10-16 .. 10-s f.
10-1 loo 101 10-l 10° 10 1
f, Hz f, Hz
Figure 3: Measured power density sneetra for scintillation event on 26 May, 1982. a. amplitude } slope of theoretical spectrum b. phase c. phase difference; ant enna snacing is 5.16 m } --- same theoretica} line as in b. d. phase diffetence; antenna spacing is 2.42 m (n June I ~82)
•· refractive index } ___ f-5/3 f. temperature

- 85 -
tn° 10°
JO-l ' 10-1
' ' ' _, ' N
"' 10 -
' "' I ~
I ' N l0-2 ' "'
'"' 'a N "' " to- 1 "' 10"3
V> Cl' 0. H
"' to-1
' 10-4
lf)-5 10-s
h.
1/)-1 to0
f. Hz 101 JO-l ll'lf'
f. Hz
Figure 3: Heasured power density spectf'a for scintillation ev"ent <1n 26 Mav, I<l82. g. humidity } f-5/3 h. temoerature-bumidity
1.2 10
M l.O / -~' / I 8
E
0.8 / c I / ~ /. / :ll
o. 6 / 0
I 0 / "' 1). 4
.. ... I. /
o. 2 /
0 0
0 6 JO 12 0 4 8 10 cz n; in~ situ x m-2/3
vin-situ (nO m), m/s
Figure 4: Scatter diagram of the Figure 5: Scatter of wind velocity v as st ructure parameter C~ as --··•••·--·radio-wave scintillat1on, and culated from in-situ observed <elotnt,n•c"~re and humidity fluctuations. Data from 20 runs of 15 minutes duration each.
regression line resultin.e: in exuonent ct= O.RO in Equation 1fl. regression line with data point omitted (J. ~ 0.69.
?
c~. in-situ in'
-.- line based on the tbeoretical value (J. ~ 4/3.
calculated radio-wave se int i llat ion and v at 60 m as calculated from the. insitu observations at 10 m. ~ regression line.

- 86 -
spectrum in the theoretica! model is also justified. Knowing the wind velocity and the freouency at which the inertial subrange starts it is possible to determine the outer scale of turbulence L0 (Ref. 21). For each record, the wind velocity is known, but, as seen from the sneetra of the in-situ measured signals, the frequency at which the inertial subrange starts is smaller than 0.1 Hz. Todetermine L
0, it is therefore necessarv to compute also
frequency comnonents below 0. I Hz. From such computations it follows, however, that the frequency at which the inertial subrange starts is not well defined; furthermore the number of record parts available for the computation of the power densitv spectrum becomes too small which leads to a large random error for the spectrum. Thus the assumption L0 = 10 m used in the theoretica! model cannot be checked by means of our record length of 15 minutes.
? Figure 4 shows the scatter diagram of c; as obtained from the measured amolitude scintillations using Equation I, and C~ obtained from the in-situ measurements using Equation 6. The scatter is rather large. The regression line leads to the exnonent a= 0.80 for the sealing formula given by Eouation 10. This value does not agree with the exnected value a = 4/3.
Figure 5 shows the scatter diagram of v, determined from the amplitude scintillations, and the wind velocity at 60 m, as calculated from the observations at 10 m using Eouations 11-!5. It was assumed that the wind direction is the same at 60 and JO m and that the surface roughness length z
0 = 0.5 m, a realistic value for the kind of land
scape along the pronagation path used. The slope of the regression line is I. I which is very close to the expected value 1.
In order to investigate c; as a function of time, one record with a duration of 5.5 hours has been analysed. Because turbulence is, generallv, small at night and grows during a sunnv morning this record starts at 6. 30 GH'J:.
Figure 6a shows the varianee of the amnlitude scintillation and the standard deviation of the phase difference (antenna snacing is 2.42 m) as functions of time. The C~ comuuted from the amPlitude scintillations using Eouation 1 are presenred . 2 in Figure 6b. Figure 6c-d shows Cn and the rela-

87 -
-30 2.5
"' b. "0
A -34 < V
< <J
"' 2.0 .... N
'a "' b -38
-c !.5
4.0 N
"' ~ ~
'-' !.0 0
;:: "' ot 2. 4 ~ Ni:i "0 u
0.5
0.8
0 100 zoo 300 0 100 200 300
time~ minutes time~ minutes
12 t.n c.
"' 10 ..... C'! t:l 0' u 1.2 ' " z
" 0 c 0.8 •-' ..,
x ~
:::: .~
6
I !!Mt ... 0.4 ... " ~ c
6 <l (i) •-' <V
> 0 -~
~Tl'· ''i J
~
"' -0.4
0
0 100 zoo 300 0 ;on 200 300
time, mi nut es tirne, minutes
Figure 6: Radio-wave seintil lation and in-situ measurements for 5. 5 hours session recorded on 10 June 1982 (6. 30 - 12 .. 00 GMT). a. The varianee of the amplitude scintillation and the standard deviation of the Phase difference
as functions of time. The anterma spacin;a: is 2.42 m. b. The refractive-ir,;dex struc.tuie parameter C~ computed frorn the amnlitude scintillation varianee
shown in a, us inn Ecruat ion J. ?
The in-situ measured refr~ctive-index structure parameter C~ as a function of time. d. The relativ~ contributions of the temr;erature structure parameter c,f (i), humiditv structure
parameter C<j {ii) and temperature-humidity structure vararoeter CTQ (iii) to the in-situ measured C~ as functions of time.

- 88 -
tive contributions of Ct, Co and CTo to c2 as functions of time obtained from the în-sit~ measured data. Here Eauations 7 and o were used averaged over VT = 1,2,3,4 and 5 m. It is seen from this figure that, as exoected, the contributions of C2 and CTQ are dominant while the contribution of CT may be neglected. Notice that the?jumn in c;i. 30 GHz (Figure 6b) is not found in the Cn; in-situ (FLgure ~c). The scatter diagram of C~ for this 5.5 hours record is shown in Figure 7. 1t anpears that the scatter is still large like in Figure 4. The exponent a obtained from the regression line eouals 0.71.
2.5
M --.. 2.0 r;
' s
1.5
" N
"' " 1.0 g
N~ u 0.5
()
0 10 15 20 25
f'l~ure 7: Scatter diagram of the refractive-index structure parameter c~ calculated fröm radio-wave scintillation, .and ~ calculated fr0m in-situ observed tem1ferature and humidity fluctuations. - regressiön line leading to the exuonent
rt = 0.71 for Equat:ion tO.
This is again much smaller than the exnected value a = 4/3 and differs also from the exponent obtained from Figure 4. However, if in Figure 4 the largest c~. in-situ is omitted (this point lies isolated from all other uoints) a equals 0.~9 and is almost the same as the exponent obtained from Figure 1. Thus,?for both experiments, the ratio of c;i; 30 GHz and C~. in-situ appears to be about a factor 3 too large ~ith resnect to the exnected a = 4/3 sealing.

- 89 -
5. DISCUSSION AND CONCLUSIONS
The amplitude and phase scintillations measured during this exoeriment justify, once again, the use of wea~-scattering theory and the auplication of the Kolmogorov refractive-index soectrum. The phasedifference spectrum falls below the corresponding single aperture ohase spectrum for low frequencies but becomes twice as large at higher frequencies. This agrees with Taylor's frozen turbulence hypothesis used in weay-scattering theory. Exploiting this relation between the phase and phase-difference snectrum offers the possibility to determine the high frequency components of the phase scintillations from phase-difference measurements without the need to use the rather complicated phase measurement system described in Reference 9. In this way the phase scintillations on a satellite link introduced by tropospheric turbulence can be measured.
The wind veloeities determined from the measured amnlitude scintillation spectra agree rather well with the in-situ measured ones, the scatter is small. However, the in-situ measured values of C~ are about a factor 3 too small compared with those determined from the measured 30 GHz amplitude scintillations, and the scatter is large. This scatter may be caused by the fact that we compared a noint measurement with a line-averaged one. The factor 3 may indicate that the -4/3 sealing is not auplicable to our measurements. It is suggested that the height sealing gets further investigation.
A continuous measurement session lasting 5.5 hours clearlv shows that turbulence grows during the morning of a sunny day. At 30 GHz the contributions to c~ of the humiditv structure parameter c~ and the structure parameter of temperature-humidity Cro apnear to be dominant, whereas the contribution of· the temoerature structure parameter er may be neglected. This differs from scintillation measurements using an ontical radiation source, where the contribution of c~ is dominant while that of c6 may be neglected (Ref. ·11). Thus, it seems possible to determine both latent heat flux (evaporation) and sensible heat flux (vertical heat flux from the earth surface to the atmosphere) from scintillation measurements using simultaneous centimeter radiowaves and ootical radiation sources, from the theory described in References 7 and 8.

1.
2.
3.
4.
s.
6.
7.
8.
9.
10.
IJ.
12.
- 90
6. REFERENCES
van Ommeren, .H. J. S. , Herben, H.H. A. J. and Arnbak, J.C., 1980, Improved orbit utilisation by interferometic sidelobe suppression, Electr. Lett. vol. ln, Q37-038. Arnbak, J.C., Herben, M.H.A.J. and van Spaendonk, R.A.C.U., J<î82, Interference rejection by auxiliary feeds in Cassegrain earth terminals,
paoer 38. Lee, R.W. and Harn, J.C., J060, Weak scattering in random media, \vith al)plications to remote orobing, Proc. , vol 57, 375-406. Vissers, J.M.H., Herben, U.H.A .. J. and Maanders, E.J., 1983, Crasspolarisation nroperties of reflector antennas with random surface errors, Electr. Lett.~ vol. 10, 40-50. Herben, H.H.A.J., 1982, Amnlitude and nhase scintillation measurements on 8.2 ~~ line-ofsight path at 30 GHz, Electr. Lett .• vol. 18, 287-289. Tatarslri, V.I., 1961, Have nropagation in a turbulent medium, McGraw-HiZZ.
2 Kohsiek, H'., 1982, Measuring Cft, Cq and CTO in the unstable surface laver, and relations to the vertical fluxes of heat and moisture,
.• vol. 24, 89-107. Kohsielr., W. and Herben, T:LH.A.J., 1983, Evanoration measurement bv antical and radio wave scintillation, Digest of the topical meeting on ootical techniques for remote probing of the atmosphere, (10-12 Jan. 108~) Nevada, USA, paper MC-30. Thom-pson, U.C. and Vetter, M.J., 1958, Single path nhase measuring system for three-cent1-rneter radio waves, Rev. Sci. Instrrum .• vol. 29, 148-150. van Weert, fLJ.H., JQ7S, The influence of
and receiver aperture on the seintillation noise power, Agard Conf. Proc. 159, paper 12. Hill, R.J., Clifford, S.F. and Lawrence, R.S., 1980, Refractive-index and absorption fluctuations in the infrared caused by temperature, humidity and pressure fluctuations, J. Ovt. Soc. Amer., vol. 70, (192-1205. CCIR, Recornmendations and reports of the XIVth plenary assembly, J079, Kyoto, vol. 5, 69, (Rec. 453).

- 91
13. Wyngaard, J.C. and Izumi, Y., 1971, Behaviour of the refractive-index-structure parameter near the ground, J. Ont. Soc. AmeP., vol. 61, 1646-1651).
14. Wyngaard, J.C. and LeHone, H.A., 1980, Behaviour of refractive-index-structure narameter in the entraining convective boundary layer, J. Atmos. Sci., vol. 37, 1573-15R5.
15. Paulson, C.A., 1970, The mathematical representation of wind speed and temperature profiles in the unstable atmosnheric surface layer, J. Appl. Meteorol., vol. <l, 857-8111.
16. Wieringa, J., IQ80, A revaluation of the Kansas mast influence on measurements of stress and cup anemometer overspeeding, Boundaru-La11er Meteorol. vol. 18, 411-430.
17. Wieringa, J., 1977, Wind representative increase due to an exposure correction, obtainable from past analog station wind records, M40-no. 480, 39-44.
18. Otnes, R.K. and Enochson, L., 1Q78, Applied time series analysis, vol. I, John vliletl, 343-345.
19. Bendat, J.S. and Piersol, A.G., 1971, Random data: analysis and measurements procedures, .John Yiley, 327-329.
20. Handics, P.A., Lee, R.W. and 1-!aterman, A.T., 1973, Spectra of short-term fluctuations of line-of-sight signals: Electromagnetic and acoustic, Radio Sci., vol. 8, 185-201.
21. Cole, R.S., Ho, K.L. and !1avrokoukoulakis, N.D., 1978, The effect of the outer scale of turbulence and wavelength on scintillation fading at millimeter wavelengtbs, IEEE '!'rans., vol. AP-26, 712-715.
Note: In the above paper a logarithmic profile is used to scale the
wind velocity with height (see Eqs. 11-15 of the paper). Because this 2
model needs several meteorological input parameters (such as CT, T and
V~), a simpler but less accurate relation of the form
v30 GHz
vin-situ
is aften used [45].
(4 .1)
With this simpler relation the measured results presented in the above
paper lead to m = 0.28. Fig. 4.12a shows the corresponding scatter
diagram.

10
8
Ul 6 g N ::r: t.9 4 0 M
;:>
2
0
0
- 92 -
10
8
Ul
' 6
8
N ::r: t.9 4 0 M
;:>
2
0
2 4 6 8 10 0 2 4 6 8
vin-situ' m/s vin-situ I m/s
Fig. 4.12. Scatter diagram of the wind velocity v as calculated from
radio-wave scintillation and V as calculated from the in-
situ observations
a. for scintillation measurements described in the above
paper
b. for scintillation measurements mentioned in the paper
reprinted inSection 4.3.1.
Fig. 4.12b shows the scatter diagram of the wind velocity V as derived
from the scintillation events mentioned in the paper reprinted in Section
4.3.1, and in-situ measurements performed at the University's weather
station (Chapter 3). Forthese measurements the exponent m appears to be
0.34. The exponent m increases with increasing terrain irregularity, so
it may be expected that the local terrain surrounding the University's
weather station is less smooth than the terrain in the vicinity of the
in-situ measurement point for the experiment described in the above
paper. This agrees with reality, in so far as there are more buildings
and trees near the University's weather station.
10

*
- 93 -
W. Kohsiek and M.H. A. J. Herben
Tbe determination of the evaporation from sein tillation measurements at several wavelengtbs is discussed. The refractive-index structure parameter C! derived from the observed amplitude sein tillation on a 30·GHz radio link is compared toa spot messurement ofthis quantity at a much lower height than that ofthe radio link. After free convection height sealing, a difference of a factor of 3 is found. This factor is discussed. A calculation of the evaporation from the observed radio-wave scintillation yields good agreement with calculations based on the Priestley-Taylor formula.
I. Introduetion
The feasibility of measuring the sensible heat flux by optical scintillation observations along a horizontal path has been demonstrated in the past.1•2 The major advantage of this metbod is that it gives a line-averaged measurement. In contrast, other methods such as temperature profiles, Bowen ratio, or eddy correlation, are point measurements. Line- or area-averaged measurements are often desirabie for water balance studies and mesoscale meteorological investigations. A drawback of the scintillation metbod is that a semiempirica! relationship between the heat flux and the optically measured temperature structure parameter c~ is involved.3
It is our aim to investigate if the latent heat flux or evaporation can be measured by scintillation techniques too. Two questions have to be addressed: (a) How is the evaporation related to the structure parameters of tempersture and humidity? (b) Canthese structure parameters be measured by scintillation? We shall briefly go into these questions and report on an experiment in which the refractive-index structure parame-
W. Kohsiek is with Royal Netherlands Meteorological Institute, P.O. Box 201,3730 AE De Bilt, The Netherlands, and M. Herben is with Eindhoven University of Technology, Department of Electricàl. Engineering, P.O. Box 513,5600 MB Eindhoven, The Netherlands.
Received 15 March 1983.
Reprinted from Applied Opties, 1983, Vol. 22, pp. 2566-2570.

94 -
ters obtained from scintillation measurements on a 30-GHz radio link were compared with measured in situ structure parameters. Finally, a calculation of evaporation from observations ofthe radio-link scintillation will be presented.
11. Measurement of C ~ and C~ by Optie al and Radio-Wave Scintillation
Scintillation measurements give the refractive-index structure parameter C~. This parameter is related to C~,C~ (the humidity structure parameter), and CrQ ( the structure parameter of the correlation between temperature and humidity fluctuations) by4
cz = A} cz +Acz + 2ArAQ C n (T)2 T (Q)2 Q (T) (Q} TQ·
(1)
Here Ar and AQ are quantities that depend.on atmospheric pressure, average temperature ( T}, and absolute humidity ( Q), and on the wavelength of the radiation. The relative contributions of the three terms in Eq. (1) depend on wavelength. Thus, by observing sein tillation at three wavelengths, it should in principle be possible to obtain C~, C~, and CrQ· For visible radiation the c~ term is dominant, while at radio wavelengtbs the C~ and CrQ terms are important. Unfortunately, at no wavelength is the c~ term alone dominant. Alternatively, one can use only two wavelengtbs and add arelation between CrQ, Ch and C~. Such a relation could be provided by assuming a correlation coefficient between temperature and humidity fluctuations in the inertial subrange.
If one wishes to use three wavelengths, a suitable choice is a visible or near infrared radiation source,5 a C02laser, and centimeter radio waves. Using only two wavelengths, a visible radiation souree and radio waves seem appropriate. To our knowledge, no attempt to measure c~ and c~ by using scintillation at more than one wavelength has been reported up to now.

- 95 -
111. Relation Between the Evaporation and the Structure Parameters of Temperature and Humidity
In a recent publication6 the following relations are reported:
(2)
(3)
Here Ea is the vertical moisture flux, z is the height above the ground, g is the acceleration of gravity, T is the temperature (in K), k = 0.4 is the von Kármán constant, and L 0 is the Monin-Obukhov length without moisture correction. This expression follows from surface layer similarity theory,s which states that dimensionless quantities should only depend on the stability parameter z/L0• The quantities ft and {3 depend on z/L0; the similarity theory puts some bounds on their relations to z/L0, but their exact behaviors can only be determined by experiment.
Relation (2) can be written as
Eo = f)(C})li4(C~)ll2 h (L) . (4)
The similarity theory prediets that, for large negative values of z/L0, the stability function h(z/L0) should approach a constant. This is called free convection sealing; it is a situation where turbulence is created by buoyancy and occurs on sunny days with moderate to low wind speeds and not too close to the ground. Kohsiek6 found that h = 0.95 for values of -z/L8 > 0.02. Others7 found that a stability function similar to h in an expression relating the sensible heat flux to the temperature structure parameter is within 10% of its asymptotic value for -z/Lo > 1. Also in this case Kohsiek found -z/L0 > 0.02.
It can be shown that, in the surface layer ( the lowest 10-20 mof the atmosphere), the structure parameters C},C~, and CrQ should be proportional toz-413 if -z/L0 is large enough. 3,6 Th ere is experimental evidence that this proportionality is valid in a fairly thick layer up to a few tenths of the inversion height.8 It then follows

- 96 -
from Eq. (1) that c~ should also be proportional to z-413
starting from some lower level, where -z/L8 is large enough, up to well above the surface layer. We shall use this height sealing in Sec. IV, where observations of C~ at 10- and 60-m height will be compared.
lV. C~ From Radio-Wave Scintillation vs Spot Determinations of C~ From Tempersture and Humidity Fluctuations
The Eindhoven University of Technology operates an ex perimental radio link betweenone of their buildings and a TV tower. The distance is 8.2 km, and the height above the surface varies from 44 to 77 m. The wavelength is 1 cm (30 GHz). More details are given by Herben.9 An example of the amplitude spectrum of the received signal is given in Fig. 1. The value of C~ for radio waves was calculated from spectra like this assuming spherical wave propagation. About halfway along the radio path, a 10-m high mast was erected, on
N :I: -
-30
~ -40
~ <( <I -50 0\
.!2. 0 N -60
-70
10 f (Hz!
Fig. 1. Amplitude spectrum of the 30-GHz signal on 26 May 1982, 12:30-12:45 GMT. The broken lîne indicates the slope of theoretical spectrum obtained from Herben9 fora receive antenna aperture diameter of 0.5 m. lt corresponds to (AA/ A )2 ....... {-2.83, where A is the
average amplitude, and AA is the variation around A.

- 97 -
top of which a fast temperature sensor (2.5-JLm Pt wire), a fast humidity sensor (Ly-a) and a propeller vane were mounted. The signals were recorded on an Ampex recorder and digitized later (sample frequency 50 Hz, low-pass filter at 10Hz). The recordlengthof a run was 15 min. The refractive-index spectrum was computed for each run using10
77.6 ( 4810 ) <n -o x 106=r P +re , (5)
which yields
where
Ar= T (an) = (-77.6!!..- 1723 ~)x 10-6, (7) aT Q;const T T
AQ = Q (an) = (1723 ~)x 10-6• (8) aQ r~const T
In Eq. (5) nis the refractive index, p the atmospheric pressure, and e the w~ter vapor pressure, both in millibars. The infinitesimal quantities of dT and dQ in Eq. (6) are replaced in practice by finite differences around the mean values ( T) and ( Q). In Eqs. (7) and (8) Q is expressed in gm-3• Figure 2 gives an example of the refractive-index spectrum. It is seen that the spectrum exhibits an inertial subrange as indicated by the broken line in the figure. From spectra like this, C~ was calculated using the re lation 7
(9)
where <I>n (K) is the speetral density at wave number K
= 21r{/u, fis the frequency, and u is the wind speed. Before a comparison between the radio-wave values
of Ç~ at an average height of 60 m and the spot measurements of C~ at 10-m height will he attempted, two questions have to he addressed: (1) Are the spot measurements representative for the average conditions along the radio path? (2) Can the 10-m observations he upscaled to 60 m. As to the first question, the radio link runs over a landscape that consistsof smali-scale

98 -
-11 10
-12
""" 10
~ -13
~ 10
N
~ -1l. .... 10
c: Vl
-15 10
-16 10
-1 10° ,d 10 fiHz)
Fig. 2. Refractive-index spectrum Sn calculated from in situ observed temperature and humidity fluctuations for the sameeventas Fig. 1. In the inertial subrange thè spectrum follows an f-5/3 de-
pendence as indicated by the broken line.
meadows, erop fields, woods, and some suburban area, whereas the 10-m mast was placed in the center of a rye field of ........ 250 X 450 m. There are several indications in the literature11.12 that the evaporation of grass and various other types of vegetation, including forests, is roughly the same if there is ample water supply. The solar irradiance at the rye plot often differed from the average irradiance along the 30-GHz line due to scattered clouds, but this will only contribute to the scatter of the data points when the 10-m values of c~ are compared with the 60-m values. The answer to the secoud question is nota simple one. As mentioned in Sec. III, C~ is proportional to z-413 if -z/Lo is large enough for the in situ measurements and if the height of the radio path is well below the inversion height. We think that the latter condition is fulfilled because the observations were done on generally sunny days in early summer, not close to sunrise or sunset (maybe with the exception of one case). As to the actual values of -z/L8,
we could only make an estimate because we did nothave

99 -
direct measurements. The estimates were made with the 10-m observations of c~ and wind speed, an assumed roughness length (0.5 m), and assuming that the free convection relation between C~ and the sensible heat flux can be applied. The so obtained values of -z/Lo varied from 0.01 to 0.26. It is noted that this is a lower estimate. If a smaller roughness length is assumed, or if the sensible heat flux is larger than estimated above (which is likely as will beseen belów), the values of -z/Lo increase.
The minimum value of -z/Lo forthefree convection relations between fluxes and structure parameters to hold was found by Kohsiek6 to he 0.02. So these relations should be applicable to the major part of our observations. If we then calculate the sensible heat flux and the latent heat flux associated with the moisture flux and add them up, we find values that are about half those of the estimated net radiation (for this estimate, see Sec. V), whereas one would expect .....,90% of the net radiation. 13•14 This puts serious doubts on the applicability of the free convection relations to our 10-m data and with that on the applicability of the z-413 sealing for the structure parameters from 10 to 60 m. Indeed, as shown by Fig. 3, the observation of C~ at 60 mis not related to the observations at 10-m height by a factor of (60/l0)-4/3 = 0.092 but by a factor that is ,....,3 times as large. (In Sec. V it will be demonstrated that the free convection relations apparently do apply to the 60-m observations of C~).
If the minimum value of -z/L0 for the applicability of the free convection relations is not 0.02 as assumed above, but larger, the observations of c~ at 10 and 60 m are brought closer together. In case the Kansas relation between sensible heat flux and temperature structure parameter 7 is adopted, the one that bas the stability function within 90% of its asymptotic value for -z/L8 > 1 (see Sec. III), a height sealing is found that differs from z-4/3. If this sealing is applied to C~, the scaled 10-m observations are stillabout two times lower than the 60-m values. Moreover, the scatter is increased compared with the case of free convection sealing. We conclude that the comparison between the 10-m in situ

- 100 -
observations of c~ and the 60-m radio-wave scintillation observations of c~ is not successful, probably because the 10-m observations of c~ and c~ accord poorly with the free convection relations between structure parameters and surface heat fluxes. If so, the lower value of -z!Lo for which the free convection relations can he applied should depend on the particular features of the terrain at hand; here it is a rough vegetated terrain, whereas the above-reported lower values of -z/L8 were found above much smoother vegetated surfaces. We
1.2
1.0 /
0.8 / c:.'2 / "l'e
0.6 M / .-52
• N 0.4 :I: C> 0 M 0.2
NC u
2 I. 6 8 10 12
c2t10m)x1013
n (~2/3)
Fig. 3. Scatter diagram of C~ calculated from radio-wave sdntillation and c~ calculated from in situ observed tempersture and humidity fluctuations. The broken line indicates the expected relationship and has a slope of 0.092. The full regression line has a slope of 0.24; omitting the right-most data point, the slope of the regression line is
0.29. These are data from 20 runs of 15~min duration each.
will investigate thé relations between structure parameters and heat fluxes again in the near future from measurements at the 200-m meteorological tower at Cabauw, where we have more complete data available.
A study of Ho et al. 15 on the relation between obser-

- 101 -
vations of c~ from radio-wave scintillation and from a microwave cavity reveals reasonable agreement between the two kinds of measurement. But it is hard toevaluate these results, becausetheir path was above a very inhomogeneous terrain (central London, with part of Hyde Park), and they assumed plane-wave propagation, which seems erroneous to us.
V. Evaporation From Radio-Wave Seintmation
In Sec. II it was stated that the evaporation can he calculated from scintillation meàsurements at three wavelengtbs or scintillation measurements at two wavelengtbs plus an additional relation between the three structure parameters c~. c~. and CTQ· Here we report on a calculation of the evaporation when only one wavelength is available (i.e., 30 GHz) plus two additional relations. We assumed
(Ct/C~)112 = 1.33,
CrQ/(C;,c~)l12 = 0.87.
(10)
(11)
Both relations are the average values of the 10-m observations. The first relation is equivalent to assuming a Bowen ratio (sensible heat flux divided by latent heat flux) of 0.6, and the second states that the speetral correlation coefficient between temperature and humidity fluctuations in the inertial subrange is 0.87. This value of the Bowen ratio compares well with calculations by Webb12 for various types of vegetation and is somewhat higher than the one observed by De Bruin and Holtslag14 forshort grass, i.e., ~0.4. A high temperature-humidity correlation coefficient over land is also reported by McBean and Miyake, 16 Schotanus, 17
and Kohsiek. 6 If all structure parameters scale with height following similar sealing laws, these relations are also valid at 60 m, the average height of the radio link.
We calculated the evaporation for 10 runs with a cloud cover smaller than 1/s, using Eqs. (1), (4) with

- 102
h(z/L8) = 0.95,18 (10) and (11). We compared these values to an independent estimate of the evaporation, the Priestley-Taylor calculation:
s LECT =a'-- (Q*- G) + f3, (12)
s + '"Y
where LEbT is the latent heat flux (in Wm-2), L the latent heat of vaporization of water, Q* the net radiation, G the ground heat flux, s the slope of the saturated water vapor pressure curve, 'Y the psychrometer constant, and a' and fJ are empirica! constants.19 We took G = O.lOQ*, a'= 0.95, and fJ = 20 Wm-2•14 The net radiation Q* was put equal to the one observed at the meteorological statión at Cabauw, which is at a distance
Table 1. Evaporatlon Calculated trom Radio-Wave Sclntlllatlon LE:w Compared wHh Evaporatlon Calculated wHh the Prlestley-Taylor Formula
LE~1
Date Time Q* LEbr LECW LECW
(1982) (GMT) (Wm-2) (Wm-2 ) (Wm-2) LECT
26May 10.45 509 339 329 0.97 11.45 524 354 310 0.88 12.45 491 331 290 0.88 13.30 482 325 351 1.08 14.15 405 277 292 1.05
25 June 7.15 201 119 297 2.50 8.15 313 194 229 1.18 9.15 408 257 320 1.25
10.15 482 308 325 1.06 11.15 531 344 385 1.12
Q* is the net radiation.
of 70 km from Eindhoven. It can he used as an estimate of the net radîation at Eindhoven because there were few clouds at both places. The results of both calculations of the evaporatîon are shown in Table I. We believe that there is an encouraging agreement.
Vl. Concluslons
Comparing the C~ values derived from radio-wave scintillation with in situ observed values we noticed that

103
the in situ values are about three times smaller than the values from radio-wave scintillation after having scaled the former from observation height (10 m) to the average height of the radio link ( 60 m) using free convection sealing.
Although spatial inhomogeneity may be involved, we do not believe that it can fully explain these results. More likely,.there is something wrong with the height sealing procedure. Possibly, the lower value of -z/L8,
where free convection sealing is allowed, is different over a rough vegetated surface than over a smooth surface.
A calculation of the evaporation from the observed radio-wave scintillation and two additional relations between the structure parameters Ct, C~, and CrQ compares well with results following from the Priestley-Taylor formula. This demonstratas that line-averaged evaporation can be inferred from scintillation observations at one wavelength provided the Bowen ratio and the correlation coefficient between temperature and humidity fluctuation in the inertial subrange are known. Note: To avoid confusion the authors would like to mention some differences between this paper and the paper publisbed in the digest of the LakeTahoe Conference.20 The factor 7.46 X 10⁵ in Eq. (4) ofthe conference paper should read 3.73 x 10⁵• The C~ scatter diagram in this paper has four points less than the figure in the conference paper; three points were omitted because the atmosphere was very near neutral, the fourth because the irradiance at the spot of the in situ measurements was very obviously different from the average irradiance experienced by the terrain under the radio path. Section V of this paper is not in the conference paper.
Relerences 1. J. C. Wyngaard, J. C. Kaimal, G. R. Ochs, R. J. Hili, and D. C.
Sorensen, "An Optical Heat Flux Experiment," in Fourth Symposium of Meteorological Observations and Instruments, Denver (Americau Meteorological Society, Boston, 1978), pp. 47-50.
2. R. L. Coulter and M. L. Wesely, J. Appl. MeteoroL 19, 1209 (1980).

- 104 -
3. J. C. Wyngaard and S. F. Clifford, J. Atmos. Sci. 35, 1204 (1978).
4. R. J. Hili, S. F. Clifford, and R. S. Lawrence, J. Opt. Soc. Am. 70, 1192 (1980).
5. G. R. Ochs and Ting-i Wang, Appl. Opt. 17,3774 (1978). 6. W. Kohsiek, Boundary Layer Meteorol. 24, 89 (1982). 7. J.C. Wyngaard, Y. Izumi, and S. A. Collins, Jr., J. Opt. Soc. Am.
61, 1646 (1971). 8. J. C. Wyngaard and M. A. LeMone, J. Atmos. Sci. 37, 1573
(1980). 9. M.H. A. J. Herben, Electron. Lett. 18,287 (1982).
10. H. Otterson, K. R. Hardy, and C. G. Little, Boundary Layer Meteorol4, 47 (1973).
11. J. L. Monteith, Principlesof Environmental Physics (Edward Arnold, London, 1973), p. 179.
12. E.K. Webb, "Evaporation from Catchments," in Prediction in Catchment Hydrology (Australian Academy of Science, Canberra, 1975).
13. D. M. Burridge and A. J. Gadd, "The Meteorological Office Operational 10-level Numerical Weather Prediction Model," ScientificPaper 34, U.K. Meteorological Office (1977).
14. H.A. R. De Bruin and A. A. M. Holtslag, J. Appl. Meteorol. 21, . 1610 (1982).
15. K. L. Ho, N. D. Mavrokoukoulakis, and R. S. Cole, Atmos. Terr. Phys. 40, 745 (1978).
16. G. A. McBean and M. Miyake, Quart. J. R. MeteoroL Soc. 98, 383 (1972).
17. P. Schotanus, "Turbulente Fluxen in Inhomogene Omstandigheden," KNMI Scientific Report WR 82-3, 1982 (in Dutch).
18. This implies that the free convection relation is adopted. Such is better justified at a height of 60 m than at 10 m because -z/Lo has a larger value at 60 m than at 10 m.
l9. The fJ in Eq. (12) is a different quantity than the fJ in Eq. (3). 20. W. Kohsiek and M.H. A. J. Herben, "Evaporation Maasurement
by Optica! and Radio Wave Scintillation," in Optical Techniques for Remote Prohing of the Atmosphere, lncline Village (Optica! Society of America, Washington, D.C., 1983), paper MC30.

'"' ..c:
- 105 -
4.4. Precipitation
In Section 2.4.2 the attenuation and cross-polarisation discriminatien
have been presented as a function of rain intensity. In order to check
the curves shown in Fig. 2.8 it would be necessary to measure the rain
intensity along the propagation path. However, only one raingauge was
available as indicated in Sectien 3.3.
Fig. 4.13 shows the distribution of rain intensities measured with this
raingauge in the period 1 February 1981 until 1 February 1982. Rain
accured most frequently during the months March, October and December
1981. The most intense rain showers occurred during the months May, July
and September 1981 and January 1982.
100
80
' ~ 3
:>.. 60 4J ·ri 4!.5 1 Ul
!ii 4J ~ 8 ·ri
~ 40
·rl Cd 8.5 15 2.5 2 '"'
14 5 33.3 1.5 7 3
20 27 36.5 15 61.8 2.5 22 7 2
12
398 6281 2121 279 851 2232 153 148 6654 5615 093 3550 0.06
1981 F M A M J J A s 0 N D J 1982
month of the year
Fig. 4.13: Rain intensities recorded in the period 1 February 1981
until 1 February
[]* 1982.
number of minutes that a given rain intensity is
exceeded.

- 106
Fig. 4.14 shows the scatter diagram of the measured attenuations and the
simultaneously measured rain intensities for a rain event on 5 January
1982. Although some relation is ohserved at low rain intensities, the
clustering is poor for large rain intensities. Comparison of the corres
ponding regression curve (i} with the theoretica! curve (ii} obtained
from Sectien 2.4.2 (Fig. 2.8a, curve ii) leads to the same observation.
The poor relation for large rain intensities may be explained by the
local character of intense rain, resulting in a discrepancy between a
point measurement (of rain intensity} and a line-averaged measurement -{of
attenuation) .
Just as for multipath propagation, it thus turns out to be impossible to
predict the magnitude of the signal fluctuations for propagation through
rain from a single localised measurement of the meteorological parameter
which is responsible for these fluctuations.
m 'Ö
2 0
·.-! .j.) <U ::; ç: (!) .j.) .j.) <U
Fig. 4.14
40
ii
30
20
10
0
0 10 20 30 40
rain intensity, mm/hr
Scatter diagram of rain attenuation versus rain intensity
measured in rain event on 5 January 1982.
(i) regression curve
(ii) theoretica! curve obtained from the theory described
inSection 2.4.2 (Fig. 2.8a, curve ii).

107 -
As expected from the theory described in Section 2.4.2 the signal vari
ations caused by rain are much larger that those presented in Section
4.2 for multipath propagation. During the whole measuring period three
events were detected with an attenuation exceeding 60 dB (the limit im
posed by the dynamic range of the measuring system).
In order to campare the dynamics of propagation through rain with that
of multipath propagation, one rain event wil! be analysed in detail.
Fig. 4.15 shows the relative co-polar signa!, the XPD, the phase between
co- and cross-polar signals and the scatter diagram of XPD versus co
polar signal strength for a rain event on 10 October 1982. At the begin
ning of the rain event the XPD varies rapidly due to the interference
betweEn system cross-polarisation (-47 dB) and cross-polarisation intro
duced on the propagation path. With increasing attenuation the latter
becomes dominant resulting in a wel! defined XPD with a worst-case value
of 37 dB.
From Fig. 4.15d it appears that the regressioncurve fitting the measured
values of the relative co-polar signal and XPD has the same shape as the
theoretica! one obtained from Sectien 2.4.2 (Fig. 2.8b, curve ii) but is
shifted about 10 dB. This may be explained by the fact that the canting
angle distribution for this particular event differed from the Gaussian
distribution with an expected canting angle of 8.5 degrees and a standard
deviation of 43 degrees, as assumed to compute the theoretica! curve. The
shift of the theoretica! curve caused by a change of the expected value
or standard deviation of the Gaussian distributed cantinq angle is clearly
seen in Fig. 2.10 of Sectien 2.4.2. This shift is indeed not the same for
all events as shown in Fig. 4.16, in which the regression curves of six
different events are collated. The corresponding mean wind velocity measu
red for each event is also included in the figure. From this figure it
may be concluded that for a given attenuation the depolarisation tends
to increase with increasing wind velocity. This agrees with theory, which
prediets an increase of the expected canting angle with growing wind
velocity [45].
The rate of change of the co-polar signa! and the XPD in dB/sec as a
function of time for a sample period of 2 and 5 seconds, tagether with
the corresponding cumulative distributions and scatter diagrams for the

- 108 -
rain event on 10 October 1982, are shown in Fig. 4.17 and Fig. 4.18,
respectively. Just as for multipath propagation it appears that the rate
of change strongly depends on the sample period. As seen from Figs.
0
~
';ij -10 §,
..... en
"" 111
'd -20
b u
~ •.-l
~ .--! Ql
""
IXl 'tl
Q P; :x:
-30
80
70
60
50
40
30
Fig. 4.15
10/10/82 (a)
10/10/82 (b)
14.15 14.20 14.25 time, hours GMr
Rain event on 10 October 1982.
a. co-polar signa!
b. cross-polarisation discriminatien XPD.

- 109 -
).;
<U ....; 0 136 degrees 0. I
(IJ (IJ
0 ).; u 'lj
ijl I 1:: <U
I 0 (IJ
u Ql
r Ql
~,:~Jr 1:: ).; Q) 0> I ~ Ql
'lj
~ ..., Q) ,; .Q
....; Ql <U (IJ s:: <U 0> .c ·.-! 0. (IJ
10/10/82 (c)
14.15 14.20 14.25
time, hours GMT
80
70
lil 60 'lj
Cl A. x
50
40
30
0 -10 -20 -30
relative co-polar signal, dB
Fig. 4.15: Rain eventon 10 October 1982.
{cent.) c. phase between co- and cross-polar signals
d. scatter diagram of XPD versus co-polar signal
(i) regression curve
(ii) theoretical curve obtained from the theory described
in Sectien 2.4.2 (Fig. 2.8b, curve ii).

- 110 -
60
ref. curve
50
40
30
20
0 -20 -40 -60
relative co-polar signal, dB
Fig. 4.16: Regression curvesforsome rain events with the corresponding
mean wind velocities, and the reference curve obtained from
the theory described inSection 2.4.2 (Fig. 2.8b, curve ii).
4.17a and 4.18a the rate of change, for this event, does not exceed
1 dB/sec for the co-polar signal and 5 dB/sec for the XPD. The greatest
rate of change of the co-polar signal observed during the entire
measuring period is 2.7 dB/sec. Figs. 4.17c-d and 4.18c-d show that the
rate of change increases for higher attenuation and XPD. This is a dis
advantage for control systems designed to compensate adaptively for
large attenuations but an advantage for control systems designed to
maintain a large XPD. The measured rate of change of co-polar signal
and XPD during rain are considerably larger as those presented in Section
4.2.1 for multipath propagation.
Fig. 4.19 finally shows the measured amplitude difference between two
tones spaeed 440 MHz apart, as a function of time, and the corresponding
scatter diagram of amplitude difference and co-polar signal strength.
As expected from the computations presented in Section 2.4.2 it appears

l--1 «J ..... 0 n. I 0 u QJ
.<:: +' 'H 0 QJ 01 s:: «J
..c: u 'H 0
QJ
+' «J l--1
- 111 -
0.6
-0.6
u QJ
0.6 lil
' In rel
..4 «J s:: 01
·.-! lil -0.6
10/10/82 (a)
14.15 14.20 14. 2'$
time, hours GMT
1.0 /
.. M 5 sec. r _;. M = i! sec.
s:: ).. 0 0.8 { -.-! +' ;:l I .Q
·.-! l--1 [ +' 0.6 lil
·.-! 'Cl 1 ~ -.-! 0.4 "lil I .--1
§ I ;:l
0.2 u
10/10/82 (b) 0 >-
-0.8 -0.4 0 0.4 0.8
rate of change of the co-polar signal, dB/sec.
Fig. 4.17: Rate of change of the co-polar signal for rain eventin Fig. 4.15.
a. rate of change in dB/sec for sample period ~t of
2 and 5 seconds
b. cumulative distributions of the rate of change for
~t = 2 and 5 seconds.

.. (Ij .-! 0 a. I 0 (.)
111 ..c: .J.l
11-1 0
111 0'> I:: (Ij
..c: (.)
11-1 0
(!) .J.l <U 1-4
k (Ij .-!
& I 0 (.)
(!) ..c: .J.l
11-1 0
(]) 0'> I:: ll! ..c: (.)
11-1 0
(]) .J.l ll! ..
- 112 -
0.8 6t 2 sec •
0.4
0
ti 111 (}) -0.4 ' al 'Ö
.-! <U -0.8 I::
10/10/82 Ol {c) ·.-l (})
0 -10 -20 -30
relative co-polar signal, dB
0.8 At = 5 sec.
0.4
0 ti Cll Ul
' al 'Ö -0.4
.-i <U I:: Ol
·.-l -0.8 Ul (d) 10/10/82
0 -10 -20 -30
relative co-polar signal, dB
Fig. 4.17: Rate of change of the co-polar signal for rain eventin Fig. 4.15
(cont.) c. scatter diagram of rate of change versusco-polar signal
for l:!.t 2 seconds
d. scatter diagram of rate of change versus co-polar signal
for M 5 seconds.

3
Cl
~
1l -3 +' ...... 0
Q) Ö'
~ 3 ..c: u
...... 0
Q)
+' ~ -3
1.0
0.8
0.6
0
-4
- 113 -
5 sec.
10/10/82 (a)
14. 15 14.20 14.25
time, hours GMT
, ?M M 5 sec.t 2 sec.
" I
I
/
····•· ..... ·· / 10/10/82 (b)
-2 0 2 4
rate of change of the XPD, dB/sec.
Fig. 4.18: Rate of change of the XPD for rain eventin Fig. 4.15.
a. rate of change in dB/sec for sample period ~t
of 2 and 5 seconds
b. cumulative distributions for the rate of change for
~t = 2 and 5 seconds.

114 -
ü lU til
' llt IXl 4 2 sec. rel
0 ll< :< lU ·z
..::: .j.l
..., 0
lU 0 0> s::: ol
..::: u -2 ..., 0
lU .j.l ol -4 ,..
10/10/82 (c)
30 40 50 60 70 80
XPD, dB
ü (!) <Jl
" IXl 4 rel
At 5 sec.
0 ll< :< 2 (!) .c: .j.l
'1-1 0 0 Ql 0> 1:: ol .c: u -2
'1-1 0
Ql .j.l
-4 <U ,.. 10/10/82 (d)
30 40 50 60 70 80
XPD, dB
Fig. 4.18: Rate of change of the XPD for rain eventin Fig. 4.15.
(cont.) c. scatter diagram of rate of change versusco-polar
signal for At = 2 seconds
d. scatter diagram of rate of change versus co-polar
signa! for At = 5 seconds.

2
IXl '0
().) () s::: <IJ 1--1 ().) 0 44
44 ..-i '0
<V -1 '0 ;::; +' ·rl .-1
!§' -2 lil
2
IXl 'd
Q) u c <IJ 0 1--1 <lJ
44 ..... •rl '0
-1 <V 'd ;::; +' ·rl .-1 -2
~
Fig. 4.19
115- I
10/10/82 (a)
14.15 14.20 14.25
time, hours GMT
10/10/82 (bl
0 -10 -20 -30
relative co-polar signal, dB
Amplitude difference measured between two tones spaeed
440 MHZ apart (30 GHZ co-polar amplitude in dB, less
amplitude of 440 MHz phase reference in dB)
a. amplitude difference as function of time
b. scatter diagram of amplitude difference and relative
co-polar signal.

- 116 -
that this amplitude difference is rather small. The negative difference
increases for larger attenuations (Fig. 4.19b). This is due tothefact
that rain attenuation for the 30.000 GHz signal is slightly larger than
for the 29.560 GHz signal.
In order to analyse the short-term fluctuations (rain-induced scintil
lations) of the co-polar signal, power density spectra have been computed,
as described in the letter reprinted in the following section.
4.2.1. ~~~=~~~~~~~-~~!~~~~~-~~~~~~!!~~~~~-~~-ê~~-~-!~~~=~~=~~~~~-~~~~
*
at 30 GHz*
This letter summarises results of measurements of raininduced amplitude seintil lation at 30 GHz on an 8.2 km line-of-sight path in the Netherlands. Power density spectra of this scintillation are compared with those obtained from scintillation caused by tropospheric turbulence.
Regeninduzierte Amplitudenszintillation bei 30 GHz über 8,2 km Sichtstrecke
Diese Mitteilung faBt einige Resultate von regeninduzierten Amplitudenszintillationsmessungen bei 30 GHz auf einer 8,2 km langen Sichtstrecke in den Niederlanden zusammen. Die Leistungsdichtespektren dieser Szintillation werden verglichen mit den Spektren, die sich bei troposphärischer Turbulenz ergeben.
I. Introduetion
Rain severely affects propagation above I 0 GHz, the most conspicuous effects being the large fading and cross-polarization impairments of radio signals. However, since the propagation medium contains a random distri bution of discrete scatterers [I], the resulting radio signa) will be composed not only of the coherently scattered field, but also of an incoherently scattered field component. The coherently scattered part is the average field observed at a receiver, while the incoherent component causes the fluctuations around the short-term average [2]. Most of the available literature is dedicated to the study
Reprinted from AEO, 1983, Vol. 37, pp. 339-340.

- 117 -
and measurement of the coherent field component [3], sometimes supplemented by theoretica} studies of the incoherent field component [2], [4], {5]. The present letter summarises the results of an experiment, set up at the Eindhoven University, in order to measure also the incoherently scattered field component. Power density spectra of the raininduced amplitude scintillation are computed and compared with the spectra obtained from scintillation caused by tropospheric turbulence [6]. All measurements are being performed at 30 GHz on an 8.2 km line-of-sight path between the Eindhoven University (receiver 44 m above local ground) and the Netherlands PTT tower in Mierlo (transmitter 77 m above local ground). The diameter of the receive and transmit antenna apertures is 0.5 m.
2. Experimental Arrangement and Data Acquisition
The baseband signals measured in the 30 G Hz propagation experiment are continuously digitised, with a sampling rate of 2 Hz, using an 8-bit AID convertor. If the 30 GHz copolar signal is attenuated more than I dB below the clear sky level, a 12-bit AID convertor is activaled to digitise the linear copolar amplitude signal with a sampling rate of 40 Hz. In order to avoid probieros with the quantisation noise for the small, rapidly varying component (BPF signal) of the linear copolar signal, this component is first separated from the larger slowly varying component (LPF signal) using the circuit shown in Fig. L The ratio of the amplification of the BPF signal and that of the LPF signal is 64.5, so the quantisation noise for the relatively smal! BPF signal is reduced with 36.2 dB.
The power density spectra of the LPF and BPF signals are computed by spectrum averaging as described previously [6). For the computation of an individual spectrum belonging to a particular record part, the LPF and BPF signals are divided by the mean value A of the LPF signal during that part of the record. The power density spectrum of the amplitude scintillation AA/ A is obtained by adding

Lin. copolar signal
- 118 -
lPf signal
BPF signal
Fig. I. Circuit to separate the LPF and BPF signals; (a) 6th-order Bessel-filter with 0.2 Hz cut-off frequency, (b) all-pass filter with the same phase characteristic as the
Bessel filter, (c) 6th-order Chebyshev-filter with 10Hz cut-off frequen
cy (anti-aliasing filter).
the LPF and BPF spectra in amplitude. Before this is done the frequency components of the LPF spectrum repcesenting quantisation noise (f> 1.5 Hz) are set to zero.
3. Results
Fig. 2 shows the copolar signal for a typical rain event, on 25 September 1982. Power density spectra are computed for the data records in the four time intervals indicated in this. figure. During record (a) the mean attenuation is small, namely 1.2 dB. The slope of the corresponding amplitude scintillation
.!§ -zo 8.. e "' ~ -30 a: CE:
22.00 ZlJO h GMT-
Fig. 2. Copolar signa! for the rain event on 25 September 1982.

- 119-
power density spectrum. shown in Fig. 3 a, agrees with the measured and theoretical slope presented in [6] for scintillation due to tropospheric turbulence. During record (b) the mean attenuation is 6.5 dB. Fig. 3 b shows that for this record the contribution of tropospheric turbulence is smaller while the spectrum tends to flatten at the higher frequencies. This beoomes even more pronounced in Figs. 3c and d. which show the spectra for records (c) and (d) having a mean attenuation of 26.9 and 18.9 dB, respectively.
20
dB Hz
-40
t -60 ~ "X: ~ 0> 3 -20 = ......
dB Hz
-40
,_ Fig. 3. Amplitude scintillation power density spectra for event in Fig. 2; - measured spectrum. -- slope of theoretica} and ~easured spectrum obtained
from Rel. [6] for scintillation caused by tropospheric turbulence~ (LIA/A)2- J-28J.
The contribution of system noise and thermal noise (best measured during stabie foggy conditions) appears to be smaller than -63 dB/Hz for any reduction of the transmitted power down to 35 dB below the clear sky level. Thus. the increase

- 120 -
of the higher frequency components with increasing rain fading cannot be accounted for by these noise contributions but appears to be introduced by the propagation medium tilled with moving discrete scatterers. Raindrops can produce these high frequency components because their dimensions are small (0.05- 0.7 cm [7]) and their fall veloeities are rather high (2.1 - 9.1 m/s [8]). Phase scintillation spectra can also be measured (6]~ the results, which will be separately published, confirm the general trend reported in this letter.
4. Conclusions
The scintillation spectra presenled in this letter show clearly that rain. results in an increase of the higher frequency components relative to tropospheric scintillation spectra in the absence of rain. Comparison of the levels of the flat part of the spectra with the corresponding mean attenuations of the individual measurement records leads to the condusion that during weak fading there is a much more rapid increase of this level for growing attenuation than found for strong fading. Thus, for small rain attenuations the (multiplicative) raininduced scintillation noise could be important while for larger rain attenuations the (additive) thermal noise eventually becomes more important; this agrees with computations based on the theory presented in [2]. This theory prediets that, for our propagation path, the varianee of the rain-induced amplitude scintillation noise (20 log (L1AI A)) increases 10 dB fora (weak) attenuation growing from 1.2 to 6.5 dB (records (a) and (b)). The varianee increases only 2.5 dB for a (strong) attenuation growing from 18.9 to 26.9 dB (records (d) and (c)).
Records sampled ~ith a higher frequency wiJl· be requi red to determine experimentally the cut-off frequency of rain-induced scintillation. which could be of significanee for optimum design of synchronous microwave receivers .. coherent demodulators. and adaptive arrays.

- 121 -
Acknmdedgement
The author is indebted to Prof. J. C. Arnbak for suggesting this research topic.
(Received March 18th, 1983.)
Ir. Mathieu H.A. J. Herben Department of Electrical Engineering TelecommunicationsDivision Eindhoven University ofTechnology P.O. Box 513, NL-5600 MB Eindhoven Netherlands
References
{I] Ishimaru, A., Theory and application of wave pr~pagation and scattering in random media. Proc. IEEE 6S [ 1977]. 1030- I 061.
{2] Capsoni, C., Mauri, M., and Paraboni, A., Incoherent effects in electromagnetic propagation through rain. Ann. Télécommun. 3.2 [1977], 409-414.
[3] Hogg, D. C. and Chu, T. S., The role of rain in satellite communications. Proc. IEEE 63 [ 1975], 1308- 1331.
[4] Ishimaru, A. and Cheung, R. L. T., Multiple scattering effects on wave propagation due to rain. Ann. Télécommun. 3S [ 1980], 373- 379.
[5] Oguchi, T., Effect of incoherent scattering on attenuation and cross-polarization of millimeter waves due to rain: preliminary calculations at 34.8 and 82 GHz for spherical raindrops. Ann. Télécommun. 3S [1980], 380-389.
[6] Herben. M. H. A. J., Amplitude and phase scintillation measurements on 8.2 km line-of-sight path at 30 G Hz. Electron. Letters 18 [1982], 287-289.
[7] Laws. J. 0. and Parsons, D. A., The relation of raindrop-size to intensity. Transact Amer. Geophys. Union 24 [1943], 432-460.
[8] Medhurst, R. G., Rainfall attenuation of centimeter waves: Comparison of theory and measurement. Transact. IEEE AP-13 [ 1965], 550- 564.
Note: The phase scintillation spectra referred to in the above paper
are shown in Fig. 4.20. Forthese spectra, too, we cbserve an increase
of the higher frequency components with larger attenuation. Comparison
of the levels of the flat part of the spectra with the corresponding
mean attenuations of the individual measurement records is difficult:
the contribution of system phase-noise is significant, being at least
94, 39, 59 and 34 percent for record a, b, c and d, respectively.

N ::0
" N -;;; (lJ <J) S-i tJ> <J)
::2 N'
-&
:::!
122 -
10° "' "' '-.)
10-2 "'
(al (b) "'
10°
" " "
(c)
10- 4 L-------------~------------~ (d)
10-1
f, Hz
Fig. 4.20: Phase scintillation power density spectra for rain event
in Fig. 2 of above paper.
measured spectrum
slope of the spectrum (obtained from the paper
reprinted in Section 4.3.1) for scintillation
caused by tropospheric turbulence.

- 123 -
As for scintillation noise introduced by tropospheric turbulence, it is
also possible to compute probability density functions of these signals.
Fig. 4.21 shows, for record b, the probability density function of
, with ~4BPF the output signal of the BPF filter (Fig. 1 of the
above paper). Also shown in this figure is the zero-mean Gaussian dis
tribution with the same varianee as that of 6A3pp!A. It is clear that
the measured distribution does not fit the Gaussian one. However, it is
premature to conclude from this that rain-induced scintillation is not
Gaussian distributed. During record b the varianee of the seintillation
noise varied as a function of time due to a variation of the mean co-
polar signal. Thus, the distribution function shown in Fig. 4.21 is a
distribution function of a non-stationary process which can, although
the signal itself within a certain short period may be Gaussian distri
buted, strongly deviate from a Gaussian distribution. The same 11as been
observed recently for scintillation on a satellite downlink [47].
120
25/9/82
80
40
0
-0.02 0 0.02
Fig. 4.21; Probability density function for recordbof rain event
in Fig. 2 of the above paper.
~ measured values of ~4BPF/A
eoee zero mean Gaussian distribution with the same
varianee as that of

§ 0 N
-30
-40
-50
-60
-70 10-1
0
-10
-20 i
10.40
8/12/81
10°
f, Hz
- 124 -
8/12/81
11.00
time, hours GMT
10°
10-l
"' 0:::
' N
(/)
Ql 10-2 Ql
"' U> <lJ
~
' 10-3 N
-& <l
(b) 10-4
101 10-1
:1;, Hz
Fig. 4.22: Wet-snow eventon 8 December 1981.
a. relative co-polar signal as function of time
b. amplitude spectrum for record (i)
c. phase spectrum for record (i)
(ii) theoretica! slope for turbulence-induced scintillation
(obtained from the theory described in Sectien 2.3.2)
(iii)theoretical curve for rain-induced scintillation
(obtained from the theory described inSection 2.4.3).

125 -
The spectra presented in the paper do nat show the rapid decrease with
frequency obtained from the numerical computations presented in Section
2.4.3 because only frequency components below 10 Hz could be explored
due to system bandwidth limitations. As seen from Fig. 2.14 it appears
necessary to consider frequency components up to 40 Hz to detect this
steep slope.
Nevertheless, the slope was detected a few times, within the 10 Hz band
width, namely during wet-snow events. This may be explained simply by the
much smaller fall velocity of snow flakes in camparisen with raindrops.
Fig. 4.22 shows the relative co-polar signal and the corresponding
scintillation spectra fora wet-snow eventon 8 December 1981. Also
included in Figs.4.22b-c are the theoretica! curves for scintillation
due to tropospheric turbulence (Section 2.3.2, Fig. 2.6) and for rain
induced scintillations. Because the shape of the theoretica! spectra for
rain-induced scintillations varies with rain intensity it was necessary
to compute the mean attenuation of the underlying record, in order to
select one of the nine curves shown in Fig. 2.14.
As seen from Figs. 4.22b-c, the measured spectra for scintillation
caused by wet snowfall campare better with rain-induced scintillation
spectra than with scintillation spectra caused by tropospheric turbu
lence. This is especially so for the more reliable amplitude-seintil
lation spectrum, where phase noise of the equipment is not a problem
(the estimated system phase noise for record (i) shown in Fig. 4.22 -4 2 equals 7.3 10 (degrees) /Hz). FUrthermore, it follows from such a
comparison that the significant fall veloeities of snow flakes are
about half the fall veloeities of raindrops if one ignores any hori
zontal movement of the particles, i.e. assumes a wind velocity = 0 m/s.

- 127
5. AS PART OF A SYSTEM
5. 1.
Following the introduetion of the three theoretical models for the pro
pagation medium in various typical weather conditions in Chapter 2 and
their validatien in Chapter 4, these models can nov; be used to investi
gate the influence of the propagation medium on the intended eperation
of typical radio communication systems. Two aspects of this have already
been considered in Chapter 2, namely, depolarisation (which limits
frequency reuse due to co-channel interference - see Section 2.2.2 and
2.4.2), and distartion (which influences the maximum usable signal band
width see Sectien 2.2.3 and 2.4.2).
In Section 5.2 methods for the adaptive cancellation of rain-induced
cross-polarisation, as observed during the propagation experiments
described in the previous chapter, will be reviewed. A simplified methad
is proposed for application at 30 GHz.
Sectien 5.3 deals with the influence of the measured scintillation on
the tracking of pure continuous-wave (c.w.) signals. Carrier tracking
in the presence of scintillation noise is encountered in a number of
applications, e.g. in adaptive cross-polarisation cancellation networks
using beacons to derive information about the expected depolarisation
(as described inSection 5.2) and in coherent detectors. As an example
the influence of scintillation noise on the coherent demodulation of
phase-shift keyed (PSK) signals will be considered.
It is shown in Section 5.4 that the magnitude and spatial correlation
of phase errors, introduced by tropospheric turbulence in the aperture
field of a reflector antenna, can be compared with those caused by the
reflector surface errors. This allows a comparison between mechanical
tolerances and meteorologically influenced parameters. A reprint of a
paper entitled "Cross-polarisation properties of reflector antennas
with random surface errors" [48] is followed by a comparison of the
degradations of the cross-polarisation discriminatien (XPD) of an
antenna due to these two types of antenna-aperture phase errors.
An extension of this stuày of XPD degradation àue to pure phase errors,
in order to study the combined effect of amplitude and phase errors

- 128 -
introduced by tropospheric turbulence, has yet to be carried out. How
ever, the method presented in Sectien 5.5 fora different purpose lends
itself to such an investigation.
A metbod to reduce interference by sidelobe suppression, using defocused
feeds in reflector antennas, was proposed recently in a letter entitled
"Improved orbit utilisation by interferometric sidelobe suppression"
[49], reprinted in Sectien 5.5. This publication is accompanied by a
secend reprint entitled "Stationary phase method for far-field campu
tatien of defocused reflector antennas" [50], which describes the method
adopted in the fermer publication to compute the radiation pattern of
the extended antenna system. The two reprints are followed by a dis
cussion of the influence of scintillation (caused by tropospheric
turbulence) on the maximum interference reduction that can be realised
with defocused feeds in reflector antennas.
5.2. Review of adaptive cross-polarisation eliminatien
In this sectien methods to cancel rain-induced cross-polarisation adap
tively are summarised, tagether with the methods to obtain the necessary
control signals for such cancellation networks. Further a simplified
method is proposed for application at 30 GHz.
Most of the papers dealing with this subject describe networks designed
for application in a satellite communication system. In that case the
methods are subdivided in uplink and downlink cancellation. A further
distinction is whether the cancellation is performed at the transmitter,
the satellite, or the downlink receiver. This depends on the specific
application and the availability of control signals (beacons).
For a multi-dest~nation satellite link, for instance, the uplink cross
polarisation cancellation may be preferred at the ground station trans
mitter or at the satellite. Downlink cross-polar cancellation, if required,
should be performed at each individual receiving (earth) terminal, because
of the different downlink cross-polarisations. For uplink depolarisation
cancellation the netwerk described by Nouri and Braine [51] can be used.

- 129 -
This "forward" depolarisation cancellation concept is based on obtaining
a zero depolarised signal at the satellite. This is achieved by trans
mitting from the earth station the {desired} co-polar signal, plus a
suitable orthogonally polarised correction signal which cancels the up
link depolarisation. The information about the amplitude and phase of
the correction signal is derived from a beacon signal to be generated by
the satellite (incidentally,this methad can also be used for adaptive up
link power control [51]}. Note that it is assumed that the correction
signal ltself is not depolarised.
For the downlink cross-polar correction, the cancellation methad proposed
by Paraboni and Rocca (described in [52]} can be used. Here it is assumed
that two orthogonally polarised transmitted signals are received. At the
receiver, a portion of the signal from each channel is coupled out,
attenuated and phase shifted sa that it is equal in amplitude and 180
degrees out of phase with the interfering signal in the other channel.
Information about the required attenuation and phase shift can be ob
tained from a cross-correlation between the two information signals.
For the case of multiple uplinks,_Lee [53] showed that it is possible to
cancel up- and downlink depolarisation using beacons generated by both
the ground stations and the satellite. The number of beacons can be re
duced if there is a known relation between up- and downlink depolari
sation available [54]. Whether such arelation exists in a deterministic
sense, ar only in the mean, is a matter for further investigation.
All the methods using beacons to derive information with respect to the
expected depolarisation are in fact only suitable for narrow-band com
munication systems. Perfect cancellation is obtained only at the design
frequency {the frequency of the beacon signal}, so distartion {see Fig.
2.11} may limit the utility of this method.
Chu [55, 56] presented a methad offering braadband cancellation. In his
approach the two interfering•signals remain in the same circular wave
gulde until all cancellation operations are completed. The network con
sista of a differentlal phase shifter, a differentlal attenuator and an
orthomode coupler. The differentlal phase snifter converts the two el
liptically polarised waves into two linearly polar!sed waves. The differ
entlal attenuator makes the latter orthogonal~ The orthomode coupler,

- 130 -
finally, separates the two orthogonal waves. For a practical realisation
of this method, see 1 58] •
At 4/6 GHz, where the rain-induced depolarisation is mainly caused by a
differential phase shift, only part of Chu's network is needed. Such a
network has been used successfully by COMSAT
Whether an adaptive cancellation netwerk will perfarm adequately depends
on its time constant and the rate with which the control signals (beacons)
change during critical events. For the 30 GHz terrestrial line-of-sight
link, for instance, the largest measured rate of change of the XPD was
5 dB/sec (see Section 4.4), while tropospheric turbulence and rain can
cause beacon fluctuations (in amplitude and phase) with frequency compo
nents up to 10 and 40 Hz, respectively. These frequencies depend on the
reflector diameter of the receiving antenna and the wind velocity ex
perienced on the propagation path (see Sections 2.3 and 2.4).
5.2.2.
While at 4/6 GHz differential phase shift (~~) is the main cause for
rain-induced cross-polarisation, the differential attenuation (~) is
the main cause
60
50
I:Q <0
40 Q P.. x
30
20 0
Fig. 5.1
at 30 GHz. This is indicated in Fig. 5.1, showing the con-
40 80 120
rain intensity, mm/hr
Cross-polarisation discriminatien (XPD) as a function of
rain intensity (i) for the 30 GHz l.o.s. path (Crane's
rain model; Laws and Parsons dropsize distribution; mean
canting angle <00a> = 8.5 degrees, standard deviation of
canting angle 43 degrees; vertical polarisation).
(ii) differential phase A~ = 0
(iii) differential attenuation ~ 0.

131 -
tributions of differential attenuation (A~ = 0) and differential phase
shift (~ = 0) separately,according to the theory described in Sectien
2.4.2. Tbus, at 30 GHz too, only part of Chu's cancellation network is
needed; the differential phase shifter can be omitted in this case.
5.3. Carrier tracking in the preserree of scintillation noise
Tracking of a carrier in scintillation noise is necessary for a number
of purposes
(i) in coherent detectors
(ii) in compensation networks (adaptive fading control and/or cross
polarisation cancellation networks) as described in the previous
section.
For both purposes, the total phase error depends on the part of the phase
scintillation noise cr~~ which is not tracked by the PLL used for the
carrier recovery. A simple but sufficient model uses the equivalent loop
bandwidth Br• Then 1J
is given by
with (f) the phase scintillation spectrum.
(5. 1)
Scintillation noise may be a cause of errors in coherent demodulators
of phase-shift keyed (PSK) radio signals using a phase-locked carrier
recovery loop. During a large percentage of time the varianee of sein
tillation noise introduced by tropospheric turbulence will be larger
than, or comparable to, the varianee of thermal noise. However, this
qoes not mean that its impact will be of greater importance, because
there is an essential difference in the shape of the spectra for the
two types of noise. In the next section their influence on the coherent
demodulation of PSK signals will be compared.
In this section use will be made of the theory described by Cahn [60]
for the performance of multilevel PSK systems in the preserree of ther
mal noise. In his analysis he assumes that the signal consists of phase-

- 132 -
modulated pulses of specified width, transmitted at a known repetition
rate. The signal is sampled in the receiver at the pulse peaks. Each
ideal sample has the form
s(t) 12§ cos(w t + 0) c (5.2)
where S is the received signal power, wc is the angular centre frequency
and 0 may have any value in the discrete set 2~i/m~ 0 < i < m-1.
Maximum likelibood detection is presumed [61], with equal apriori pro
bahilities for the possible phases ei. For an m-level PSK signal the probability of an error due to the additive
white thermal noise with power N is the probability that the phase of the
signal plus noise will be displaced outside the sector -n/m < 0 < n/m, if
zero is the undistorted or true phase.
The probability density function p(0) of the phase of the noise-degraded
signal was found to be given by [60]
p(0) l_ exo.(-8/N) [1+.!4TfS7N cos0 exo{ (S/N) cos20} 2n - -
Q (/2S/N cos0))
where Q(x) is the probability integral defined by
11 1 x 2 Q(x) =- J exp(-x /2)dx
/21T -oo
For reasonably large values of x, this can be approximated by the
asymptotic expression
2 Q (x) "' 1 - exp(-x /2) ; x » 1
.121î"x
(5.3)
(5.4)
(5. 5)
For applications with m > 4 and S/N >> 1, Eg. 5.3 then simplifies to
The probability of error
;
;
<~ 2
(5.6)
as a function of signal-to-noise ratio (S/N)

- 133 -
and the number of phase positions (ml can be obtained by integration of
p(0) according to
p = 1 -e
rr/m f p(0)d0
-rr/m
- /28' . (Tf) VT SJ.n-
"' 1 - - 1- f m exp{-cy;{ sin0J2/2} d(\/jf sin0)
121f_ %8' sin(-::!.) VT m
= 2{1- Q r\/ 25 . sin!!..)} (5. 7) N m
Let us now include the contribution of a Gaussian distributed phase
scintillation noise with varianee cr~$' as justified by Section 4.3.1.
Taking this scintillation into account Eq. 5.7 becomes
p e 1
1T $ +oo m
1 f d$ f ----121iaÁq, -oo 1T
<IJ m
2 2 d0 p(0) exp{-$ /(2a~$ )}
+oo . ·~
1 f { . ffs' . Tf } { I 2S . . Tf } "' 2 - --- [ Q y N sJ.n(iiï- $) + Q \ N sJ.n(iiï + $) ] I21T a Áq, -oo
(5. 8)
2 with 0Áq, that part of the phase scintillation noise which is not tracked
by the PLL used for carrier recovery, as given by Eq. 5.1. The integral
in Eq. 5.8 is computed numerically for the <IJ values for which Eq. 5.7 is
valid, namely lq, +'!!..i < ::!.2
• As seen from Fig. 1 of Sectien 4.3.1, this is -m
no serious restrietion for m > 4.
As an example Pe was computed using the measured phase scintillation
spectrum presented inSection 4.3.1. The Doppler shifts due to machanical
oscillations of the buildings were omitted by approximating the spectrum
by a straight line in the region .1 - 10 Hz and extrapolating this line
for frequencies below 1 Hz and above 10 Hz.
The results are shown in Fig. 5.2 for EL = 0.1, 0.5, 5 and 10 Hz with
the number of phase levels m 4, 8, 16 and 32.

10
Fig. 5.2
- 134 -
20 30 40 S/N, dB
Character error rate Pe as a function of S/N for an m-PSK
coherent demodulator, taking the contribution of turbulence
induced amplitude (*) or phase scintillation noise (curves
with the loop bandwidth EL as parameter) into account.
It is seen from the figure that for loop bandwidths larger than 5 Hz the
contribution to Pe of the phase scintillations caused by tropospheric
turbulence is negligibly small. The same appears to be true for the
contribution to Pe of the amplitude scintillations, also included in the
figure and found in the same way as above.
The carrier loop bandwidth EL can be chosen larger than 5 Hz, whenever
the pulse signalling rateis considerably higher than 5 s- 1 . Thus onlv
low-speed synchronous data communication, as on deep-space telemetry
links to the earth, may be degraded by tropospheric scintillation. If
no limitations on signal pulse bandwidth exist for these links, m should
be chosen as smallas possible (Fig. 5.2).

- 135 -
The very small impact of scintillation noise can be explained by the
fact that this type of noise bas a very narrow power spectrum. It is
expected that in case of differential demodulation the contribution to
will be even smaller, since tbere will be almost complete noise eerre
lation between two subsequent cbaracters.
Note that the P used throughout this sectien stands for the probability e that the transmitted character will be received incorrectly. In many
cases, however, the information to be transmitted is in binary form and
must be coded for an m-phase system. The character error rate and bit
error rate are not usually equal under such circumstances.
5.4.
5.4.1. with random
Indexing terms: Antennas, Reflector antennas
The crosspolarisation properties of symmetrie front-fed parabolaids with random surface errors are investigated. Average crosspolar far-field pattems and crosspolarisation discriminations are computed for different RMS surface errors. The influence of the correlation interval and pbase-error model used is indicated.
Introduction: Reflector surface errors determine the maximum frequency at which a reflector antenna can opera te. 1 The radiation properties of a reflector antenna with deterministic reflector surface errors may be obtained by the computation of the far-field integral of the antenna, in the way carried out recently by Rusch and Wanselow for an umbreUa reflector antenna. 2 In the event of random surface errors, such as manufacturing tolerances, it is only possible to delermine the expected value of the radialion in a given direction. Theories are available to compute the copolar pattem3 and the on-axis crosspolarisation discrimination (XPD).4
·5 However, for com
munication satellite antennas, the off-axis crosspolar radiation
* Reprinted from Electranies Letters, 1983, Vol. 19, pp. 49-50.
The sign of tbe XPD in this reprint bas been changed from the original
publication, in order to conform to the general convention adopted in
tbis thesis.

- 136 -
is also very important, especially if tbe main lobe of tbis antenna is composed of spotbeams to reaJise a prescribed coverage.6
Tbis letter describes a metbod to delermine the crosspolar pattern of a reflector antenna witb random reflector surface errors. Starting point is tbe well-known tbeory by Ruze. 7 Numerical results wiJl be presenled for a front-fed parabolic reflector antenna. Tbe computed XPD values are compared witb tbose obtained by Gbobrial.4
Analysis: Reflector surface errors may modify tbe amplitude, pbase and polarisation of tbe electrical field in tbe antenna aperture. Because of the relatively small variations in distance from tbe focal point to the reflector surface (RMS surface error s <C focal length F), the amplitude of the copolar aper• ture field is not essentially affected. For the same reason tbere is little additional crosspolar field in the antenna aperture as well. Therefore, tbe amplitude of the crosspolar field remains virtually uncbanged over tbe entire antenna aperture. Tbis means that tbe far "field of a reflector antenna suffering from surface errors, but baving zero crosspolarisation in tbe antenna aperture, remains a far-field pattern free of crosspolarisation. F or antennas with a nonzero crosspolar aperture field, however, the phase errors on tbe antenna aperture will redistribute the crosspolarisation in the far field. 8 In order to delermine tbe crosspolar far-field pattern, tbe first part of Ruze's tbeory 7 may be used. In bis analysis an aperture iliumination correlation function 4>{t) is defined as
4>( ) _ I f(r)f(r + 1:) dS t - I [f(r)]2 dS
(1}
with r = an aperture vector position variable, t = vector difference between two aperture position variables, f(r)- aperture illumination function and dS- an elemental aperture area.
Ruze assumes that tbis aperture illumination correlation function is unity because the correlation interval c is much smaiJer than the reflector diameter D.
Vu shows in bis paper that this assumption causes serious errors in the computation of the average copolar far-field pattern. 9 This also appears to be true for the computation of tbe average crosspolar far-field pattern. Therefore, the crosspolar aperture illumination correlation function is computed numerically using eqn. 1, f(r) being the crosspolar aperture illumination function.

- 137 -
Computed results: In order to compare our computed results with those obtained by Ghobrial" we wiU perform our computations for a front-fed parabalie reflector antenna with F/D = 0·2S and illuminated by an electrical dipole feed. Fig. 1 shows the computed average crosspolar far-field pattem of this antenna for different normalised RMS surface errors t./l. From this Figure it can be seen that the far-field crosspolarisation is indeed redistributed, resulting in a decreas.,. of the peak crosspolarisation and an increase of the on-axis crosspolarisation; also the otf-axis deep nuiJs are fiJled in. Using the computed on-axis crosspolarisation and the on-axis copolar component given by Ruze, 7 the crosspolarisation discrimination XPD is calculated.
0 8 16 u - (trO/>.) sin 9
Fag. 1 Average crosspolar far..,jield pattern for different normalised RMS surface errors 8/ À
Normalised correlation interval 2c/D = 0·031 -- 8/À=O
8/À = 0·05 . 8/À = 0·08

- 138 -
Fig. 2 shows this XPD as a function of the normalised RMS surface error e/À. with the normalised correlation interval 2c/D as a parameter. Also shown in this Figure are the results obtained by Ghobrial. Part of the differences between our curves and those of Ghobrial may he explained by the fact that Ghobrial did not take the influence of the correlation interval c on the copolar component into account. Fig. 2 shows that for large values of c this influence may not be neglected. The remaining differences may be caused by the fact that Ghobrial used the flat-bat modeV while we have used the more realistic Gaussian-hat model. 7 The flat-bat model results in larger effective aperture phase errors than does the Gaussian-hat model, at a given surface error e.
ID "'0
ei a... x
0·08 0·10 0·12 [illill
Fi&- 2 Crosspolarisation discrimination XPD as a function of normu/ised RMS surface error t/1 with the normalised correlation interral 2c/D as a parameter
--XPD - - - - XPD without taking into account the influence of the cor-relation interval c on the copolar gain - ·- · XPD obtained from Reference 4 (only shown for 2c/D = 0·354 and ()-125)

139 -
Conclusions and observations: Part of Ruze's theory can be used for tbe computation of the crosspolarisation properties of reflector antennas with random surface errors. However, it is necessary to determine tbe aperture illumination correlation function exactly. Tbe computed average crosspolar pattema show that tbe crosspolarisation is redistributed in tbe far field. Tbe measured shift of tbe crosspolar lobes reported in Relerenee 1 o· cannot be explained with the results of our computations.
Neglecting tbe influence of the correlation intervalcon tbe copolar gain and using tbe flat-bat model, will overestimate tbe effect Ç>f reflector surface errors on tbe crosspolarisation discrimina ti on.
J. M. M. VISSERS• M.H. A. J. HERBEN E. J. MAANDERS
Eindhoven University ofTechnology Department of Electrical Engineering T elecommunications Di vision PO Box 513,5600 MB Eindhoven, Netherlands
• Formerly with Eindhoven Univcrsity
Referenees
lst December 1982
I HANSEN, R. c.: 'Fundamental limitations in antennas·. Proc. IEEE, 1981,69,pp. 170-182
2 RUSCK, W. V. T,. and WANSELOW, R. D.: 'Boresipt-gain loss and correlated sidelobes of an umbrella reftector•, IEEE Trlllls., 1982., AP-30. pp. 153-157; errata. ibûl., p. 526
3 LOVE, A. w. (Ed.): 'Reftector antennas' (IEEE Press 1978), part VIII, pp. 291-336
4 GHOBIUAL, s. 1.: 'Axial cross polarisation in reftector antennas with surface imperfections•, ibid., 1980, AP-28, pp. 610-616
S MILLI!R, P. a.. and POULTON, o. T.: 'Cross polarisation in front-fed reftector antennas possessing surface errors'. lEE International Conference on antennas and propagation, London, 28-30 November 1978, Conf. Publ. 169, Pt. 1, pp. 418-421
6 HERBEN, M. H. A. J., and MAANDERS, E. J.: 'Some aspects of contoured beam antennas'. Ibid .. pp. 184-188
7 RUZE, J.: 'Antenna toleranee theory-a review', Proc. IEEE, 1966, 54, pp. 633-640 '
8 MILLI!R, P. R.: 'The cross polar performance of imperfect, front-red, reftector antennas'. lEE Conference on radio spectrum conserva· tion techniques, London, 7-9 July 1980, Conf. Publ. 188, pp. 117-121
9 vu, T. a.: •Jnftuence of correlation interval and iliummation taper in antenna toleranee theory', Proc. lEE, 1969, 116, (2), pp. 195--202
10 GHOBJUAL, s. 1.: •Gain and crosspolarisation of reflector antennas with surface errors'. 1978 InternationaliEEE antennas and propagation symposium digest. pp. 253-256

- 140 -
5.4.2. ç~~~~:~!~~!~~~!~~-E~~E~~~!~~-~~-~~~!~~~~~-~~~~~~~~-!~-~~~
2~~~~~~~-~~-~~~~~e~~~!~-~~~~~~~~~~
Random phase errors in the antenna aperture may degrade the radiation
pattern of aperture antennas seriously. Phase errors can be caused by
random reflector surface errors. The resulting degradation of the co
polar pattern was first examined by Ruze [62]. Intheletter reprinted
in the previous section, the corresponding degradation of the cross
polar pattern was discussed.
In addition to mechanica! limitations, the phase errors in the antenna
aperture could conceivably also be caused by tropospheric turbulence,
which would thereby limit the spatial and polarisation filtering capa
bility of an antenna system.
The random phase errors in the antenna aperture due to tropospheric
turbulence will now be put in a form such that the theory of Ruze [62]
and the extended theory described in Section 5.4.1 can be used to deter
mine the antenna pattern degradation (in an ensemble-average sense). The
advantage of this is that in this way the two degradations may be oom
pared directly. This may lead to a lower bound on the reflector surface
errors, given the strength and spatial extent of tropospheric turbulence.
The spatial autocorrelation function C~(T) for the phase $ in the plane
of the receiving aperture is, in the event of a plane wave, given by [18]
- A - --C~(T) = < $(r) ~(r+T) >
L J ds 0
00 2 J dK (1 +cos KOS) K $ (K) J (KITIJ ., n o 0
(5.9)
with randT as defined inSection 5.4.1 and < > denotes the ensemble
average.
Ruze [62], on the other hand, adopted the following expression for the
varianee function for the phase in the aperture
= 1-12 2 {1- exp(- T /a)} (5. 10)

- 141 -
with
(5.11)
and the correlation interval a and the r.m.s. surface error s as intro-
duced inSection 5.4.1.
The general relation between C~(T) and D~{T) may be obtained from their
definitions (see Eqs. 5.9-10)
(5.12)
which with Ruze's particular assumption yields
~ ,-,2 2 ö {1 - exp (- T /a )} = c~rTJ
ccprTJ (5.13)
2 with a~~ the phase varianee in the tropospheric turbulence model.
In the limit of complete correlation ITI ~ 0 this equation approaches
the theoretica! identity a~cjl = C~(O). It is also possible to match the
left-hand side and right-hand side of the equation for lil ~ oo by noting
that, physically, the phase varianee function should reflect the comple
tely uncorrelated nature of cjl(r) and cjl(r + T) in that case. This leads to
(5.14)
Now the phase varianee functions agree for small and large values of
lil. Although the shapes of the two functions are similar, they still
differ for intermediate values of lil. The correlation interval a is
the only parameter left to equalise bath functions for a given value
lil. It follows from Eqs. 5.13 14 that this correlation interval is
given by
(5.15)

- 142 -
By this curve-fitting exercise it is now possible to praeeed according
to the mathematica! approach of Ruze, with the extension presented in
t~e paper reprinted in Sectien 5.4.1.
Fig. 5.3 shows c as a function of ITI for an earth-satellite path at an
elevation angle 6 . 30 degrees. Eq. 2.20 is used for ~ (K), with
C2 -- 5.1o- 12 m- 2~1 ( t b 1 [18]) th n · l no strong ur u ence • Fur ermore, an exponent~a
decrease of the strengthof turbulence with height is adopted [18]. It is
seen that c depends only slightly on frequency but depends strongly on
the outer scale of turbulence The corresponding values of the norma-
lised r.m.s. surface error E/À are given in Table 5.1. As expecte~ c/À
increases if the frequency increases. Noting that the distance !Tl be
tween two arbitrary points can not exceed the diameter D of the antenna
aperture, it is seen from Fig. 5.3 that for reflector diameters up to
10 m, 2e/D will be at least 2.5, 2.6 and 2.6 at 6, 30 and 100 GHz,
respectively, for any possible pair of aperture points. This assumes an
outer scale of turbulence of 10 m. For larger values 2c/D becomes
even larger.
Phase errors in the antenna aperture introduced by tropospheric turbu
lence can therefore best be compared with aperture phase errors intro
duced by mechanical reflector surface errors with a large correlation
interval e, such as deformations caused by wind, gravitational sags,
and thermal stresses.
In order to investigate the influence of aperture phase errors caused
by tropospheric turbulence on the on-axis cross-polarisation discri
minatien (XPD) of a reflector antenna system, it is therefore necessary
Table 5.1 Normalised r.m.s. surface errors c/À corresponding to
the curves shown in Fig. 5.3.
(GHz) L (m) E/À 0
6 10 2.36
30 10 1.24
100 10 4.18
100 20 7.50
100 30 1.05
100 40 1.34
100 50 1.61

143 -
40 vii
vi
V
s 20
0
0 2 4 6 8 10
1-r I, m
Fig. 5.3 The correlation interval c as a function of the
di stance I i= I between two points in the plane of
the receiving aperture for an earth satellite path.
(i) +' 6 GHz; = 10 m J
(ii) f 30 GHz; = 10 m
(iii) f' 100 GHz; 10 m
(iv) L' 100 GHz; 20 m J
(v) f' 100 GHz; 30 m "
(vil f 100 GHz; L 0
40 m
(vii) f' 100 GHZ; L 50 m. J ()
to extend the computations to larger values of 2c/D than those con
sidered inSection 5.4.1 (Fig. 2).
Fig. 5.4 shows the aveiage XPD as a function of 2c/D for those values
of which would correspond to strong tropospheric turbulence at
30 and 100 GHZ (L = 10 m; c2 = 5.10-12 m-2/3; 6 el 30 degrees). It 0 no
appears that for 6 GHz the XPD is always better than 50 dB. The improve-
ment of the discriminatien for large 2c/D values is caused by a decrease
of the effective aperture phase error for these large 2c/D values. The
peak corresponds to c D/4. Very recently Jervase and Ghobrial [63]
independently reported the existence of this peak. As seen from Fig. 5.3
the worst-case value cannot occur for L0
> 10 m, f < 100 GHz and D <
10 m.
Furthermore, it can be seen from Fig. 5.4 that when 2c/D is larger than
the previously mentioned value 2.6, the decoupling is larger than 50 dB
at 30 GHz, and larger than 40 dB at 100 GHz. The decoupling will decrease

- 144 -
with decreasing alevation angle eez because of &l increase of the path
length through the turbulent troposphere. The results for alevation
angles of 30 degrees and smaller are presented in Table 5.2.
Thus it appears that for practical. situations the phase error caused by
tropospheric turbulence will not seriously degrade the XPD of an
antenna system. This is mainly due to the relatively large value of the
correlation interval a. The degradation would become important only for
very large antenna apertures, very high frequencies or very small values
of the outer scale of turbulence tagether with a small alevation angle.
The combination of very high frequencies and very large antennas is
used in radio astronomy. A very small outer scale of turbulence can
occur in a town environment where the turbulence can be man-made, for
instanee if there is an output of an air-conditioning plant near
fg
0 ll< ~
Fig. 5.4
25 L 10 m ;\•4.18 0
10-2
30 <100 GHzl
35 I \
(\ \ I
40 \ I \
45 \ -2 I
/À;••L24 10 . \ (30 GHZ) \ \
50
10-2 10-1 10° 101
2c/D
The cross-polarisation discriminatien (XPD) as a
function of the relativa surface-error correlation
interval (2c/D) in the antenna aperture, for those
values of €/À which correspond to tropospheric
turbulence for 30 and 100 GHz (see Table 5.1).
the propagation path (64}. The latter may be important for business
radio communication systems, e.g. terminals placed on rooftops.

145 -
Table 5.2 The cross-polarisation discriminatien (XPD} for different
elevation angles eel'
eeZ. (degrees) XPD (dB)
f=6GHz f= 30 GHz f = 100 GHZ
2a/D = 2.5 2a/D = 2.6 2a/D = 2.6
30 53.8 41.3
25 52.8 40.4
20 51.6 39.3
15 50.2 37.8
10 > 60 48.1 35.6
5 44.9 31.6
4 43.8 30.3
3 42.5 28.7
The combined effect of amplitude and phase aperture errors,introduced
by tropospheric turbulence,on the XPD degradation ("filling in" of a
null in the cross-polar pattern) may be obtained from computations
similar to those to be presented in the riext section for the nulls in
the co-polar pattern.
5.5. Interference reduction by antenna sidelobe suppression
lndf!xing lf!rnr!i: Re.flector antemras, Satellite li11ks
Auxiliary defocused reeds with weak excitation can be used to cancel or reduce specific near-angle sidelobes of double reftector antennas. Existing earth termi~als may be upgraded in this way to provide improved isolation between interfering satellites when the tight station-keeping tolerances agreed at WARC-79 come into force.
ln~rocluction aml background: With the increasing use of N-S station-keeping and the tight E-W toleranee (± 0.1°) recently laid down for the fix.ed satellite service,1 it may become feasible to co-ordinale two potentially interfering satellite networks2
* Reprinted from Electranies Letters, 1980, Vol. 16, pp. 937-938.

146
by deterministic reductions of a very limited number of sidelobes in the respective earth terminals. In existing reflector systems, this may be achieved more readily than any general reduction below the applicable statistica! sidelobe envelope. 3
One approach would be to exploit the scanning capabilities of the reflector to cancel interference in the required direction(s) with a defocused feed system. Realisation of cancellation networks has been demonstraled for terrestrial interference received through far-angle sidelobes.4 This letter summarises an initia I study of the scope of near-angle sidelobe suppression by feed interferometry. The study is motivated by the potential system value of a low-cost modernisation option,s basedon a simple retrofit of the many existing terminal facilities presently constraining the utilisation of the geostationary orbit.
x
"" z
/ Fig. I Geolll('/ry. co-ordinale.\ anti .\rmhols of tlouhle reflector ,\.\'Slt'm
a Feed locus. minimisation of abcrrations 7
h Feed locus. minimisation of unwanted aberrations in eqn. I
Scanning properties of exislinyf(;u:i/ity: The geometry and symbols pertaining to the double reflector system are shown in Fig. 1. The scanning pattern is determined from the amplitude, phase and polarisation of the aperture-field vector E (Reference 6) set up by the offset feed, which is assumed to have the polarisation of a Huygens source. The phase distribution is derived from the geometrical distance along optica! rays from the feed phase centre to the aperture plane of the main reflector and is approximated by
t/l(r', tP') = cxo + IXt r' cos q,· + a. 2 r' 2 + a 3 r' 2 cos 2 tP' + et4r'
3 cos q,· + cx 5 r'*
* Eq. 1 represents all first- and third-order aberrations
(1) * ].

- 147 -
for offsetting of the feed in the plane 41' = 0. The unwanted aberrations (corresponding to tl;, i~ 2) can be minimised by locating the feed on a particular surface. This is found to be parabolic, if merely quadratic aberrations (corresponding to t1 2
and t1 3 ) are minimised along the aperture rim of a Cassegrain system. 7 For greater precision. and to study more general double reflector systems, it is desirabie to extend the minimisation to the varianee of a sum of unwanted aberrations over the entire aperture plane, in the manner recently demonstraled for the front-fed paraboloid. 8 Th is extension has been incJuded, using the amplitude aperture distribution derived from the ray tube concept,9 as a weight function in the determination of the feed locus for beam scanning with minimum aberration.
The complex scanning patterns are computed using a stationary phase method recently descri bed, 1 u suitably modified fora defocused axisymmetric reflector system. The calculations were basedon a symmetrie feed radiation pattern modelled as a power of a eosine. 6
Sidelobe suppression: The objective is to minimise the copolar sidelobe field in N sampling points of the complex radialion pattern E0 . Assuming unit excitation of the focused feed, the complex excitation C of a single auxiliary feed is given by
l.t I E0 ;j I E,;j cos (arg C + arg E,; arg Eo;) I
I c I = •= I N
L I Esd 2
i: I
~- I I Eod I E.d sin (arg E,; arg E0 ;) I -I 1 i= I arg C = tan '---:.,",........:;.-------------
~ if:t I Eo; 11 E,d cos (arg E . .; arg E0 ;) 1
Obviously. the focused sidelobe copolar sample values E0 ;
could ideally be calculated as a special case of the above procedure. For compensation of significant near-angle sidelobes caused by correlated reflector errors or forward scattering from subreflector support struts, 11 realistic measured sidelobe samples should preferably be substituted in eqns. 2 and 3. These sidelobe(s) will be suppressed by a scanned mainlobe pattern, so the computed copolar samples E,; ofthe latter
~Eqs. 2 and 3 are obtained by miniruising the quadratic objective function
N
J. I + i=l

148 -
are hardly affected by such perturbations and can be used in eqns. 2 and 3.
Numerical example: For an existing Cassegrain system (with F/D = 0·32. D/Ds = 11-1, a= 0·623 and D/l = 200) the optimum feed loci for scanning as determined from Reference 7 and the above procedure, respectively, are shown in Fig. 1. For small scan angles, these surfaces are almost identical. The reed was inclined during scanning to minimise spill-over at each position; the feed pattern assumed throughout was that giving maximum system gain in the focused position. Fig. 2 shows the
e .degrees I!Iml Fig. 2 Gain pattern in plane tP = 0
a Pattern with focused feed b Pattern with feed offset 7·09l (radially) and 4·47.l. (axially) in plane t/l = 0
~[ 45~
- 40 qs 35 !:. 3
8,25 20 1
1 5
~''-3-o-'-"-l-2·5--20 4·5 -O·S o o 5 10 9,degrees
Fig. 3 Examples of siclelobe suppression
a Pattern b of Fig. 2 excited by 20 log IC I = - 33·1 dB: arg C = - 2·84°, resulting in deep null b Pattern h of Fig. 2 excited by 20 log IC I = -29-2 dB; arg C = - 3·25°, resulting in wider suppression beyond 40 dB isolation level

- 149 -
corresponding focused power pattem in the plane t/J = 0 (calculated with subreflector bJockage included) and a beam scanned in this plane to an angle of 8 = - 1·06° by offsetting the feed by 7·09 wavelengtbs radially and 4·47 wavelengtbs axially. In the plane t/J = 0, the crosspolar field vanishes.
Fig. 3 demonstrales sidelobe reduction based on complex superposition of these two patterns. Complete suppression at one sample point as well as reduction to the -40 dB level (relative to boresight gain) at N = 17 sample points in a wider region covering the maximum orbital spacing toleranee ( ± 0·2°) can be obtained by adjusting the normalised complex excitation C of the auxiliary feed suitably.
Obserr•ation.,: Sidelobe suppression corresponding to substantial improvements of mutual isolation between adjacent satellites has been obtained. Further investigations of gencric and specific double reflector configurations are being carried out to delermine the scope of the improvements. when crosspolar performance, wide signal bandwidth, reed system di mensions, 12 excitation tolerances or scan limitations constraio the optimisation procedure.
M. J. S. VAN OMMEREN• M. H. A. J. HERBEN J. ARNBAK
Telecommunication.~ Di!~ision Departmem of Elec:trical Engint•ering Eindhoren Uni1·enity c>f" Te,·hnology PO Box 513, N L-5600 MB Eindhoren, Nc•therlamls
17th October 198(1
• Now with Hollandse Signaalapparaten B.V., Hengelo. Netherlands
Keferences 1 Final acts of the 1979 World Administrative Radio Conrerence.
Artiele 27 (ITU. Geneva. December 1979) 2 I bid., appendix 29 3 CCIR, XIVth Plenary Assembly, Rec. 465-l, IV (ITU, Geneva,
1978) 4 WHITE, N., BRANDWOOD, D., and RAYMOND, G.: 'The application of
interrerence cancellation to an earth station'. Proc. Conr. Satellite Communications System Technology, London, 7-10 April 1975 {lEE Conf. Publ., 126. pp. 233-238)
5 MASON, L.G., and COMBOT, J. P.: 'Optima) modernization policies ror telecommunications racitlties', IEEE Trans., 1980, COM-28. pp. 317-324
6 SILVER, s.: 'Microwave antenna theory and design' (Dover, New Vork, 1965)

5.5.2.
- 150 -
7 GN'ISS, H., and RIES, G.: 'Bemerkungen zum Konzept des äquivalenten Parabols bei Cassegrain-Antennen', Electron. Lett., 1970,6, pp. 737-739
8 MRSTIK, A.v.: 'Scan limitsof ofT-axis fed parabolic reflectors', IEEE Trans., 1979, AP-27, pp. 647-651
9 COLLIN, R. E., and ZUCKER, F. J.: 'Anten na theory' (McGraw-Hill, New York, 1969), pt. 11, pp. 10-13
JO fUiRBEN, M. ti. A. J., MIDDELKOOI', R., and GIELKENS, f. J. J.: 'Stationary phase method for far-field computation of defocused reflector antennas', Electron. Lelt., 1980, 16, pp. 519-521; Errata, ihid., 1980, 16, p. 644
ll MONK, A. o.: 'The control of wide-angle radialion from satellite ground stations'. Proc. Conf. radio spectrum conservalion techniques, London, 7-9 July 1980 (London, lEE 1980), pp. 127-131
12 DOMBEK, K. P.: 'Dielektrische Antennen geringer Querabmessungen als Erreger für Spiegelantennen', NTZ. 1975, 28, pp. 311-315
reflector antennas*
I ndexing terms: AnteliiUis, Radkition
Computation of the far field of a defocused reflector antenna using the stationary phase metbod is described. The positions of the stationary phase points are determined, to eliminate one of the two numerical. integrations of the ràdiation integraL Examples of scan patterns and computational time saving are presented.
lntroduction: In tbe design of contaured beam antennas consisting ofa reflector and a feed cluster1
•2 an efficient metbod is
requîred for tbe computation of tbe radialion pattern of a defocused reflector antenna, botb in amplitude and pbase. The radialion pattern corresponding to one feed element can be expressed as a two-dimensional integral over tbe reflector surface. The complex inlegrand is a fast asciilating function of one of the two inlegration variables. Tbis means that direct numerical computation is very time-consuming. One metbod of solving tbis problem is the series representation described by Galindo-Israel and Mittra. 3 Another, simpler, possibility is to eliminale one of the two integrations using the stationary pbase method.4 The resulting one-dimensional inlegral bas an integrand wbich is a slowly varying function of the inlegration variable. Tbis method bas been developed to compute the far
* Reprinted from Electranies Letters, 1980, Vol. 16, pp. 519-521.

- 151 -
)(
y ' I '~I
\;..-j \ I \I
z -J /
/ / / /
/ / / /
/
116111 1
Fig. I Geometry of defocused symmetrical parabalie reflector antenna
field of a symmetrical parabolic reflector antenna with a defocused feed. The results are compared with those computed by double integration. The influence ofthe small angle approximation on the amplitude and phase patterns is investigated for both large and small reflectors (D/Ä = 300 and D/À. = 30).
Analysis: The geometry of the symmetrical parabolic reflector antenna together with the off-axis displacement of the feed is shown in Fig. 1. The scalar far field is given by 1
E(R, 0, q,) = 2iR (1 +cos O)e-ikR r r [G(t/1, ~)]112 0 0 p
(1)
with:
J e (ey)211/2 p' = p 11 + 2 _2' sin "' sin ç + - ( :::::: p + ey sin t/1 sin e
p p (2)
and a feed pattem of the form
G(Y,, Ç) = 2(n + 1) (;,r cos" 1/1 (3)

- 152 -
For a siven .;. the intesrand is a rapid osclllatins function of~. To eliminale numerical ~ intesration, the far field is written as
E(R, 8, ,P) = ~R (1 +cos 8)e-J••[2(n + 1)]111
... x J I cos"'1 l/le-Jlp(t+coa•e0501 sin 1/1 dl/I (4)
with
0
11r ( )(11/1)+1 I = f p ;. el""W dÇ
0
h(~) = -t, sin ~ + p sin 8 cos f/1 cos Ç
- p sin 8 sin tiJ sin Ç
x= k sin 1/1
Usins the stationary phase method, 5 eqn. S yields
{ [ 2x ] 111 ( p )'"'l)+ 1
I = ~ x I h"(,,)l p p'(~,)
exp [jxh(~1) + j i sin h"(Ç,)]}
(5)
(6)
(7)
h"(Ç1) denotes the double deriv•tive of eqn. 6 taken in the stationary phase points Ç1 for which .5h(Ç)/~ = 0.
The two stationary phase points are given by
sin Ç1 = ± (t, + p sin (} sin f/1 )(p1 sin 1 8
+ 2t,p sin 8 sin tiJ + t:t 1'1
· (9)
cos Ç1 = + p sin (} cos ,P(p1 sin1 (}
+ a,p sin (}sin "' + t:)- 1'1
In the special case of a circularly symmetrie amplitude aper· ture distribution and the approximation cos (} :::::! 1, our eqn. 4 for the far field asrees with eqn. 2c of Ruze's paper.6
jf Note erratum at the end of this section.

153 -
0
-10 en -20 "C . -30 .... • ~ -40 0 a.
-50
-60
-70 a
160 ::- t?"'
1 20 UI • 80 • .... Cl\ 40 • "C
0 -• UI -40 0 .c. a. -80
-1 20
-160 b
160
120
UI 80 • 40 • .... Cl\
0 • "0 . -40 • UI. -80 0
.c. a. -100
-160
-18 -14 -10 -6 -2 2 1161121 ~sine
À Fig. 2 c
a Power pattern; DIA= 300 and DIA= 30; ,P = n/2 --- stationary pbase metbod .................. double integration b Phase pattern; D/A = 300; ,P = n/2 --- stationary phase metbod .................. double integration c Phase pattern; DIA= 30; ,P = n/2 --- stationary phase metbod ----- stationary phase metbod; cos 6 ::-: l
.................. double integration
6

- 154
Computed results: Eqn. 1 and eqn. 4 have been applied to reflector antennas with a large and a small D/l (DIA = 300 and D/A = 30), with and without the additional approximation cos 8 :::!:: 1. The double inlegral was obtained using Simpsonrule integration. The parameters used were 'I'. = 30° and n == 16·480. This value of n corresponds to the maximum gain factor under focused conditions.
Fig. 2 shows the normalised power and relative phase of the radiation pattern when the main beam is scanned two beamwidths. The scaled power patterns for the two different DIA ratios are almost identical functions of (nD/A) sin 8 and independent of the approximation cos 8 :::!:: 1. At the peak of the main beam, the inlegrand of eqn. 1 is no langer a fast osciJiating function of Ç, so the stationary phase metbod rails. However, double inlegration demands relatively Jittle computational time in this region. Apart from the vicinity.ofthe peak the dilTerences between the results of the two methods are very small. The phase pattern for the large DIA antenna is almost independent of tbc approximation cos 8 :::!:: 1; we only notice a small dilTerenee between the results of the two methods in the (insignificant) regions where the power pattern bas deep nulls. For the small DIA antenna, different results are obtained with and without the approximation cos 8 :::!:: 1. The reduction ofthe computational time varied from a factor of 20 on the skirts of the main beam up toa factor of 100 in tbc third sidelobe.
Conclusions: The stationary phase metbod can be used for efficient computation of the radiation pattern of a defocused symmetrical parabalie reflector antenna. Away from the peak of the main beam, the errors introduced by the metbod are very small. Compared with a standard double inlegration procedure, the computational time can be reduced by a large factor, ranging from 20 in the main beam up to 100 in the third sidelobe.
The metbod is in development for the use in nonsymmetrical offset reflector antennas. The reetangolar components of the vector pattern are given by integrals in the form of eqn. 1, so the metbod can also be used to compute this pattern.
M. H. A. J. HERBEN R. MIDDELKOOP F. J. J. GIELKENS Telecommunlcations Group Department of Electrlcal Engineering Eindhoven University of Technology PO Box 513, NL-5600 MB Eindhoven, Netherlands
7th May 1980

5.5.3.
155 -
References 1 HERREN, M. H. A. J.: 'Designing a contoured beam antenna'. TH
Report 79-E-104, 1979, Eindhoven University of Tec::hnology, Department of Elec::trical Engineering, Eindhoven, Netherlands
2 HERREN, M. H. A. J., and MAANDl!RS, E. J.: 'Some aspects of contoured beam antennas'. lEE international conference on antennas and propagation, London, 1978, pp. 184-188
3 GALINDO-ISREAL, v., and MllTRA., R.: 'A new series representation for the radiation inlegral with application to reflector antennas', IEEE Trans., 1977, AP-15. pp. 631-641
4 IERLEY, W. H., and ZUCKER, H.: 'A stationary phase metbod for the computation of tbe rar field of open Cassegrain aritennas', Bell Syst. Tech. J., 1970,49. pp. 431-454
5 ERDELYI, A.: 'Asymptotic expansions', (Dover, New York, 1950), pp. 51-57
6 RUZE, J.: 'Lateral feed displacement in a paraboloid', IEEE Trans., 1965, AP-13. pp. 660-665
* Erratum HERllEN, M. H. A. I., MIPDELKOOP, R., and GIELKENS, F. J. 1.: 'Stationary phase method for far-field computation of defocused reftector antennas', Electron. Lett., 1980, 16, pp. 519-521
The last lîne of eqn. 8 is incorrect 1t should read:
exp pxh(Ç,) + j : sign h"(/;1) J}
turbulence-induced scintillations on the realised
reduction
The theory adopted intheletter reprinted in Sectien 5.5.1 assumes two
plane waves entering the antenna system from two satellites. In practice
these waves will not be plane due to turbulence-induced scintillations.
This is especially true if at least one of the satellites is viewed at a
low elevation angle. Theobold and Hodge [66] demonstrated that the
antenna gain degradation may be important. Shriftin [67] showed that not
only the gain but the complete antenna pattern will degrade. For our
specific application, viz. interference reduction by nu~ling, it is
important to investigate the "filling in" of such a null due to signal
scintillations caused by turbulence.
For this purpose the weak-scattering theory described in Sectien 2.3.1
may be used. For the ratio of the scintillation noise power received
* Reprinted from Electranies Letters, 1980, Vol. 16, p. 644.

- 156 -
from the interfering satellite (a2
.) and the power received from the n-z-wanted satellite Pw,a formula similar to Eq. 2.23 can be derived,
namely
2 a . n'l- -p--w
d<fl g(K~<fl) K 0 0 0
(5.16)
with c1 the ratio of the power flux at the earth terminal caused by the
intertering satellite and by the wanted satellite. Because the complete
two-dimensional radiation pattern g(K3 <P) of the extended system des
cribed inSection 5.5.1 was not readily available and in order to
simplify numerical computation of Eq. 5.16, the radiation pattern of an
uniformly illuminated circular aperture will be adopted. In that case
the pattern becomes the Airy pattem (35]
with
• 1 2 2 ' K1 = yK + K" - 2KK" cos<jl
K" = B sin eI
8' angle between the two satellites as viewed from the earth
terminal.
2 Fig. 5.5 shows a ./P near the first, second and third null of the
n'l- w Airy radiation pattern for the antenna geometry consioered in
(5.17)
(5.18}
(5 .19)
Section 5.5.1 and the same ~ {K) as used in Section 5.4.2. It is assumed n
in Fig. 5.5 that the elevation angle ee~ 30 degrees and c1
= 1 (equal
fluxes), so the radiation pattern itself determines the interterenee
ratio Pi/Pw with Pi the power received from the intertering satellite
in the absence of tropospheric turbulence. As expected it appears that
Pi is dominant away trom the null, while close to the null a~i becomes
more important. The maximum suppression appears to be 47, 55.5 and 61
dB in the tirst, second and third null, respectively. For the partienlar
antenna system considered these nulls occur at 0.35, 0.64 and 0.93 de
grees oft-boresight, i.e., for closely spaeed satellites.

157
0
first null second null third null
-20
3
Fig. 5.5
4 5 6 7 8 9 10 11
u
The scintillation noise power a2• received from an n-z-
interfering satellite at an angle e off-axis (i)
and the power received from the interfering satel-
lite in the absence of tropospheric turbulence (ii},
both normalised to the power Phl received from the
wanted satellite on-axis. The receiving antenna
patternis modelled by the Airy function (Eq. 5.17).
D = 10.16 m, À = 5.08 cm, D)À = 200, c1 1 (Eq. 5 .16) .
Fig. 5.6 shows this suppression as a function of wavelength for c1
1
and a fixed antenna diameter. It is seen that the maximum suppression
decreasas with dacraasing wavelength. As mentioned before, the results
presentad in Figs. 5.5-6 are for an alevation angle of 30 degrees.
Howaver, the scintillation noise power received from the interfering
satellite (a2 .) increases with decreasing elevation angle. Therefore 2 ~ 2
the a ./P shown in Figs. 5.5-6 should be,increased by ~a ./P , tabulated n-z- hl n-z- hl in Tabla 5.3 for lower values of Set'
Fortunately, we may conclude that for any operational satellite earth
terminals eperating in the 4/6 GHz band (which presently impose the main
constraints on more afficient use of tha geostationary orbit), tropo
spheric scintillation will not seriously degrade the interference sup
pression described in Sectien 5.5.1. For frequencias in the EHF band,

Fig. 5.6
Table 5.3
- 158
-20
-40
first null
-60 secend null
third null
0 4 8
À, cm
The scintillation noise power a2 . normalised to the n-z-power received from the wanted satellite Pw' when
the nullof the radiation pattern (Eq. 5.17) of the
receiving antenna is pointed to the interfering
satellite. The receiving antenna pattern is modelled
by the Airy function (Eq. 5.17).
D = 10. 16 m, c1
= 1 (Eq. 5.16).
eel (degrees) !:1a2 ./P (dB) n"l- w
30 0
25 0.7
20 1.6
15 2.8
10 4.6
5 7.5
4 8.4
3 9.5
Excess scintillation noise power received from the
interfering satellite normalised to the power re-2
ceived from the wanted satellite (!:1ani/Pw) at
elevation angles eel lower than 30 degrees.

- 159 -
however, this degradation may become important, especially at small
elevation angles (see Table 5.3). Furthermore, it appears advantageous
to realise a wider suppression, rather than a narrow deep null, which
is more easily "filled in" by scintillation.

- 161
6. SUMMARY AND CONCLUSIONS
In Chapter l the path geometry of the 8.2 km experimental 30 GHz line
of-sight link between Eindhoven and Mierlo has been presented.
Chapter 2 contains a theoretica! description of the physical phenomena
affecting a radio line-of-sight path. Three roodels have been described:
one for refraction and reflection, a second for tropospheric turbulence,
and a third for precipitation.
In the first modeZ the ~heory concerning the influence of large-scale
refraction and reflection on radio-wave propagation has been. applied to
the 30 GHz line-of-sight path. Using this classica! model, the influence
of large-scale phenomena on the scintillation experiments to be con
ducted can be assessed. It has been demonstrated that the contributions
of both coherent and incoherent reflection at the earth surface can be
neglected for the specific path of the experiment. The percentage of
time that ray bending (k-factor fading) gives rise to a marked signal
reduction appears to be negligible. The effect of a discontinuity in
the refractive-index profile becomes.important only if the layer ap
proaches the level of the antennas. Numerical results have been pre
sented for the received signal level, as a function of the height of
the discontinuity above local ground. Assuming a discontinuity of 10 i!
units it has been demonstrated that the maximum in-band amplitude and
phase variatien are approximately 1 dB and 7.5 degrees, respectively,
over a 500 MHz bandwidth around 30 GHz. Furthermore, it appears that
large temporal signa] fluctuations are nat necessarily related to large
signa! distortion. A ray-tracing computer program.has been described
and adopted to compute th.e signal fluctuations caused by a measured
refractive index profile.
In the second modeZ use has been made of an existing weak-scattering
theory to predict the variances and spectra of turbulence-induced
amplitude and phase scintillations. It has been demonstrated that the
depolarisation caused in the turbulent troposphere may be neglected.
This existing theory, which assumes plane waves, has been extended to
spherical waves. Both plane- and spherical-wave represen,tations, have
been used to predict the seintil lation occurring on the experimental
11.575 GHz downlink from the Orbital Test Satellite {OTS) and on the
experimental 30 GHz terrestrial line-of-sight link, respectively.

162 -
In the third model an existing theory to predict attenuation, depolari
sation and distartion due to rain has been extended so that amplitude
fluctuations and depolarisation can be computed, taking into account
both the size distribution and the canting angle distribution of drops
as well as the varying rain intensity along the propagation path. This
all results in a theoretica! model approaèhing reality closer than
standard engineering models. Numerical results for the resulting attenu
ation and cross-polarisation discrimination (XPD) have been presented.
It appears that the attenuation as a function of rain intensity is more
sensitive to a variatien in dropsize distribution than are the curves
giving XPD versus attenuation. The latter curves, however, are ex
tremely sensitive to variations in the canting angle distribution. In
a 500 MHZ band at 30 GHz, amplitude and phase distartion due to rain
have been found to be smaller than 2 dB and 20 degrees, respectively,
for rain attenuations up to 60 dB. Finally, a new theory has been de
veloped to determine the spectra of rain-induced amplitude and phase
scintillations. The rain-induced scintillation noise power appears to
be lower than the turbulence-induced scintillation noise power and to
be distributed over a larger frequency band.
The 30 GHz measuring system and the University's weather station have
been briefly described in Chapter 3. With this measuring system it is
possible to determine the complex transmission parameters of the ter
restrial radio-wave propagation path. The processing of the baseband
signals from the 30 GHz measuring system, and the methad applied for
data registration are also treated in this chapter.
Results of the measurements have been presented in Chapter 4 in order
to verify the three theoretica! roodels presented in Chapter 2.
Concerning the first model for the 30 GHz line-of-sight path it appeared
that for all observed multipath events, a temperature inversion was in
variably detected. It has been found that the measured temperature
difference between two vertically spaeed points only qualitatively in
dicates the occurrence of multipath; a certain measured temperature
difference may correspond to widely different temperature graàients
and signal fluctuations. The largest recorded signal fluctuations
during any multipath event were +3.5 dB and -6.7 dB. The discriminatien
of the cross-polar signa! always remained better than 38 dB. The largest

- 163 -
rate of change of the co-polar signal during multipath propagation was
0.66 dB/sec. The amplitude distortien measured between two tones spaeed
440 MHzapart was quite smal! (smaller than 2 dB), asindeed expected
from the theory. By camparing the amplitude and phase spectra of the co
polar signa! during a multipath event with those found for tropospheric
turbulence, it appeared that during multipath the low-frequency components
are larger; these spectra do not exhibit a flat part at the low fre
quencies. This is reflecting the obvious fact that during multipath even
the mean value of the signa! varies. The slopes of these spectra for
higher frequencies differ only slightly from those found for normal
tropospheric turbulence. It is believed that these higher frequency
components are not caused by the multipath phenomena but by the presence
of weak tropospheric turbulence. Signal level computations using the ray
tracing computer program have shown that for accurate predictions of the
co-polar signa! level the complete refractive index profile should be
available. However, the model tagether with the instrumentation was suf
ficient to distinguish all multipath events from the scintillation
events of principal interest here.
With respect to the second model it is demonstrated, for amplitude as
well as phase scintillation, that both the measured slopes of the
scintillation spectra and the Gaussian probability density functions
agree with expectations based on weak-scattering theory. Results of
amplitude scintillation measurements using the OTS c.w. beacon at
11.575 GHz have been given. The averaging effect of the receiving an
tenna aperture considered in Chapter 2 has been verified by camparing
the results of this experiment, using a large 8 m Gregorian antenna
with those at 30 GHz using a much smaller (0.5 m) paraboloid reflector.
Taylor's frozen turbulence hypothesis, as normally used in the weak-
scattering theory, has been verified by a comparison of phase-difference
spectra with the corresponding single-aperture phase spectra at differ
ent receiving-antenna spacings. Refractive-index spectra computed from
measurements of temperature, humidity and atmospheric pressure have been
shown to follow a dependence. This spectrum slope justifies use of
the Kolmogorov spectrum in the weak-scattering theory. The wind veloeities
determined from measured amplitude scintillation spectra have been shown
to agree with in-situ measured ones. The refractive-index structure para
meter (C2 ) as derived from the observed 30 GHz amplitude scintillation n

- 164
measurernents (along the propagation path at an average height of 60 m)
has been eeropared with in-situ measurements made at 10 m height above
ground. After free-convection height sealing, a discrepancy of a factor
3 has been found. This factor has been discussed. It has been demonstra
ted that at 30 GHz the two contributions to the refractive index struc
ture parameter <C2l of the humidity structure parameter (C2 ) and the n Q
structure parameter of temperature humidity (CTQ) are dominant, whereas
the contribution of the temperature structure parameter may be ne-
glected. A calculation of evaporation from the observed radio-wave
scintillation is presented.
Concerning verification of the third model, rain attenuations up to 60
dB (the limit imposed by the dynamic range of the 30 GHz measuring
system) were registered. Scatter diagrarns of measured attenuation and
(simultaneously measured) rain intensity show sorne clustering at low
rain intensities; the relation gets poorer for larger rain intensities.
The latter can be explained by the localised character of intense rain
showers, resulting in a discrepancy between a point measurement (of
rain intensity) and a line-averaged measurement (of attenuation). The
regression curves fitting the values of the relative co-polar signal
and XPD, measured during different rain events have the same shape as
the theoretical curves. For a given attenuation, the depolarisation
tends to increase with increasing ;qind velocity. This agrees with theory,
which prediets a decrease of the XPD due to an increase of the expected
canting angle, for growing wind velocity.
The greatest rate of change of the co-polar signal observed in these
circumstances was 2.7 dB/sec. The discriminatien of the 30 GHz
cross-polar signal always remained better than 24 dB. Amplitude dis
tartion measured between two tones spaeed 440 MHz apart agrees with
theory. The scintillation spectra show that rain results in an increase
of the higher frequency components, to levels well above tropospheric
scintillation spectra in the absence of rain. Camparisen of the levels
of these flat, high frequency pa:tts of the s.nectra ;.,;i th the corres
ponding mean attenuations of individual measurement records, has led to
an interesting conclusion: during weaker fading there is a much more
rapid build-up of this speetral level with increasing attenuation than
found in strenger fading events. Thus, for low rain attenuations the
(multiplicative) rain-induced scintillation noise could be important,

- 165
while for larger rain attenuations the (additive) thermal noise eventu
ally becomes more significant. This agrees with computations based on
theory. The measured scintillation spectra do not show the rapid de
crease with frequency obtained from the numerical computations presented
in Chapter 2, because only frequency components below 10 Hz could be
measured and analysed. Nevertheless, the slope was detected a few times,
even within the 10 Hz bandwidth, namely during events with wet snow. This
is explained by the fall velocity of snow flakes, which fall much slower
than raindrops.
In Chapter 5 the influence of the propagation medium on the intended
operatien of certain typical radio communication systems has been in
vestigated.
InSection 5.2 methods to cancel rain-induced cross-polarisation adap
tively have been reviewed, together with methods to obtain the control
signals for such a cancellation network. It has been demonstrated that
at 30 GHz the rain-induced depolarisation is mainly caused by a differ
ential attenuation; the differential phase shift is small. Therefore, a
simplified methad is possible for cross-polarisation eliminatien at
30 GHz.
In Sectien 5.3 the impact of scintillation noise on carrier tracking and
coherent detection of PSK signals is compared to that of thermal noise.
Carrier recovery is assumed to be performed by a PLL with equivalent
loop bandwidth BL. Then it appears that for loop bandwidths larger than
5 Hz the contribution to the PSK character error rate from troposoheric
turbulence is negligibly small. This is consistent with the fact that
this type of noise has a very narrow power spectrum.
In Section 5.4 a theory has been described to determine the cross
polarisation properties of reflector antennas with random surface
errors. Numerical results are presented for a front-fed parabalie
reflector antenna. The computed average cross-polar patterns show that the
cross-polarised power is redistributed in the far-field. The influence
of the correlation interval and phase-error model of the surface errors
on the XPD has been indicated. The random phase errors in the antenna
aperture caused by tropospheric turbulence have been put in a form such
that the surface error theory can be invoked to determine the antenna
pattern degradation. It appears that in practical situations the phase

- 166 -
error caused by tropospheric turbulence will not seriously degrade the
XPD of the antenna system. This is mainly due to the relatively large
value of the correlation interval. The degradation would only become
important for very large antenna apertures, extremely high frequencies,
or very small values of the outer scale of turbulence in combination
with a small elevation angle.
In Sectien 5.5 a method has been considered which reduces interference
between two satellite communication systems by suppression of specific
near-angle sidelobes of a double-reflector earth terminal antenna,
using an auxiliary, weakly excited defocused feed. The method developed
for efficient computation of the far-field pattern of the extended
antenna system is also described.
The "filling in" of an idealised null in the radiation pattern of the
modified system, caused by tropospheric turbulence on the propagation
path, has been investigated. For the many satellite earth terminals epe
rating in the 4/6 GHz band (which presently impose the main constraints
on more efficient use of the geostationary orbit), tropospheric seintil
lation will not seriously degrade the interference suppression. For
frequencies in the EHF band, however, this effect becomes much more
important, especially for small elevation angles of the antenna. Fur
thermore it appears advantageous to realise a wider suppression, rather
than a narrow deep null, which is easily "filled in" by scintillation.
In conclusion, it would appear that the multifarious small-scale tropo
spheric fluctuations experienced on microwave links, while not drama
tically influencing the communications performance of well-designed
standard radio equipments, will become increasingly significant as the
EHF bands or adaptive equipments are brought into operation. Conversely,
it is perfectly feasible to ascertain the various tropospheric phenomena
with carefully designed radio measurements. As demonstrated in this
thesis, this allows global prohing of the properties of the troposphere
in a manner complementary to the normal local (in-situ) measurernents of
meteorology.

167 -
[1] CCIR, 1982, Recornmendations and Reports of the CCIR, 5, Rep. 563
and 718.
[2] Fante, R.L., 1975, Electromagnetic beam propagation in turbulent
media, Proc. IEEE, 63, 1669-1692.
[3] Fante, R.L., 1980, Electromagnetic beam propagation in turbulent
media: an update, Proc. IEEE, 68, 1424-1443.
[4] Crane, R.K., 1971, Propagation phenomena affecting satellite
communication systems operating in the centimeter and millimeter
wavelength bands, Proc. IEEE, 59, 173-188.
[5] Hogg, D.C. and Cbu, T.S., 1975, The role of rain in satellite com
munications, Proc. IEEE, 63, 1308-1331.
[6] Ippolito, L.J., 1981, Radio propagation forspace communications
systems, Proc. IEEE, 69, 697-727.
[7] Kerr, D.E., 1951, Propagation of short waves, Dover Publications,
New York.
Beckmann, P. and Spizzichino, A., 1963, The scattering of electro
magnetic waves from rough surfaces, Pergamon Press, New York.
Grosskopf, J., 1970, Wellenausbreitung 1, B.I. Hocbscbultaschen
bücber-Verlag, Mannheim.
[10] Boithias, L. and Battesti, J., 1967, Proteetion contre les
evanouissements sur les faisceaux hertziens en visibilité, Ann.
Télécommunic., 22, 230-L42.
[11] Beckmann, P., 1968, The depolarisation of electromagnetic waves,
Golem Press, Boulder, Colorado.
[12] Felsen, L.B. and Whitman, G.M., 1970, Wave propagation in time
varying media, IEEE Trans., AP-18, 242-253.
(13] Webster, A.R., 1982, Raypath parameters in tropospheric multipath
propagation, IEEE Trans., AP-30, 796-800.
[14] Cartwright, N.E. and Tattersall, R.L.O., 1977, Simultaneous measure
ments of radio refractivity and multipath fading on 2 July 1975 at
11, 19 and 36 GHz on a ,7.5 km path, Electron. Lett., 13, 208-210.
Webster, A.R., 1983, Angles-of-arrival and delay times on ter
restrial line-of-sight microwave links, IEEE Trans., AP-31, 12-17.
[16] Tatarski, V.I., 1961, Wave propagation in a turbulent medium,
McGraw-Hill, New York.
[17] Lee, R.W. and Harp, J.C., 1969, Weak scattering in random media,
Proc. IEEE, 57, 375-406.

- 168 -
[18] van Weert, M.J.M., 1975, The influence of frequency and receiver
aperture on the scintillatio11 noise power, AGARD Conf. Proc. 159,
paper 12.
[19] Clemmow, P.C., 1966, The plane wave spectrum representation of
electroroagnetic fields, Pergamon Press, New York.
[20] Taylor, G.I., 1938, The spectrum of turbulence, Proc. Roy. Soc.
(London), A164, 476-490.
[21] Ishimaru, A., 1972, Temporal frequency spectra of multifrequency
waves in turbulent atmosphere, IEEE trans., AP-20, 10-19.
[22] Laws, J.O. and Parsons, D.A., 1943, The relation of raindropsize
to intensity, Trans. Amer. Geophys. Union, 24, 452-460.
Marshall, J.S. and Palmer, W.M., 1948, The distribution of raindrops
with size, J. Meteor., 5, 165-166.
(24] Joss, J., Thams, J.C. and Waldvogel, A., 1968, The variatien of
raindrop size distributions at Locarno, Proc. Int. Conf. Cloud
Physics, 369-373.
[25] Medhurst, R.G., 1965, Rainfall attenuation of centimeter waves:
Comparison of theory and measurement, IEEE Trans., AP-13, 550-564.
[26] Oguchi, T., 1960, Attenuation of electromagnetic wave due to rain
withdistortedraindrops, J. Radio Research Lab., 7, 467-485.
(27] Chu, T.S., 1974, Rain-induced cross-polarisation at eentiroeter and
millimeter wavelengths, Bell Syst. Techn. J., 53, 1557-1579.
[28) Dilworth, I.J. and Evans, B.G., 1979, Curoulative cross-polarization
and canting angle distributions, Electron. Lett., 15, 603-604.
(29] Crane R.K., 1980, Predietien of attenuation by rain, IEEE Trans.,
COM-28, 1717-1733.
[30] Kheirallah, H.N., Segal, B. and Olsen, R.L., 1980, Application of
synthetic storm data to evaluate simpler techniques for predicting
rain attenuation statistics, Ann. Télécommunic., 35, 456-462.
[31] van de Hulst, H.C., 1957, Light scattering by sroall particles,
John Wiley, New York.
[32] Morrison, J.A. and Cross, U.J., 1974, Scattering of a plane electro
magnetic wave by axisymmetric raindrops, Bell Syst. Techn. J., 53,
955-1019.
[33] Capsoni, C., Mauri, M. and Paraboni, A., 1977, Incoherent effects
in electromagnetic propagation through rain, Ann. Télécororounic.,
32, 409-414.
[34] Jakes, w.c., 1974, Microwave mobile comrounications, John Wiley,
New York, 11-22.

- 169 -
[35] Silver, s., 1965, Microwave antenna theory and design, Dover,
New York.
[36] Dijk, J., Hansen, C.N.F. and Maanders, E.J., 1980, OTS propagation
measurements at Eindhoven University, Netherlands, AGARD Conf.
Proc. 284, paper 17.
[37] Thompson, M.C. and Vetter, M.J., 1958, Single path phase measuring
system for three-centimeter radio waves, Rev. Sc1. Instrum., 29,
148-150.
[38] Dijk, J. and Ouderling, J.M.G.Z., 1978, Areveiving system for
experimental geostationary satellites with very.accurate phase
detection, ESA SP-138, 237-245.
[39] Holleboom, K.G. and Wagemans, J.M.H., 1979, Signal processing of
orbital test satellite data, ESA SP-146, 259-266.
[40] Herben, M.H.A.J., 1982, Amplitude and phase scintillation measure
ments on 8.2 km line-of-sight path at 30 GHz, Electron. Lett., 18,
287-289~
[41j Herben, M.H.A.J., 1983, Amplitude scintillations on the OTS-TM/TM
beacon, AEO, 37, 130-132~
[42] Herben, M.H.A.J. and Kohsiek, W., 1983, A comparison of radio-wave
and in-situ observations of tropospheric turbulence and wind
velocity, ESA SP-194, 79-87~
[43] Wyngaard, J.C. and LeMone, M.A., 1980, Behavier of the refractive
index structure parameter in the entraining convective boundary
layer, J. Atmos. Sci., 37, 1573-1585.
[44] Kohsiek, W. and Herben, M.H.A.J., 1983, Bvaporation derived from
optica! and radio-wave scintillation, Appl. Opt., 22, 2566-2570:
[45] Brussaard, G., 1976, A meteorological model for rain-induced cross
polarization, IEEE Trans., AP-24, 5-11.
[46] Herben, M.H.A.J., 1983, Rain-induced amplitude scintillation on
8.2 km line-of-sight path at 30 GHz, AEO, 37, 339-340~
[47] Moulsley, T.J., Hadden, J., Lo, P. and Vilar, E., 1981, Measurement
and modelling of the probability density function of amplitude
scintillations on an X-band satellite down-link, Electron. Lett., 17,
625-626.
[48) Vissers, J.M.M., Herben, M.H.A.J. and Maanders, E.J., 1983, Cross-
polarisation properties of reflector antennas with random surface
errors, Electron. Lett., 19, 49-50~

170-
[49] van Ommeren, M.J.S., Herben, M.H.A.J. and Arnbak, J., 1980, Improved
orbit utilisation by interferometric sidelobe suppression, Electron.
Lett., 16, 937-938;
[50] Herben, M.H.A.J., Middelkoop, R. and Gielkens, F.J.J., 1980,
Stationary phase methad for far-field computation of defocused
reflector antennas, Electron. Lett., 16, 519-521; Erratum, ibid, 16,
644;
[51] Nouri, M. and Braine, M.R., 1980, Uplink adaptive depolarisation
cancellation in a ground-to-satellite link, Electron. Lett., 16,
68-69.
Barton, S.K., 1976, Methods of adaptive cancellation for dual
polarisation satellite systems, The Marconi Rev., 39, 1-24.
[53] Lee, L.S., 1979, Polarisation control schemes for satellite com
munications with multiple uplinks, IEEE Trans., COM-27, 1504-1511.
[54] Ogawa, A. and Allnutt, J.E., 1982, Correlation of 6 and 4 GHz
depolarisation on slant paths, Electron. Lett., 18, 230-232.
Chu, T.S., 1971, Restoring the orthogonality of two polarizations
in radio communication systems I, Bell Syst. Tech. J., 50, 3063-
3069.
[56] Chu, T.S., 1973, Restoring the orthogonality of two polarizations
in radio communication systems II, Bel! Syst. Tech. J., 52, 319-
327.
[57] Kannowade, H., 1976, An automatic control system for compensating
cross-polarization coupling in frequency-reuse communication
systems, IEEE Trans., COM-24, 986-999.
[58] Difonzo, D.F., Trachtman, w.s. and Williams, A.E., 1976, Adaptive
polarization control for satellite frequency reuse systems, COMSAT
Tech. Rev., 6, 253-283.
[59] Williams, A.E., 1977, A dual-polarized 4/6-GHz adaptive polari
zation control network, COMSAT Tech. Rev., 7, 247-262.
[60) Cahn, R.C., 1959, Performance of digital phase modulation communi
cation systems, IRE Trans., CS-7, 3-6.
[61] wozencraft, J.M. and Jacobs, I.M., 1965, Principlesof communiea
tion engineering, John Wiley, New York.
[62] Ruze, J., 1966, Antenna toleranee theory- a review, Proc. IEEE,
54, 633-640.

171 -
[63] Jervase, J.A. and Ghobrial, S.I., 1983, Axial cross polarisation
in reflector antennas with suriace errors of large correlation dia
meter, IEEE Trans., AP-31, 662-665.
[64] Mavrokoukoulakis, N.O., Ho, K.L. and Cole, R.S., 1977, Observations
of millimeter-wave amplitude scintillations in a town environment,
Electron. Lett., 13, 391-392.
[65] Born, M. and Wolf, E., 1965, Principlesof Opties, Pergamon Press,
New York, 203-332.
[66] Theobold, O.M. and Hodge, O.B., 1978, Gain degradation and amplitude
scintillation due to tropospheric turbulence, Ohio State Univ.,
Techn. Rep. 78299-6, Revision 1.
[67] Shriftin, Y.S., 1971, Statistical antenna theory, Golem Press,
Boulder, Colorado.
* reprinted in this thesis.
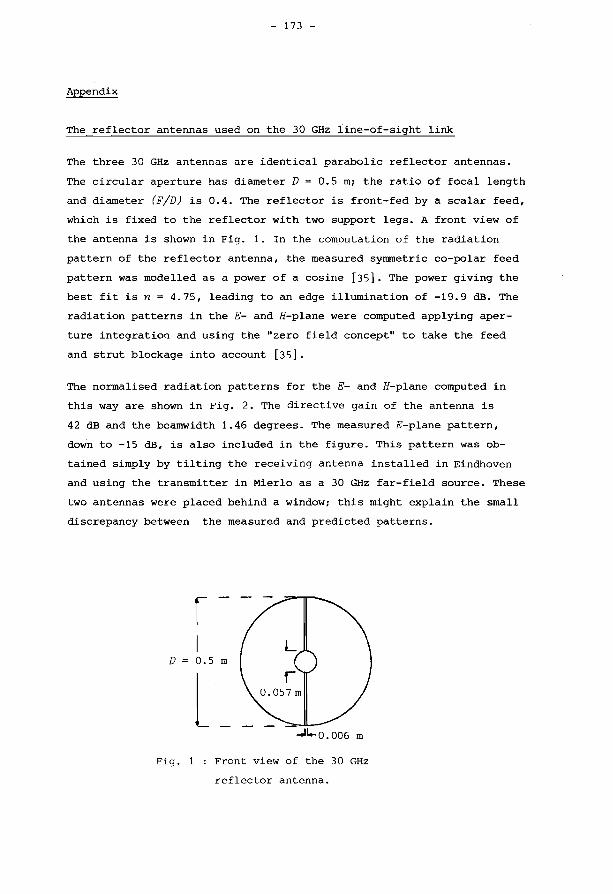
- 173 -
Appendix
The reflector antennas used on the 30 GHz line-of-sight link
The three 30 GHz antennas are identical parabalie reflector antennas.
The circular aperture has diameter D = 0.5 m; the ratio of focal length
and diameter (F/D) is 0.4. The reflector is front-fed by a scalar feed,
which is fixed to the reflector with two support legs. A front view of
the antenna is shown in Fig. 1. In the comoutation of the radiation
pattern of the reflector antenna, the measured symmetrie co-polar feed
pattern was modelled as a power of a eosine [35]. The power giving the
best fit is n = 4.75, leading to an edge illumination of -19.9 dB. The
radiation patterns in the E- and H-plane were computed applying aper
ture integration and using the "zero field concept" to take the feed
and strut blockage into account [35].
The normalised radiation patterns for the E- and H-plane computed in
this way are shown in Fig. 2. The directive gain of the antenna is
42 dB and the beamwidth 1.46 degrees. The measured E-plane pattern,
down to -15 dB, is also included in the figure. This pattern was ob
tained simply by tilting the receiving antenna installed in Eindhoven
and using the transmitter in Mierlo as a 30 GHz far-field source. These
two antennas were placed behind a window; this might explain the small
discrepancy between the measured and predicted patterns.
r D 0.5 m
l ..... n ... o.oo6 m
Fig. 1 Front view of the 30 GHz
reflector antenna.

0
-10 t:Q '0
c: ·.-I -20 n1 01
'0 <ll Ul ·rl -30 .-I n1 s H 0 c:
-40
0
Fig .. 2
- 174 -
2 3 4
angle from boresight, degrees
Normalised radiation pattern of the
reflector antenna at 30 GHz
--- E-plane, computed
H-plane, computed
- E-plane, measured.

- 175
Korte samenvatting
Dit proefschrift begint met een theoretische beschrijving voor een micro
golf straalverbinding. Er worden drie dynamische mechanismen behandeld:
refractie of reflectie, trapasferische turbulentie en neerslag. De be
staande theoretische beschrijving wordt uitgebreid om de gemeten resul
taten beter te kunnen benaderen. Deze beschrijving wordt toegepast op de
8,2 km lange direct-zicht-verbinding bij 30 GHz waaraan de metingen zijn
verricht. De tropesferische turbulentietheorie wordt tevens toegepast op
de satellietverbinding tussen de Orbital Test Satellite (OTS) en het
grondstation van de Technische Hogeschool Eindhoven (THE) bij 11,575 GHz.
Het meetsysteem wordt in het kort beschreven. De meetresultaten worden
gepresenteerd en vergeleken met de verwachtingen zoals die gebaseerd
zijn op de theorie. Een radio-experiment voor het "aftasten" van de
troposfeer, uitgevoerd in samenwerking met het Koninklijk Nederlands
Meteorologisch Instituut (KNMI), wordt beschreven en de resultaten wor
den besproken. Er wordt een methode gepresenteerd waarmee de verslechte
ring van de systeemeigenschappen veroorzaakt door de troposfeer gedeel
telijk gecompenseerd kan worden. Tenslotte wordt de invloed nagegaan van
de gemeten golfvoortplantingsverschijnselen op de stralingseigenschappen
van reflectorantennes en de werking van synchrone ontvangers.

- 177 -
Toelichting
Hieronder volgt een nadere aanduiding van de bijdragen van mede-auteurs
aan in dit proefschrift opgenomen artikelen. Hiermee wordt voldaan aan
artikel 13 van het promotiereglement van de THE.
1. '~ aamparieon of radio-wave and in-situ obeervatione of tropoepheria
turbutenae and wind veloei ty" (paragraaf 4. 3. 3).
Dr. W. Kohsiek (KNMI) verrichtte de in-situ-metingen en voerde de
hoogteschaling van de windsnelheid uit.
2. "Evaporation derived from optiaal and radio-wave eaintittation·
(paragraaf 4.3.4).
Dr. W. Kohsiek (KNMI) verrichtte de in-situ-metingen en bepaalde hier
uit de voelbare en latente warmteflux. Voorts berekende hij de ver
damping uit de 30 GHz scintillatiemeetgegevens.
3. "Croee-potarieation properties of reflector antennae with random
surface errors" (paragraaf 5. 4. 1).
Ir. J.M.M. Vissers ontwikkelde in het kader van zijn afstudeerwerk
in de vakgroep Telecommunicatie {THE), samen met de auteur van dit
proefschrift de theorie die in dit artikel beschreven is en schreef
de benodigde computerprogramma's.
Dr.ir. E.J. Maanders heeft ir. J.M.M. Vissers tijdens het afstudeer
werk medebegeleid.
4. "Irrrproved orbit utitieation by interferometria eidelobe euppreseion"
(paragraaf 5.5.1).
Ir. M.J.S. van Ommeren ontwikkelde in het kader van zijn afstudeer
werk in de vakgroep Telecommunicatie (THE), samen met de auteur van
dit proefschrift een methode om zijlussen in reflectorantennes te
onderdrukken en schreef de benodigde computerprogramma's. Deze me
thode is beschreven in dit artikel.
Prof.dr. J.C. Arnbak initieerde en motiveerde dit systeemonderzoek.
5. "Stationary phase methad for far-fieZd eomputation of defoeused
refleetor antennas" (paragraaf 5. 5; 2).
Ir. R. Middelkoop en ir. F.J.J. Gielkens voerden in het kader van
stages in de vakgroep Telecommunicatie (THE), onder leiding van de
auteur van dit proefschrift, de computerberekeningen uit.

179
Dankwoord
Het in dit proefschrift beschreven onderzoek werd uitgevoerd in de
vakgroep Telecommunicatie van de Technische Hogeschool Eindhoven.
Alle huidige en voormalige leden van deze vakgroep wil ik bedanken
voor de prettige samenwerking en hun diverse bijdragen aan in dit
proefschrift beschreven werkzaamheden. Dit geldt mede voor de af
studeerders en stagiairs die bij het onderzoek betrokken waren.
Ook dank ik Wim Kohsiek van het Koninklijk Nederlands Meteorologisch
Instituut voor zijn onmisbare bijdrage aan een deel van de in dit
proefschrift beschreven experimenten.
Doret Pellegrino dank ik voor het snel en accuraat uittypen van dit
proefschrift en de manuscripten van de in dit proefschrift opgenomen
publikaties.

181 -
Curriculum Vitae
De auteur van dit proefschrift werd op 22 januari 1953 geboren te
Klundert.
Van 1965 tot 1971 volgde hij de middelbare schoolopleiding BBS-B
aan de Scholengemeenschap St. Norbertus te Roosendaal. In 1971 begon
hij met de studie Elektrotechniek aan de Technische Hogeschool
Eindhoven. Het ingenieursdiploma werd behaald in augustus 1978 (met
lof).
Vervolgens was hij werkzaam als wetenschappelijk assistent in de
vakgroep Telecommunicatie, Afdeling der Elektrotechniek, van de
Technische Hogeschool Eindhoven. Tot september 1979 heeft hij aldaar
gewerkt aan het ontwerp van zogenaamde contaured beam antennas voor
omroepsatellieten. Daarna is hij, in dezelfde vakgroep, begonnen aan
het in dit proefschrift beschreven promotiewerk.

Stellingen
behorend bij het proefschrift van
M.H.A.J. Herben

1. Door toepassing van zogenaamde contoured-beam satellietantennes is
het mogelijk om het door de satelliet uitgestraalde vermogen zo te
verdelen dat het gewenste dekkingsgebied gelijkmatig bestraald wordt,
terwijl de vermogensflux direct buiten dat gebied snel afneemt. Dit
ongeacht de vorm van het dekkingsgebied.
Herben, M.H.A.J. and Maanders, E.J., 1978, Some aspeots of eontaured
beam antennas, IEE Conf. Publ. 169, Pt. 1, 184-188.
Herben, M.H.A.J., 1979, Designinga eontaured beam antenna, TH Report
79-E-104, Eindhoven University of Teohnology, Eindhoven, Netherlands.
2. Voor het ontwerp van een contoured-beam antenne bestaande uit een
reflectorsysteem met een aantal belichters zullen, naast de amplitude
diagrammen, ook de fasediagrammen resulterend uit de gadefocusseerde
belichterposities nauwkeurig moeten worden bepaald.
Herben, M.H.A.J. and Maanders, E.J., 1979, The radiation pattem in
amplitude and phase of an offset fed paraboloidal ~eflector antenna,
AEU, 33, 413-414.
3. Het Schwarzschild microgolfantennesysteem met een lateraal verplaatste
belichter heeft slechtere verre-veld-eigenschappen dan men zou ver
wachten op grond van het optische systeem waarvan het is afgeleid.
Herben, M.H.A.J., van de Sande, J.H.A.W., Soheeren, P.M.J. and
Maanders, E.J., 1982, Geomet~ioal optical charaoteristics of the
Schwarzschild scanning antenna (Comparison with the Cassegrain
antenna), IEE Proc., Pt. H, 129, 315-320.
4. De verre-veld-eigenschappen van het Schwarzschild microgolfantenne
systeem met een lateraal verplaatste belichter kunnen aanzienlijk
verbeterd worden door de belichter ook over een geschikte afstand
axiaal te verplaatsen. Het zo verkregen optimaal gadefocusseerde
Schwarzschild antennesysteem heeft dan nagenoeg dezelfde verre-veld
eigenschappen als het equivalente Cassegrain antennesysteem.
Ibid.

5. De in dit proefschrift beschreven zijlusonderdrukking in een re
flectorantennesysteem kan voor communicatietoepassingen voldoende
breedbandig gemaakt worden door de excitatie van de tweede belichter
frequentie-afhankelijk te maken, bijvoorbeeld door het gebruik van
een transversaalfilter. De door dit filter geintroduceerde thermische
ruis dient evenwel kleiner te zijn dan de onderdrukte storing.
Arnbak, J.~ Herben, M.H.A.J. and van spaendonk, R.A.C.M., 1983,
Improved orbit utilization auxiliary feéds in existing earth
terminals, Spaae Communiaation and Broadcasting, 1 (issue 4).
6. Amplitude- en fasescintillatie van een door regen verstrooid radio
signaal kunnen vrij hoge frequentiecomponenten bevatten. Het meten
in een erg kleine bandbreedte kan dan ook leiden tot een onderschat
ting van de overspraak tussen radiocommunicatiesystemen die door dit
verstrooiingsmechanisme veroorzaakt kan worden.
Dit proefschrift, paragraaf 2. 4. 3.
7. De keuze van de vlakke-golf-representatie voor amplitudescintillatie
berekeningen aan een aardse straalverbinding, zoals Helmis et al.
die maken, is onjuist. Voor een dergelijk propagatiepad dient de
sferische-golf-representatie als uitgangspunt gekozen te worden.
Helmis. C.G., Asimakopoulos, D.N., Caroubalos. C.A., Cole. R.S.,
Medeiros Filho, F.C. and Jayasuriya, D.A.R., 1983, A quantitative
comparison of the rejractive index struature parameter determined from refractivity measurements and amplitude scintillation
measurements at 36 GHz, IEEE Trans., 221-224.
8. Door de vaak zeer lange tijd tussen het toezenden van onderzoeks
resultaten aan een tijdschrift en de publikatie hiervan kan men
nog maar zelden spreken over recent werk.
9. De duur van een promotiecontract zou afhankelijk moeten zijn van de
aard van de te verrichten werkzaamheden.
10. Het huidige regeringsbeleid is veel meer gericht op het behoud van
werk voor de ouderen dan het verschaffen van werk aan jongeren.