THE INFLUENCE OF SUPPLIER INFORMATION SHARING AND ...
168
THE INFLUENCE OF SUPPLIER INFORMATION SHARING AND INFORMATION QUALITY ON STRATEGIC PARTNERSHIPS AND INTERNAL LEAN PRACTICES AMONG SMALL TO MEDIUM ENTERPRISES IN SOUTH AFRICA. TINA MESMER SIKHWARI STUDENT NUMBER: 206013418 Dissertation submitted for the fulfilment of the requirements for the degree Magister Technologiae: Logistics In the FACULTY OF MANAGEMENT SCIENCES M. TECH: Logistics At the VAAL UNIVERSITY OF TECHNOLOGY Supervisor: Prof .R. Chinomona Co-supervisor: Dr. K. Mathu May 2015
Transcript of THE INFLUENCE OF SUPPLIER INFORMATION SHARING AND ...
THE INFLUENCE OF SUPPLIER INFORMATION SHARING AND INFORMATION
QUALITY ON STRATEGIC PARTNERSHIPS AND INTERNAL LEAN PRACTICES
AMONG SMALL TO MEDIUM ENTERPRISES IN SOUTH AFRICA.
TINA MESMER SIKHWARI
STUDENT NUMBER:
206013418
Dissertation submitted for the fulfilment of the requirements for the degree
Magister Technologiae: Logistics
In the
FACULTY OF MANAGEMENT SCIENCES
M. TECH: Logistics
At the
VAAL UNIVERSITY OF TECHNOLOGY
Supervisor: Prof .R. Chinomona
Co-supervisor: Dr. K. Mathu
May 2015

DECLARATION
This work has not previously been accepted in substance for any degree and is not
being concurrently submitted in candidature for any degree
Signed: …………………………
Date: May 2015
STATEMENT 1
This dissertation is being submitted in partial fulfilment of the requirements for the
degree of Magister Technologiae: Logistics
Signed: …………………………
Date: May 2015
STATEMENT 2
This dissertation is the result of my own independent work/investigation, except where
otherwise stated. Other sources are acknowledged by giving explicit references. A list of
references is appended.
Signed: …………………………
Date: May 2015
STATEMENT 3
I hereby give consent for my dissertation, if accepted, to be available for photocopying
and for interlibrary loan, and for the title and summary to be made available to outside
organisations.
Signed: …………………………
Date: May 2015
2

ACKNOWLEDGEMENTS
I wish to extend my sincere appreciation to:
The Lord for the wisdom and guidance in the strenuous journey and for giving
me the strength and ability to complete my studies.
My family for your love and support that has inspired me to accomplish my study.
My gratitude goes to my mom, sisters, brothers and uncle.
My Advisor, Prof. Richard Chinomona and my co- advisor, Dr. Ken Mathu, for
your availability, encouragement, assistance and professional guidance.
My research participants, without whom this research would not have been
possible. Thank you for your invaluable contributions that have seen me through
the task.
3

ABSTRACT
The focus of this study was to examine the relationship between information sharing,
information quality, strategic partnership and internal lean practices among Small and
Medium-sized Enterprises in South Africa. It is essential to understand practitioners’ and
entrepreneurs’ current knowledge towards the topic at hand in order to determine what
interventions would be most beneficial in helping to curb the problem of the lack of
knowledge in this area and to understand the underlying causes behind the problem,
while creating awareness and giving new insight to those who are already aware of this
topic.
Data was collected from a sample of 350 Small to Medium Enterprises and the
measurement items in the measuring instrument were measured using a 5-point likert
scale. Thereafter the collected data was coded and analysed by means of structural
equation modelling using the AMOS 21 software package.
The results indicate that supplier information sharing and information quality have a
strong influence on strategic partnership and in turn strategic partnership has a strong
influence on internal lean practices among Small to Medium Enterprises. This indicates
that the level and quality of information shared between Small to Medium Enterprises
and their suppliers has a positive effect on the strength of their partnerships as well as
on the internal practices of each Small to Medium Enterprise. Based on these results,
conclusions were drawn and recommendations were put forward on how internal lean
practices in Small to Medium Enterprises can be improved by means of information
sharing, information quality and strategic partnerships.
KEY WORDS: Supplier Information Sharing, Information Quality, Strategic Partnership,
Internal Lean Practices, Small and Medium Enterprises
4
TABLE OF CONTENTS DECLARATION............................................................................................................................ ii
ACKNOWLEDGEMENTS............................................................................................................ iii
ABSTRACT................................................................................................................................. iv
TABLE OF CONTENTS...............................................................................................................v
LIST OF TABLES.........................................................................................................................x
LIST OF FIGURES......................................................................................................................xi
LIST OF ACRONYMS................................................................................................................xii
LIST OF ACRONYMS................................................................................................................xiii
CHAPTER ONE...........................................................................................................................1
OVERVIEW OF THE STUDY......................................................................................................1
1.1 INTRODUCTION...................................................................................................................1
1.2 PROBLEM STATEMENT.......................................................................................................3
1.3 PURPOSE OF THE STUDY..................................................................................................3
1.4 OBJECTIVES........................................................................................................................3
1.4.1 PRIMARY OBJECTIVES....................................................................................................3
1.4.1.2 Theoretical objectives......................................................................................................4
1.4.1.3 Empirical Objectives........................................................................................................4
1.5 RESEARCH QUESTIONS.....................................................................................................4
1.6 JUSTIFICATION OF THE STUDY.........................................................................................5
1.7 SCOPE OF THE STUDY.......................................................................................................6
1.8 RESEARCH DESIGN AND METHODOLOGY.......................................................................6
1.8.1 Empirical Study...................................................................................................................6
1.8.1.1 Target Population.............................................................................................................6
1.8.1.2 Research Context............................................................................................................7
1.8.1.3 Sampling Design Technique.............................................................................................7
1.8.1.4 Sample Size.....................................................................................................................7
5
1.8.1.5 Measurement Instrument.................................................................................................8
1.9 DATA ANALYSIS AND STATISTICAL APPROACH................................................................8
1.10 VALIDITY AND RELIABILITY...............................................................................................9
1.10.1 Reliability and validity of measurement scales..................................................................9
1.11 ETHICAL ISSUES..............................................................................................................10
1.12 RESEARCH STRUCTURE................................................................................................10
1.13 OUTLINE OF THE STUDY................................................................................................12
1.14 CONCLUSION...................................................................................................................13
CHAPTER TWO........................................................................................................................15
SMALL AND MEDIUM SCALE ENTERPRISES IN SOUTH AFRICA.........................................15
2.1 INTRODUCTION.................................................................................................................15
2.2 BACKGROUND OF THE STUDY........................................................................................15
2.3 DEFINITIONS OF SMALL AND MEDIUM SCALE ENTERPRISES.....................................18
2.4 GOVERNMENT PERSPECTIVES ON SMEs IN SOUTH AFRICA......................................24
2.5 THE ROLE OF SMALL TO MEDIUM ENTERPRISES.........................................................26
2.6 SMALL TO MEDIUM ENTERPRISES AND THE SUPPLY CHAIN.......................................30
2.7 CONCLUSION.....................................................................................................................34
CHAPTER THREE....................................................................................................................35
LITRATURE REVIEW AND HYPOTHESES DEVELOPMENT...................................................35
3.1 INTRODUCTION.................................................................................................................35
3.2 THEORETICAL FRAMEWORK...........................................................................................35
3.2.1 The Coordination Theory..................................................................................................35
3.3 EMPIRICAL REVIEW..........................................................................................................37
3.3.1 Supplier Information- Sharing...........................................................................................37
3.3.1.2 Intra-organisational information sharing.........................................................................40
3.3.1.3 The Importance of Information-sharing in a Supply Chain.............................................42
3.3.2 Information Quality............................................................................................................43
6

3.3.2.2 Information Quality Frameworks....................................................................................46
3.3.2.3 The Dimensions of Information Quality..........................................................................48
3.3.3 Strategic Partnership........................................................................................................53
3.3.3.1 Types of Relationships...................................................................................................56
3.3.3.2 The Importance of Strategic Partnerships......................................................................59
3.3.4 Internal Lean Practices.....................................................................................................63
3.3.4.1 What is Lean Thinking?..................................................................................................63
3.3.4.2 The Fundamentals of Lean............................................................................................65
3.3.4.3 The Lean Supply Chain..................................................................................................67
3.3.3.4 Lean thinking and the theory of constraints....................................................................71
3.4 CONCEPTUAL FRAMEWORK AND HYPOTHESES DEVELOPMENT...............................72
3.4.1 Conceptual Framework.....................................................................................................73
3.4.2 Hypothesis development...................................................................................................74
3.4.2.1 Supplier Information-Sharing and Strategic Partnership................................................74
3.4.2.2 Information Quality and Strategic Partnership................................................................75
3.4.2.3 Strategic Partnership and Internal Lean Practices.........................................................76
3.5 CONCLUSION.....................................................................................................................79
CHAPTER FOUR......................................................................................................................80
RESEARCH METHODOLOGY AND DESIGN...........................................................................80
4.1 INTRODUCTION.................................................................................................................80
4.2 RESEARCH PHILOSOPHY.................................................................................................80
4.3 RESEARCH DESIGN..........................................................................................................82
4.3.1Target Population...............................................................................................................82
4.3.3 Research Context.............................................................................................................83
4.3.4 Sampling Design Technique..............................................................................................84
4.3.5 Sample Size......................................................................................................................84
4.3.6 Measuring Instrument.......................................................................................................86
7

4.4 DATA ANALYSIS AND DATA ANALYSIS APPROACH.........................................................87
4.4.1 Reliability and Validity of Measurement Scales.................................................................87
4.4.2. Structural Equation Modelling (SEM)...............................................................................88
4.4.2.1 What is Structural Equation Modeling?..........................................................................88
4.4.2.2 Basic Model...................................................................................................................89
4.5. RESEARCH MODEL FIT ASSESMENT (CFA & PATH MODELLING)................................90
4.5.1.1 Chi-square (χ2)..............................................................................................................91
4.5.1.2 Goodness-of-fit Index (GFI)...........................................................................................92
4.5.1.3 Root mean square residual (RMR)................................................................................92
4.5.1.4 The norm fit index (NFI).................................................................................................93
4.5.1.5 The comparative fit index (CFI)......................................................................................93
4.5.1.6 The incremental fit index (IFI)........................................................................................93
4.5.1.7 Root mean square error of approximation (RMSEA)......................................................93
4.6 CONCLUSION.....................................................................................................................95
CHAPTER FIVE.........................................................................................................................96
DATA ANALYSIS AND INTERPRETATION OF RESULTS.........................................................96
5.1. INTRODUCTION................................................................................................................96
5.2. DATA SCREENING.............................................................................................................97
5.2.1 Data Analytical Procedures...............................................................................................97
5.3 Descriptive Analysis Results................................................................................................98
5.4 SCALE ITEM RESULTS....................................................................................................105
5.5 RELIABILITY TESTS.........................................................................................................107
5.5.1 Confirmatory Factor Analysis (CFA) Results...................................................................107
5.5.1.1 Composite Reliability...................................................................................................107
5.5.1.2 Average Value Extracted (AVE)....................................................................................107
5.5.1.3 Scale Accuracy Analysis..............................................................................................108
5.5.2.1 Confirmatory Factor Analysis (CFA) Model...................................................................110
8

5.5.3 Conceptual Model Fit Assessment..................................................................................112
5.6 HYPOTHESES TESTING..................................................................................................113
5.6.1 Structural Equation Modeling (SEM) Results..................................................................113
5.6.1.1 Model Fit and Hypotheses Testing Results...................................................................113
5.6.1.2 SEM Conceptual Model Fit Assessments.....................................................................115
5.6.1.3 Hypothesis Testing Results..........................................................................................116
5.7 DISCUSSION OF THE RESULTS OF HYPOTHESES TESTS..........................................117
5.7.1 The Influence of Supplier Information Sharing on Strategic Partnership.........................117
5.7.2 The Influence of Information Quality on Strategic Partnership.........................................118
5.7.3 The Influence of Strategic Partnership on Internal Lean Practices..................................118
5.8 RESULTANT CONCEPTUAL MODEL................................................................................119
5.9 CONCLUSION...................................................................................................................120
CHAPTER SIX.........................................................................................................................121
CONCLUSIONS AND RECOMMENDATIONS.........................................................................121
6.1 INTRODUCTION...............................................................................................................121
6.2. REVIEW OF THE STUDY.................................................................................................121
6.3 CONCLUSIONS OF THE STUDY......................................................................................122
6.4 IMPLICATIONS OF THE STUDY.......................................................................................124
6.5 LIMITATIONS OF THE STUDY..........................................................................................125
6.6 RECOMMENDATIONS......................................................................................................126
6.7 CONCLUSION...................................................................................................................127
BIBLIOGRAPHY......................................................................................................................127
ANNEXURE 1..........................................................................................................................148
ANNEXURE 2..........................................................................................................................154
9
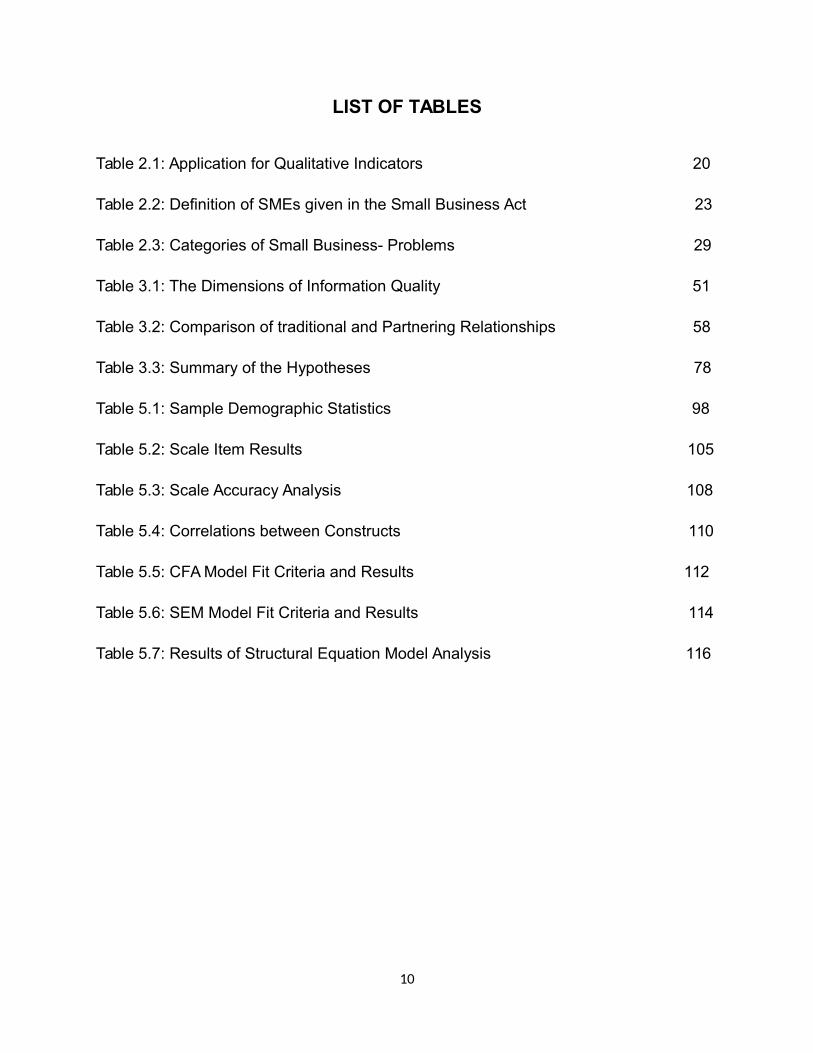
LIST OF TABLES
Table 2.1: Application for Qualitative Indicators 20
Table 2.2: Definition of SMEs given in the Small Business Act 23
Table 2.3: Categories of Small Business- Problems 29
Table 3.1: The Dimensions of Information Quality 51
Table 3.2: Comparison of traditional and Partnering Relationships 58
Table 3.3: Summary of the Hypotheses 78
Table 5.1: Sample Demographic Statistics 98
Table 5.2: Scale Item Results 105
Table 5.3: Scale Accuracy Analysis 108
Table 5.4: Correlations between Constructs 110
Table 5.5: CFA Model Fit Criteria and Results 112
Table 5.6: SEM Model Fit Criteria and Results 114
Table 5.7: Results of Structural Equation Model Analysis 116
10

LIST OF FIGURES
Figure 1.1: Research flow 11
Figure 1.2: Diagrammatic Representation of Chapter One 14
Figure 3.1: Factors Influencing Intra-organisational Information-sharing 41
Figure 3.2: Information Flow in a Supply Chain 42
Figure 3.3: Information Quality Frameworks 46
Figure 3.4: Types of Relationships 57
Figure 3.5: The Principles of Lean Thinking 64
Figure 3.6: Fundamentals of Lean 66
Figure 3.7: Conceptual Research Framework 73
Figure 5.1: Type of Business 100
Figure 5.2: Nature of the Business 101
Figure 5.3: Number of Employees in the Business 102
Figure 5.4: Province where the Organisation is Located 103
Figure 5.5: Number of Years the Business has been Operating 104
Figure 5.6: CFA Model 111
Figure 5.7: SEM Model 115
Figure 5.8: Conceptual Research Model 119
11

LIST OF ACRONYMS
SME Small and Medium Enterprises
SCM Supply Chain Management
SMME Small Micro and Medium- sized Enterprise
OECD Economic Co-operation and Development
VAT Value Added Tax
SAMAF South African Micro-finance Apex Fund
IDC Industrial Development Corporation
GSA Government of South Africa
GEM Global Entrepreneurship Monitor
EU European Union
ECU European Currency Unit
SA South Africa
R & D Research & Development
FMCG Fast Moving Consumer Goods
MNCs Multi- national Corporations
RFID Radio Frequency Identification
ADC Advanced Data Capture
ASP Active Server Pages
TPS Transaction Process System
TOC Theory of Constraints
CR Composite Reliability
AVE Average Variance Extracted
12
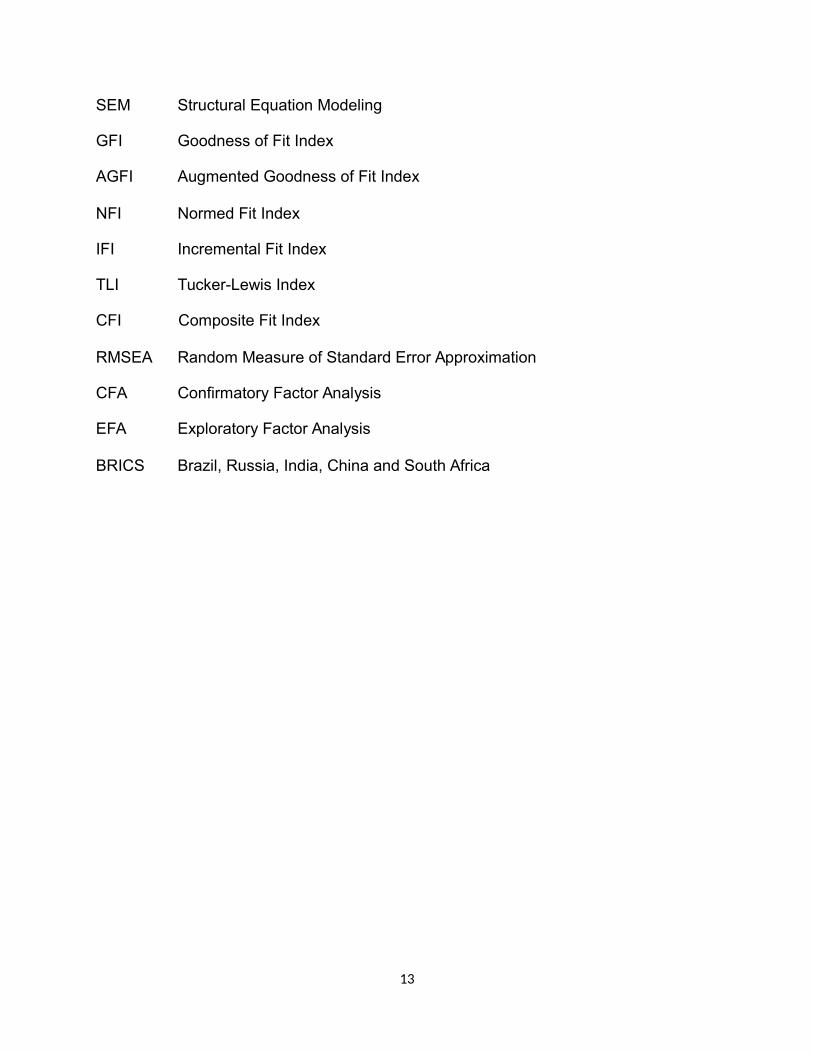
SEM Structural Equation Modeling
GFI Goodness of Fit Index
AGFI Augmented Goodness of Fit Index
NFI Normed Fit Index
IFI Incremental Fit Index
TLI Tucker-Lewis Index
CFI Composite Fit Index
RMSEA Random Measure of Standard Error Approximation
CFA Confirmatory Factor Analysis
EFA Exploratory Factor Analysis
BRICS Brazil, Russia, India, China and South Africa
13

CHAPTER ONE
OVERVIEW OF THE STUDY
1.1 INTRODUCTION
A supply chain is a system of suppliers, manufacturers, distributors, retailers, and
customers with material, financial, and information flows connecting participants in both
directions (Fiala 2005:419). Information-sharing in a supply chain refers to the act of
capturing and disseminating knowledge and data for decision makers to plan and
control supply chain operations (Togar, Alan & Ramaswami 2002:289). The type of
information that is shared is not limited to what products are supplied, the amount of
goods being produced or transported among the said supply chain partners and what
consumers are demanding, as reflected in product sales.
Sharing accurate and timely information throughout a supply chain can yield significant
performance improvements for the organisation as well as all members of the supply
chain (Diaz 2000:4). Despite these benefits, a high number of organisations are
reluctant to share information with their supply chain partners, due to the occurrence of
an unequal distribution of risks, costs, and benefits among the partners (Kumar & van
Dissel 1996:279). In an effort to compete in the ever-changing global economy, modern
enterprises strive to develop a flexible supply chain system in order to sustain their
competitive advantages. Supply chain management (SCM) is an effective tool in
integrating the production, operational or even strategic activities that exist in the buyer–
seller relationship. The unanswered questions are many, regarding information-sharing
and information quality and its influence on strategic partnership and lean practices
among organisations in South Africa. If we undertake empirical investigations into
supplier information-sharing from the technical and the managerial aspects, there are
still many areas worthy of investigation.
1
Despite the increasing complexity of the business environment, enterprises can transmit
and share information easily and effectively through specialised divisions of human
resources and internet connections and can achieve virtual integration with the supply
chain suppliers (Hsu, Chiu, Chen & Liu 2009:102). In terms of the supply chain system
as a whole, there is a complex relationship between the enterprises in a supply chain.
Organisations want to make the most profit from the sales; on the other hand, they have
to work with their supply chain partners and share the profits with them (Hsu et al.,
2009:102).
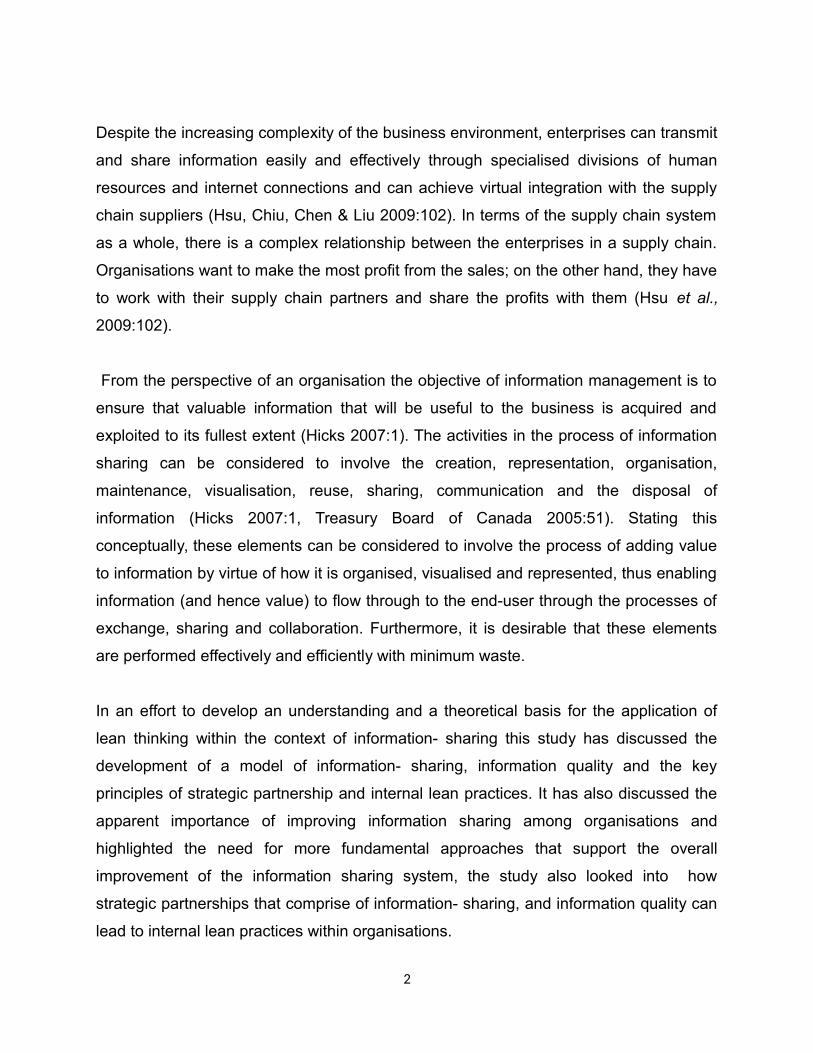
From the perspective of an organisation the objective of information management is to
ensure that valuable information that will be useful to the business is acquired and
exploited to its fullest extent (Hicks 2007:1). The activities in the process of information
sharing can be considered to involve the creation, representation, organisation,
maintenance, visualisation, reuse, sharing, communication and the disposal of
information (Hicks 2007:1, Treasury Board of Canada 2005:51). Stating this
conceptually, these elements can be considered to involve the process of adding value
to information by virtue of how it is organised, visualised and represented, thus enabling
information (and hence value) to flow through to the end-user through the processes of
exchange, sharing and collaboration. Furthermore, it is desirable that these elements
are performed effectively and efficiently with minimum waste.
In an effort to develop an understanding and a theoretical basis for the application of
lean thinking within the context of information- sharing this study has discussed the
development of a model of information- sharing, information quality and the key
principles of strategic partnership and internal lean practices. It has also discussed the
apparent importance of improving information sharing among organisations and
highlighted the need for more fundamental approaches that support the overall
improvement of the information sharing system, the study also looked into how
strategic partnerships that comprise of information- sharing, and information quality can
lead to internal lean practices within organisations.
2
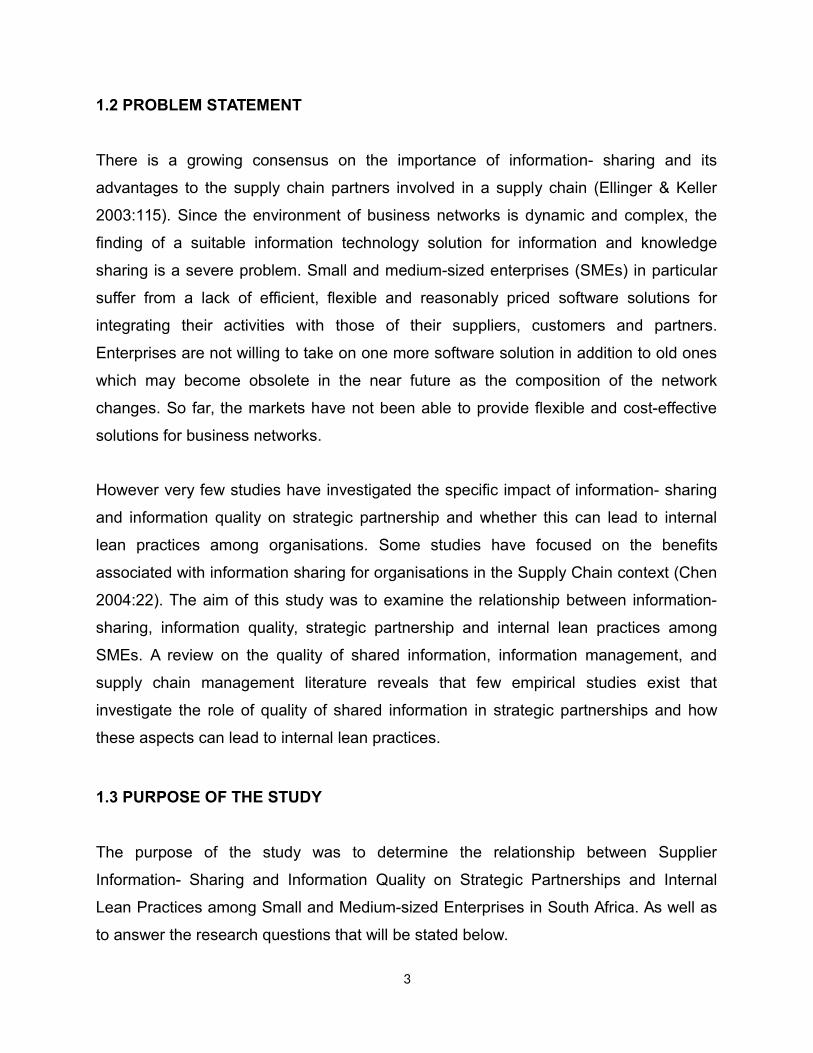
1.2 PROBLEM STATEMENT
There is a growing consensus on the importance of information- sharing and its
advantages to the supply chain partners involved in a supply chain (Ellinger & Keller
2003:115). Since the environment of business networks is dynamic and complex, the
finding of a suitable information technology solution for information and knowledge
sharing is a severe problem. Small and medium-sized enterprises (SMEs) in particular
suffer from a lack of efficient, flexible and reasonably priced software solutions for
integrating their activities with those of their suppliers, customers and partners.
Enterprises are not willing to take on one more software solution in addition to old ones
which may become obsolete in the near future as the composition of the network
changes. So far, the markets have not been able to provide flexible and cost-effective
solutions for business networks.
However very few studies have investigated the specific impact of information- sharing
and information quality on strategic partnership and whether this can lead to internal
lean practices among organisations. Some studies have focused on the benefits
associated with information sharing for organisations in the Supply Chain context (Chen
2004:22). The aim of this study was to examine the relationship between information-
sharing, information quality, strategic partnership and internal lean practices among
SMEs. A review on the quality of shared information, information management, and
supply chain management literature reveals that few empirical studies exist that
investigate the role of quality of shared information in strategic partnerships and how
these aspects can lead to internal lean practices.
1.3 PURPOSE OF THE STUDY
The purpose of the study was to determine the relationship between Supplier
Information- Sharing and Information Quality on Strategic Partnerships and Internal
Lean Practices among Small and Medium-sized Enterprises in South Africa. As well as
to answer the research questions that will be stated below.
3

1.4 OBJECTIVES
1.4.1 PRIMARY OBJECTIVES
The main primary objective of this study is to investigate the relationship between
Supplier Information- Sharing and Information Quality on Strategic Partnerships and
Internal Lean Practices among Small and Medium-sized Enterprises in South Africa. To
enable the fulfilment of the objectives of this study, the research objectives are
categorized into theoretical and then later empirical objectives in order to fulfil the
purpose of the study. The primary objectives are stated below:
1.4.1.2 Theoretical objectives
Theoretical objectives are based on the literature review and these objectives are
formulated as follows:
To review literature related to supplier information sharing; To conduct a literature review on information quality; To conduct a literature review on strategic partnership; and To conduct a literature review on internal lean practices among organisations.
1.4.1.3 Empirical Objectives
Empirical objectives are based on the relationships between the research variables. The
empirical objectives are developed as follows:
To investigate the influence of supplier information sharing on strategic
partnerships amongst SMEs; To determine the influence of information quality on strategic partnerships
amongst SMEs; To determine the impact of strategic partnerships on internal lean practices
among SMEs.
4

1.5 RESEARCH QUESTIONS
To gain in-depth knowledge on the research topic this study seeks to answer the
following research questions:
Does Information- sharing among organisations lead to stronger partnerships? Does the level of information quality enhance the strength of strategic
partnerships? What impact do strategic partnerships have on internal lean practices? Does the sharing of information and its quality in strategic partnerships lead to
leaner internal practices that in turn lead to less waste?
The study seeks to determine the relationship between the variables within the stated
questions and to answer these questions, taking the views and opinions of the
respondents’ in the SME sector into account.
1.6 JUSTIFICATION OF THE STUDY
In order to fill the identified literature gap, indicated above, the purpose of this study is to
investigate the relationship between supplier information- sharing and information
quality on strategic partnerships and internal lean practices among SME’s in South
Africa. There is limited research that has been done in South Africa with reference to the
topic of this study, particularly in the SME sector. The attempt to conduct such a study is
justified and this study makes a contribution to both academics and management
practice. In order to fill the identified literature gap, indicated above, it is essential to
know practitioners’ and entrepreneurs’ current knowledge of the topic in order to
determine what interventions would be most beneficial in helping to curb the problem of
the lack of knowledge in this area and to understand the underlying causes behind the
problem, while creating awareness and giving new insight to those who are already
aware of this topic.
5

On the academic front, this enquiry will hopefully generate new and supplement existing
academic knowledge on small business external relationship management and how it
can be beneficial to business enterprises. On the practitioners’ front, the study is set to
provide practical insights and recommendations as well as awareness, to the many
managers in the SME sector on a business aspect that has been under researched.
1.7 SCOPE OF THE STUDY
The scope of this study covered organisations in four provinces of South Africa, both
private and public sector in the supply chain business environment with a focus on small
and medium- sized enterprises.
1.8 RESEARCH DESIGN AND METHODOLOGY
Punch 2010:47, defines research design as a strategy and the structure of conducting
the research project. Quantitative research tools are reviewed as systematic and
structured devices that aim to obtain information from respondents in a direct and open
manner (Du Plessis & Rousseau 2007:21). Results from these research tools are easily
quantifiable and the instruments have a potentially high degree of accuracy. Whereas,
Qualitative research tools are those that are more unstructured, flexible, and diagnostic
than quantitative research tools, and aim to obtain information from respondents in an
indirect manner. Their results are more descriptive, but are difficult to quantify and prone
to measurement error and bias (Hair et al., 2010:4). The research design for this paper
will encompass both a review of the literature and an empirical study using a
quantitative research approach.
1.8.1 Empirical Study
The empirical part of this dissertation includes the following methodological aspects:
1.8.1.1 Target Population
6
A population is the collection of elements (people or objects) about which the researcher
wants to make inferences and the total group of people who could be asked to
participate in the research study (Berndt & Petzer 2011:347). The database of the SMEs
in South Africa will be used to collect information from all firms in four provinces
including the Gauteng, North West, Free State and Limpopo province.
1.8.1.2 Research Context
The empirical contexts for this proposed study are the organisations and manufacturing
industries of the supply chain in South Africa. Several factors were considered and
prompted the choice of both the organisations and manufacturing industries of the
supply chain sector as the research context.
1.8.1.3 Sampling Design Technique
Sampling techniques are divided into probability and non-probability sampling (Hair et
al. 2010:20). This research will use probability sampling. A stratified sampling method
will be used for validity and reliability reasons using the database from the Ministry of
small and medium enterprises. With stratified sampling, the population is divided into
mutually exclusive groups (industry sectors) and random samples are drawn from each
group (Armstrong & Kotler 2007:111).
1.8.1.4 Sample Size
Sample size is a function of change in the population parameters under study and the
estimation of the quantity that is needed by the researcher (Wegner 2000:86-87).
Generally, larger samples result in more precise and robust statistical findings, while
smaller samples result in less precise and unreliable findings (Terre Blanche et al.,
2006:236). A sample size of 350 was deemed to be adequate to provide a good
7

representation of supply chain organisations to be surveyed in the given provinces in
South Africa; the chosen sampling size will be used to represent most of the South
African organisations.
1.8.1.5 Measurement Instrument
The measurement instrument was designed in such a way that it suits the South African
context. The measurement items were measured using a 5-point Likert scale using the
following representative values: 1-strongly disagree to 5-strongly agree. The scale is
based upon the assumption that each statement or item on the scale has equal
attitudinal value, importance or weight in terms of reflecting attitudes towards the issued
questions (Kumar 2005:145). The questionnaire item will contain four variables, namely,
information sharing, information quality, strategic partnerships and internal lean
practices.
1.9 DATA ANALYSIS AND STATISTICAL APPROACH
Three hundred and fifty questionnaires were distributed to respective SMEs after
making appointments and agreement with respective owners or managers of the
organisations taking into account all ethical considerations. This is done because
Structural Equation Modelling requires a large data set to obtain meaningful results
(Hair et al. 2010:50). Self-administered structured questionnaires were used for validity
and reliability reasons. The collected data was coded in an excel spread sheet and data
cleansing performed. Descriptive statistics were obtained using SPSS 21 software and
the CFA and path modelling were tested using AMOS 21 software.
To gain an understanding of the characteristics of each variable, descriptive statistics
analysis was used which will be illustrated by the mean and standard deviation of each
factor in the data analysis chapter. In addition, confirmatory factor analysis (CFA) was
undertaken leading to a structural equation model (SEM).
8
1.9.1Structural Equation Modelling (SEM)
For this study SEM was undertaken using the AMOS 21 software package in order to
test the structural paths of the conceptualised research model. SEM technique
demonstrates and tests the theoretical undergrounds of a proposed study and the
significance of the relationships between models constructs (Hair et al. 2010: 51). SEM
stipulates a technique where separate relationships are allowed for each set of
dependent variables and it provides an estimation technique for a series of separate
multi-regression equations to be estimated simultaneously. It further contains two
components namely the structural model, which is the path where independent, and
dependent variables are being connected and the measurement model that enables this
study to use several indicators for a single independent variable. By assessing each
relationship simultaneously rather than separately, an incorporation of all the multi-scale
items can be used to account for measurement errors within each scale (Hair et al
2010:51).
1.10 VALIDITY AND RELIABILITY
1.10.1 Reliability and validity of measurement scales
The trustworthiness of the study is ascertained through the validity and reliability of the
data collected. Validity refers to the extent in which an empirical measure adequately
reflects the real meaning of the concept under consideration (Babbie, Moutton, Vorster
& Prozesky 2011:122). Validity convinces the reader that the researcher is credible and
that the results are worthwhile. An effect or test is valid if it demonstrates or measures
what the researcher claims it does (Coolican 1992:35).
Reliability and validity is undertaken to check for consistency and meaningfulness of the
collected research data. Factor analysis was done to check the reliability of the
measurement items and the internal consistency of the research constructs. In
9

particular, the factor loadings, the Cronbach’s alpha values and composite reliability
(CR) values were determined using SPSS software in order to check measurement
items reliability. Convergent and discriminate validity of the research constructs were
determined by checking the inter-correlation between the research constructs and by
determining the Average Variance Extracted (AVE).
1.11 ETHICAL ISSUES
Ethics is a concern with the development of moral standards by which situations can be
judged and it applies to all situations in which there can be actual or potential harm of
any kind to an individual or group (Cant et al. 2003:220). In research, ethical issues can
be examined as they relate to participants, researchers and sponsoring organisations.
According to Kumar (2005:216) the participants, the researcher and the sponsoring
organisations all have ethical issues which should be considered when formulating a
research document.
This is important as this requires that permission to conduct the enquiry is sought and
assurances of confidentiality need to be made to the participants. The researcher
requested permission from the participants before conducting the study, indicating that
permission had been obtained to conduct a study in the various SMEs that took part in
the study. There is an imperative need to seek permission from owners or managers of
the organisations and industries concerned to obtain the information that is needed.
There is also a need, in this case, to complete an ethical or approval form from Vaal
University of Technology. In addition, the respondents’ information will be kept
confidential and they will remain anonymous (Churchill 1991:54).
1.12 RESEARCH STRUCTURE
A scientific research approach was adopted in this study which involved a step-by step
logical, organised and rigorous sequence of identifying problems, gathering of data,
10

analysing the collected data and drawing conclusions. First, the author indicated the
motivation for the research and identified the main purpose of the study by providing its
overview. Second, the relevant literature on the problem of research interest is
reviewed. Third, drawing from the reviewed theoretical and empirical literature,
conceptual frameworks were built and research hypotheses developed for the study.
Fourth, following hypotheses development, methodology was determined and
implemented and data was collected. Fifth, the conceptualised model and posited
hypotheses were empirically tested using data collected and the results were then
interpreted. Finally, concluding remarks were provided, theoretical and practical
implications of the study were extrapolated, and suggestions for future research
directions were indicated.
Figure 1.1 below illustrates the six-stage research procedure followed by the author of
this study:
Figure 1.1: Research Flow
Source: Adopted from Chinomona (2011:16)
11
• Overview Of The Study• Overview Of The Study
• Review of Relevant Literatures• Review of Relevant Literatures
• Research Model Conceptualization and Hypotheses Development• Research Model Conceptualization and Hypotheses Development
• Research Methodology and Design• Research Methodology and Design
• Data Analysis and Results• Data Analysis and Results
• Conclusion and Recommendations• Conclusion and Recommendations
1.13 OUTLINE OF THE STUDY
This study consists of six chapters with the contents as mentioned below:
Chapter 1: Overview of the studyThis chapter provides the research back ground. It provides an explanation of the
background of the problem, purpose, research objectives, justification, scope and the
significance of the study.
Chapter 2: Small and Medium-sized Enterprises in South AfricaThis chapter discusses SME’s in South Africa in detail. It also explains what is known
about these organisations and their supply chain practises as well as how supply chain
relationships are managed by these organisations.
Chapter 3: Literature Review and Hypothesis Development.Chapter three presents and explains the coordination theory, as well as describing and
empirically reviewing the variables based on the previous literature. A conceptual
research framework is then developed based on the literature reviewed and the
hypothesis statements are then outlined.
Chapter 4: Research Methodology and DesignChapter five discusses the research methodology and design used in the study. Issues
such as sampling technique, method of data collection and statistical techniques are
addressed in this chapter.
Chapter 5: Data Analysis and ResultsThis chapter provides a statistical analysis of the data collected and the results obtained
are discussed.
Chapter 6: Conclusions and RecommendationsThis chapter presents the conclusions drawn from the research findings and the
research objectives. Implications of the findings, recommendations, limitations and
future research directions are also discussed in this chapter.
1.14 CONCLUSION
12

This chapter provided an introduction to the researcher’s interest in the topic of study.
The problem with relevance to SMEs was outlined, through the problem statement and
motivation for the study. The aims or purpose of the study was then presented, followed
by the primary research objectives: both theoretical and empirical. The research
questions are then stated followed by a justification of the study and the selected scope
of the study. The research methodology and design of the study were discussed as well
as ethical issues to be considered during the study. The chapter ends off with the
research structure illustration showing the process of the study diagrammatically; and
an outline of the forthcoming chapters of the study were stated according to the
chapters’ organisation.
Below in figure 1.2 is a diagrammatic representation of Chapter One
Figure 1.2: Diagrammatic Representation of Chapter One
13
Introduction
Problem Statement
Research Questions
Primary Research ObjectivesTheoretical ObjectivesEmpirical Objectives
Justification of the Study
Scope of the Study
Research Design and Methodology
Ethical Issues
Outline of the Thesis
Conclusion of Chapter One
Research Structure

14

CHAPTER TWO
SMALL AND MEDIUM SCALE ENTERPRISES IN SOUTH AFRICA
2.1 INTRODUCTION
This chapter provides a discussion on the literature regarding small and medium
enterprises in South Africa globally as well as their role and importance in the economy.
The chapter begins with an introduction followed by a discussion on the background of
the study with emphasis to SMEs in this case. Other aspects discussed include
definitions to gain a broader understanding of the concept followed by government
perspectives on SMEs, the role of these enterprises and lastly SMEs and the supply
chain. The SME sector of the economy has been described as an important factor in the
sustainability of economic growth as well as the development of many economies
through the ability of these enterprises to adjust to environmental changes and
technological orientation (Adams, Khoja & Kauffman 2012:22). It is therefore important
to study this concept with the objective of providing a better understanding on the
relative significance they have to the global economy. The chapter is then ended off with
a conclusion.
2.2 BACKGROUND OF THE STUDY
Since 1994, South Africa has been faced with the double challenges of re-integration
into global markets as a global economy, while at the same time positioning itself to
realize the high expectations of its populace regarding a successful transition towards a
more democratic order. While trying to achieve the objectives of economic growth
through competitiveness on one hand and employment generation and income
redistribution as a result of this growth on the other hand, South Africa's small micro and
15
medium sized enterprise (SMME) economy has been actively promoted since 1995
(Berry & von Blottnitz 2002:1).
The SMEs constitute by far the largest number of firms in the private sector, even
though academics and policy-makers tend to focus on large organisations. The SMEs
account for up to 90% of all registered organisations in an economy, and even more if
the informal sector is included. In addition, SMEs are important providers of
employment and producers of a large share of total industrial output, even in developing
countries (Jeppensen, Kothuis & Tran 2012: 9).
The South African SME sector is faced with expectations to fulfil a number of roles,
ranging from poverty alleviation and the creation of employment to international
competitiveness. These objectives are not only very diverse policy objectives, but the
policy instruments introduced to meet these objectives can also be equally different,
ranging from literacy, training as well as technological advice (Berry & von Blottnitz
2002:5).
One of the greatest difficulties confronting policy makers is how best to develop an
approach to SMEs and small micro and medium sized enterprise that achieves a
sufficient degree of co-ordination between the supply side effort and demand potential.
Although there is the risk of investing resources in improving supply potential where
demand constraints are high (e.g. low growth in demand because of regional
stagnation), a major question is whether supply-side incentives have frequently been
ineffective because of such demand problems or whether incorrectly specified supply
policies/deficient service delivery are the true causes of lack of success (Blueprint
Strategy & Policy 2005:9).
According to Mahembe, there is consensus among policy makers, economists, and
business experts that SMEs are drivers of economic growth. A healthy SME sector
contributes prominently to the economy through the creation of more employment
opportunities, the generation of higher production volumes, increasing exports and the
16
introduction of innovation and entrepreneurship skills to the economy. The dynamic role
of SMEs in developing countries insures these organisations as engines through which
the growth objectives of developing countries can be achieved (Mahembe 2011:7).
Much of the literature on SMEs in South Africa concurs that the sector is not performing
optimally, for a wide range of reasons. Some of the causal factors were inherited from
the apartheid state, others are a result of globalisation and international economic
pressures, but many are due to the poor performance of the regulatory environment and
support agencies of the current South African State (Atkinson 2012: 6).
The benefits of Supply Chain Management (SCM) for SMEs are evident from previous
studies, among these benefits are the obtaining of a competitive advantage through
relationships between clients and suppliers as well as the positive impact on
organisational performance (Alhourani & Saxena 2014:1). A number of recent and
previous studies also highlight the contribution of SCM practices for innovations in
SMEs (Zeng, Xie & Tam 2010:181-194; Bos-Browers 2010:91-109; Wang and Kafouros
2009:606; Abereijo et al. 2009: 82-89; Kaminski, Oliveira & Lopes 2008:96; Kaufmann &
Tödtling, 2002:147).
Small and medium enterprises (SMEs) have lately been identified as productive drivers
of the overall economic growth and development in South Africa and around the world.
Some researchers have estimated that, in South Africa, small and medium-sized
enterprises make up 91% of formalized organisations, and provide employment to about
60% of the labour force and contribute total economic output accounts of roughly 34%
of the GDP (The Banking Association South Africa 2013).
While contributing significantly to the economy, SMEs foster diversification through their
development of new and unsaturated sectors of the economy. Additionally, innovative
and technology-based small and medium enterprises can provide a platform for local,
regional and international growth, especially in Brazil, Russia, India, China and South
Africa (BRICS) economies. SMEs are considered an important contributor to the
17

economy as drivers for the reduction of unemployment, especially since the formal
sector continues to shed jobs (The Banking Association South Africa 2013).
According to the minister of industry and trade, the development of a vibrant economy
depends on how entrepreneurial the people are, and though some believe that
entrepreneurs are born; the fact is that entrepreneurs are made. A strategic thinking is
how to develop consistently, the capacity to making entrepreneurs. Business
development is about seeing opportunities and developing the best ways of tapping into
those opportunities to one’s advantage. A country may have quite a number of natural
resources but they are worthless until they are exploited and transformed into other
consumable products that can be marketable. The Government supports initiatives to
develop capacities to effect the transformation. The way the existing and potential
entrepreneurs react to these efforts demonstrates how receptive the community is to
business development initiatives. Active involvement of all stakeholders is a key factor
to gradual and consistent organisational growth and development (Chami 2011:1).
The small enterprise sector in South Africa possesses the potential to make a significant
contribution to economic growth and employment of the country. It is through the
implementation of innovation that better service and increased employment becomes a
natural consequence. Through information- sharing the supply chains in SME’s can be
improved and many benefits can thus be derived.
2.3 DEFINITIONS OF SMALL AND MEDIUM SCALE ENTERPRISES
The importance of the SME sector and the informal sector is internationally
acknowledged and every country has its own definition making it difficult to define the
concept. There is no single, uniformly accepted definition of a small organisation
(Storey 1994). Organisations differ in their levels of capitalisation, sales and
employment. Therefore, definitions which apply measures of size (e.g. number of
employees, rate of turnover, rate of profitability and net worth) when applied to one
sector might lead to all organisations being classified as small, while the same size
18

definition when employed to a different sector might result in an unrelated result. The
definition of these enterprises vary among researchers with capital assets, skill of
labour, turnover level, legal status or method of production often forming the basis on
which descriptions are formulated (Abor et al., 2010:219).
This section presents a broad overview of small enterprise definitions that are utilized
across the globe with the objective of gaining an understanding of SMEs. This
understanding goes a long way in the comparison and benchmarking of results obtained
from various different studies.
SME definitions can be broadly classified into two, “economic” and “statistical”
definitions. Under the economic definition, an organisation is regarded as small if it
meets the following three criteria (UNIDO 2005:9):
It has a relatively small share of the market place; It is managed by owners, or part owners, in a personalized way and not through
the medium of a formalized management structure; and It is independent in the sense that it is not part of a larger enterprise.
The statistical definition, on the other hand, is used in three main areas that include:
Quantifying the size of the small organisation sector and its contribution to GDP,
employment and exports; Comparing the extent to which the small organisation’s sectors of economic
contribution have changed over time; and In a cross-country comparison of the small organisations’ economic contribution.
These definitions, nonetheless, have a number of weaknesses that acorganisation
them. For instance, the economic definition, which states that a small business is
managed by its owners or part owners in a personalized manner and not through the
medium of a formal management structure, is found to be incompatible with the
statistical definition of a small manufacturing organisation which may have up to 200
employees (Yon & Evans 2011: 2). According to UNIDO, the definition of SMEs is a
19

significant issue for the purpose of policy development and implementation and in most
cases depends primarily on the purpose of the classification. For the motives of policy
development, UNIDO generally advises countries to take into account the quantitative
and qualitative indicators for SME definition. The table that follows below summerises
the main qualitative indicators that can be used in order to differentiate between SMEs
and large companies (Yon & Evans 2011:3).
Table 2.1: Application for Qualitative IndicatorsCategory SMEs Large Companies
Management • Proprietor entrepreneurship
• Functions-linked personality
• Manager-entrepreneurship
• Division of labour by subject
matters
Personnel • Lack of university graduates
• All- round knowledge
• Dominance of university
graduates
• Specialization
Organisation
Sales
Buyer’s relationships
Production
Research development
• Highly personalized contacts
• Competitive position not
defined and uncertain
• Unstable
• Labour intensive
• Following the market, intuitive
approach
• Highly formalized
communication
• Strong competitive position
• Based on long- -term contracts
• Capital intensive, economies of
scale
• Institutionalized
Finance • Role of family funds, self-
financing
• Diversified ownership structure,
access to anonymous capital
market
Source: UNIDO (2005:81)
The abbreviation "SME" occurs commonly in the European Union (EU) and in
international organisations such as the World Bank (WB), the United Nations (UN) as
20
well as the World Trade Organisation (WTO). The term "small and medium businesses"
or "SMBs" is predominantly used in the USA. In South Africa the term is “SMME” for
small, medium and micro-enterprises, and elsewhere in Africa, MSME is used for micro,
small and medium enterprises (Etumeahu, Okekeke & Kingsley 2009:14). As
experienced in other countries, the issue of what constitutes a small or medium
enterprise is a major concern in South Africa. Various authors have given different
definitions of this category of business. A common definition of SMEs includes
registered businesses with less than 250 employees (International Finance Corporation
2009:9).
In practice, SMEs are defined in a number of different ways, generally with reference
either to the number of employees or to turnover bands (or a combination of both, as in
the National Small Business Act of 1996, which also allows for variations according to
industry sector). The definition of SMEs by size is necessary, but it is not sufficient for
an understanding of a sector where the realities are not only complex, but also dynamic
(Mahembe 2011:24).
Despite the importance of this sector, there is no generally agreed upon or universally
applicable definition of SMEs. A number of factors, related to a given socio-economic
environment, influence the definition of SMEs.
The following are some of the determinants for ‘SME’ that are given in literature (The
Task Group of the Policy Board for Financial Services and Regulation 2001:24-25):
The Organisation for Economic Co-operation and Development (OECD) views
SMEs as firms with fewer than 500 employees.
The Cruickshank Report focused on ‘those firms which are no longer treated as
personal customers by providers of money transmission services and credit, but
are too small to have direct access to competitive capital markets’, stating that
21

they consist mostly of enterprises with a turnover of up to £10 million (R178 789
273.20; 9/11/2014), or employment of up to 250 people.
The Standard Bank of South Africa defines SMEs as firms with a turnover of
between R150 000 and R5 million per annum.
The most widely used framework in South Africa is the definition from the National Small
Business Act 102 of 1996, (Abor & Quartey 2010:221) which defines the five categories
of business as follows:
Survivalist enterprise: The income generated is less than the minimum income
standard or the poverty line. This category is considered to be pre-
entrepreneurial, and it includes hawkers, vendors and subsistence farmers. (In
practice, survivalist enterprises are often categorized as part of the micro-
enterprise sector.)
Micro enterprise: The turnover is less than the VAT registration limit (that is,
R150 000 per year). These enterprises usually suffer a lack formality in terms of
registration. They include, for example, spaza shops, minibus taxis and
household industries. They employ no more than five people.
Very small enterprise: These are enterprises that employ fewer than 10 paid
employees, excluding mining, electricity, manufacturing and construction sectors,
in which the figure is 20 employees. These enterprises operate in the formal
market and have access to technology.
Small enterprise: The upper limit for employment is 50 employees. Small
enterprises are generally more established than very small enterprises and they
exhibit more complex business practices.
22
Medium enterprise: The maximum number of employees here is 100, or 200 for
the mining, electricity, manufacturing and construction sectors. These enterprises
are often characterized by the decentralization of power to an additional layer of
management.
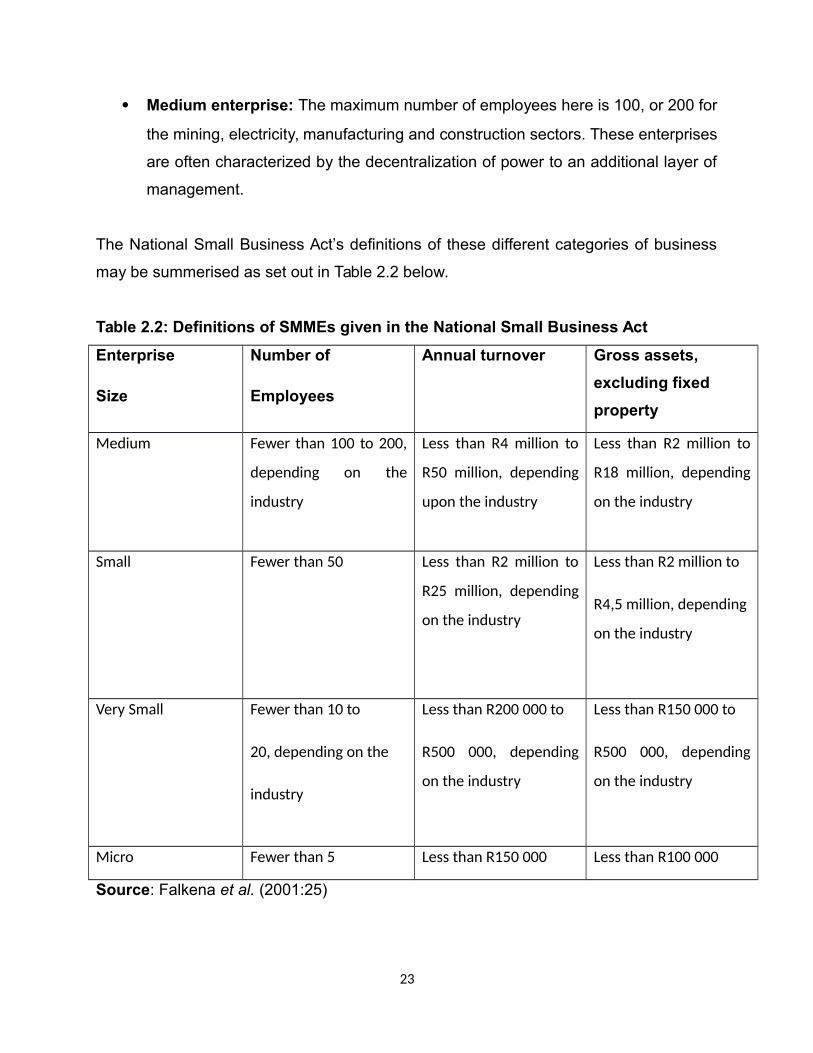
The National Small Business Act’s definitions of these different categories of business
may be summerised as set out in Table 2.2 below.
Table 2.2: Definitions of SMMEs given in the National Small Business Act
Enterprise
Size
Number of
Employees
Annual turnover Gross assets,
excluding fixed
property
Medium Fewer than 100 to 200,
depending on the
industry
Less than R4 million to
R50 million, depending
upon the industry
Less than R2 million to
R18 million, depending
on the industry
Small Fewer than 50 Less than R2 million to
R25 million, depending
on the industry
Less than R2 million to
R4,5 million, depending
on the industry
Very Small Fewer than 10 to
20, depending on the
industry
Less than R200 000 to
R500 000, depending
on the industry
Less than R150 000 to
R500 000, depending
on the industry
Micro Fewer than 5 Less than R150 000 Less than R100 000
Source: Falkena et al. (2001:25)
23

2.4 GOVERNMENT PERSPECTIVES ON SMEs IN SOUTH AFRICA
The importance of the SME sector has been recognised and the limitations on the
growth of this sector have also been recognized at top levels in the South African
Government. According to Government's New Growth Path of 2010, an important
priority is enterprise development, promoting small business and entrepreneurship and
eliminating unnecessary red-tape (Atkinson 2012:6).
The core components of the Government's strategy are included in the points below as
adapted from (Atkinson 2012:6):
To establish a one-stop shop and single funding agency for small and micro-
business through the consolidation of Khula, SAMAF and IDC funding, amongst
others, to improve access and to reduce the overhead costs of government in
order to make more resources available to end-users;
To fully implement government's long-standing commitment to pay small
business suppliers within 30 days, with clear consequences (fiscal penalties) for
non-compliance by public entities;
To integrate small and micro-enterprise support systematically into all sector
strategies; this is critical to ensure a space for smaller enterprises in the value
chains of major industries and to support the development of clusters and
sectoral regulations and market institutions that meet the needs of smaller
producers;
To initiate a red-tape elimination campaign to simplify regulated procedures and
forms and remove any bias against smaller producers, for instance in zoning
requirements, with results reported to Cabinet on a quarterly basis;
To strengthen access to micro-finance for small enterprises in order to bring
more citizens into economic activities and thus widen the enterprise pool in the
country as one key step to promote the growth of new enterprises; and
24

To address smaller businesses' concerns about access to and the cost of space
in shopping malls.
According to the National Planning Development Commission it is worth making special
mention of the limited expansion of small and medium-scale enterprises. In successful
economies, it is in these organisations where most job creation takes place. South
Africa is still attempting to successfully lay the ground for faster small, medium and
micro enterprise (SMME) entry and expansion. Special concerns relate to difficult
regulatory environment, limited access to financial resources and working capital and
concentrated markets with limited niche opportunities (Diagnostic Report 2011:12).
In terms of the Government's analysis, the manufacturing sector is arguably more
critical than the services sector. In recent years formal employment growth has come
predominantly from the services sector, particularly in the wholesale and retail and
business services sectors. However, these employment gains are currently uncertain.
Business services employment growth has been driven predominantly by two factors:
the outsourcing of activities such as logistics and catering; and the growth in the private
security sector (Atkinson 2012:6).
The unsustainable dependence of retail and wholesale employment growth on private
credit extension rather than income growth in productive sectors has been
demonstrated by the large reversals of employment in this sector in the light of the
collapse in credit extension as a consequence of the economic crisis. Therefore long-
term increases in employment - in all sectors of the economy - need to be underpinned
by higher growth in the production sectors of the economy, led by manufacturing.
(Government of South Africa (GSA) 2010:6)
Both agro-processing and construction sectors can be regarded as closely linked to
manufacturing and are therefore important sectors. (The GEM reports define these
sectors as part of the “transformative” group of sectors, as opposed to the “extractive”
and “service” sectors.) Manufacturing is likely to promote large-scale employment,
particularly of semiskilled workers (Atkinson 2012:6).
25
Much of the literature on SMEs in South Africa concurs that the sector is not performing
optimally, for a wide range of reasons. Some of the causal factors were inherited from
the apartheid state, others are a result of globalisation and international economic
pressures, but many are due to the poor performance of the regulatory environment and
support agencies of the current South African State (Atkinson 2012:6).
2.5 THE ROLE OF SMALL TO MEDIUM ENTERPRISES
According to Etumeahu, Okekeke & Kingsley (2009:16) industrial policies have
traditionally focused on large enterprises and individual sectors. Earlier, policies
regarding industry mainly supported sectors that experienced problems due to structural
changes in the economy. Policies regarding small enterprises and entrepreneurship
have grown over the last two decades and an apparent shift has been seen in
perspective from existing enterprises to an increased interest in the processes that
contribute to the creation and survival of enterprises. There are several reasons why the
focus of industrial policy has shifted more towards small enterprises. The main reason
for this change is that small business enterprises have increasingly become an
important source of employment and growth in many countries.
South Africa’s SME sector has set expectations to fulfil a number of roles ranging from
poverty alleviation and the creation of employment to international competitiveness. Not
only are these very divergent policy objectives, but also the policy instruments
introduced to meet these objectives can be equally different, ranging from literacy
training to technological advice (Blueprint Strategy & Policy 2005:9).
Determining clear priority groups is an urgent action that needs to be considered. This
can be achieved by either targeting more efficient promotion activities towards the more
productive SMMEs, or by trying to assist survivalist enterprises better, mainly the black-
run endeavours. One of the greatest difficulties facing policy makers today is how best
to develop an approach to SMEs and SMMEs that can achieve a sufficient degree of
co-ordination between supply side efforts and demand potential in these enterprises.
Although some level of risk exists in investing resources in an effort to improve supply
26

potential where demand constraints are high (for example the low growth of demand
due to regional stagnation). A major question to be considered is whether supply-side
incentives have frequently been ineffective because of the existence of such demand
problems or whether poorly specified supply policies or inefficient service delivery are
the true causes leading to a lack of success.
It is now widely accepted that small businesses are the chief contributor to job creation
worldwide, and this trend is also true for South Africa. Attempting to meet this challenge
currently facing our country requires the creation of a better business environment; this
may include for instance, a reduction in possible administrative and regulatory burdens
on businesses and better access to finance. Achieving this goal will also require
entrepreneurial attitudes that that are innovative and prompt people to transform ideas
into viable businesses and an attitude of learning from past failures. Countries will also
need to develop more positive attitudes towards supporting entrepreneurial initiatives
and an open mind to risk- taking.
SMEs are usually defined in terms of employment or turnover. In the EU, for instance,
an SME is defined as a firm with fewer than 250 employees or annual turnover of less
than ECU 40 million (European Commission 2003:14) this amount is approximately R
300 million in South African currency. In the South African context, these thresholds are
too high, and would lead to over 90% of all firms (including listed companies) being
classed as SMEs. It is therefore accepted that SA businesses with annual turnovers of
less than R 50 million should be classed as SMEs.
Analysis of employment statistics as conducted by Stats SA, show that large
companies are shedding jobs even as their businesses expand – the phenomenon of
“jobless growth”. This is usually as a result of the introduction of technologies that
increase productivity, as well as economies of scale (Datt 1994:407). Outsourcing of
non-core functions also leads to organisations reducing head-counts; however, this
creates numbers of small service organisations, which then show a proportionate
increase in employment.
Smaller businesses have a number of advantages over large companies, for instance:
27

They are nimble and can move quickly to seize opportunities; They are less bureaucratic; Most time is spent on activities that are directly client-related; and They are more innovative.
At the same time, there are also a number of problem areas faced by all smaller
enterprises:
Lack of access to finance (especially start-up capital); Registration processes are often bureaucratic and time-consuming; Legislative and regulatory compliance costs proportionately more; Lack of ability to access R&D and latest technology; and Disproportionate dependence on labour regulations.Source: (Blueprint Strategy & Policy 2005:10)
Other problems facing small business enterprises in developing countries can
mostly be differentiated from those of developed countries. The cause of such a
result is that in most cases the governments of developed countries are able to
make adequate provision for their enterprises through the implementation and
use of policies that tend to be favorable to them (Etumeahu, Okekeke & Kingsley
2009:18).
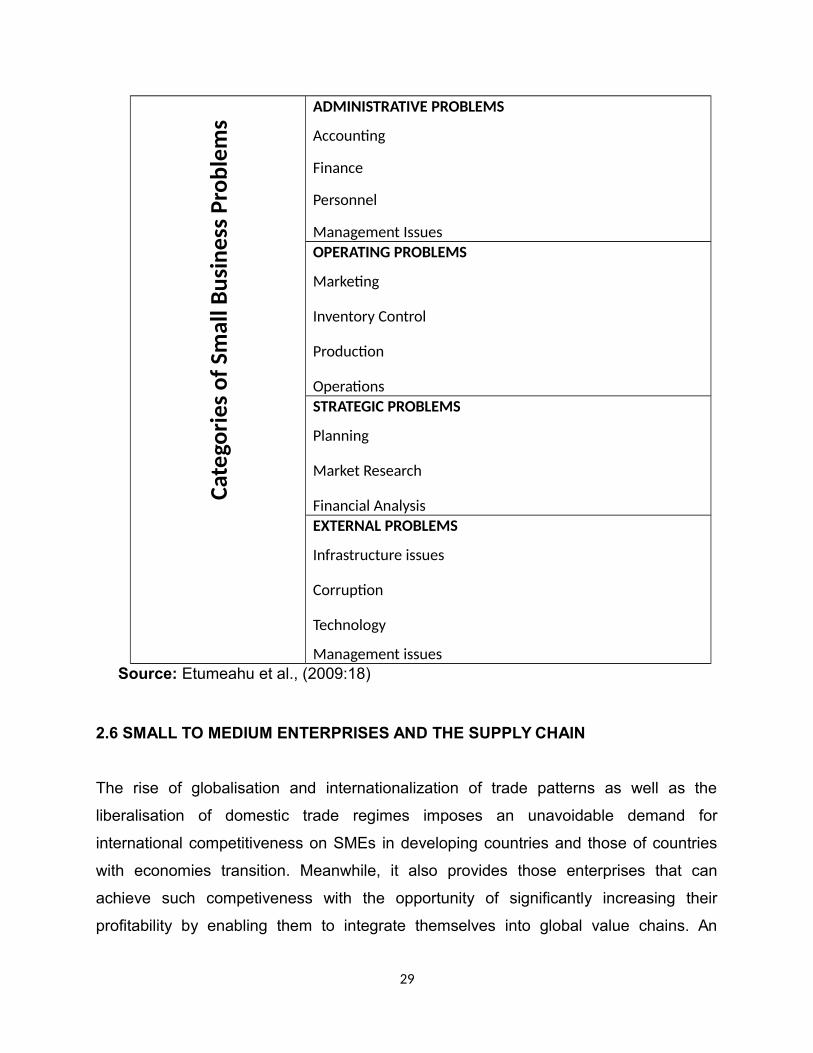
The table below depicts a brief summary of the categories of problems facing
small business enterprises in their process of development in many developing
countries. Although these problems seem like they are general in nature they
could be described as also being unfamiliar to those of developing countries and
South Africa.
Some of the major constraints frequently mentioned as the limiting factor in the
realization of the full potentials of small business enterprises in South Africa and
other countries; are the poor management structures in place and other practices
in these enterprises followed by a lack of proper record keeping and a lack of
financial discipline within these small scale enterprises (Etumeahu, Okekeke &
Kingsley 2009:18).
Table 2.3: Categories of Small business- Problems
28
Cate
gorie
s of
Sm
all B
usin
ess
Prob
lem
s
ADMINISTRATIVE PROBLEMS
Accounting
Finance
Personnel
Management Issues OPERATING PROBLEMS
Marketing
Inventory Control
Production
Operations STRATEGIC PROBLEMS
Planning
Market Research
Financial Analysis EXTERNAL PROBLEMS
Infrastructure issues
Corruption
Technology
Management issues Source: Etumeahu et al., (2009:18)
2.6 SMALL TO MEDIUM ENTERPRISES AND THE SUPPLY CHAIN
The rise of globalisation and internationalization of trade patterns as well as the
liberalisation of domestic trade regimes imposes an unavoidable demand for
international competitiveness on SMEs in developing countries and those of countries
with economies transition. Meanwhile, it also provides those enterprises that can
achieve such competiveness with the opportunity of significantly increasing their
profitability by enabling them to integrate themselves into global value chains. An
29

approach that can be applied to achieve this goal is the encouragement of partnerships
that link SMEs either with larger domestic enterprises that have access to international
markets or direct links with foreign organisations (UNIDO 2005:12).
Organisations can no longer compete effectively in isolation of their suppliers and other
entities in the supply chain (Thakkar, Kanda & Deshmukh 2007:97). As organisations
seek to develop partnerships and more effective information links with trading partners,
internal processes become interlinked and span the traditional boundaries of firms.
Various views and definitions have been reported on supply chain management (SCM).
The following are examples as adopted from Thakkar, Kanda & Deshmukh (2007:97-
98):
The functions within and outside a organisation that enable the value chain to
make products and provide services to the customer (Cox et al. 1995:270);
SCM is defined as the systematic, strategic coordination of the traditional
business functions and the tactics across these business functions within a
particular organisation and across business within the supply chain, for the
purposes of improving the long-term performance of the individual organisations
and the supply chain as a whole (Mentzer et al. 2001:1-25);
SCM is a melding of logistics (i.e. of distribution and production), procurement,
industrial organisation economics, marketing and strategy, which emerged as a
distinct area of research in the mid-1980s (London & Kenley 2001:777);
SCM is the collaborative effort of multiple channel members to design,
implement, and manage seamless value-added processes to meet the real
needs of the end customer (Burt et al. 2004:27-39).
The field of supply management is evolving, developing positively, and addressing
discipline and theory issues (Harland et al. 2006:730; Burgess et al. 2006:703). Supply
(chain) management is ultimately about influencing behaviour in particular directions
and in particular ways (Storey et al. 2006:754). Mainly, present focus of SCM research
30

is found to be inclined to large-scale organisations where small businesses act as
ancillary or 1st and 2nd tier suppliers in their supply chain.
Specifically, fast moving consumer goods (FMCG) and the automobile industries have
been found to be traditionally dependent on small and medium scale enterprises
(SMEs) where the latter constitute as first tier suppliers. In many countries that are
under the pressure of free trade and globalisation, the state has withdrawn the level of
protection it used to provide to small-scale businesses. Large organisations can in most
cases now take-up products and services which till recently were reserved for the small-
scale sector; Products such as, Bio-engineering, Sports goods, Plastics products,
Computer Software, etc. are affected. In an effort to minimize the system- wide costs
large organisations often expect various kinds of changes from their SMEs supply chain
partners. On the other hand, SMEs are often more likely to have a differentiation
advantage more than a cost advantage. This occurrence is most often due to the
existence of scale, scope and learning economies in the industry (Porter 1980:30).
Based on this, the following is a more concise definition of SCM for SMEs:
Supply chain in SMEs is a set of business activities including purchase from open/spot
market, manufacturing or processing of subcomponents/subassembly within the plant
and delivery to large enterprises using hired transportation to enhance value of end
product and in-turn to ensure long-term regular purchase orders (Thakkar, Kanda &
Deshmukh 2007:98).
Superior features and quality, as well as superior customer service, are ways that SMEs
often use to differentiate their products and services from those of the more
commoditised LEs (Porter 1985:210). Supply chain inefficiency is one of the most
prevalent issues facing the small- to mid-size enterprise (Lewis 2005:42). SCM appears
to be a method for LEs to de-commoditise their products to reap a price premium from
the market and, as an unfortunate side effect, to shrink the differentiated product
territory of smaller firms (Elmuti 2002:49-57). Supply and process costs represent 30
per cent of an average manufacturing SME’s budget and logistics costs incur about 40
per cent of total supply spending (John & Riley 1985:16).
31

On the other hand, SMEs are now more and more taking part in the global business
network participating in many interlinked supply chains (Hvolby & Trienekens 2002:3).
But sustainability and ability to meet changing needs for SMEs tend to be questionable
when they do not have much flexibility in setting prices being a supplier to large
organisations and for this, streamlining of their supply chain activities becomes equally
important (Thakkar, Kanda & Deshmukh 2007:98).
The basis of global competition has drastically changed. Organisations are no longer
competing against other organisations, but rather supply chains are competing against
supply chains. The success of a business is now invariably measured neither by the
sophistication of its products nor by the size of its market share. It is instead usually
seen in the light of the ability to harness its supply chain, sometimes forcefully and
deliberately so as, to deliver responsively to customers as and when they demand it
(Asian Productivity Organisation (APO) 2002:3). This current necessity to change is
brought about by the onset of new and emerging, albeit sometimes disruptive,
technologies. The rapid penetration of new technologies such as the Internet is also
transforming global commerce, shrinking the marketplace, forcing situations of highly
unstable and unpredictable demand intensities, and shortening the lead times of critical
information flow. In this setting, the literature, both trade and academic, has repeatedly
reported how technology as a driver of change has influenced the supply chain
practices of many multinational corporations (MNCs) (APO 2002:3).
These MNCs have their supply chains and they are intricately linked to the digital
economy on a path of no return. Therefore supply chain management (SCM) will have
to be linked to the new digital economy as demanding and technology-savvy customers
around the world increasingly expect goods and materials to be delivered to their
doorstep at click-speed, courtesy of broadband capabilities. Charles Fine (1999:6), in
his book Clock speed: Winning Industry Control in the Age of Temporary Advantage,
emphasized that the ability to capture and share Internet-enabled, real-time information
has dramatically boosted the clock speed of many industries, dictating the key elements
of survival (APO 2002:3).
32

Countries and organisations alike that desire to participate in global supply chains must
understand and embrace without further hesitation the new mantra of SCM on which the
new competition is premised (Morris 2010:284). Likewise, South African enterprises
must adopt these new technologies to participate effectively and to navigate
successfully in the new economy.
Against this background, countries should share their experiences in the practical
applications of SCM which have contributed to increasing customer satisfaction,
improved productivity, better work processes, and greater competitiveness. One prime
concern to be highlighted is the financial and organisational ability, and perhaps
willingness, of indigenous SMEs to invest in much-needed IT infrastructure (which might
not yield a corresponding rate of productive return) and other related technologies [like
Radio Frequency Identification (RFID), Advanced Data Capture (ADC), Active Server
Pages (ASP), and so forth] to improve their supply chain processes. Issues such as
complexity, time and space compression, and cooperating in e-marketplaces are all new
challenges that SMEs must face and survive or risk being either marginalized to
commodity players with a low value proposition at best or forced into oblivion in the
worst-case scenario. In addition, SCM must integrate SMEs to ensure greater
collaboration between supply chain partners, in particular SMEs that serve as suppliers
to larger corporations responsible for either semi-finished or finished goods, and work
toward a synchronized value collaboration network (APO 2002:3).
33

2.7. CONCLUSION
There is a question on how well the concept of Supply Chain Management (SCM) fits
with the Small and Medium-sized Enterprises (SME) industry that remains open. Many
firms with 500 and fewer employees, SMEs in this case, make a choice to make SCM
part of their strategy implementation while many other SMEs shun it (Magretta
1998:102; Notman 1998:191; Kaufman et al. 2000:403; Tulip 2000:18-29; Hayward
2001:410; Quayle 2002:1148). SCM is a way of obtaining vertical integration benefits
without its formal ownership costs. SCM, the integration of key business processes
among industry partners to add value for customers, thus tightly linking together several
consecutive elements of the industry value chain, from upstream suppliers to
subassembly manufacturers to final manufacturers to distributors to customers, in an
effort to make the process more efficient and the end products and services more
differentiated (Lummus et al. 1998:426; Tan 2001:174; Wisner 2003:1-26).
To the entrepreneur, SCM has many potential benefits; mainly, it gives the SME the
ability to leverage its scalable competences (e.g., in product design and radical process
innovation) in a cooperative network through fast and feasible access to complementary
partner assets. However, SCM also introduces new challenges in technology
management to the SME because it is a much closer and technically intense and
complex transaction set (Venkataraman & Van de Ven 1998:231) than most alternatives
have. Organisations today face great challenges from the unpredictable, globalised and
competitive business environment (Chong et al. 2009b:329). In order to respond to
these challenges, organisations have sought various business strategies which will
enable them to compete better with their business rivals. One way in which
organisations have tried to improve their competitive advantage is through the
implementation of supply chain management (SCM). The next chapter presents the
literature review through theoretical grounding as well as hypotheses development.
34

CHAPTER THREE
LITRATURE REVIEW AND HYPOTHESES DEVELOPMENT
3.1 INTRODUCTION
Conducting a review of related literature was essential as it strengthens the procedure
to be used, restricts data collection to what is really of material value to the current
study and assists with data verification (Babbie 2010:523). It includes the summarising
of past results whilst revealing potential reasons for inconsistencies in past research
findings and for directing future investigations (Alasuutari, Bickman & Brannen
2009:536). Various items of literature have been reviewed including material from
books, journals, completed theses, and online information. From this an attempt was
made to gain a clear understanding of the concepts involved in this study and their
influence on each other. Both theoretical and empirical literature where reviewed and
the variables that where reviewed will be discussed beginning with the theoretical
framework followed by the empirical framework. The conceptual research framework
was discussed and hypotheses also developed. The chapter was then ended off with a
conclusion.
3.2 THEORETICAL FRAMEWORK
3.2.1 The Coordination Theory
“This theory is defined as a body of principles about how the activities of separate
actors such as organisations and people can be co-ordinated to achieve the same set of
goals (Malone 1988:87).” The co-ordination theory suggests that the process of supply
chain restructuring is detailed without losing sight of the overall principle goals that are
set to be achieved by the organisation. It is also helpful for supply chain partners in the
integration of their business activities by facilitating information- sharing among them
35
and thereby creating synergies through this process of facilitation (Roh et al.,
2011:4517).
Given that the typical supply chain is comprised of multiple actors (such as supply chain
partners, including suppliers, manufacturers and distributors) that are in pursuit of the
same set of overall goals (for instance; meeting end-customers’ needs, eliminating
waste and reducing inventory across the supply chain, etc.), the co-ordination theory
can be a very useful tool for the process of redesigning and restructuring the supply
chain (Roh, Min & Hong 2011:1121).
The co-ordination theory is designed to address the following questions (Malone
1988:357-370):
(a) How can overall set goals be sub-divided into tasks?
(b) How can different tasks be assigned to each actor?
(c) How can required resources be allocated among different actors?
(d) How can required information be shared among different actors?
(e) How can the different knowledge and conflicting goals of different actors be
combined to create synergy required for the achievement of the overall set goals?
Although rarely utilized in the supply chain field due in part to a lack of a coherent body
of theory, the co-ordination theory can be helpful in explaining how co-ordination
mechanisms such as standardisation and early supplier involvement in new product
design, can work towards restructuring the supply chain and can also help to develop
information (e.g. point-of-sales system) and communication systems (e.g. electronic
data interchange, extensible markup language) that are essential for the integration of
business activities across the entire supply chain (Roh et al., 2011:4530).
The Coordination theory also provides an approach to the study of processes. In this
view, the design of a process depends on the coordination mechanisms chosen to
36

manage dependencies among tasks and resources involved in the process (Crowston
1997:157).
This theory can be used effectively in managing a supply chain, and it can be utilized to
design and manage the supply chain of an SME. It can also assist in the process of
supplier information- sharing and information quality on strategic partnerships and
internal lean practices among Small and Medium Enterprises.
3.3 EMPIRICAL REVIEW
3.3.1 Supplier Information- Sharing
Information- sharing refers to the extent to which critical and proprietary information is
communicated to one's supply chain partner (Monczka, Petersen, Handfield & Ragatz
1998:553). Information- sharing is also referred to as the degree of access to and the
sharing of important supply chain information between a organisation and its supply
chain partners. This information may include forecasts; manufacturing schedules, as
reflected in inventory drawdown rates; and inventory data at upstream locations
(Chengalur-Smith, Duchessi & Gil-Garcia 2012:58-67).
As a society moves from the industrial to the information age, information is brought to
the forefront as a factor of production and identified as the asset fundamentally
responsible for organisational success (Grant 1996:375–387; Kogat 1992:383–397).
Sharing information allows the participating organisations to integrate their knowledge,
detect the window of opportunities in the marketplace and capture positions of
advantage (Gavirneni, Kapuscinski & Tayur 1999:16–24; Sambamurthy, Bharadwaj, &
Grover 2003:237). In particular, sharing of information between trading partners may
enable the organisations to plan activities in the supply chain, such as conjunctive
demand forecasts and replenishments. Nevertheless, the great potential benefits of
information sharing do not lead most organisations, especially small and medium
enterprises (SMEs), to enter such cooperative relationships (Ke & Wei 2007:297). Lack
of information sharing with trading partners has been consistently found to be the most
37
critical failure factor in supply chain management (Elmuti 2002:49–57). The interest in
the phenomenon of insufficient information sharing in supply chains motivated the
research reported in this paper.
Monczaka et al., (1998:786) define information sharing as the extent to which one party
in the chain communicates critical and proprietary information to another party in the
chain, and when all members have access to the same information the supply chain can
become smoother and more responsive (Huang & Gangopadhyay 2004:122). According
to Yu et al., (2001:64) there are three levels of information sharing, the first level is
called decentralized control and it refers to a situation where no information is shared in
the supply chain and each segment makes all strategic decisions independently to
reach individual optimization.
The impacts the decisions will have on suppliers and customers are not considered, in
the worst case this can lead to situations where the organisation becomes more
exposed to the danger of the bullwhip effect. The second level is called “coordinated
control” and refers to when two inventories are coordinated based on sharing of
customers´ order information. In such a situation the manufacturer receives information
about customers´ demand along with retailer´s ordering information and based on these
data the manufacturer makes decisions about the proper inventory level. The third and
last level is called “centralized control”, where one single organisation or a small group
of executives are the decision-makers for the entire supply chain, and processes all
relevant information to execute decisions that, optimally, should assure better system
efficiency and system wide optimization. To utilize information, information technology
systems such as ERP (Enterprise Research Planning) and EDI (Electronic Data
Interchange) should be implemented in every participating organisation in order to
easily share and store information and data so that anyone in the supply chain can
access it at any time. The chances of the bullwhip effect and forecasting mistakes can
then potentially be reduced, which could lead to a reduction in system wide costs and
increase the chances of total supply chain optimization (Yu et al. 2001). Benefits from
information sharing have been analysed by other researches as well, Gerard and
Marshall (2000) found that when information sharing is introduced, the cost of holding
38

inventory and backorders can be reduced with 13.8%, while Lee et al., (2000:534) found
that if information is shared the overall cost has potential to decrease with 12-23%.
Inter-organisational relationships are built, maintained and enhanced to achieve
business goals that might be difficult to accomplish by individual organisations alone. In
a supply chain setting, inter-organisational relationships are usually reflected through
partnerships or buyer–seller relationships. A supplier partnership in the supply chains
implies the agreement between a manufacturing firm and its suppliers or
subcontractors. It includes the sharing essential information with respect to limitations
relevant to time and distance, including sharing risks and benefits that come along with
the relationship. The buyer–seller relationships, for its part, reflect strategic relationships
among independent firms (Tang, Shee & Tang 2001:49). Both partners involved in the
relationship tend to collaborate together if they perceive that their cooperation with each
other will bring benefits or value. For a supply chain as a whole to achieve its
competitive advantage, collaborative behaviour and activities need to be promoted to
build value-based relationships among members (Wang & Wei 2007:647-674; William &
Diana 2007:108).
Information-sharing has increasingly become an important issue for the supply chains.
Information sharing significantly has an effect in the reduction of supply chain costs
(Gavirneni, Kapuscinski & Tayur 1996; Huang, Lau & Mak 2003:1483; Swaminathan,
Sadeh & Smith 1997; Tan 1999), and the achievement of competitive advantage
(Drucker 1992: 95-105; Li & Lin 2006:1641; Li, Ragu-Nathan & Rao 2006:107-124;
Shin, Ishman & Sanders 2007:165-174). When we take a greater portion of information
that is available and share it with partners (Ellinger, Taylor & Daugherty 1999:25;
Pereira 2009:372) in the supply chain, such as subcontractors or suppliers, a business
enterprise can make better decisions on ordering, capacity allocation and
production/material planning so that the supply chain dynamics can be fully optimized
(Huang et al. 2003:1483-1517). Inter-organisational information sharing within the
supply chains has thus become a common practice in many organisations, because it
enhances the competitive advantage of the supply chain as a whole.
39
To achieve the advantages of information sharing, it is of strategic importance for
manufacturing firms to understand the factors pertaining to inter-organisational
relationships that affect the information sharing behaviours of their partners. Existing
research on this important issue has focused on modelling all the factors under
investigation as precursors or independent variables that directly affect the behaviours
of information- sharing (Cheng 2011:374). Information sharing is determined by the
trade-offs among factors including dependence, uncertainty, exchange efficiency, and
social satisfaction, among others (Dwyer, Schurr & Oh 1987:11-27). It is generally
believed that willingness to share is greater if parties have a close relationship. In
contrast to inter-organisational information sharing, intra- organisational information
sharing is also briefly discussed below.
3.3.1.2 Intra-organisational information sharing
Within organisations, there is a trend to encourage groups to share information and
knowledge (Zhang, Dawes & Sarkis 2005). Wheatley (2006) indicates, however, that in
the bureaucratic model, information flows in organisations are strictly controlled. With
limited access to and sharing of information and knowledge, organisational members
lack the capability to develop integrated solutions to problems. Often members of an
organisation do not share information scattered among organisational groups (Ardichvill,
Page & Wentling 2003; Cress & Kimmerle 2006). According to the literature, there are
various factors that can influence intra-organisational information sharing (see Fig. 3.1).
The relationships between these factors are usually complex and each factor can
influence the other. Organisational structure as well as organisational culture, ritual, and
norm are the two factors comprising the outer layer in figure 3.1 that have a broad
impact on all the activities of an organisation. The system of reward and incentive,
power games, social identity, social network, and trust are factors that comprise the
second layer in figure 3.1 that can be formed and influenced by organisational structure
and organisational culture, and they can have an influence on members' beliefs in intra-
organisational information sharing. Similarly, the characteristics of shared information,
40

the adoption of information technology (perceived usefulness and perceived ease of
use), and the absorptive capability also affect members' beliefs. While influenced by the
factors in layers one and two, members' beliefs toward intra-organisational information
sharing (represented by the inner layer in Fig 3.1) can be developed and mediated by
self-interest and cost–benefit analysis, information ownership and stewardship, and
reciprocity (Yang & Maxwell 2011:165-168). Understanding information sharing on the
intra-organisational level can provide insights into information sharing on the inter-
organisational level. Some of the factors discussed in the intra-organisational
information sharing may be applied to the inter-organisational scenarios.
Figure 3.1: Factors influencing intra-organisational information sharing.
Source: Yang & Maxwell (2011:166)
41

3.3.1.3 The Importance of Information-sharing in a Supply Chain
Many researchers have emphasized the importance of information sharing in Supply
Chain Management practice. Lalonde (1998:7) considers sharing of information as one
of five building blocks that characterize a solid supply chain relationship. According to
Stein and Sweat (1998:36) supply chain partners who exchange information on a
regular basis are able to work as a single entity. Together, they can understand the
needs of their end customer better and therefore can respond to market changes
quicker. Moreover, Yu et al., (2001:114) has pointed out that the negative impact of the
bullwhip effect on a supply chain can be reduced or even eliminated by simply sharing
information with trading partners. Again the empirical findings of Child house and Towill
(2003:17) reveal that simplified material flow, including streamlining and making highly
visible all information flow throughout the chain, is the key to an integrated and effective
supply chain. Figure 3.2 below shows the information sharing among different partners
from the supplier to the manufacturers, distributors, retailers and finally the end
customers.
Figure 3.2: Information flow in a supply chain.
Source: Bell (2009:135)
42
Information- sharing is also referred to as the extent to which strategic information is
shared with suppliers (Amir, Jin & Troege 2010:855). However, this concept leaves a
question open on the extent to which information- sharing can be said to be advisable
between third party logistics providers and their customers. Although the industry
definition of Shared Services and information is generally seen as referring to the
sharing of business processes, business functions or expertise, many different aspects
of an organisation can be shared. Sharing may start with collaboration and adoption of
best practices and develop from there as the greater the level of sharing, the greater the
benefits to participating organisations (Amir, Jin & Troege 2010:855-866). A more
detailed level of sharing leads to increased levels of efficiency, higher quality of service
and an increased ability to react efficiently to the market or to legislative changes.
However, these benefits come coupled with higher risks and the need for a strong
change management culture for practitioners.
The concept of information- sharing in the SME sector can help in building strong
relationships among suppliers, sharing of timeous strategic information can help these
young organisations to become more efficient and effective in both the business and
supply chain environment. A positive attitude towards this phenomenon should be
cultivated and promoted in order to promote growth and profitability in these thriving
entities. Practitioners and managers should be made aware of the benefits that they can
reap if they embrace change and effect that change in their companies. History and
recent success in the big companies has proven this to be effective.
3.3.2 Information Quality
Information quality includes aspects such as the accuracy, timeliness, adequacy, and
credibility of information exchanged (Monczka, Petersen, Handfield & Ragatz
1998:556). While information sharing is important, the significance of its impact on SCM
depends on what information is shared, when and how it is shared, and with whom
(Chizzo 1998:4). Jarrell (1998:253) also notes that sharing information within the entire
43

supply chain can create flexibility for the organisations involved, but for this to happen it
requires accurate and timely information.
Information quality refers to the quality of outputs that the information system produces
(DeLone & McLean 2012:781), which can be in the form of reports or online screens.
Accuracy is agreement with an attribute about a real world entity, a value stored in
another database, or the result of an arithmetic computation. Completeness can be
defined with respect to some specific application, and it refers to whether all of the data
relevant to that application are present. While consistency refers to an absence of
conflict between two datasets, currency refers to up-to-date information. Researchers
have used a variety of attributes to describe information quality. Nelson (2005:333) has
used the constructs of accuracy, completeness, currency, and format for information
quality; the additional construct used by these authors, format, is related to the
presentation layout of information outputs. This concept mainly refers to how accurate,
credible, current and adequate the information is that is exchanged between partners.
It is also well known that information in most cases notoriously suffers from delay and
distortion as it moves up the supply chain (Mrller 2003:188 & Towill 1997:137).
Moreover, another consequence of the traditional culture is that, organisations can
deliberately distort order information to conceal their true intentions from competitors,
and also, in some instances, from their own suppliers and customers (Towill 1997:140).
Most organisations usually perceive the disclosure information as a loss of power and
this can likely lead to further distortion as orders are passed along the chain (Li & Lin
2006:1641). To reduce information distortion along the supply chain and to improve the
quality of this information, the information that is shared has to be as accurate as
possible and organisations must ensure that it flows with minimum delay and distortion.
Quality of information serves as the background for all steps in the communication
process of the modern enterprise therefore; establishing, opening and strengthening of
communication channels is an important aspect to be implemented. In most cases
relatively small businesses, which operate locally, have limited ability to access and
44

utilize the large amounts of information. In such cases, managers mostly can operate
their businesses relying mostly on their own experience. Large businesses, operating
on global scale, require a well-established information system as a basis for effective
communication among various subjects involved in a business process (Michnik & Lo
2009:859).
Information quality results from the information system which covers the organisational
processes, procedures, and roles employed in collecting, processing, distributing, and
using data. Thus a database should be available to provide such information. Data
quality is at the heart of information quality in that poor data quality results in poor
information quality. Poor data quality, and hence poor information quality, has adverse
effects on organisations at operational, tactical, and strategic levels (Redman
1998:419). Organisations need to treat and view information as a product that ultimately
serves as a tool to satisfy consumer needs.
Information quality is achieved when a focal organisation and its supply chain partners
share strategic and operational information in trust relationships. Supply chain
performance is dependent on the quality of information shared among partnering
organisations. The three dimensions of the quality of information sharing are classified
as: accuracy, trustworthiness (reliability or credibility), and timeliness (Li & Lin
2006:1650; Zhou & Benton 2007:1348). Security is included as one of the essential
attributes of information quality (Lee, Strong, Kahn & Wang 2002:133).
Thus, this study will also emphasize the importance of information quality, its accuracy,
trustworthiness, timeliness, and security of information between a focal organisation and
its main supply chain partners. When quality information is shared both parties can
achieve the benefits of such information in many different aspects and operations of
their respective organisations. It is said that “knowledge is power”, quality information
can be a powerful tool for companies to utilise to their advantage in this present cut-
throat business environment.
45
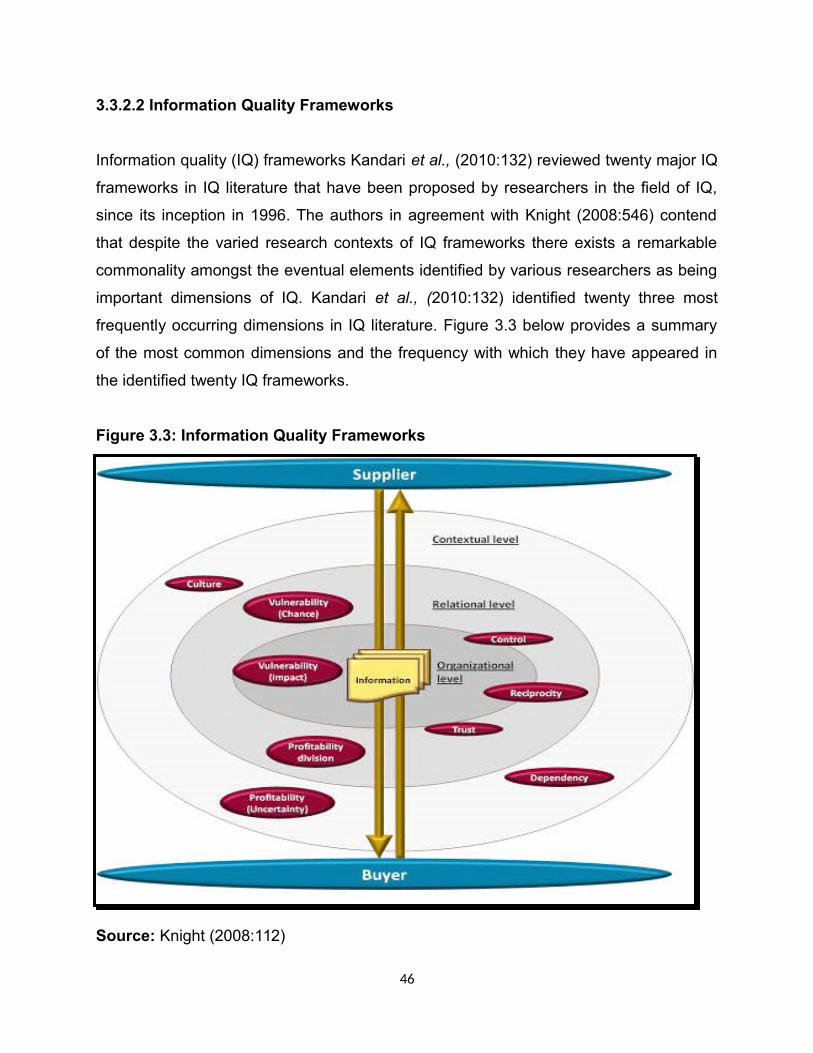
3.3.2.2 Information Quality Frameworks
Information quality (IQ) frameworks Kandari et al., (2010:132) reviewed twenty major IQ
frameworks in IQ literature that have been proposed by researchers in the field of IQ,
since its inception in 1996. The authors in agreement with Knight (2008:546) contend
that despite the varied research contexts of IQ frameworks there exists a remarkable
commonality amongst the eventual elements identified by various researchers as being
important dimensions of IQ. Kandari et al., (2010:132) identified twenty three most
frequently occurring dimensions in IQ literature. Figure 3.3 below provides a summary
of the most common dimensions and the frequency with which they have appeared in
the identified twenty IQ frameworks.
Figure 3.3: Information Quality Frameworks
Source: Knight (2008:112)
46

Information quality frameworks maintain the view that, data cannot be assessed
independent of the people who use the data (Strong et al. 1997:56), and this is currently
the most widely accepted view in quality literature. Shankar & Watts (2003:445), also
highlight caution against defining quality using frameworks that are without a context.
The literature reviews major information quality frameworks collated from 1996 to 2006.
Although the frameworks are varied in their approach and application, these frameworks
share distinct characteristics regarding ultimate classifications of the information quality
dimensions (Knight 2008:112). The review is done in a chronological manner, with few
exceptions when extended or derivative models have been discussed together.
In order to investigate the effects of information quality on decision-making, we first
need to measure and control levels of information quality. However, in current
information quality research, a variety of results has arisen when deriving information
quality dimensions. For example, Wang and Strong (1996:143) used an exploratory
factor analysis to tailor 118 information metrics to 15 information quality dimensions.
Based on Wang and Strong (1996)’s work, Lee et al., (2002:23) carried out a correlation
analysis of the 15 information quality dimensions with 261 subjects. Their result found
high correlations among the dimensions, indicating that information quality dimensions
are not inherently independent. With this result, they concluded that information quality
is a multi-dimensional concept but a single phenomenon
Once the correlations between information quality dimensions have been confirmed, a
practical assessment methodology needs to be developed. However, most information
quality assessments fall into either objective or subjective methodology (Pipino et al.
2002:243). Objective assessment methodologies frequently employ software to
automatically measure information quality using a set of quality rules. On the other
hand, subjective assessment methodologies typically use surveys or interviews to
measure information quality by information consumers. The advantage of objective
assessment is to allow the automatic processing of large datasets and the obtaining of a
single result, whereas subjective assessment typically focuses on a data sample and
generates different assessment results from different users. The advantage of
47
subjective assessment is that it allows the measurement of information quality by a
comprehensive set of dimensions. For example, certain dimensions such as
believability and reputation are not suitable for objective assessments.
3.3.2.3 The Dimensions of Information Quality
The virtual business work flow depends on the information quality (IQ) which is an
essential attribute of information. The IQ depends strongly on the organisation of the
information system and how the information is processed throughout the entire work
flow process. There are four aspects of information quality: (1) intrinsic, (2) contextual,
(3) representational, and (4) accessibility. These four aspects are explained below
according to Wang and Strong (1996:5-33):
(1) Intrinsic IQ denotes the features which belong to the internal characteristic of
information. This aspect includes the criteria of accuracy, objectivity, believability
and credibility.
Their meanings are as follows:
Accuracy: Freedom from mistake or error; conformity to truth or to a standard or
model; degree of conformity of a measure to a standard or a true value. Objectivity: Relating to or existing as an object of thought without consideration
of independent existence; relating to, or being an object, phenomenon, or
condition in the realm of sensible experience independent of individual thought
and perceptible by all observers: having reality independent of the mind
‘‘objective reality”. Believability: Capable of being believed especially as within the range of known
possibility or probability. Reputation: Overall quality or character as seen or judged by people in general;
recognition by other people of some characteristic or ability.
48

(2) Contextual IQ highlights the requirement that IQ must be considered within the
context of the task at hand; that is, information must be relevant, timely, complete, and
appropriate in terms of amount so as to add value.
The contextual aspect includes the five criteria:
Relevancy: Having significant and demonstrable bearing on the matter at hand;
affording evidence tending to prove or disprove the matter at issue or under
discussion; means relating to or bearing upon the matter in hand; implies a
traceable, significant, logical connection. Value added: Relating to, or being a product whose value has been increased
especially by special manufacturing, marketing, or processing. Timeliness: coming early or at the right time appropriate or adapted to the times
or the occasion. Completeness: Having all necessary parts, elements, or steps. Amount of information: To reach in kind or quality; to reach a quantity of
information.
(3) Representational IQ and (4) Accessibility IQ put emphasis on the importance of
the role the systems play. The system must be accessible but secure. It must present
information in a way that is interpretable, easy to understand, and concisely and
consistently represented.
A representational aspect covers four criteria:
Interpretability: To explain or tell the meaning; to conceive in the light of individual
belief, judgment, or circumstance; to represent by means of art; bring to
realization by performance or direction. Ease of understanding: Easy to be recognized or formatted form. Concise representation: Marked by brevity of expression or statement; free from
all elaboration and superfluous detail.
49

Consistent representation: Marked by harmony, regularity, or steady continuity;
free from variation or contradiction; marked by agreement; showing steady
conformity to character, profession, belief, or custom.
Accessibility embraces three criteria:
Access: Permission, liberty, or ability to enter, approach, or pass to and from a
place or to approach or communicate with a person or thing; freedom or ability to
obtain or make use of something; a way or means of access; the act or an
instance of accessing. Convenience: Fitness or suitability for performing an action or fulfilling a
requirement; something (as an appliance, device, or service) conducive to
comfort or ease; a suitable or convenient time; freedom from discomfort. Security: Something that secures (protection); measures taken to guard against
espionage or sabotage, crime, attack, or escape; an organisation or department
whose task is security.
According to the discussion above; intrinsic information quality comprises of four
dimensions: believability, accuracy, objectivity and reputation. Contextual information
quality contains five dimensions: value-added, relevancy, timeliness, completeness and
appropriate amount of data. Representational information quality includes four
dimensions: interpretability, ease of understanding, representational consistency and
concise representation. Finally, Accessibility information quality consists of three
information quality dimensions: access, convenience and security (Michnik & Lo
2009:852). In this study, information quality is defined as a group of dimensions that
capture the similar essence of information quality.
The dimensions are further summarised according to different academic author’s views
in the table 3.1 below:
Table 3.1: The dimensions of information quality
50
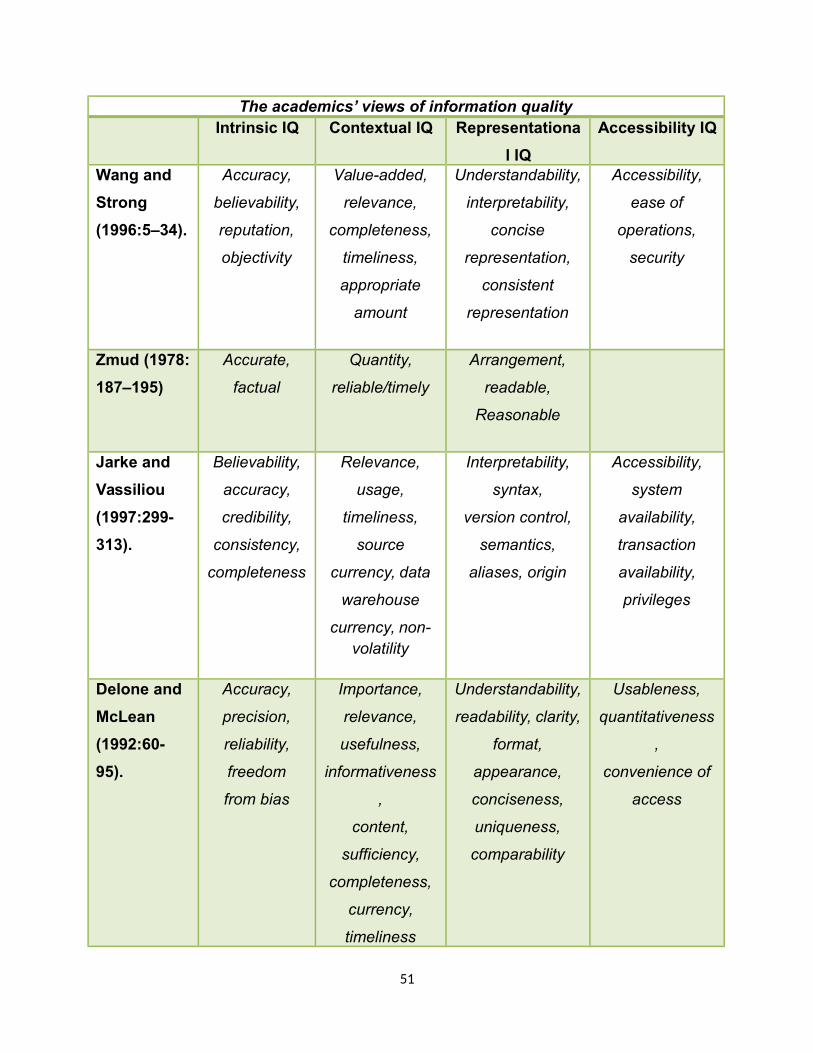
The academics’ views of information qualityIntrinsic IQ Contextual IQ Representationa
l IQ
Accessibility IQ
Wang and
Strong
(1996:5–34).
Accuracy,
believability,
reputation,
objectivity
Value-added,
relevance,
completeness,
timeliness,
appropriate
amount
Understandability,
interpretability,
concise
representation,
consistent
representation
Accessibility,
ease of
operations,
security
Zmud (1978:
187–195)
Accurate,
factual
Quantity,
reliable/timely
Arrangement,
readable,
Reasonable
Jarke and
Vassiliou
(1997:299-
313).
Believability,
accuracy,
credibility,
consistency,
completeness
Relevance,
usage,
timeliness,
source
currency, data
warehouse
currency, non-volatility
Interpretability,
syntax,
version control,
semantics,
aliases, origin
Accessibility,
system
availability,
transaction
availability,
privileges
Delone and
McLean
(1992:60-
95).
Accuracy,
precision,
reliability,
freedom
from bias
Importance,
relevance,
usefulness,
informativeness
,
content,
sufficiency,
completeness,
currency,
timeliness
Understandability,
readability, clarity,
format,
appearance,
conciseness,
uniqueness,
comparability
Usableness,
quantitativeness
,
convenience of
access
51

Goodhue
(1995:1827–
1844).
Accuracy,
reliability
Currency, level
of detail
Compatibility,
meaning,
presentation, lack
of confusion
Accessibility,
assistance,
ease of use
(of h/w, s/w),
Locatability.Ballou &
Pazer
(1985:150–
162).
Accuracy,
consistency
Completeness,
timeliness
Wand &
Wang (1996:
86–95).
Correctness,
unambiguous
Completeness Meaningfulness
Source: Adapted from Lee et al., (2002:134)
Since more people have become aware of the importance of information quality,
research in the field has developed extensively over the last two decades. Based on the
foremost works, in this section we introduce the fundamental concepts used in this
thesis. As information quality research is a branch of information system research, first it
is necessary to illuminate the notion of information systems. In some literature, the
information system is often referred to as a computerised database system. In this
study, the term ‘information system’ covers collecting, processing, distributing and using
data by organisational processes or people (Strong et al. 2007:17). It is also referred to
as larger information system’s context by Huang et al., (2005:1907) and Strong et al.,
(2007:76). Within the context of information systems above, a novel approach in
information quality research is to observe information manufacturing as product
manufacturing (Ballou et al. 2009:667). Product manufacturing is a processing system
that transforms raw materials into physical products. Analogously, information
manufacturing can be considered as a process transforming raw data into information
products. Therefore, information products can be defined as the results of
manufacturing raw data into valuable information (Pierce 2004:187). In this study, we
52

define information manufacturing system as a system that operates on raw data to
create information products.
Using the information manufacturing concept, treating information as a product can be a
key strategy for organisations attempting to obtain a competitive advantage. However,
some organisations still consider information as a mere by-product and are not aware of
the importance of treating information as a product. Consequently this may lead to a
variety of organisational losses such as making incorrect decisions and losing business
opportunities (Wang et al. 1998:59). For example, an investment organisation sent a
large amount of direct mail to the wrong target customers. This organisation lost its
market share and incurred the need for significant reworking in their customer service.
Once this organisation treated the information required for direct marketing as an
information product, they were able to detect the root cause of the mail list problem and
subsequently were able to improve their customer service (Huang et al. 1999:77).
Therefore when companies cultivate the concept of information product into their
organisational cultures, it can generate business growth and competitive advantage in
the marketplace. In order to manage information as a product, it is proposed one follows
the four principles outlined by Wang et al., (2009).
3.3.3 Strategic Partnership
A stream of literature supports the value of Strategic Supply Chain Partnerships. In early
studies, Mohr and Speckman (1994:135) discussed partnership attributes,
communication behaviours, and conflict resolution techniques as some of the important
factors for partnership success. Since then, a lot of the research that has been
conducted on this topic has been conceptual (Graham et al. 1994:419; Ellram &
Hendrick 1995:41; Mentzer et al. 2000:549). Recently, several empirical studies have
been conducted as well (Goffin et al. 2006:189; Nyaga et al. 2010:101; Sodhi & Son
2009:937). Goffin et al., (2006:200) have examined the specific attributes of close
supplier-manufacturer relationships in terms of potential benefits to be attained through
such partnerships. Nyaga et al., (2010:101) empirically examined the mediating role of
53

trust and commitment between inter-organisational collaborative activities, such as
information- sharing, joint relationship efforts, dedicated investments, and relationship
outcomes. Sodhi & Son (2009:940) scrutinized Korean supplier-retailer partnerships
from two different angles, including strategic partner performance and operational
partnership performance. Five factors that affect these partnership performance
outcomes are information exchange, trust, joint partnership management, relationship
specific assets, and partner asymmetry.
Based on this definition, in the present study, strategic partnership is defined as an
inter-organisational relationship formed between two organisations in order to achieve
shared goals of the participants. There are two types of strategic partnerships. The first
type of partnership involves a client with certain needs for supplier functions from
external sources and a vendor that provides such services in exchange for a service
fee. For instance, supplier outsourcing or consulting is an example of this type of
strategic supplier partnership.
Although supplier outsourcing has been a cost-effective way of accessing specialized
computing power or system development skill, recent trends have shown that increasing
attention has been paid to building a successful relationship between the client firm and
the provider of these outsourcing services (Lee 2001). In this dissertation, the study
primarily focuses on two types of outsourcing relationships that may have significant
impact on SME goals and operations: alignment and alliance (Nam et al. 1996).
Examples of the alignment relationship are IS consulting or technical supervision for
supplier planning and design, and system conversion.
The second type of relationship is determined by the characteristics of information
products, information quality requirements, and how information products are produced
in the information manufacturing system. In this phase, they identify who assesses the
quality of information products and which information quality dimensions are used in
such assessment. The measurement phase is for assigning numerical or categorical
values to information quality dimensions in a given setting (Ge & Helfert 2007). This
54
phase consists of different measuring methods that can be used to assess information
quality. According to the assessment result, the analysis phase is for discovering the
root cause of information quality problems and strategising an effective scheme for
information quality improvement. Once the analysis phase is finished, considering
budgetary constraints and resource allocation, the improvement phase is concerned
with improving the quality of information products for intended use.
In the Total Data Quality Management (TDQM) cycle, the measurement phase is critical,
because one cannot manage information quality without having measured it effectively
and meaningfully (Stvilia et al. 2007). In order to measure information quality,
information quality dimensions must be determined. Wang and Strong (1996) used an
exploratory factor analysis to derive 15 information quality dimensions, which are widely
accepted in the field of information quality research. In this study, we define information
quality dimensions as a set of attributes that represent different constructs of
information quality. In order to organise these information quality dimensions, Wang et
al., (1996) classify information quality into 4 categories: intrinsic, contextual, and
representational and accessibility. Intrinsic information quality consists of context-
independent dimensions. In contrast to intrinsic information quality, contextual
information quality highlights the dimensions, which need to be considered in an
application context. Representational information quality concerns whether the
information is presented in an easily interpretable, understandable, concise and
consistent way. Accessibility information quality emphasises that the data needs to be
accessible yet still secure.
In the SME sector, strategic partnerships typically focus on two areas: 1. Revenue
growth through access to Intellectual Property (e.g. technology, content, brands,
reputation, payment systems) and customers (e.g. entry into new demographics or
geographic markets); and/or 2. Sharing costs and/or risks – e.g. to reduce costs (e.g.
print production, network sharing) or launch new, often risky platforms (e.g. mobile and
IP distribution of TV). Potential partners can be found in an increasingly diverse set of
industries as technology, economic and demographic change facilitates, if not compels,
55

greater collaboration. Media companies, for example, work increasingly closely with
financial services providers as new forms of monetisation of content become both a
survival activity and the business model of the future; retail brands offer access to new
demographics for media companies seeking new audiences; technology companies
provide the infrastructure that may facilitate the increasingly targeted nature of
advertising.
3.3.3.1 Types of Relationships
Relationships have been perceived to be on a continuous sequence ranging from purely
discrete transactions, through repeated transactions, to long-term relationships, to full
partnerships (Mohr & Nevin 1990; Webster 1992). Placing too much focus solely on the
number of transactions performed tends to ignore the fact that commodity components
may be sourced regularly from a supplier without a close relationship being necessarily
developed. Based on the proposition by Lambert et al., (1996:1-17) there are basically
three kinds of partnerships, depending on their character. They could be short- term
(Type 1), long-term (Type 2) and long-term with no-end (Type3) as depicted in the figure
below. It is a helpful tool to use the time dimension to differentiate between partnership
types, although in practice, it cannot be assumed that a manufacturer and supplier in a
long- term relationship see themselves in partnership.
It could just be that the particular manufacturer has purchased a certain product from a
particular supplier for several years due to a consistently low price and the relationship
between the two parties may not go anywhere beyond the placing of an order and its
delivery (Goffin et al. 2006:192). Therefore, the time dimension offers an insufficient
explanation of partnerships but Lambert et al.’s diagram does indicate that joint
ventures and other formal business relationships should be differentiated from how the
term partnership is applied to supplier relationships.
Figure 3.4: Types of Relationships
56

Source: Lambert et al., (1996:2).
According to Knemeyer et al., (2003:77) these three types of partnership reflect
increased strength, long term orientation and the level of involvement between the
parties. There is no particular type of partnership or relationship that is better than any
other; the key to a successful relationship is to try and obtain the type or kind of
relationship that is most appropriate and suitable to your business situation.
Partnering symbolises a shift from the traditional pressures exerted by larger customers
on small and medium sized suppliers in which the latter where regarded as
subordinates. The aim of partnering is to transform short-term adversarial customer-
supplier relationships that are mainly focused on the use of purchasing power to secure
lower prices and improved delivery into long- term cooperations that are based on
mutual trust in which quality, innovativeness and shared values are the factors which
complement cost competiveness (Lysons & Farrington 2006:410).
Some comparisons between traditional and partnering relationships that exist are
shown in the table 3.2 below:
Table 3.2: Comparison of Traditional and Partnering Relationships
57

Comparison of Traditional and Partnering Relationships
Traditional Partnership Emphasizes competiveness and
self-interest on the part of both
purchaser and supplier.
Emphasizes on cooperation and a
community of interest between the
purchaser and the supplier.
The emphasis is on ‘unit price’
with the lowest price usually the
most important buyer
consideration.
The emphasis is on total acquisition
costs, including indirect and hidden
costs, such as production hold- ups
and loss of customer goodwill due
to late delivery of materials and
components. Lowest price is never
the sole buyer consideration.
The emphasis here is on short-
term business relationships.
The emphasis is on long term
business relationships with the
involvement of suppliers at the
earliest possible stage to discuss
how the buyer’s requirements can
be met.
Emphasis is on quality checks,
with inspection of incoming
supplies.
Emphasis is on quality assurance
based on total quality management
and zero defects.
The emphasis here is on multiple
sourcing.
The emphasis is on single sourcing,
although it is not of necessarily
confined to single sourcing. It will,
however reduce the supplier base. Emphasis on uncertainty
regarding supplier performance
and integrity.
Emphasis is on mutual trust
between the purchaser and
supplier.
Source: Lysons & Farrington (2006:411).
58
3.3.3.2 The Importance of Strategic Partnerships
Strategic partnership clearly plays an essential role in increasing long-term benefits for
the supply chain based on successful supply chain relationships and reducing risk
(Mentzer et al. 2000:550; Lambert et al. 2004:58). Strategic partnership also involves
trust, cultural compatibility, top management support, and effective information- sharing
(Chen & Paulraj 2004:131; Li & Lin 2006:101). Organisations are forming partnerships
in an effort to enhance their capabilities to improve product quality, innovation, and
market reach (Dale, Lascelles & Lloyd 1994:292; Deming 1993:722; Feigenbaum
1996:725; Mohr & Spekman 1994:140; Porter 1985:53). Researchers and managers
increasingly recognize that to capture potential synergy in such partnerships, the
organisations must develop effective work relationships (Berry 1995:236; Cullen,
Johnson & Sakano 2000:223; Gersick, Bartunek & Dutton 2000:1026; Kumar 1996:277;
Wood & Gray 1991:139).
Regardless of whether the strategic alliance is a joint venture, research consortium,
marketing agreement, or supply chain partnership, members from the organisations
need to work together collaboratively (Wong et al. 2005:730). Strategic partnership
plays an essential role in the increment of long-term benefits for the supply chain based
on successful supply chain relationships and risk reduction (Mentzer 2000:551). The
concept of strategic partnership also involves trust, cultural compatibility, top
management support, and effective information- sharing (Li & Lin 2009:101). Thus, for
the purpose of the current study, strategic partnership is defined as successful long-
term relationships among trading partners in a supply chain that are characterized and
enabled by mutual trust, organisational compatibility, top management support, and
information- sharing.
Researchers have concluded that a considerable amount of evidence indicates that
relationships have prevalent effects on the outcomes of collaborative efforts (Reis,
Collins & Berscheid 2000:725). Theorists have also recently joined managers in arguing
the value of effective relationships for facilitating coordination, teamwork, and
59
negotiation (Graen & Uhl- Bien 1998:340; Kumar 1996:277; Lewicki & Wiethoff 2000:86;
Reis et al. 2000:730; Rousseau, Sitkin, Burt & Camerer 1998:393). Relationships have
been thought to be critical for promoting exchange and integration across functional and
organisational boundaries (Boddy, Macbeth & Wagner 2000:1003; Bouty 2000:50;
Jassawalla & Sashittal 1999:50; Liedtka 1996:20).
In particular, developing inter-organisational relationships has been found to contribute
immensely to bottom-line success (Peng & Luo 2000:486). In addition effective two-way
communication has helped universities adapt to rapid changes (Kraatz 1998:621).
Findings also suggest that inter-organisational relationships are instrumental in the
process of promoting innovation (Goes & Park 1997:673).
Researchers have also argued that cross-organisational relationships tend to be often
complicated and also require a great deal of skillful management (Dyer, Cho, Su, & Chu
1998:406; Lincoln, Ahmadjian, & Mason 1998:27). There are competing forces of
cooperation vs. competition, learning from the other vs. protecting one’s own assets,
and short vs. long term vision (Das & Teng 2000:31; Kale, Singh, & Perlmutter 2000:45;
Tiessen & Linton 2000:207). Time pressures, impatience, and a lack of skills can
interfere with resolving issues that then fester and undermine relationships (Fisher
1997:105; Lascelles & Dale 1988:293). Alliance relationships can have extremely
different dynamics and outcomes and can frustrate as well as contribute to
organisational success (Humphrey & Ashford 2000:713).
Researchers also argue that effective, ongoing relationships are needed to accomplish
the goals of the alliance (Bouty 2000:50; Gersick et al. 2000:725). A high level of
commitment to the relationship appears to be especially important for working across
organisational boundaries but these relationships cannot be assumed to develop easily
(Griffith, Hu & Ryans 2000:303). Despite their original intentions, people responsible for
implementing the new structure often come to doubt the sincerity and commitment of
the other side. These doubts tend to undermine the alliance. A major source of failures
in joint ventures and other alliances is that organisational representatives fail to forge an
60
effective relationship where they believe they are committed to working together over
the long-term.
Although the number of collaborative efforts between small and large enterprises is
seen to be growing, they are often problematic, as was observed by Hancke´
(1998:237). Based on a study of inter-organisational relationships between small and
large enterprises in France, he concluded that, due to asymmetrical power
relationships, it turned out to be very hard to construct trust-based networks between
them. The studies mentioned above show that partnerships between small and large
enterprises have both advantages and disadvantages. Larger enterprises have a
greater variety of options as compared to small enterprises in terms of resources,
capabilities and power, although their activities, too, are constrained by personal and
institutional factors. Innovative small enterprises are generally characterized as being
flexible and having the ability to respond faster to the changing needs and
environments. The increased importance of these small enterprises in networks as
leaders in technology has significant implications for industrial innovation. Small
enterprises that are technology-intensive can be world-class in particular niches. As a
consequence of their capabilities, small enterprises can establish inter-organisational
collaborations with suppliers and selected competitors and can construct powerful
networks.
However, the ability of small enterprises to compete is constrained by conditions internal
(e.g. lack of knowledge, skills, funds, people) and external to the enterprise (e.g. the
market is dominated by a small number of major players or development of distribution
channels is onerous) (Sawers 2008:176). Inter-organisational collaboration is a way that
small enterprises can overcome some of these bottlenecks.
Both for small and large enterprises, collaborative efforts can be advantageous. Lawton
Smith et al., (1991:251) maintained that inter-firm collaboration can be beneficial to
small enterprises because it provides, amongst others, the possibility of exploiting new
technology; accessing new knowledge, expert users, new markets, and additional
61
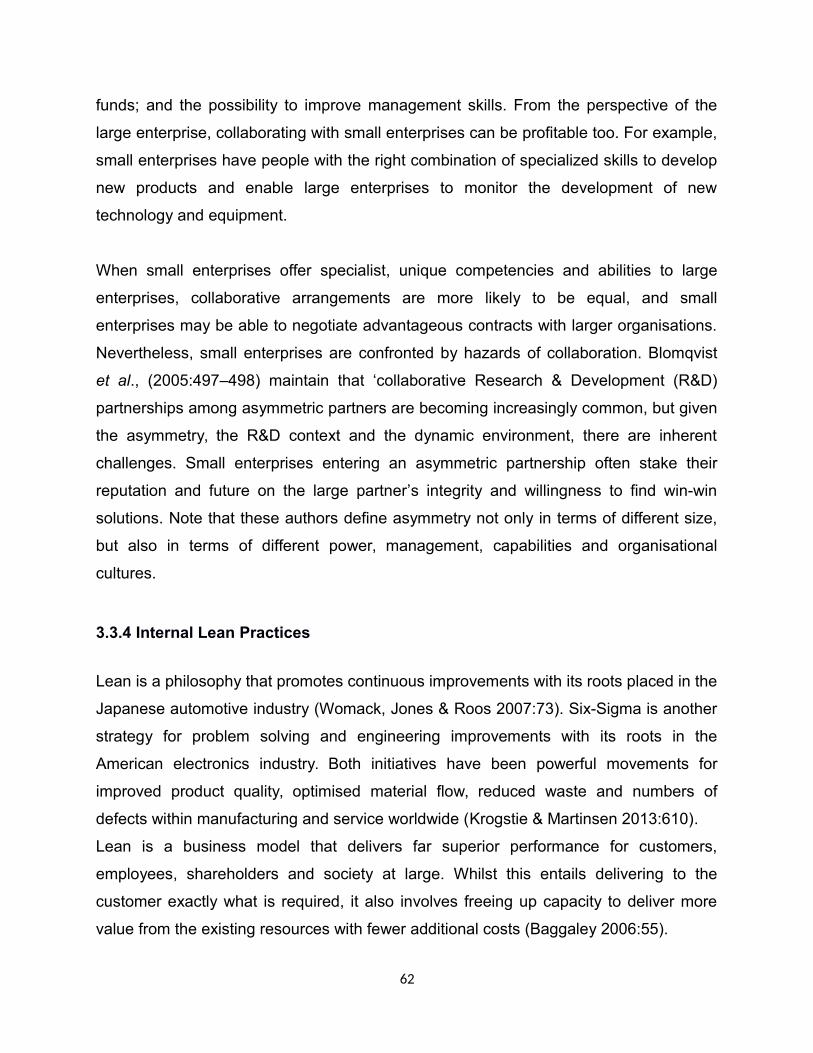
funds; and the possibility to improve management skills. From the perspective of the
large enterprise, collaborating with small enterprises can be profitable too. For example,
small enterprises have people with the right combination of specialized skills to develop
new products and enable large enterprises to monitor the development of new
technology and equipment.
When small enterprises offer specialist, unique competencies and abilities to large
enterprises, collaborative arrangements are more likely to be equal, and small
enterprises may be able to negotiate advantageous contracts with larger organisations.
Nevertheless, small enterprises are confronted by hazards of collaboration. Blomqvist
et al., (2005:497–498) maintain that ‘collaborative Research & Development (R&D)
partnerships among asymmetric partners are becoming increasingly common, but given
the asymmetry, the R&D context and the dynamic environment, there are inherent
challenges. Small enterprises entering an asymmetric partnership often stake their
reputation and future on the large partner’s integrity and willingness to find win-win
solutions. Note that these authors define asymmetry not only in terms of different size,
but also in terms of different power, management, capabilities and organisational
cultures.
3.3.4 Internal Lean Practices
Lean is a philosophy that promotes continuous improvements with its roots placed in the
Japanese automotive industry (Womack, Jones & Roos 2007:73). Six-Sigma is another
strategy for problem solving and engineering improvements with its roots in the
American electronics industry. Both initiatives have been powerful movements for
improved product quality, optimised material flow, reduced waste and numbers of
defects within manufacturing and service worldwide (Krogstie & Martinsen 2013:610).
Lean is a business model that delivers far superior performance for customers,
employees, shareholders and society at large. Whilst this entails delivering to the
customer exactly what is required, it also involves freeing up capacity to deliver more
value from the existing resources with fewer additional costs (Baggaley 2006:55).
62

3.3.4.1 What is Lean Thinking?
Lean Thinking originated from the manufacturing methods used by Japanese
automotive manufacturers. This was due to minimal resources and shortages; they then
employed a production process that worked with minimum waste (Mangan et al.
2012:63). Their thinking soon spread through to all manufacturing areas, new product
development and supply chain management (Krafcik & MacDuffie 1989). The first step
in lean thinking is to understand what value is and what activities and resources are
absolutely necessary to create that value. Once this concept is understood, everything
else is waste. Since no one wants to consider what they do as waste, the job of
determining what value is and what adds value is something that needs to be done at a
fairly high level (Poppendieck 2002:3). To develop breakthroughs with lean thinking, the
first step is learning to see waste. If something does not directly add value, it is waste. If
there is a way to do without it, it is waste.
Lean Thinking involves a constant cycle of seeking perfection by eliminating waste and
maximizing product value. This process means that end-customers don’t pay for
organisational inefficiencies and waste. There are four principles involved in achieving
minimal waste, and these principles are depicted in figure 3.5 the below:
Figure 3.5: The principles of lean thinking
63
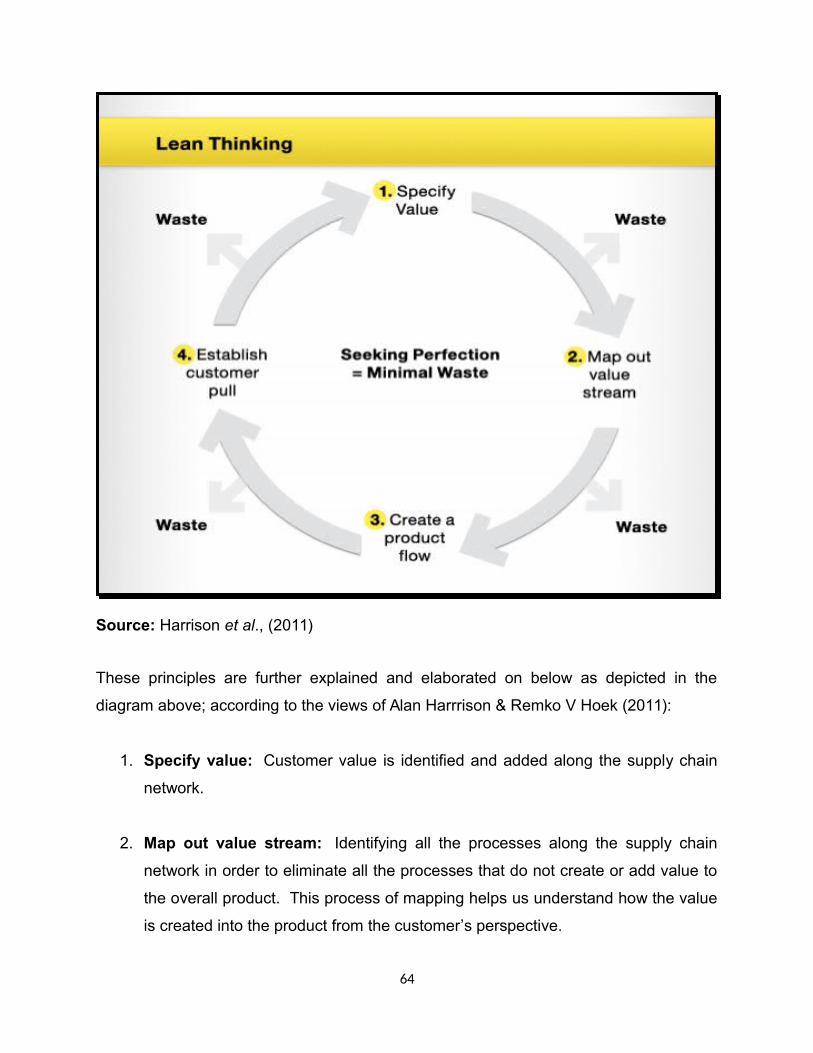
Source: Harrison et al., (2011)
These principles are further explained and elaborated on below as depicted in the
diagram above; according to the views of Alan Harrrison & Remko V Hoek (2011):
1. Specify value: Customer value is identified and added along the supply chain
network.
2. Map out value stream: Identifying all the processes along the supply chain
network in order to eliminate all the processes that do not create or add value to
the overall product. This process of mapping helps us understand how the value
is created into the product from the customer’s perspective.
64

3. Create a product flow: This entails applying the factors outlined in order to
make valuable processes to occur in a smooth system thereby minimizing
interruptions, inventories and downtime.
4. Establish customer pull: This entails manufacturing only in response from the
customer that more is needed; implying that demand information is made
available across the supply chain.
Each of these four processes should be perfected in order to progressively improve
every process involved and minimize waste; this will in turn lead to maximized value.
3.3.4.2 The Fundamentals of Lean
The lean philosophy emphasizes eliminating waste, simplifying processes, and
continuous improvement. The concept of lean is about doing more with less: less time,
effort, space and money. Lean strategies allow manufacturers to systematically and
continuously eliminate the waste that results from inefficient processes, which can
include inventory, over production, waiting, transportation, motion, over processing, and
defective products (QAD 2003:5).
Optimizing inventory and streamlining manufacturing processes are the two commonly
deployed lean manufacturing strategies because automotive manufacturers realize that
complicated business processes have added inefficiencies, costs and weeks to the
industry’s mass production business model. The key aspect of lean in any business
environment is to ensure that value is added at every stage of the process ( ‘the value
stream’) and steps in the process that do not add value are eliminated (Mangan et al.
2012:650). Lean enablers are the tools required to make these strategies work for the
process of lean planning and execution, JIT sequencing, consignment inventory,
Vendor-Managed Inventory (VMI), 100% partner connectivity and warehousing (QAD
2003:6). The diagram below depicts the fundamentals of leanness as explained above:
65
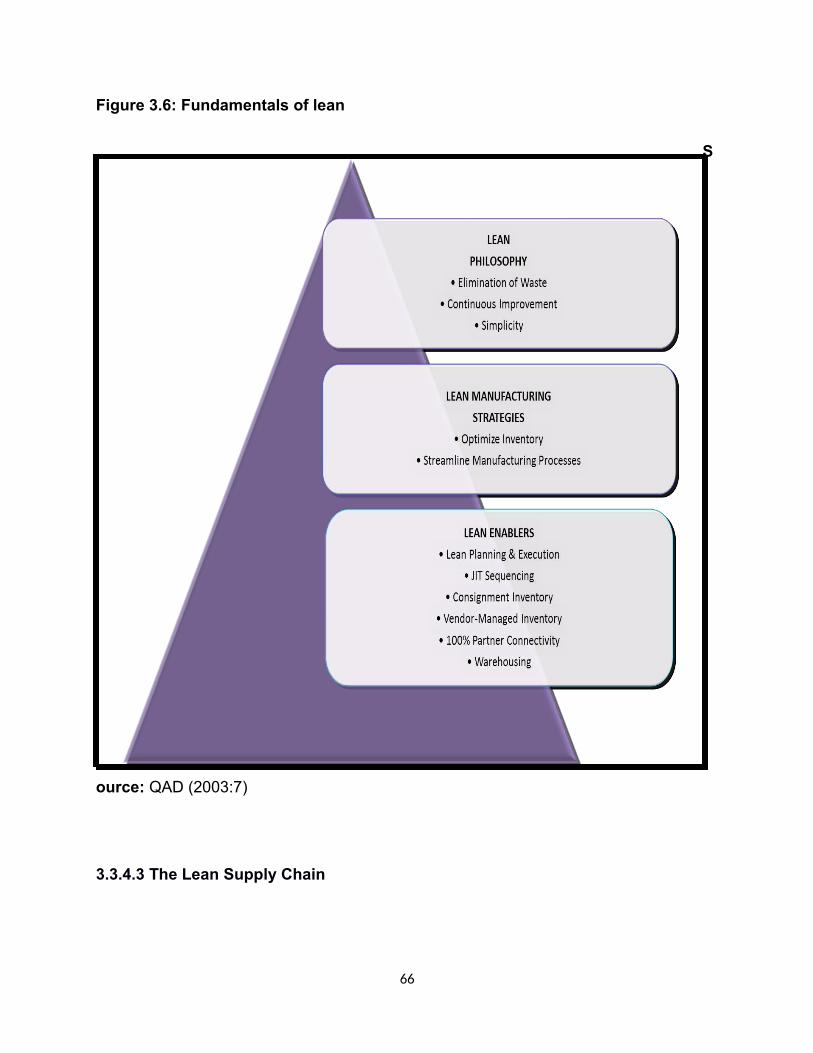
Figure 3.6: Fundamentals of lean
S
ource: QAD (2003:7)
3.3.4.3 The Lean Supply Chain
66

The lean supply chain is a strategy mainly based on cost reduction and flexibility, with a
focus on processes improvements, through the reduction or elimination of the all
“waste” (non-value adding operations). The strategy embraces all the processes
through the product life cycle, beginning with the product design all the way to the
product selling, from the customer order stage to the delivery stage. Reichhart and
Holweg (2007:1144) extended the concept of lean production to the downstream or
distribution level by defining lean distribution as minimizing waste in the downstream
supply chain, while making the right product available to the end customer at the right
time and location. To Vonderembse (2006:223) a lean supply chain is the one that
employs continuous improvement efforts that focus on eliminating waste or non-value
adding steps along the chain. Being lean focuses on cost reduction and flexibility, for
already available products, through the continuous elimination of waste or non-value
added activities across the chain.
This approach seeks to find ways to deliver exceptional value to end customers by
finding ways of eradicating waste and inefficiency throughout the supply chain (Womack
and Jones 1996:140 & Hines et al. 2000:994). Womack and Jones (Wong & Wong
2011:2164) define waste as any human activity which absorbs resources but creates no
value. ‘Muda’ is a Japanese word for waste and Ohno (Lewis 2000:959) has identified
seven types of waste which are also known as Ohno’s seven muda. They are
overproduction, waiting, transportation, unnecessary motion, inappropriate processing
and defects. Waste is always linked to lean. But later, the eight wastes have been
added to Ohno’s original list by other authors, namely as “underutilised people”.
However, Liker (Goodson 2002:105-113) uses a different term for the same type of
waste which is known as “unused employee creativity”.
The description of the eight types of wastes has been discussed and agreed by many
scholars.
The eight types of waste include:
67
i. Waste of overproduction
Overproduction is making too much, too early or just in case. Ohno believed that this
type of waste is crucial as it is the root of so many problems and other wastes
(Massachusetts Institute of Technology and University of Warwick 2001:15-75 &
Womack, Jones & Daniel 1996:15-320).
ii. Waste of waiting
Waste of waiting is directly relevant to flow and it is probably the second most important
waste. It occurs when time is not being used effectively. In a factory, this type of waste
occurs when goods are not moving and it affects both the goods and workers
(Massachusetts Institute of Technology and University of Warwick 2001:15-75 &
Womack, Jones & Daniel 1996:15-320). According to Bicheno and Holweg (2001:41-
49), waiting is directly relevant to lead time which contributes to competitiveness and
customer satisfaction.
iii. Waste of unnecessary motion
Unnecessary motion refers to both human and layout dimensions. The human
dimensions relate to the ergonomics of production, where operators have to physically
stretch, bend and pick up or move in order to see better and such waste is exhausting
for the employees and is likely to lead to poor productivity and quality problems (Wahab
et al. 2013:1292-1298). The layout dimensions refer to poor workplace space
arrangements that lead to micro- waste movement. From other studies conducted,
motion waste is also considered to be a health and safety issue (Massachusetts
Institute of Technology & University of Warwick 2001:15-75).
iv. Waste of transportation
68
Movement of materials and double handling is also considered as waste. This will affect
productivity and quality issue (Massachusetts Institute of Technology and University of
Warwick 2001:15-75 & Womack, James, Jones & Daniel 1996:15-320).
v. Waste of processing
This waste refers to machines and processes that are not quality-capable. A capable
process requires correct methods, training and a required standard that does not result
in making defects. The problem of over-processing also occurs in situations where
overly complex solutions are utilized for simple procedures such as using a large
inflexible machine instead of several small flexible ones (Wahab et al. 2013:1292-1298).
Over-complexity generally discourages an attitude of ownership and encourages the
employees to overproduce in-order to recover the large investment in the complex
machines. Such an approach also tends encourages poor layout, leading to excessive
use of transport and overall poor communication. The most ideal action, therefore, is to
have the smallest possible machine, capable of producing the required quality, located
next to preceding and subsequent operations (Massachusetts Institute of Technology
and University of Warwick 2001:15-75 & Womack, Jones & Daniel 1996:15-320).
vi. Waste of inventory
There are three types of inventory such as raw material, work in process and end items.
Excess inventory tends to increase lead time, prevents or hinders rapid identification of
problems, and increases space that would affect communication (Massachusetts
Institute of Technology and University of Warwick 2001:15-75 & Womack, Jones &
Daniel 1996:15-320).
vii. Waste of defects
69
Defects in internal failure are scrap, rework and delay while the external failure includes
warranty, repairs, and field service. Defects are direct cost for both immediate and long
term business finance. Defects in transaction process system (TPS) are an opportunity
to improve rather than something to be traded off (Massachusetts Institute of
Technology and University of Warwick 2001:15-75).
viii. Waste of underutilised people
Refers to having more people involved in a job than necessary, not involving the
associates in process improvement, not leveraging the individual potential to the fullest,
not using the creative brainpower of employees, not giving the right assignment/work,
uneven work distribution/load balancing, and losing time, ideas, skills, improvements,
and learning opportunities by not engaging or listening to your employees (Goodson
2002:105-113 & Ohno 2010:287).
Based on the research conducted by Bayou and Korvin (2008:287), manufacturing
leanness is a strategy applied to earn less input to better achieve the organisation’s
goals through producing better output, where ‘‘input’’\ refers to the physical quantity of
resources used and their costs, and ‘‘output’’ refers to the quality and quantity of the
products sold and the corresponding customer services.” In another review of lean
manufacturing, Narasimhan et al., (2006:440-457) have concluded that the efficient
usage of resources through the minimisation of waste is the essential aspect of
leanness as the main aim of lean manufacturing is to reduce waste and non-value
added activities.
However, most of the companies that have implemented lean have assessed lean
practice in their own unique way. The reason for this scenario lies in their internal issues
such as lack of knowledge and their understanding of lean, culture, skills and so on
(Wahab et al. 2013:1292).
This investigation looked into the performance levels of the medium and small
organisations as opposed to large organisations implementing the lean concept.
70

Equally, it is considered that the findings will be of enormous help to both lean
managers and organisations embarking upon their lean journeys by distinguishing the
possible focus of concentration when it comes to lean management.
3.3.3.4 Lean thinking and the theory of constraints
There are many areas of agreement between the advocates of lean thinking and theory
of constraints (TOC). These areas include value and flow; and they are briefly discussed
below:
(1) Value - Both TOC and Lean embrace the value principle in that the customer’s
perception of value is crucial. Lean’s perspective is that value can only be defined by
the ultimate customer. Similarly, TOC suggests that throughput is not generated until a
customer’s cheque for the product has been cleared by the bank. For TOC, the
customer’s perception of value is a major determining factor in increasing a product’s
throughput. A product that relieves prospect’s problems brings benefits the more and
bigger problems that it relieves the greater the benefits. Clearly the focus is on the
customer’s perception of value (Wahab et al. 2013:1292). According to Martin &
Patterson (2006:82) the value stream whether called a value stream by Lean or a value-
added lane by TOC the concept is the same; an explicit acknowledgment that customer
value is created by a chain of interdependencies that extends far beyond the walls of
the manufacturing plant. Both approaches also inherently recognize that the job of every
person in the organisation is to turn inventory into throughput. Defining the system and
creating an understanding of the actual process flow (with process flow and other
diagrams) is an early step in both TOC and Lean implementations (Martin & Patterson
2006:82).
(2) Flow – this concept has long been a buzzword with respect to improving
manufacturing operations. Schonberger’s book called Japanese Manufacturing
Techniques (1982); highlights the Nine Hidden Lessons in Simplicity. It also stresses the
importance of flow in a chapter entitled Simplify, and states that goods will flow like
71

water. Synchronous manufacturing devotes a section to “a river analogy” which
describes the flow of goods through the system. The first principle in synchronous
management is to balance flow not capacity. It is clear that both TOC and Lean
philosophies advocate flow. In Lean Thinking, Womack and Jones have logically
expanded the concept well beyond the manufacturing plant and back into the feeding
processes of design and order entry (Chizzo 1998:4). There is absolutely no conflict
between the two philosophies on the concept of the importance of flow. These two
concepts can be applied and adopted by organisations to achieve the benefits that
come with lean management.
After conducting the literature review on all the variables above it is necessary to
develop the hypothesis. This is done to support the reviewed literature. Thus the
following section 3.4 will provide the conceptual model and hypotheses development of
the study.
3.4 CONCEPTUAL FRAMEWORK AND HYPOTHESES DEVELOPMENT
The purpose of this chapter is to establish a conceptual framework of the influence of
supplier information- sharing and information quality on strategic partnerships and
internal lean practices among Small and Medium Enterprises’ in South Africa. Premised
on the reviewed literature in this chapter, a conceptual framework and hypotheses for
the study was formulated for further empirical examination.
Drawing from the literature review a research model was conceptualised. Hypothesised
relationships between research constructs where then developed thereafter. In the
conceptualised research model, supplier information- sharing and information quality
where the predictor variables, with Internal lean practices as the outcome variable, while
strategic partnership was positioned to be a mediating variable. Figure 3.6 below
illustrates the conceptual research model.
3.4.1 Conceptual Framework
72

The proposed conceptual framework consists of two antecedents which are supplier
information- sharing and information quality, these are the predicating variables. The
mediating variable is strategic partnership while the consequence for the SMEs or
outcome variable is internal lean practices. The key objective of this study is to explore
the factors that affect the level of trust and commitment in supply chain relationships
when it comes to information- sharing and the level of quality of that information that is
shared. Conceptually, the study tests the linkage between the information that is shared
and the quality of that information in a certain supply chain as well as the level of trust
and commitment that can be attained or achieved through strategic partnerships.
Additionally, this study also postulates that the relationships built through strategic
partnerships and the high the level of trust that can arise among supply chain partners,
can in fact lead to the outcome variable of internal lean practices through the positive
-effects of the predicator variables, information- sharing and information quality. Below is
figure 3.7 a diagram of the conceptual research framework:
Figure 3.7: Conceptual Research Framework
3.4.2 Hypothesis development
3.4.2.1 Supplier Information-Sharing and Strategic Partnership
73
Supplier Information
Sharing
Information Quality
Strategic Partnerships
Internal Lean Practices
H1@
H2
H3

Information sharing is an important element of cooperation in the process of supply
chain management (Cheng & Wu 2005:1159), and should be at the core of
collaborative, supply chain based business models (Fawcett, Osterhaus, Magnan, Brau
& McCarter 2007:358-356). Information sharing plays a key role in the process of
matching supply with demand to reduce the cost of excess inventory and loss of profits
from the effect of stock outs (Martin & Patterson 2006:82-92). Supply and demand
mismatch in the supply chain is often caused by uncertainty from lack of information
sharing in forecasting (Kwon & Suh 2005:26-33). Information asymmetries can be
significantly reduced by sharing inventory, production, and sales data, along with
planning and forecasting information (Patnayakuni, Rai & Seth 2006:13-49). Transaction
risks can also be reduced by sharing, monitoring, and controlling, information, such as
performance metrics, and production and delivery schedules (Kim & Umanath
1999:546).
Making use of a multi-organisational case study, Ghosh and Fedorowicz (2008:453-470)
concluded that an information- sharing relationship between retailers and suppliers is
essential to build up trust over time. Effective inter-firm communication plays a key role
in information sharing that increases understanding of both parties and can contribute
positively to better partnership quality (Lee & Kim 1999:29). Information- sharing is
essential to the trust-building process as the sharing of information enables each firm to
understand each other's routines better, and to develop conflict resolution mechanisms
(Kwon, Suh 2004:4-14 ;Nyaga, Whipple & Lynch 2010:101-114).
When members are hesitant in providing and sharing information with other parties in
the supply chain, this can hinder the strategic partnership- building process. A greater
level of information sharing tends to reduces uncertainty and it increases the level of
trust and openness in the relationship, in this case the strategic partnership. Based on
the arguments above, the author hypothesizes that:
H1: There is a positive relationship between supplier information- sharing and strategic
partnership.
74
3.4.2.2 Information Quality and Strategic Partnership
While information- sharing is an important factor, the significance of the impact it has on
supply chain management is dependent upon what information is shared, when and
how it is shared, and with whom (Chizzo 1998:4-9). The shared information must exhibit
certain attributes in order to create value for the partner firm (Ghosh & Fedorowicz
2008:453). Information quality includes aspects such as the accuracy, timeliness,
adequacy, reliability, credibility, understandability and ease of use of the information that
is exchanged (Monczka, Petersen, Handfield & Ragatz 1998:5553-5577). Information
quality is achieved when a focal firm and its supply chain partners share strategic and
operational information in trust relationships. Supply chain performance is dependent on
the quality of information shared among partner-firms. Three dimensions of the quality
of information sharing are: accuracy, trustworthiness (reliability or credibility), and
timeliness (Li & Lin 2006; Zhou & Benton 2007:1655). Security is included as one of the
essential attributes of information quality (Lee, Strong, Kahn & Wang 2002:133-146).
Inter-organisational cooperation increases the need to share confidential information
(Hallikas, Virolainen & Tuominen 2002:5553). Only when firms share vital and often
proprietary decision making information, can trust be established (Fawcett, Osterhaus,
Magnan, Brau & McCarter 2007:358). If all parties in the network do not have real-time
information about product specifications, transaction costs can be expected to increase
due to the complexity and uncertainty of the available information (Hallikas, Virolainen &
Tuominen 2002:45-55). Kwon and Suh (2004:4-14) found that the presence of such
uncertainty tends to impede the development of trust in supply chain relationships.
Information of low quality cannot be expected to raise the level of trust that exists in the
supply chain. For high level trust to occur, information shared must be accurate and
timely in nature (Jarrell 1998:58).
Relationships have been thought to be particularly critical for promoting exchange and
integration across functional and organisational boundaries (Boddy, Macbeth, & Wagner
2000:1003-1017; Bouty 2000:50-65; Jassawalla & Sashittal 1999:50-63 & Liedtka
1996:20-35). In particular, developing inter-organisational relationships has been found
75

to contribute to bottom-line success (Peng & Luo 2000:486-501). Effective two-way
communication has helped organisations adapt to rapid changes (Kraatz 1998:621).
Findings by some researchers have also suggested that inter-organisational
relationships are instrumental in promoting innovation within the organisations involved
(Goes & Park 1997:673-696). Therefore:
H2: There is a positive relationship between Information quality and strategic
partnership.
3.4.2.3 Strategic Partnership and Internal Lean Practices
Strategic partnerships involve a commitment that exists over an extended time period,
and the sharing of information, expected risks and rewards (Ghalami 2004: 5). The
relationship between organisations is said to be strategic when a firm perceives that it
needs the relationship in order to be competitive in the industry and that if the partner
where to go out of business, it would have to change its competitive strategy due to that
occurrence. On this basis, the number of partners offering a certain product or service
cannot usually be more than one in strategic partnering (Mentzer et al. 2000:549-568).
The implications of this in supply chain management and strategic partnership makes
the supplier selection, decision even more important. Effective partnership relationships
require a clear understanding of expectations from parties, accompanied by open
communication and information exchange, mutual trust, and coupled with a common
direction for the future shared by the partners.
This last issue, a common direction for the future, implies that the partnership relation
requires a long-term view (Ghalami 2004:5). As compared to large firms, innovative
small and medium sized South African organisations show a far higher level of
partnership activity (Sawers et al. 2008:176-182), which is a second indication of the
relevance of this study. The implementation of a particular lean practice will not only
have a direct performance benefit, but it can also improve the contribution of other
existing lean practices in a firm. Given the synergistic interaction among various lean
76
practices, managers should look at the system-wide effects of practices that are
adopted in their operations (Hofer et al. 2012:242-253) Also, interactions between
various practices should be assessed to determine the total performance effect of a
given lean practice.
The relative success and commercial benefits derived from lean thinking include a
focused enterprise-wide approach to continuous improvement, increased productivity,
improved quality and improved management. As a consequence, both academia and
industry are now beginning to investigate the application of the lean philosophy to go
beyond the primary manufacturing system (Hicks 2007: 234). Supply chain partners,
including the upstream suppliers and downstream customers of that chain, can then
work together as a team to provide value to the end user customer through applying
leanness. In order to achieve a Lean supply chain, partners have to work, together as
well as individually, to eliminate all wasteful processes and excess inventory across the
channel.
Due to the fact that lean systems operate with low levels of capacity, enterprises that
use them need to have a close relationship with their suppliers as supplies should be
shipped frequently, have short lead times, arrive according to schedule and be of high
quality. The lean philosophy looks for ways to improve efficiency reduce inventories
throughout the entire supply chain. Close cooperation between companies and their
suppliers can be a win-win situation for everyone, in the quest to achieve leanness
(Krajewski, Ritzman & Malhotra 2010: 318). In general, a reduction in waste will also
result in a reduction of costs for the supply chain. Therefore:
H3: There is a positive relationship between Strategic partnership and lean practices.
Table 3.3 below provides a summary of the hypotheses for the study that constitutes
this dissertation.
Table 3.3: Summary of the Hypotheses
77

Summary of The Influence of Supplier Information- Sharing andInformation Quality on Strategic Partnerships and Internal Lean
Practices among SMEs
HYPOTHESES OF THE STUDY
H/ No Hypothesis Statement Hypothesised Relationship
H1 There is a positive relationship
between supplier information- sharing
and strategic partnership.
Supplier Information Sharing → StrategicPartnership. (+)
H2 There is a positive relationship
between Information quality and
strategic partnership.
Information Quality → StrategicPartnership. (+)
H3 There is a positive relationship
between Strategic partnership and
lean practices.
Strategic Partnership → Lean Practices.
(+)
3.5 CONCLUSION
This chapter presented two main sections of related literature review as well as the
conceptualised model for the research study that constitutes this dissertation. The two
main sections are the theoretical literature review and the empirical literature review.
78

The theoretical literature review section discussed the main theory that forms the
theoretical grounding of this dissertation. This chapter began with a general introduction
followed by the theoretical framework that discussed the theory applied to this study
which is the coordination theory. The author then followed with an empirical review of
the literature on all the variables related to this study, beginning with supplier
information- sharing, information quality, strategic partnership and internal lean
practices.
Thereafter the conceptualised framework for the research study that constitutes this
dissertation was provided, in the conceptual model and hypotheses development
section that followed after the literature review. The research framework was
diagrammatically illustrated in figure 3.7. The research hypotheses for the research
study were presented and the linkages explained. The study focused on the direct
effects of supplier information- sharing and information quality and on how they can lead
to strategic partnerships which then finally lead to internal lean practices in an
organisation. The chapter was finally concluded with a conclusion.
79

CHAPTER FOUR
RESEARCH METHODOLOGY AND DESIGN
4.1 INTRODUCTION
This chapter of the dissertation presents the research methodology and design that was
undertaken for this study. It is important to outline the methodology of a study as it
helps the reader acquire confidence in the techniques used (De Vos, Strydom, Fouche
& Delport 2005). This section is also important because it enables the reader to
understand the various methods and principles that were employed in conducting the
study. The aim of a research methodology chapter is to ensure that a study can be
replicated. This chapter will discuss the research philosophy of the study; followed by
the research design which is an outline for the collection, measurement and analysis of
data. This is followed by a section on the discussion of the data analysis and statistical
approach applied in the study, lastly the research model fit assessment and all related
aspects are also discussed. The chapter ends with a conclusion
4.2 RESEARCH PHILOSOPHY
According to Moksha (2013:36) a research philosophy is a belief about the way in which
data about a phenomenon should be gathered, analysed and used. The term
epistemology as opposed to doxology encompasses the various philosophies of
research approach. Two major research philosophies have been identified in the
Western tradition of science, namely positivist (sometimes called scientific) and
interpretive also known as anti- positivist (Clarke 2005: 13).
Quantitative research is generally associated with the positivist paradigm (Porta &
Keating 2008: 23-24). This approach usually involves collecting and converting data into
numerical form so that statistical calculations can be made and conclusions drawn from
80
the collected numerical data (Moksha 2013:24). Hence the reason the author is using
the research approach as explained below as the preferred approach for the study.
Quantitative research aims to measure the quantity or amount and then compares it
with past records and tries to project this for future period. In social sciences,
quantitative research refers to the systematic empirical investigation of quantitative
properties and phenomena and their relationships (Source: http://en.wikibooks.org
[Viewed: 7/14/2014]). The objective of quantitative research is to develop and employ
mathematical models, theories or hypotheses pertaining to phenomena.
The process of measurement is central to the quantitative research process because it
provides a fundamental connection between empirical observation and mathematical
expression of quantitative relationships. Statistics is the most widely used branch of
mathematics in quantitative research. Statistical methods are used extensively within
fields such as economics and commerce. Quantitative research involving the use of
structured questions, where the response options have been pre-determined and a
large number of respondents is involved in this type of research: For example, the total
sales in the soap industry in India in terms of rupees and the quantity in terms of lakhs
per ton for a particular year, say 2008, could be researched. This could then be
compared with the past 5 years and then figures could be projected for 2009; Example
drawn from the internet (online) Available at <wikibooks.org> [Viewed: 7/14/2014].
In essence quantitative research begins with a problem statement and involves the
formation of a hypothesis, a literature review, and a quantitative data analysis. Creswell
(2003:21) states, quantitative research “employ strategies of inquiry such as
experimental and surveys, and collect data on predetermined instruments that yield
statistical data” The findings from quantitative research can be predictive, explanatory,
and confirming ( Moksha 2013:25).
For the purpose of this study quantitative research tools where reviewed as systematic
and structured devices that aim to obtain information from respondents in a direct and
open manner (Du Plessis & Rousseau 2007:21). Results from these research tools are
81
easily quantifiable and the instruments have a potentially high degree of accuracy.
Whereas, Qualitative research tools are those that are more unstructured, flexible, and
diagnostic than quantitative research tools, and aim to obtain information from
respondents in an indirect manner. Researchers are interested in gaining a rich and
complex understanding of people’s experience and not in obtaining information which
can be generalized to other larger groups. Their results are more descriptive, but are
difficult to quantify and prone to measurement error and bias (Hair et al. 2010:4). The
research design for this paper has encompassed both a review of the literature and an
empirical study using a quantitative research approach.
4.3 RESEARCH DESIGN
The research design refers to the overall strategy that the researcher chooses to
integrate the different components of the study in a coherent and logical way. This
ensures that the researcher is able to effectively address the research problem; it
constitutes the outline for the collection, measurement, and analysis of collected data
(Bless, Higson-Smith & Kagee 2006:71). Types of research design can include;
Descriptive, Correlational, Field (survey), Experimental, Review, Qualitative, Meta-
analysis and many others depending on different authors’ views.
For the current study the cross-sectional survey design was utilized. This type of
research design has three distinctive features: no time dimension; a reliance on existing
differences rather than change following intervention; and, groups are selected based
on existing differences rather than through random allocation. The cross-sectional
design can only measure differences between or from among a variety of people,
subjects, or phenomena rather than a process of change. Thereby, researchers using
this design can only employ a relatively passive approach to making causal
assumptions based on findings (Hall 2008: 173).
82
4.3.1Target Population
The entire set of people or objects which is the focus of the research and about which
the researcher wants to determine some characteristics after identification is called the
population (Bless, Higson-Smith & Kagee 2006:97). The subset of the whole population
which is actually investigated by a researcher and whose characteristics will be
generalised to the entire population is called the sample (Bless, Higson-Smith & Kagee
2006:97).
The target population refers to a group of population (people) who are to be reached,
through some form of action or intervention (online) Available at <speakapp.com.>
[Accessed: 2010/10/29]. The target population for this study was obtained from the
database of the supply chain SMEs in four South African provinces including the
Gauteng, North West, Free State and Limpopo province. These four provinces were
obtained to provide a broader and a variety of both developed areas and disadvantaged
areas.
4.3.2 Sampling Method and technique
Sampling Method and Technique Determining the process of how the sample units are
to be selected is an important decision for a quantitative study and this decision requires
the selection of a sampling method. The choice between probability and non-probability
sampling methods often involves both statistical and practical considerations (Levy &
Lemeshow 2008). Statistically, probability sampling allows the researcher to
demonstrate the representativeness of a sample, an explicit statement as to how much
variation is introduced, and identification of possible 80 biases (Kumar, Aaker & Day,
2002:306). Therefore, based on the above reasoning, probability sampling is considered
appropriate for this survey-based study. To be more precise, SME owners/managers in
the previously mentioned provinces were sampled, using simple random sampling
where each population element had a known non-zero chance of being selected. This
sampling technique has the following advantages: it is an easy-to-use method, and it
minimises the selection bias which enhances the reliability of results.
83
4.3.3 Research Context
The empirical contexts for this study are the firms and manufacturing industries in the
relevant supply chains in South Africa. Several factors were considered and prompted
the choice of both the firms and manufacturing industries of the supply chain sector in
South Africa as the chosen research context.
4.3.4 Sampling Design Technique
The sampling techniques available in research are divided into probability and non-
probability sampling (Hair et al. 2010:20). Non-probability and probability sampling are
two approaches that can be used to select a research sample (Zechmeister,
Zechmeister & Shaughnessy 2001:94). Probability sampling affords an equal likelihood
that each person in the population is included, whereas with the application of non-
probability sampling the likelihood of individuals being selected in the population is
unknown (Zechmeister et al. 2001:94-106; Terre Blance & Durrheim 2002:94).
This research study has used probability sampling; this type of sampling allows the
researcher to estimate the accuracy of the generalisation from the sample that was
randomly selected to the whole population. A stratified sampling method was utilised for
validity and reliability reasons using the database from the Ministry of small and medium
enterprises. This technique facilitates in the selection of the sample without decreasing
the quality of the sample in any way. With stratified sampling, the population to be
studied is divided into mutually exclusive groups (industry sectors) and random samples
are drawn from each group (Armstrong & Kotler 2007:111).
4.3.5 Sample Size
Sample size determines the statistical precision of the findings. It provides a basis of
the estimation of sampling error. Thus, sample size is a function of change in the
population parameters under study and the estimation of the quality that is needed by
the researcher (Wegner, 2000:23). Generally, larger samples result in more precise and
84

robust statistical findings, while smaller samples result in less precise and unreliable
findings (Terre Blanche et al., 2006:236). The determination of the final sample size
involves judgment especially where probability sampling was employed, and calculation
where random sampling was used by the researcher. Using a sample size similar to the
previous studies sample sizes provides the researcher with a comparison of other‟
researchers judgement. According to Kumar et al. (2002:318), four factors determine‟
the sample size: the number of groups within the sample, the value of the information
and the accuracy required of the results, the cost of the sample, and the variability of
the population. Sample size has a direct impact on the appropriateness and the
statistical power of structural equation modelling to be used in the current study
(Jackson, 2003). While the technique does not use individual observation, sample size
plays an important role in the estimation and interpretation of SEM results (Hair et al,
2006).
Terre Blanche and Durrheim (2002:274) define sampling as the process used to select
cases for inclusion in a research study. Sampling is used to define the parameters for
data collection where it is impossible or either impractical to collect data about the whole
population that is under study. Sampling is an important element of the research study
because it helps in determining the type of conclusions that can be drawn from the
research study (Terre Blanche & Durrheim 2002:275; Silverman 2006:37). The sampling
frame for any probability sample applied in a study is a complete list of all the cases in
the population from which your sample will be drawn (Saunders, Lewis & Thornhill
2009:72).
The size of the sample should neither be excessively large, nor too small. It should be
optimum. An optimum sample is said to be one which fulfills the requirements of
efficiency, representativeness, reliability and flexibility. In the process of deciding the
size of the sample, the researcher must determine the desired precision as an
acceptable confidence level for the chosen estimate. The size of population variance
needs to be considered as in the case of a larger variance a bigger sample might be
needed. The parameters of interest in a research study must be kept in view, while
deciding on the size of the sample. Costs also dictate the size of sample that a
85

researcher can draw. As such, budgetary constraints must be taken into consideration
when deciding on the sample size (Kothari 2009:56).
For the purpose of this study, three hundred and fifty (350) questionnaires were
distributed to selected firms after making appointments and agreements with respective
owners or managers of the firms, taking into account all ethical considerations. This was
done because Structural Equation Modelling requires a large data set to obtain
meaningful results (Hair et al. 2010:50). Self-administered structured questionnaires
were used for reasons of validity and reliability.
4.3.6 Measuring Instrument
The measuring instrument was designed in such a way that it suited the South African
context. Research scales were operationalized mainly on the basis of previous works by
other researchers. Minor adaptations were made in order to accommodate the current
research context and purpose of study. The questionnaire was adapted from Jengchung
V. Chen, David C. Yen, T.M. Rajkumar, & Nathan A. Tomochkov (2011). Other
contributions were obtained from HICKS, B.J (2007); and Christina Maria Dües, Kim
Hua Tan & Ming Lim (2013).
The measurement items were quantified using a 5-point Likert scale with the following
representative values: 1-strongly disagree to 5-strongly agree. This scale of
measurement is based upon the assumption that each statement/item on the scale has
equal attitudinal value, importance or weight in terms of reflecting attitudes towards the
issued questions (Kumar, 2005:145). The questionnaire items consisted of four
variables, namely, information- sharing, information quality, strategic partnerships and
internal lean practices. The full measurement instrument is attached as annexure1.
4.3.7 Data Collection
The collection of data was done through the use of structured self-completion
questionnaires. The questionnaire was accompanied by a brief cover letter in which a
brief introduction and the purpose of the research study, and the individual, non-
86

commercial academic nature of the study is stressed (Dillman 2007). Additionally, the
significance of the study, the importance of their assistance, and the assurance of
confidentiality and anonymity of the response are highlighted.
The questionnaires were distributed to the various respondents by the author with the
help of research assistants who met the respondents face to face and explained any
questions the participants had, where necessary. Others questionnaires were also
distributed via email, after gaining permission from the respondents telephonically. The
highest response rate was from the questionnaires that where distributed face to face.
After collection of the data, data was coded, cleansed and analysed to get the results
that will be depicted and discussed in chapter five.
4.4 DATA ANALYSIS AND DATA ANALYSIS APPROACH
The collected data was coded in an excel spread sheet and data cleansing was
performed. Descriptive statistics were obtained using SPSS 21 software and the CFA
and path modelling were tested using AMOS 21 software. To gain an understanding of
the characteristics of each variable, descriptive statistics analysis was used which is
illustrated by the mean and standard deviation of each factor. In addition, a confirmatory
factor analysis (CFA) was done leading to a path modelling for structural equation
modelling (SEM).
4.4.1 Reliability and Validity of Measurement Scales
Wilks (1961: 6-7) suggests that there are three requirements of measurement. First,
measurement must be an operationally definable process. Second, measurement
should be valid or accurate (validity). Third, the outcome of the measurement process
must be reproducible (reliability). The total error of a measurement consists of
systematic errors, which involve with validity test, and random errors, which are
measured by reliability test (Aaker 2007:20).
87

Reliability and validity is undertaken to check for consistency and meaningfulness of the
collected research data. Factor analysis was undertaken to check the reliability of the
measurement items and the internal consistency of the research constructs. In
particular, the factor loadings, the Cronbach’s alpha values and composite reliability
(CR) values were determined using SPSS and Amos 21 software in order to check
measurement items reliability. Convergent and discriminate validity of the research
constructs were determined by checking the inter-correlation between the research
constructs and by comparing the Average Variance Extracted (AVE) and shared
variance (discriminate validity). However, convergent validity was assessed using item-
to-total correlation values, item loadings and AVE values as indicators.
4.4.2. Structural Equation Modelling (SEM)
This study made use of SEM, using the AMOS 21 software package in order to test the
structural paths of the conceptualised research model. SEM technique demonstrates
and tests the theoretical underpinning of a proposed study and the significance of the
relationships between models constructs (Hair et al. 2010: 51). SEM stipulates a
technique where separate relationships are allowed for each set of dependent variables
and it provides an estimation technique for a series of separate multi-regression
equations to be estimated simultaneously. It further contains two components namely
the structural model, which is the path where independent, and dependent variables are
being connected and the measurement model that enables this study to use several
indicators for a single independent variable. By assessing each relationship
simultaneously rather than separately, an incorporation of all the multi-scale items can
be used to account for measurement errors within each scale (Hair et al., 2010:51).
4.4.2.1 What is Structural Equation Modeling?
Structural equation modeling (SEM) is a statistical methodology that takes a
confirmatory approach to the analysis of structural theory that is bearing on some
phenomena (Byrne, 2001:55-86). It makes use of various types of models to predict
88
relationships among the observed variables, with the basic goal of providing a
quantitative test of a theoretical model that is hypothesised by the researcher. According
to Schumacker and Lomax (2004: 3) the goal of performing a SEM analysis is to
determine the extent to which the theoretical model is supported by the sample data.
If it is found that the sample data that is tested, supports the theoretical model then
more complex theoretical models can therefore be hypothesised. If the sample data
does not support the theoretical model then the original model needs to be modified and
then re-tested. “In other words the researcher must operationally define the latent
variable of interest in terms of behaviour believed to represent it (Byrne 2001:55-86).”
Therefore, the latent (unobserved) variable is linked to one that is observed, making its
measurement possible. In SEM the unobserved latent variable is represented by a circle
(or an ellipse).
Second, observed or manifest variables are a set of variables that researchers use to
define or infer the latent variables (Schumacker & Lomax 2004:3). These variables
serve as indicators of the underlying construct that they are presumed to represent. In
SEM the observed variable is represented by a square (or a rectangle). In addition,
these two types of variables can be defined as either independent variable (exogenous)
or dependent variable (endogenous). According to Schumacker and Lomax (2004:3), an
independent variable is a variable that is not influenced by any other variable in the
model. A dependent variable is a variable that is influenced by another variable in the
model.
4.4.2.2 Basic Model
SEM in this study relates to three types of model. First a measurement model of
confirmatory factor analysis (CFA) is a model that solely focuses on the link between
factors and their measurement variables. According Byrne (2001:55-86) there are two
basic types of factor analysis: exploratory factor analysis (EFA) and confirmatory factor
analysis (CFA).
89
In contrast to EFA, CFA is appropriately used when the researcher has some level of
knowledge of some underlying latent variable structure. Based on this knowledge of
theory, empirical research, or both, he or she postulates relationships between the
observed measures and underlying factors a priori and this hypothesised structure is
then reflected statistically (Byrne, 2001:55-86). Thus, in CFA a researcher specifies a
certain number of factors, which are correlated, and for which the observed variables
can measure each factor. In CFA a researcher has an a priori specified theoretical
model and in EFA the researcher does not have such a model. This current study uses
CFA since the measures have been adopted from previous literature and have been
widely used by several researchers in the past.
The second type of model is a Path Model or a Path Analysis which involves the
estimation of presumed causal relations among observed variables. According to Kline
(2005: 94) in path analysis the researcher specifies a model that attempts to explain
why X and Y are correlated. Part of this explanation may include presumed causal
effects (e.g. X causes Y), or presumed non-causal relations, such as a spurious
association between X and Y. The overall goal of the path analysis is to assess how well
the model accounts for the data that is the observed correlations or co-variances. The
researcher can hypothesize the impact of one latent construct on another construct in
modeling of causal direction. The model is termed full because it consists of both a
measurement model (CFA) and a structural model (depicting the links among the latent
variables) (Byrne, 2001:55-86).
4.5. RESEARCH MODEL FIT ASSESMENT (CFA & PATH MODELLING)
A measurement model of confirmatory factor analysis (CFA) is a model that focuses
exclusively on the link between factors and their measurement variables. CFA seeks to
statistically test the significance of a hypothesised factor model developed by the
researcher. It assumes that commonalities are initially one, implying that the total
variance of the variables can be accounted for by means of its components (or factors)
and there is thus no error variance. CFA is appropriately used when the researcher has
90

some knowledge of some underlying latent variable structure. Based on such
knowledge of theory, empirical research, or both, the researcher postulates
relationships between the observed measures and underlying factors a priori and this
hypothesised structure, statistically (Byrne 2001:54). Thus, in CFA, the researcher
specifies a certain number of factors which are correlated, and for which observed
variables measure each factor. In this study, CFA is employed since the measures have
been adopted from previous literature and have previously been widely used by several
researchers. It is recommended that data screening be performed.
Confirmatory factor analysis involves the division of a large number of variables into a
smaller number of factors within which all variables are related to each other
(Schumacker & Lomax 2004:167). The purpose of factor analysis is to explore the
underlying variance structure of a set of correlation coefficients. A confirmatory factor
analysis was also done to establish whether or not the model was fit for the
conceptualised research model. Model fit indicators such as Chi-square/degrees of
freedom, Goodness of Fit Index (GFI), Augmented Goodness of Fit Index (AGFI),
Normed Fit Index (NFI), Incremental Fit Index (IFI), Tucker-Lewis Index (TLI),
Composite Fit Index (CFI) and the Random Measure of Standard Error Approximation
(RMSEA) were used to assess the model fit. The chi-square should be less than 0, 3 to
show positive results and the CFI, GFI, IFI, NFI, & TLI should be above 0, 9 while the
RMSEA should be less than 0, 08 ( Schumacker & Lomax 2004:176-177). The model fit
indicators are briefly discussed below:
4.5.1.1 Chi-square (χ2)
Chi-square is a very useful index in SEM which is used to evaluate differences between
observed and estimated covariance matrices. The main aim in SEM is to achieve a non-
statistical significance which reveals a small difference between the sample variance-
covariance matrix and the reproduced implied covariance matrix (Schumacher
2006:83). The difference between these two covariance matrices is enclosed in a
residual matrix. A chi-square value of zero signifies a perfect fit or no difference between
the values in some covariance matrix and the reproduced implied covariance matrix.
91

Thus, when the chi-square value is close to zero or non-significant, the residual values
in the residual matrix are close to zero, it reveals that the theoretically specified model
fits the sample data (Schumacher 2006:83). Therefore, a smaller chi-square value (less
than 3) and a larger p-value (>0.05) are preferred and recommended.
4.5.1.2 Goodness-of-fit Index (GFI)
This test enables us to see how well does the assumed theoretical distribution (such as
Binomial distribution, Poisson distribution or Normal distribution) fit to the observed
data. When some theoretical distribution is fitted to the given data, we are always
interested in knowing as to how well this distribution fits with the observed data (Kothari
2004:237). GFI ranges between 0 and 1. Nevertheless, the index in theory can produce
meaningless negative values. Relatively, it is the percentage of observed covariance
explained by the model.
GFI is similar to R square in multiple regressions, except that it cannot be interpreted as
the percentage of error explained by the model. In other words, while R-squared in
multiple regression deals with error variance, GFI on the other hand, deals with error in
reproducing the variance-covariance matrix. GFI value increases when the sample
grows larger. In principle, an acceptable model fit is reached where the GFI value is
equal to or greater than 0.90 (Bollen 1990:446).
4.5.1.3 Root mean square residual (RMR)
RMR stands for the average residual value those results from the fitting of the variance-
covariance matrix for the posited model to the variance-covariance matrix of the sample
data. These residuals are difficult to interpret, since they are relative to the sizes of the
observed variance and covariance. Consequently, these residuals are best interpreted
in the metric of correlation matrix. The outcome from the matrix embodies the average
value across all standardised residuals and varies from 0 to 1. Therefore, an RMR value
that is closer to 0 for the tested model improves the model fit (Hu & Bentler 1995:72).
92

4.5.1.4 The norm fit index (NFI)
NFI was developed originally to alternate CFI though it does not require making chi-
square assumptions. It ranges from 0 to 1, with 1 representing a perfect fit. NFI reveals
the proportion by which the researcher’s model improves fit compared to the null model
(random variables). In principle, NFI values below 0.90 shows a need to re-specify the
model (Hu & Bentler 1995:76).
4.5.1.5 The comparative fit index (CFI)
CFI is commonly referred to as the Bentler Comparative Fit Index. It is used to compare
the existing model fit with a null model that assumes that the latent variables in the
model are uncorrelated. The CFI index compares the covariance matrix posited by the
model to the observed covariance matrix. In addition, it evaluates the null model with
the observed covariance matrix in order to estimate the percentage of lack of fit which is
accounted for by going from the null model to the researcher’s SEM model. CFI varies
from 0 to 1. A CFI value close to 1 indicates a very good model fit. In principle, CFI
should be equal to or greater than 0.90 to accept the model, showing that 90 percent of
the covariation in the data can be reproduced by the given model (Hair et al., 2006:37).
4.5.1.6 The incremental fit index (IFI)
IFI is basically computed in the same way as the NFI, except that it takes into
consideration the degrees of freedom. It was developed by Bollen (1990) to deal with
the NFI related limitations in the issues of parsimony and sample size. The
recommended value for IFI that gives an acceptable model fit should be greater or
equal to 0.9. However, the IFI value can also exceed 1, under certain circumstances
(Hair et al., 2006:39).
4.5.1.7 Root mean square error of approximation (RMSEA)
93
RMSEA is an index whose value answers the question of how well the research model
will fit the population covariance matrix if it were available, with unknown but optimally
chosen parameter values (Browne & Cudeck 2002:137). It takes into consideration the
error of approximation in the population. RMSEA expresses such discrepancies per
degree of freedom, hence sensitising the index to the number of estimated parameters
in the model. The recommended threshold value for RMSEA that yields a good model of
fit should be less than or equal to 0.05. However, a value of less than, or equal to, 0.08
for the RMSEA index gives an adequate model fit (Browne & Cudeck 2002:138).
4.5.2 Path modelling
The Path Model or a Path Analysis involves the estimation of presumed causal relations
among observed variables. According to Kline (2005:94), in path analysis, the
researcher specifies a model that attempts to explain why X and Y are correlated. Part
of this explanation may include presumed causal effects (e.g. X causes Y), or presumed
non-causal relations, such as a spurious association between X and Y. The overall goal
of the path analysis is to assess how well the model accounts for the data, that is, the
observed correlations or covariance. To better understand the model, two major types of
variables were introduced. First, latent variables or factors were recognised as variables
that are not directly observed or measured. They are indirectly observed and are
therefore inferred from a set of variables that researchers measure using statistical
techniques such as tests or surveys. In other words, the researcher must operationally
define the latent variable of interest in terms of the behaviour believed to represent it
(Byrne, 2001:7). Therefore, the latent (unobserved) variable is linked to one that is
observed, making its measurement possible. In SEM the unobserved latent variable is
represented by a circle (or an ellipse). Alternatively, observed or manifest variables are
a set of variables that researchers use to define or infer the latent variables
(Schumacher, 2006:5). These variables serve as indicators of the underlying construct
that they are presumed to represent. In SEM the observed variable is represented by a
square (or a rectangle). In addition, these two types of variables can be defined as
either independent variables (exogenous) or dependent variables (endogenous).
94

4.6 CONCLUSION
This chapter outlined the research design and methodology of the current study. It
began with an introduction; followed by a discussion of the research philosophy. The
research design was discussed with aspects such as the target population, research
context, sampling technique, and sample size which ended with an explanation of the
measurement instrument and an explanation on how data was collected. The fourth
aspect outlined was the data analysis and statistical approach which included reliability
and validity of measurement scales and structural equation modeling (SEM). The fifth
aspect was the discussion of the research model fit assessment, which explains the
confirmatory factor analysis (CFA) and path modeling. Finally the chapter ended with a
conclusion.
95
CHAPTER FIVE
DATA ANALYSIS AND INTERPRETATION OF RESULTS
5.1. INTRODUCTION
The data after the collection process has to be processed and analysed in accordance
with the outline laid down for the purpose at the time of developing the research plan.
This is an essential part of the scientific study and is important for ensuring that we have
all relevant data for making contemplated comparisons and analysis. In more technical
terms, processing implies editing, coding, classification and tabulation of collected data
so that they are amenable to analysis (Kothari 2005:122).
This chapter of the dissertation will present the data analysis and results, up to the
assessment of research model fit. The hypothesis testing part, using Structural Equation
Modeling (SEM) will also be presented. This chapter will commence by discussing the
data screening process, followed by the presentation of data analysis procedure. The
sample description is then provided, and then following sample description, a test of
measures and accuracy analysis statistics are given. This section of the chapter mainly
tests for the measures’ reliability and validity using different methods to ascertain the
accuracy of the study.
For measure reliability, the Cronbach’s Alpha, the Composite Reliability (CR) value and
the Average Value Extracted (AVE) are used to check it while for validity; Factor
Analysis is used to check convergent validity and correlation matrix and chi-square -
CFA difference are used to check for discriminant validity. This section is followed by a
presentation of the research models fit. Numerous indicators such as the chi-square
value, Goodness of Fit Index (GFI), Normed Fit Index (NFI), Lewis-Tucker Index (TLI),
Incremental Fit Index (IFI), Comparative Fit Index (CFI) and Root Mean Square Error of
Approximation (RMSEA) used to ascertain if the research model fits the collected data.
Finally, a summary of the chapter is provided.
96

5.2. DATA SCREENING
Following the data collection, the next step is the data screening process as suggested
by Malhotra (1999:160-183) and Churchill (1999:250), was implemented to ensure that
the collected data is cleaned before performing any further statistical analysis.
Screening the collected data is the first step towards obtaining some insights into the
characteristics of that data. It is also an important aspect in ensuring the accuracy of the
data entry and assessment of outliers before proceeding to analyse the summary
statistics for the survey responses that were collected (Schumacker & Lomax 2004:32).
The major analytical tasks involved in the data screening process include questionnaire
checking, editing, coding, and tabulation. The responses were carefully coded with an
identification number that is related to a specific SME. Using the SPSS software, each
data field was tested for the mean and standard deviation to detect any typographical
errors and possible outliers. The data was cleaned after the errors in data entry were
corrected.
5.2.1 Data Analytical Procedures
To analyse the empirical data, several relevant statistical methods were employed. First,
coefficient alpha and adjusted item-to-total correlations were used in assessing the
internal consistency of each construct. The data was analysed using SPSS. For the
assessment of final measures, confirmatory factor analysis (CFA) was performed using
the AMOS 7 software program.
Statistical procedures used to validate measures consisted of the assessment of items
and scale reliability, uni-dimensionality, and convergent and discriminant validity. Details
of structural equation modeling (SEM) will be analysed in this chapter. The interpretation
of results will also be discussed as well as the procedures of statistical analysis will be
undertaken in this chapter.
97
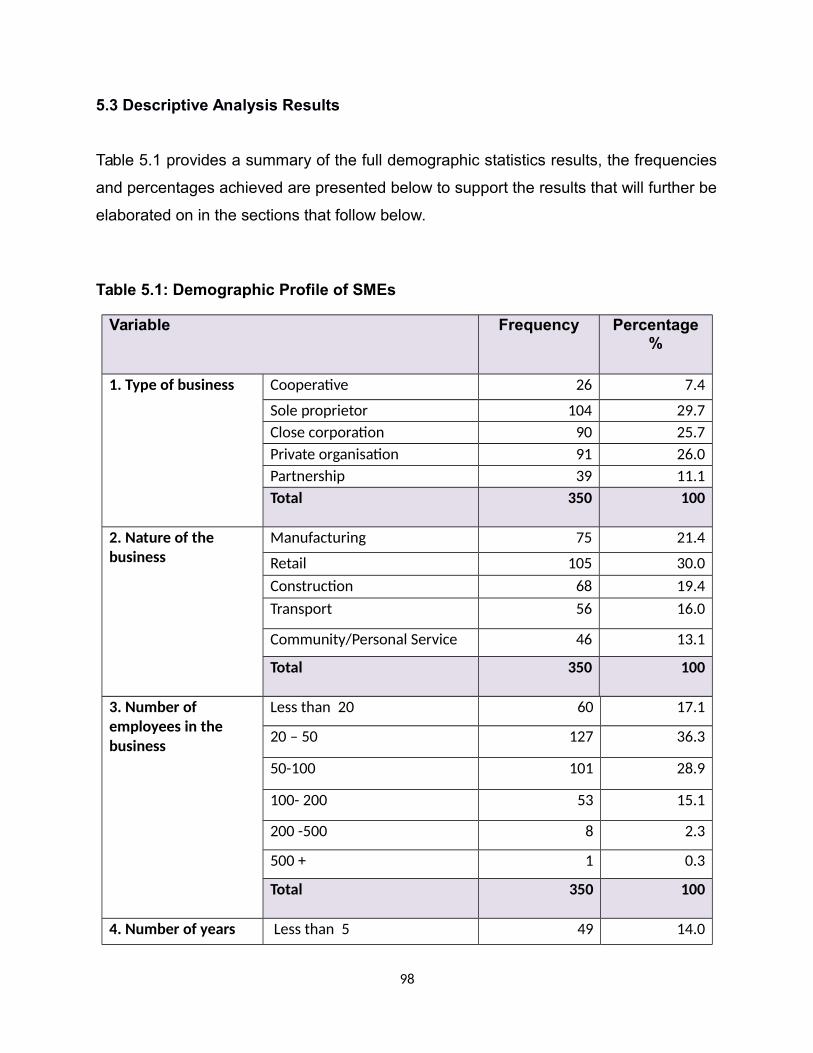
5.3 Descriptive Analysis Results
Table 5.1 provides a summary of the full demographic statistics results, the frequencies
and percentages achieved are presented below to support the results that will further be
elaborated on in the sections that follow below.
Table 5.1: Demographic Profile of SMEs
Variable Frequency Percentage%
1. Type of business Cooperative 26 7.4
Sole proprietor 104 29.7Close corporation 90 25.7Private organisation 91 26.0Partnership 39 11.1Total 350 100
2. Nature of the business
Manufacturing 75 21.4
Retail 105 30.0Construction 68 19.4Transport 56 16.0
Community/Personal Service 46 13.1
Total 350 100
3. Number of employees in the business
Less than 20 60 17.1
20 – 50 127 36.3
50-100 101 28.9
100- 200 53 15.1
200 -500 8 2.3
500 + 1 0.3
Total 350 100
4. Number of years Less than 5 49 14.0
98
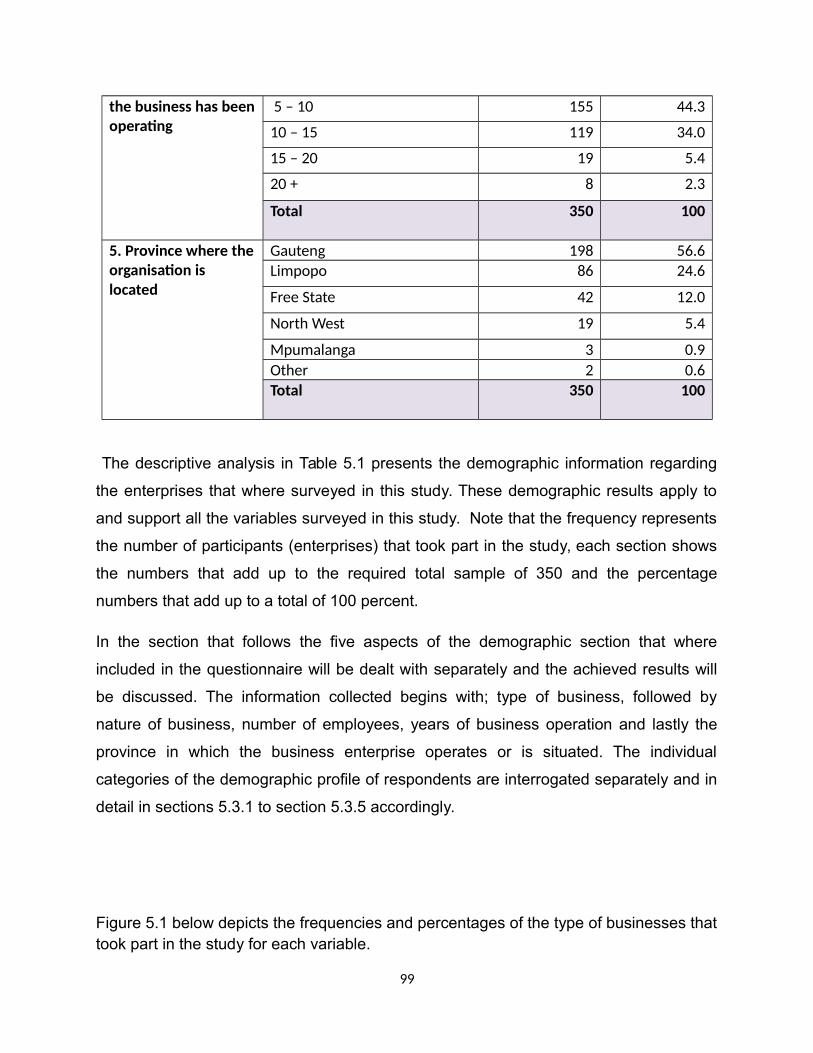
the business has beenoperating
5 – 10 155 44.3
10 – 15 119 34.0
15 – 20 19 5.4
20 + 8 2.3
Total 350 100
5. Province where theorganisation is located
Gauteng 198 56.6Limpopo 86 24.6
Free State 42 12.0
North West 19 5.4
Mpumalanga 3 0.9Other 2 0.6Total 350 100
The descriptive analysis in Table 5.1 presents the demographic information regarding
the enterprises that where surveyed in this study. These demographic results apply to
and support all the variables surveyed in this study. Note that the frequency represents
the number of participants (enterprises) that took part in the study, each section shows
the numbers that add up to the required total sample of 350 and the percentage
numbers that add up to a total of 100 percent.
In the section that follows the five aspects of the demographic section that where
included in the questionnaire will be dealt with separately and the achieved results will
be discussed. The information collected begins with; type of business, followed by
nature of business, number of employees, years of business operation and lastly the
province in which the business enterprise operates or is situated. The individual
categories of the demographic profile of respondents are interrogated separately and in
detail in sections 5.3.1 to section 5.3.5 accordingly.
Figure 5.1 below depicts the frequencies and percentages of the type of businesses thattook part in the study for each variable.
99
Figure 5.1: Type of business
According to the results as depicted in figure.5.1above, they present the types of
businesses that took part in this study. The results indicate that the sole proprietor had
the majority share of respondents with 30% (n=104), followed by the close corporation
which had a share of 26% (n=104) and the private companies which had a share of
26% (n=91) of respondents. Lesser responses were obtained from partnerships at 11%
(n=39) and cooperatives at 7% (n=26). The table 5.1 above depicts the full
demographic statistics of the study as stated here.
5.3.2 Nature of the business
Figure 5.2 below depicts the frequencies and percentages of the nature businesses that
took part in the study for each variable.
100

Figure 5.2: Nature of the business
Above shown are the results for descriptive statistics under nature of the business.
Figure 5.2 presents the nature of businesses that took part in the study, the majority of
respondents where in the retail sector with 30% (n =105), followed by the manufacturing
sector with 22 % (n=75), then the construction sector at 19% (n = 68), the transport
sector had a share of 16% (n=56) and lastly community/personal service with a share of
13% (n=46). Therefore it can be concluded that the majority of the firms that took part in
the study were in the retail sector. The table 5.1 depicts the full demographic statistics of
the study.
5.3.3 Number of employees in the business
101
Figure 5.3 below depicts the frequencies and percentages of the number of employees in business that took part in the study for each variable.
Figure 5.3: Number of employees in the business
The above figure 5.3 above depicts the number of employees employed by the
business and the results show that a majority of the organisations that took part in the
study are in the less than 20, followed by the 20 – 50, then the 50-100 and the 100- 200
range. It is shown that only 2% (n =8) were enterprises with employees that are
between the 200-500 range and 0% (n =1) for enterprises which employ above 500
employees, 17% (n=60) were enterprises which employ less than 20 people, 15%
(n=53) were firms which employ 100 – 200 people and 29% (n=101) were firms which
employ 50-100 employees and finally the largest part of the population studied were
enterprises which employ 20-50 people at 37% (n=127). From the above demographic
results it is clear that the majority of the organisations which participated in the study
102
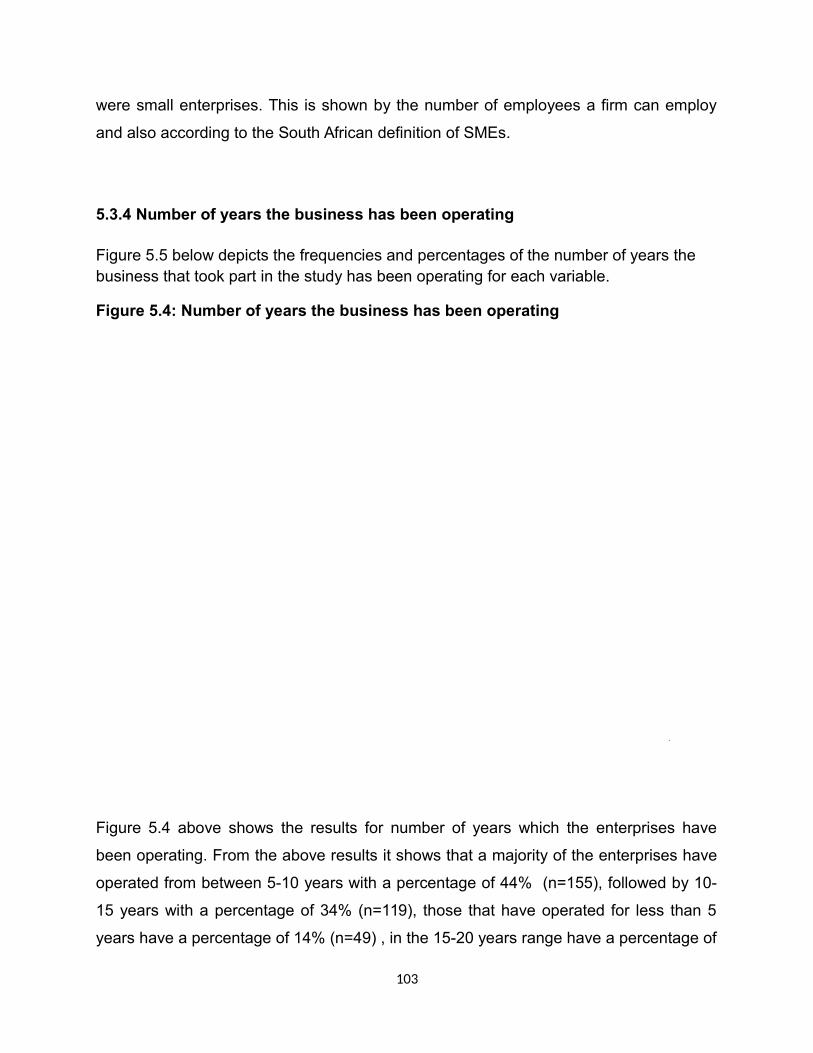
were small enterprises. This is shown by the number of employees a firm can employ
and also according to the South African definition of SMEs.
5.3.4 Number of years the business has been operating
Figure 5.5 below depicts the frequencies and percentages of the number of years the business that took part in the study has been operating for each variable.
Figure 5.4: Number of years the business has been operating
Figure 5.4 above shows the results for number of years which the enterprises have
been operating. From the above results it shows that a majority of the enterprises have
operated from between 5-10 years with a percentage of 44% (n=155), followed by 10-
15 years with a percentage of 34% (n=119), those that have operated for less than 5
years have a percentage of 14% (n=49) , in the 15-20 years range have a percentage of
103
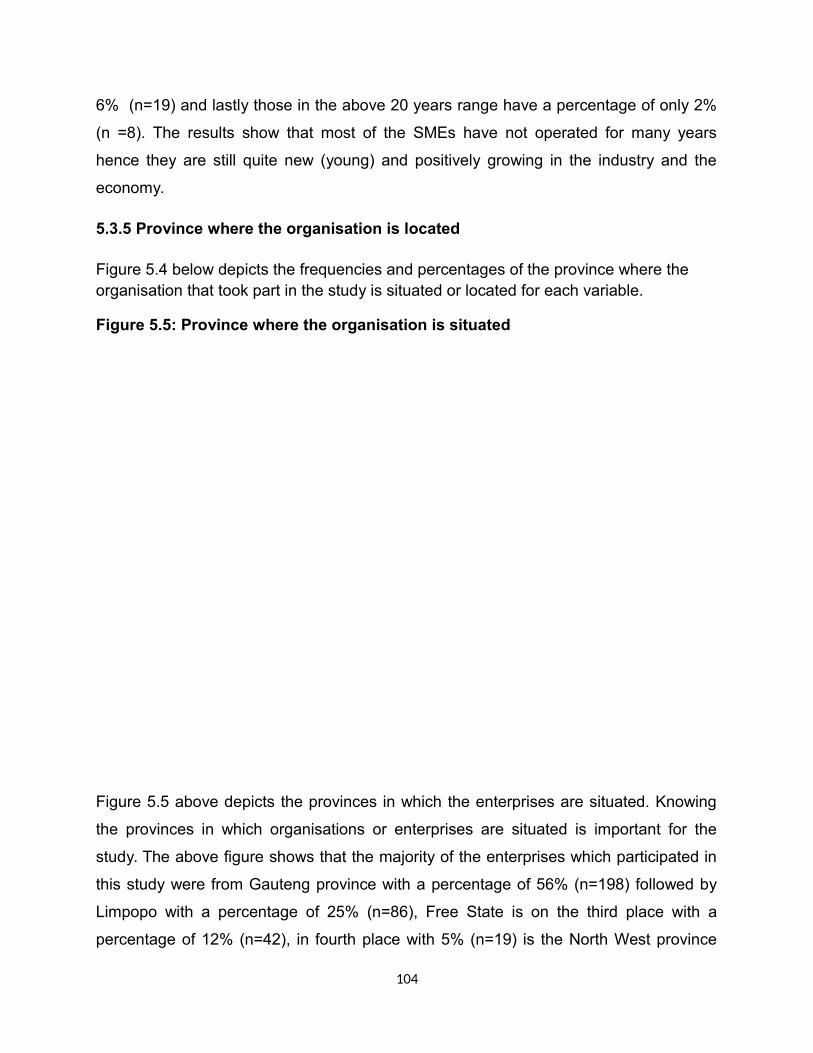
6% (n=19) and lastly those in the above 20 years range have a percentage of only 2%
(n =8). The results show that most of the SMEs have not operated for many years
hence they are still quite new (young) and positively growing in the industry and the
economy.
5.3.5 Province where the organisation is located
Figure 5.4 below depicts the frequencies and percentages of the province where the organisation that took part in the study is situated or located for each variable.
Figure 5.5: Province where the organisation is situated
Figure 5.5 above depicts the provinces in which the enterprises are situated. Knowing
the provinces in which organisations or enterprises are situated is important for the
study. The above figure shows that the majority of the enterprises which participated in
this study were from Gauteng province with a percentage of 56% (n=198) followed by
Limpopo with a percentage of 25% (n=86), Free State is on the third place with a
percentage of 12% (n=42), in fourth place with 5% (n=19) is the North West province
104
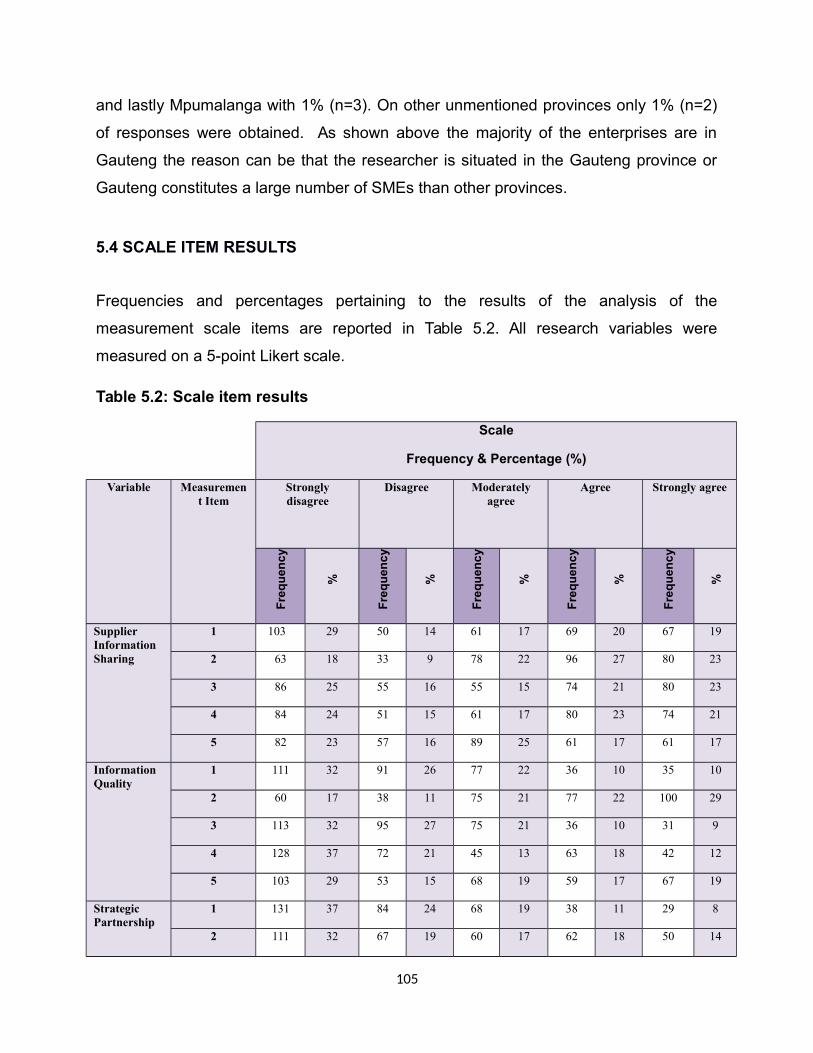
and lastly Mpumalanga with 1% (n=3). On other unmentioned provinces only 1% (n=2)
of responses were obtained. As shown above the majority of the enterprises are in
Gauteng the reason can be that the researcher is situated in the Gauteng province or
Gauteng constitutes a large number of SMEs than other provinces.
5.4 SCALE ITEM RESULTS
Frequencies and percentages pertaining to the results of the analysis of the
measurement scale items are reported in Table 5.2. All research variables were
measured on a 5-point Likert scale.
Table 5.2: Scale item results
Scale
Frequency & Percentage (%)
Variable Measurement Item
Stronglydisagree
Disagree Moderatelyagree
Agree Strongly agree
Fre
qu
enc
y
%
Fre
qu
enc
y
%
Fre
qu
enc
y
%
Fre
qu
enc
y
%
Fre
qu
enc
y
%
Supplier Information Sharing
1 103 29 50 14 61 17 69 20 67 19
2 63 18 33 9 78 22 96 27 80 23
3 86 25 55 16 55 15 74 21 80 23
4 84 24 51 15 61 17 80 23 74 21
5 82 23 57 16 89 25 61 17 61 17
Information Quality
1 111 32 91 26 77 22 36 10 35 10
2 60 17 38 11 75 21 77 22 100 29
3 113 32 95 27 75 21 36 10 31 9
4 128 37 72 21 45 13 63 18 42 12
5 103 29 53 15 68 19 59 17 67 19
Strategic Partnership
1 131 37 84 24 68 19 38 11 29 8
2 111 32 67 19 60 17 62 18 50 14
105
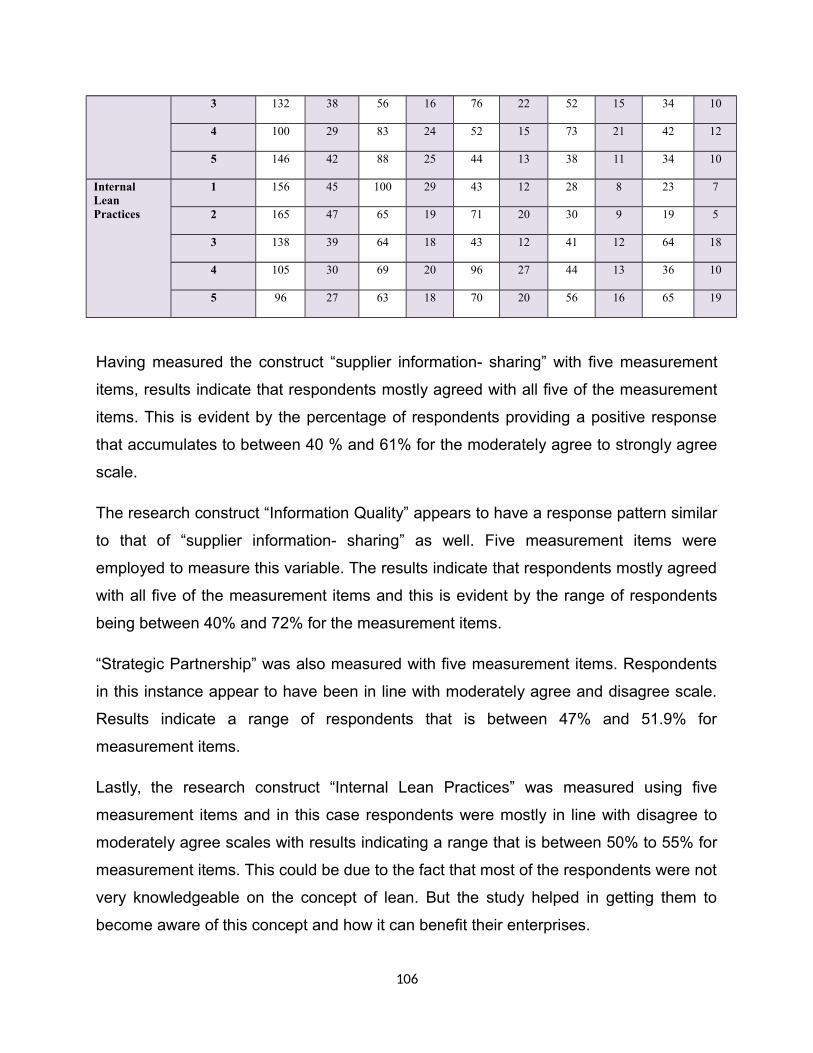
3 132 38 56 16 76 22 52 15 34 10
4 100 29 83 24 52 15 73 21 42 12
5 146 42 88 25 44 13 38 11 34 10
Internal Lean Practices
1 156 45 100 29 43 12 28 8 23 7
2 165 47 65 19 71 20 30 9 19 5
3 138 39 64 18 43 12 41 12 64 18
4 105 30 69 20 96 27 44 13 36 10
5 96 27 63 18 70 20 56 16 65 19
Having measured the construct “supplier information- sharing” with five measurement
items, results indicate that respondents mostly agreed with all five of the measurement
items. This is evident by the percentage of respondents providing a positive response
that accumulates to between 40 % and 61% for the moderately agree to strongly agree
scale.
The research construct “Information Quality” appears to have a response pattern similar
to that of “supplier information- sharing” as well. Five measurement items were
employed to measure this variable. The results indicate that respondents mostly agreed
with all five of the measurement items and this is evident by the range of respondents
being between 40% and 72% for the measurement items.
“Strategic Partnership” was also measured with five measurement items. Respondents
in this instance appear to have been in line with moderately agree and disagree scale.
Results indicate a range of respondents that is between 47% and 51.9% for
measurement items.
Lastly, the research construct “Internal Lean Practices” was measured using five
measurement items and in this case respondents were mostly in line with disagree to
moderately agree scales with results indicating a range that is between 50% to 55% for
measurement items. This could be due to the fact that most of the respondents were not
very knowledgeable on the concept of lean. But the study helped in getting them to
become aware of this concept and how it can benefit their enterprises.
106

5.5 RELIABILITY TESTS
5.5.1 Confirmatory Factor Analysis (CFA) Results
Confirmatory factor analysis was conducted in order to ascertain three psychometric
properties, which are reliability, validity, and model fit. The results of these tests are
reported in Sections 5.5.1 to 5.5.3.
5.5.1.1 Composite Reliability
One method now commonly used to check internal consistency of the measurement
model is the Composite Reliability (CR) index. It is calculated using the following
formula:
(CR): CRη= (Σλyi) 2 / [(Σλyi) 2 + (Σεi)]
Composite Reliability = (square of the summation of the factor loadings) / {(square of
the summation of the factor loadings) + (summation of error variances)}.
The resultant coefficient is similar to that of Cronbach's α. The threshold for Composite
Reliability (CR) index of 0.5 for basic research and 0.6 for exploratory research were
suggested by Nunnally (1967). The value was later adjusted to 0.7 by Nunnally (1978)
and is also recommended by Hair et al. (2006).
5.5.1.2 Average Value Extracted (AVE)
The average variance extracted estimate reflects the overall amount of variance in the
indicators accounted for by the latent construct. Higher values for the variance extracted
107

estimate (greater than 0.50) reveal the indicators well represent the latent construct.
The formula below is used to calculate Average Variance Extracted (AVE):
Vη = Σλyi2 / (Σλyi2+Σεi)
AVE = {(summation of the squared of factor loadings) / {(summation of the squared of
factor loadings) + (summation of error variances)}
Altogether, the construct reliabilities and the average variance extracted estimates
suggest the scales are internally consistent. Below in table 5.3 are the results.
5.5.1.3 Scale Accuracy Analysis
Three methods where used to test for accuracy and reliability. They include: Cronbach’s
alpha test (Cronbach α), Composite Reliability test (CR) and Average Value Extracted
(AVE) test these methods where used in this dissertation to check on the reliability of
the research measures. Table 5.3 below show the results of the entire three tests used
to check the research measure reliability.
Table 5.3 below depicts the scale accuracy results:
Table 5.3: Scale Accuracy Analysis
Research Construct
DescriptiveStatistics
Cronbach’sTest
CRValue
AVEValue
FactorLoading
Mean SD Item-total
value
Supplier
SIS5 2.85 1.505 .655 .826 .657
SIS4 3.28 1.390 .565 .847 .861
108
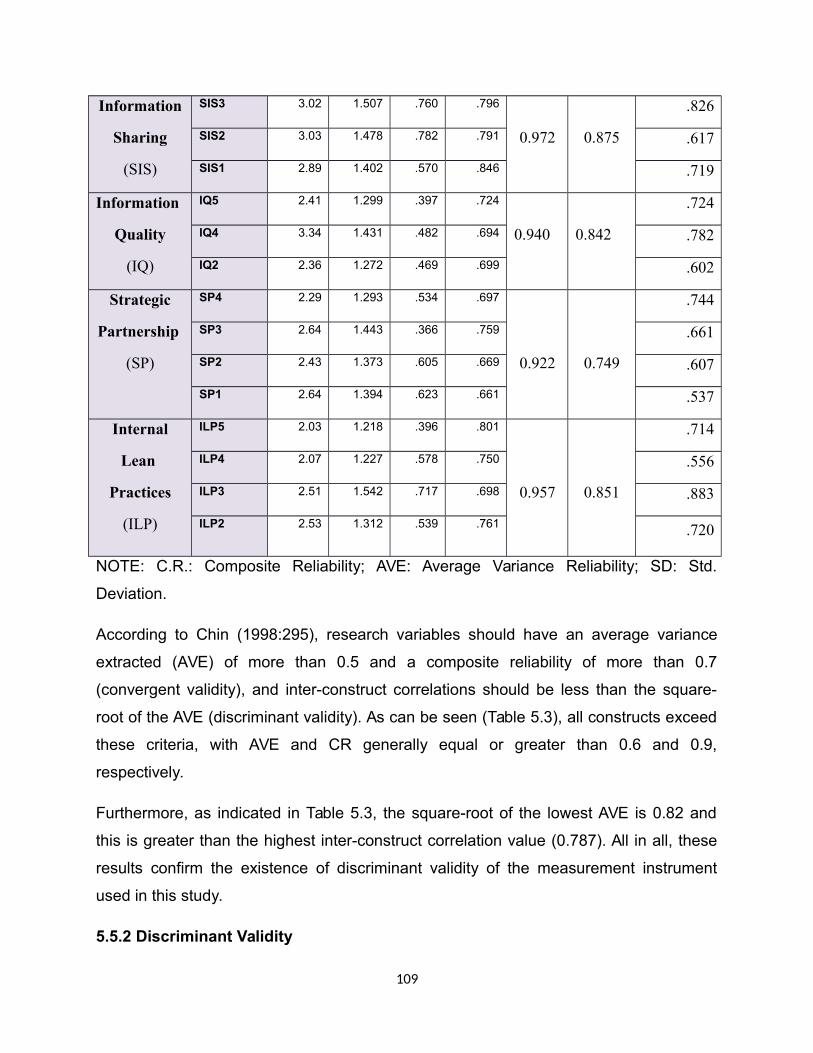
Information
Sharing
(SIS)
0.972 0.875
SIS3 3.02 1.507 .760 .796 .826
SIS2 3.03 1.478 .782 .791 .617
SIS1 2.89 1.402 .570 .846 .719
Information
Quality
(IQ)
IQ5 2.41 1.299 .397 .724
0.940 0.842
.724
IQ4 3.34 1.431 .482 .694 .782
IQ2 2.36 1.272 .469 .699 .602
Strategic
Partnership
(SP)
SP4 2.29 1.293 .534 .697
0.922 0.749
.744
SP3 2.64 1.443 .366 .759 .661
SP2 2.43 1.373 .605 .669 .607
SP1 2.64 1.394 .623 .661 .537
Internal
Lean
Practices
(ILP)
ILP5 2.03 1.218 .396 .801
0.957 0.851
.714
ILP4 2.07 1.227 .578 .750 .556
ILP3 2.51 1.542 .717 .698 .883
ILP2 2.53 1.312 .539 .761 .720
NOTE: C.R.: Composite Reliability; AVE: Average Variance Reliability; SD: Std.
Deviation.
According to Chin (1998:295), research variables should have an average variance
extracted (AVE) of more than 0.5 and a composite reliability of more than 0.7
(convergent validity), and inter-construct correlations should be less than the square-
root of the AVE (discriminant validity). As can be seen (Table 5.3), all constructs exceed
these criteria, with AVE and CR generally equal or greater than 0.6 and 0.9,
respectively.
Furthermore, as indicated in Table 5.3, the square-root of the lowest AVE is 0.82 and
this is greater than the highest inter-construct correlation value (0.787). All in all, these
results confirm the existence of discriminant validity of the measurement instrument
used in this study.
5.5.2 Discriminant Validity
109

One of the methods used to check the discriminant validity of the research constructs is
the evaluation of whether the correlations among latent constructs are less than 1.0. As
indicated in the Table 5.4 below, the inter-correlation values for all paired latent
variables are less than 1.0, indicating the existence of discriminant validity (Bagozzi & Yi
1988:74-94; Nunnally & Bernstein 1994:67). The correlation coefficient values obtained
in this study are reported in table 5.4.
Table 5.4: Correlations between Constructs
Research ConstructConstruct Correlation
SIS IQ SP ILP
Supplier Information- Sharing (SIS) 1
Information Quality (IQ) 0.702 1
Strategic Partnership (SP) 0.645 0.692 1
Internal Lean Practices (ILP) 0.591 0.645 0.725 1
NOTE: Significance level: All were significant at level <0.001
5.5.2.1 Confirmatory Factor Analysis (CFA) Model
The CFA model below shows that Supplier Information- Sharing (SIS) has a relationship
with Information Quality (IQ), Strategic Partnership (SP) and Internal Lean Practices
(ILP). This model also shows that all the variables have an interlinking relationship with
each other, as shown below: SIS ↔ IQ, SIS ↔ SP, SIS ↔ ILP, IQ ↔ SP, IQ ↔ ILP
and SP ↔ ILP
110
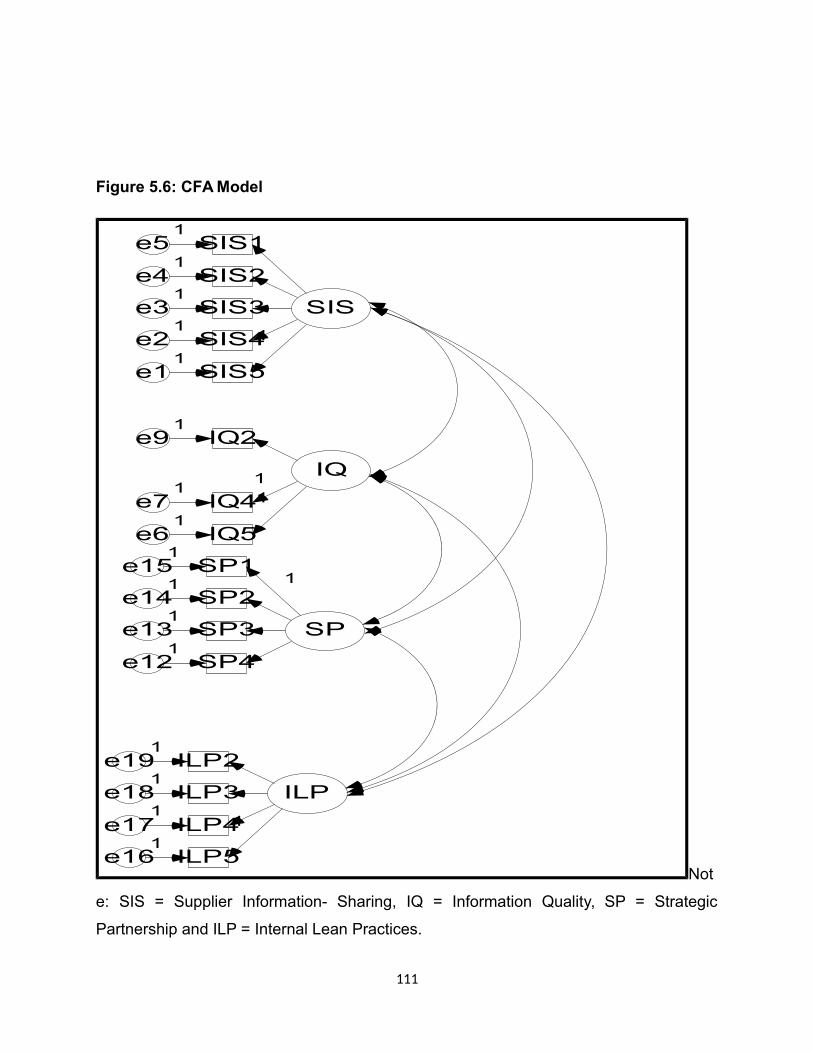
Figure 5.6: CFA Model
SIS
IQ
SP
ILP
SIS5e1
1
1SIS4e2
1SIS3e3
1SIS2e4
1SIS1e5
1
IQ5e6
1
1IQ4e7
11
IQ2e91
SP4e121
SP3e131
SP2e141
SP1e151
1
ILP5e16
1
1ILP4e17
1ILP3e18
1ILP2e19
1
Not
e: SIS = Supplier Information- Sharing, IQ = Information Quality, SP = Strategic
Partnership and ILP = Internal Lean Practices.
111
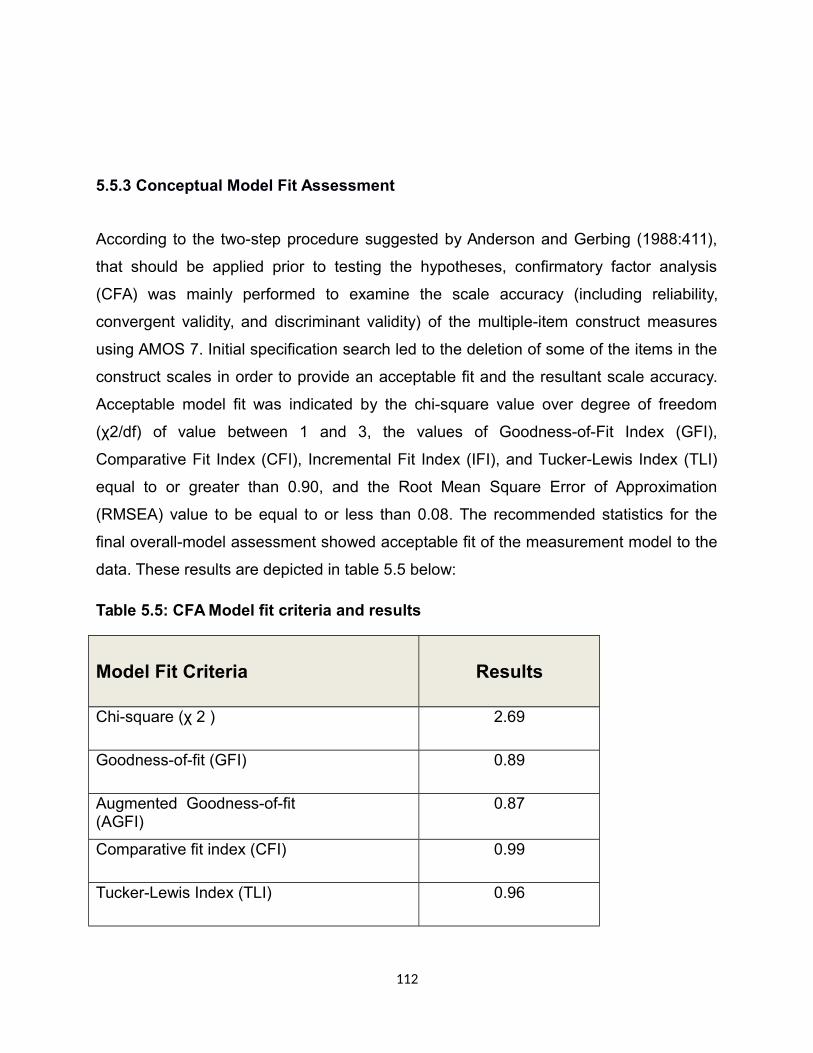
5.5.3 Conceptual Model Fit Assessment
According to the two-step procedure suggested by Anderson and Gerbing (1988:411),
that should be applied prior to testing the hypotheses, confirmatory factor analysis
(CFA) was mainly performed to examine the scale accuracy (including reliability,
convergent validity, and discriminant validity) of the multiple-item construct measures
using AMOS 7. Initial specification search led to the deletion of some of the items in the
construct scales in order to provide an acceptable fit and the resultant scale accuracy.
Acceptable model fit was indicated by the chi-square value over degree of freedom
(χ2/df) of value between 1 and 3, the values of Goodness-of-Fit Index (GFI),
Comparative Fit Index (CFI), Incremental Fit Index (IFI), and Tucker-Lewis Index (TLI)
equal to or greater than 0.90, and the Root Mean Square Error of Approximation
(RMSEA) value to be equal to or less than 0.08. The recommended statistics for the
final overall-model assessment showed acceptable fit of the measurement model to the
data. These results are depicted in table 5.5 below:
Table 5.5: CFA Model fit criteria and results
Model Fit Criteria Results
Chi-square (χ 2 ) 2.69
Goodness-of-fit (GFI) 0.89
Augmented Goodness-of-fit(AGFI)
0.87
Comparative fit index (CFI) 0.99
Tucker-Lewis Index (TLI) 0.96
112
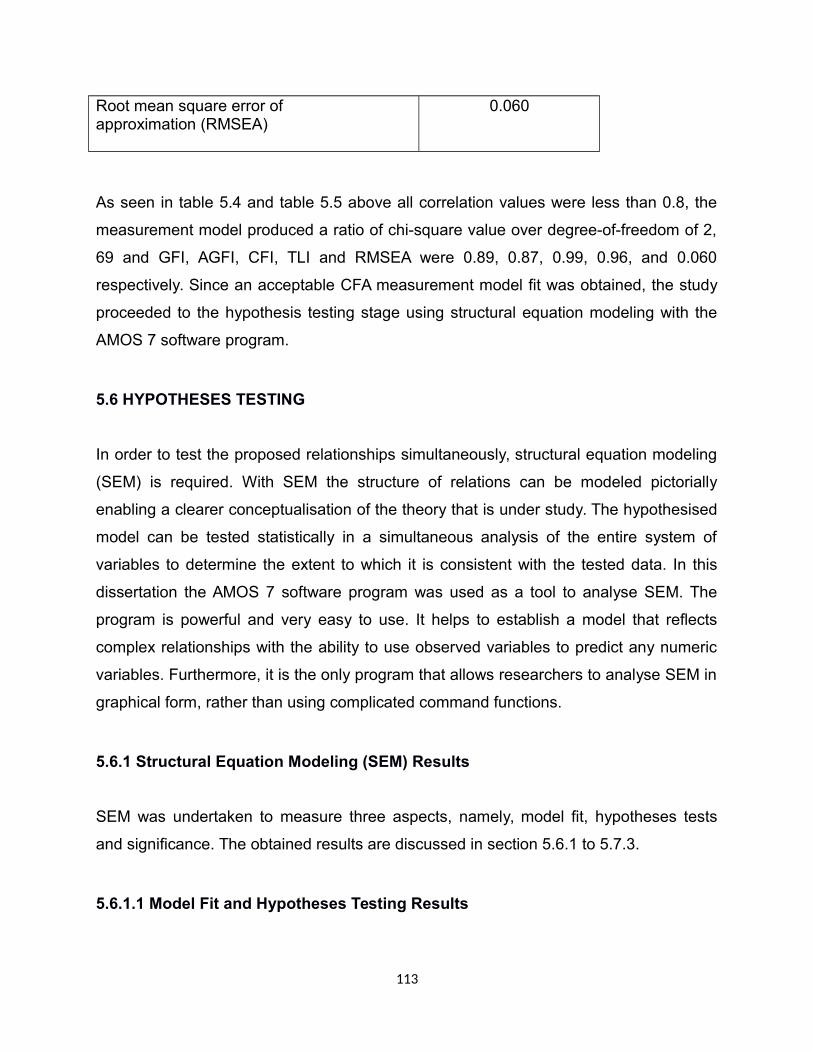
Root mean square error ofapproximation (RMSEA)
0.060
As seen in table 5.4 and table 5.5 above all correlation values were less than 0.8, the
measurement model produced a ratio of chi-square value over degree-of-freedom of 2,
69 and GFI, AGFI, CFI, TLI and RMSEA were 0.89, 0.87, 0.99, 0.96, and 0.060
respectively. Since an acceptable CFA measurement model fit was obtained, the study
proceeded to the hypothesis testing stage using structural equation modeling with the
AMOS 7 software program.
5.6 HYPOTHESES TESTING
In order to test the proposed relationships simultaneously, structural equation modeling
(SEM) is required. With SEM the structure of relations can be modeled pictorially
enabling a clearer conceptualisation of the theory that is under study. The hypothesised
model can be tested statistically in a simultaneous analysis of the entire system of
variables to determine the extent to which it is consistent with the tested data. In this
dissertation the AMOS 7 software program was used as a tool to analyse SEM. The
program is powerful and very easy to use. It helps to establish a model that reflects
complex relationships with the ability to use observed variables to predict any numeric
variables. Furthermore, it is the only program that allows researchers to analyse SEM in
graphical form, rather than using complicated command functions.
5.6.1 Structural Equation Modeling (SEM) Results
SEM was undertaken to measure three aspects, namely, model fit, hypotheses tests
and significance. The obtained results are discussed in section 5.6.1 to 5.7.3.
5.6.1.1 Model Fit and Hypotheses Testing Results
113

The assessment of the proposed conceptual model proceeded using the same data set.
The ratio of chi-square over degree-of-freedom was 2.89. This value is less than the
recommended threshold of less than 3.0 and therefore, it confirms the model fit.
Additionally GFI, AGFI, CFI, TLI, and RMSEA values were 0.89, 0.87, 0.98, 0.96, and
0.065. These results are depicted in table 5.6 below:
Table 5.6: SEM Model fit criteria and results
Model Fit Criteria Results
Chi-square (χ 2 ) 2.89
Goodness-of-fit (GFI) 0.89
Augmented Goodness-of-fit(AGFI)
0.87
Comparative fit index (CFI) 0.98
Tucker-Lewis Index (TLI) 0.96
Root mean square error ofapproximation (RMSEA)
0.065
All these model fit measures were above recommended marginally accepted threshold
of greater than 0.8 for GFI, AGFI, CFI, TLI and less than 0.8 for RMSEA, which
suggested that the proposed conceptual model converged well and could be a plausible
representation of the underlying empirical data structure collected in South Africa. After
finding that the model fit is acceptable the study proceeded to test the research
hypotheses.
The corresponding coefficients of the research hypotheses that posited the existence of
positive relationships between the predictor variables supplier information- sharing and
information quality, the mediator variable strategic partnership and outcome internal
lean practices; consequences was then observed. This can be seen in figure 5.7.
114

5.6.1.2 SEM Conceptual Model Fit Assessments
The following section presents SEM results. It starts by establishing an acceptable
model fit using the same indices as in CFA. These are discussed in detail below and the
results are shown in Table 5.5. Figure 5.7 below depicts the SEM model which states
the correlation relationships.
Figure 5.7: SEM Model
Figure 5.7 is the Structural Equation Model (SEM); this model shows the relationship
between the variables taking into account some unobserved models. According to the
model, the predictor variables; Supplier Information- Sharing (SIS) and Information
Quality (IQ) have a relationship with the mediator variable; Strategic Partnership (SP)
and Strategic Partnership (SP) has a direct link relationship to the outcome variable;
115

Internal Lean Practices (ILP). The model shows the direct link relationships between the
variables as depicted below: SIS → SP, IQ → SP and SP → ILP.
5.6.1.3 Hypothesis Testing Results
For the hypothesis testing results all hypotheses coefficients were positive at a
significant level of p < 0.01. The corresponding coefficients of the research hypotheses
that posited the existence of positive relationships between the two predicting variables
Supplier Information Sharing; Information Quality and the mediator Strategic
Partnership as well as the outcome variable Internal Lean Practices. The consequential
results were then observed. Table 5.7 tabulates these results.
Table 5.7: Results of Structural Equation Model Analysis
ProposedHypothesis
Relationship HypothesisFactor
LoadingP Value
Rejected / Supported
SIS SP H1 0.419 *** Supported
IQ SP H2 0.803 *** Supported
SP ILP H3 0.851 *** Supported
Note: SIS = Supplier Information Sharing, IQ = Information Quality, SP = Strategic
Partnership and ILP = Internal Lean Practices.
The results above in table 5.7 indicate that there is a positive relationship between SIS
and SP as well as IQ and SP. SP and ILP also have a positive relationship therefore all
the relationships are supported and significant. The results provide support for the
proposed positive relationships between the three relationships (i.e. H1, H2 and H3).
Hence, the results depicted in Table 5.7, indicates that all of the posited relationships
are statistically significant as none of them produced a negative result. The regression
paths are also significant at three stars (*** indicates that p <.001). These paths can be
interpreted just like a normal linear regression (Schumacker & Lomax 2004: 5).
116
5.7 DISCUSSION OF THE RESULTS OF HYPOTHESES TESTS
The present study aimed to examine the relationship between information- sharing,
information quality, strategic partnership and internal lean practices among the SMEs in
South Africa. The purpose of the study was to determine the relationship between
Supplier Information- Sharing and Information Quality on Strategic Partnerships and
Internal Lean Practices among SME’s in South Africa. To test the proposed hypotheses,
data were collected from SME’s in South Africa. The empirical results supported all of
the three posited research hypotheses in a significant way. As seen in Table 5.7 the
results show that all hypotheses were significant at <0.001.
5.7.1 The Influence of Supplier Information Sharing on Strategic Partnership
According to the results and the posited relationship:
H1: There is a positive relationship between supplier information- sharing and strategic
partnership. This relationship is supported as it was greater than the required significant
rate of <0.001. So the result shows a positive relationship between supplier information-
sharing and strategic partnership at 0,419. This implies that an improvement in the level
of information shared among supply chain partners may stimulate their level of
willingness and openess to sharng information in their partnerships. This study
supported and accepted the stated hypothesis (H1). This is due to the fact that a
moderate and positive significant relationship was observed between information
sharing and strategic partnership. Information- sharing is essential to the trust-building
process as the sharing of information enables each firm to understand each other's
routines better, and to develop conflict resolution mechanisms (Kwon, Suh 2004:4-14
;Nyaga, Whipple & Lynch 2010:101-114).
These results further imply that information sharing may increase or improve strategic
partnerships.
117
5.7.2 The Influence of Information Quality on Strategic Partnership
According to the results and the posited relationship:
H2: There is a positive relationship between information quality and strategic
partnership. This relationship is also supported as it was greater than the required
significant rate of <0.001. This relationship was supported at a significant rate of 0.803.
This finding illustrates that an improvement in the level of information quality shared
among supply chain partners may motivate supply chain partners to hieghten their level
of willingness and openess to sharing information that could further strengthen their
partnerships. This study has thus supported and accepted the stated hypothesis (H2).
This is due to the fact that a positive and strong significant relationship was observed
between information quality and strategic partnership. Inter-organisational cooperation
increases the need to share confidential information (Hallikas, Virolainen & Tuominen
2002:5553). Only when firms share vital and often proprietary decision making
information, can trust be established (Fawcett, Osterhaus, Magnan, Brau & McCarter
2007:358).
These results further imply that information quality may strongly improve strategic
partnerships.
5.7.3 The Influence of Strategic Partnership on Internal Lean Practices
According to the results and the posited relationship:
H3: There is a positive relationship between strategic partnership and internal lean
practices. This relationship is also supported as it was greater than the required
significant rate of <0.001. This relationship was supported at a significant rate of 0.851.
The findings imply an influence on strategic partnership by internal lean practices does
indeed exist. Supply chain partners may improve their internal lean practices through
118

the benefits that can be derived from strategic partnerships. This study strongly
supported and accepted the stated hypothesis (H3). This is due to the fact that a strong
positive significant relationship was observed between strategic partnership and internal
lean practices. Close cooperation between companies and their suppliers can be a win-
win situation for everyone, in the quest to achieve leanness (Krajewski, Ritzman &
Malhotra 2010: 318). These results further imply that strategic partnerships may
positively improve the enterprise’s internal lean practices.
By implication these findings indicate that information sharing has a strong influence on
strategic partnership. Information quality also has a strong influence on strategic
partnership and in turn strategic partnership has a strong influence on internal lean
practices among these organisations. This indicates that the level of information shared
and the quality of the information that is shared within the supply chains of these
organisations has a positive effect on the strength of their partnerships as well as on the
organisation’s internal practices.
5.8 RESULTANT CONCEPTUAL MODEL
Integration of all the findings of the study resulted in the conceptual research model
illustrated in Figure 5.8.
Figure 5.8: Conceptual Research Model
119

The conceptual research model shows the strength of the relationships that exist
between each dimension of all the three antecedents and the outcome variable (Internal
Lean Practices). Supplier information sharing has a moderate but significant association
(r = 0.419; p<0.01) with strategic partnership. The model also indicates that information
quality has a strong positive and significant relationship (r = 0.803; p<0.01) with
strategic partnership. Another result reported in the conceptual model is that strategic
partnership has a strong positive and significant relationship (r = 0.851; p<0.01) internal
lean practices.
In comparing the strengths of the factors relative to each other, the conceptual model
shows that information quality exerts a higher influence (r = 0.805) on strategic
partnerships than supplier information sharing (r = 0.419). The model further indicates
that strategic partnership has a strong influence (r = 0.851) on internal lean practices.
Based on these research findings, research implications are discussed and future
research directions suggested in the chapter that follows.
5.9 CONCLUSION
120

This chapter began with an introduction followed by a discussion on data screening.
This was done to ensure that collected data is cleaned before performing further
statistical analysis. Descriptive analysis results were then provided followed by
discussion on the scale item results. These are the results pertaining to the analysis of
the measurement scale items for all the research variables. Reliability tests where then
undertaken making use of CFA, that was used to test reliability, validity and model fit.
This was then followed by hypotheses testing. SEM was used to test the proposed
relationships simultaneously. SEM measures the model fit, hypothesis tests and
significance. Lastly a discussion of results of hypotheses where discussed individually
for H1, H2 and H3 and the resultant conceptual research presented and discussed
followed by the conclusion.
CHAPTER SIX
CONCLUSIONS AND RECOMMENDATIONS
6.1 INTRODUCTION
Chapter five examined the results of the current study. Chapter six will present a
conclusion for the study that constitutes this dissertation and drawn from the research
findings. It will also provide the implications of the research findings. The chapter also
discusses suggestions for directions of future research taking into consideration the
limitations of this study. Lastly an overall conclusion and contribution of this dissertation
to academics will be presented followed by a conclusion to the chapter.
6.2. REVIEW OF THE STUDY
The purpose of the study was to determine the relationship between Supplier
Information- Sharing and Information Quality on Strategic Partnerships and Internal
Lean Practices among Small and Medium-sized Enterprises in South Africa. The
121

dissertation of the study was divided into six chapters. Chapter one introduced the study
by discussing the research background., it provided an explanation of the background of
the problem, purpose, research objectives, justification, scope and the significance of
the study. In the second chapter, a review of literature related to the context of study
(SMEs) was conducted. It also explained what is known about these organisations and
their supply chain practises as well as how supply chain relationships are managed by
these organisations. Chapter three provided an extensive literature review focusing on
factors of the study, namely information sharing, information quality, strategic
partnership and internal lean practices; theories implemented to ground the study as
well as the development of the identified hypotheses drawn from the conceptual
framework of the research were also discussed. Chapter four discussed literature
related to the research methodology and design that was implemented in the study.
Chapter five dealt with all aspects related to the data analysis and interpretation of the
research findings. Chapter six provides overall conclusions of each aspect and element
discussed throughout the study and suggested some recommendations as well as
highlighted the limitations of the study and the implications for further future research.
6.3 CONCLUSIONS OF THE STUDY
The current research study was primarily concerned with investigating the relationship
between information- sharing, information quality, strategic partnership and internal lean
practices among SMEs in South Africa.
Hence this study concluded that, despite the extent and level of information shared as
well as its transparency; as indicated within the responses to the questions in the
questionnaire of this study, the findings showed that significant information distortion still
existed within the information shared. This finding supports the view that supplier
information- sharing (SIS) alone is not sufficient and that there is a need for other
factors to be considered in order to strengthen and encourage this phenomenon within
the SMEs sector. This suggests that this factor, of information- sharing, is only an
enabler rather than a driver of supply chain performance, and should be implemented in
combination with other socio-technical factors (Kate Bailey & Mark Francis 2008:10).
122
The ability to provide accurate information during a transaction indicates that the partner
is committed to a successful transaction (Nikolaou, Ibrahim & van Heck 2013: 989). The
level of information quality has the ability to provide a good foundation for building
strong relationships that can be beneficial to both parties. Improved information quality
is expected to reduce the uncertainty and risk because the focal organisation is able to
then conduct more extensive and elaborate monitoring making use of that information.
Receiving high quality information indicates that the partner can measure the
performance of its internal processes and provide transparency (Nikolaou, Ibrahim &
van Heck 2013: 989). According to these authors such level of transparency can enable
the focal organisation to decide whether partner performance under those particular
circumstances is acceptable or not. In accordance with this factor, improved information
quality (IQ) can be expected to reduce uncertainties and any ambiguities that may exist
regarding business partner performance and inherently decrease performance-risk.
Hence information quality is important to these business organisations as supported by
the results and it is important in maintaining good relationships that can yield benefits to
all the parties involved.
Previous studies support the relationship between lean practices and quality
performance (Shah et al 2008:471; Sunder 2013:153; Vinodh & Joy 2012:1598). Lean
management comprises a set of operating practices that aims at reducing non value-
added activities within the organisation (Hajmohammad et al. 2013: 315). Companies in
a variety of economic sectors have adopted Lean Management (LM) in recent decades
and in many cases this has enabled them to improve their results and their
competitiveness (Moyano-Fuentes & Sacristán-Díaz 2012:551).
Strategic partnerships are known to be strategic in nature and to involve a commitment
over an extended time period that involves a sharing of information, risks and rewards
of the relationships (Ghalami 2006:14). Hence the need to evaluate carefully the partner
you choose to engage in a relationship with, but once this is done research has proven
that strategic partnerships can improve overall business performance. In this regard the
SME business sector can also yield good benefits from strategic relationships and grow
123

their businesses into the next level while also building strong supply chains that may
one day become world class.
6.4 IMPLICATIONS OF THE STUDY
The current study attempted to undertake a research in an often most neglected context
but yet an important sector of the South African economy. Therefore, the findings of this
empirical study are expected to provide fruitful implications for both practitioners and
academicians. The implications on the academic front are that a contribution is made to
the existing literature on the SME sector with regard to the relationship between
information- sharing, information quality, strategic partnership and internal lean
practices among these organisations in South Africa. The study should hopefully also
inspire future research on the topic in order to further increase the knowledge on this
topic.
On the practitioners’ side, the current study submits that managers in the SME supply
chain sector can benefit from the implications of the research findings mainly in the
following ways:
In today’s competitive environment, companies are forced to cooperate closely with
their suppliers and customers in order to meet various challenges, such as the
requirements of low costs, high quality, better delivery, flexibility, customer service,
innovation, and to do this while responding to a rapidly changing environment (Zhao et
al. 2011:27). The findings indicate the importance of forming strategic partnerships
while doing business in order to create an effective and efficient supply chain that will
result in yielding good benefits for both parties involved in the relationship, as well as
providing seamless service to the customers. Creating these strategic relationships that
are based on sharing of quality information can indeed lead to improved internal
practices that are characterised by leanness within the business. Hence the current
research submits that more particular attention should be accorded to information
quality within strategic partnerships as this can lead to better performance in internal
lean practices over and above other benefits.
124

6.5 LIMITATIONS OF THE STUDY
Although this study is set to make important contributions to both theoretical
development and to the provision of empirical evidence on the influence of supplier
information-sharing and information quality on strategic partnerships and internal lean
practices among Small and Medium Enterprises’ (SMEs) in South Africa. It is not
without its limitations which may merit future research. Some of the limitations
encountered by the researcher during the study are briefly stated below:
The respondent’s where reluctant to answer questions asked by unknown
interviewers about things they consider to be private about their businesses; Due to some of the respondent’s being busy, they did not want take the time to
answer the questionnaire; Respondents tried to help by giving pleasant answers even though they were
not entirely honest; Some respondents were unable to answer because they could not remember or
never gave a thought to what they do and why;
The study is confined to the respondents’ in the said province therefore the
findings will only be based on these respondents and cannot be generalised to
the whole of South Africa;
Cost and time constraints also posed a problem; and
Lastly some of the respondents in the sector being studied were not very
knowledgeable on the topic.
Although this study makes significant contributions to both academia and practice and
in spite of the positive results achieved, there are some limitations which open up other
avenues for further research. The data were gathered from the SME sector in South
Africa in only a few provinces. The results would be more informative if data from all the
provinces are collected and compared. Future studies might consider collecting data
from all the provinces across South Africa, for further empirical investigation.
Also, while this study focused on South Africa, extending this study to other African
countries is also another possible future research direction that might enable
125

comparison of results with the current study findings and create a different point of view.
Another factor would be to increase the sample size while replicating this study. Overall,
these suggested future studies stand to provide increased insights and to significantly
contribute new knowledge to the existing body of literature on the relationship between
information- sharing, information quality, strategic partnership and internal lean
practices among organisations in the SME sector in South Africa and other African
countries. Based on these various limitations of the study conducted that have been
discussed, recommendations for future research can therefore be made.
6.6 RECOMMENDATIONS
With the growing importance of relationship commitment and recognition of different
types of partnerships through supply chain integration, over the past decade it is
essential to improve our understanding of these constructs and their associated
interrelationships (Zhao et al. 2011: 29). The findings of this study contributed
significantly to the existing knowledge base regarding the relationship of the variables of
study and the views of the SME business owners and managers. However, specific
aspects regarding SME supply chains that have emerged from this study need further
exploration and investigation. An example would be supplier information- sharing and its
relationship to strategic partnership.
It is therefore recommended that the current study be replicated using a larger sample
group and separated into focus groups according to demographic variables, such as
nature of the business, number of years in the business and location of the business
etc. Such a study would allow for the comparison of different SME groupings’
perceptions of the relationship between information- sharing, information quality,
strategic partnership and internal lean practices among organisations in the SME sector.
It would further give more insight into how these organisations run or manage their
supply chains.
126

6.7 CONCLUSION
The study has proven to be beneficial in developing a different view of insightful
knowledge that can be used to supplement the understanding of the topic that has been
studied. This chapter addressed through discussion, the conclusions of this study as
well as the implications, the limitations of the study were also discussed and lastly also
provided some recommendations for further future research to be considered. The
chapter then ends with a conclusion.
6.8. BIBLIOGRAPHY
AAKER, D.A. 2007. Marketing Research. 9th. Ed. New York: John Wiley & Sons.
ALHOURANI, F & SAXENA, U. 2014. Supply Chain Management Practices in US
Industrial SMEs. International Journal of Business Research 14(2).
ANDERSON, J. C & GERBING, D. W. 1988. Structural equation modelling in practice: A
review and recommended two-step approach. Psychological bulletin 103(3): 411.
AREND, R. J & WISNER, J. D. 2005. Small business and supply chain management: Is
There a Fit? Journal of Business Venturing 20 pp 403–436.
ATKINSON, D., NTEMA, L., De GOUVEIA, M. P. A & VENTER, A. 2012. Review of the
efficiency and effectiveness of past and ongoing SME development initiatives in the
Free State province. Report to the I.L.O. (Online) Available at
<www.ilo.org/wcmsp5/groups/public/---africa/---ro-addis_ababa/> [Accessed:
11/03/2014].
BABBIE, E., MOUTON, J., VORSTER, P. & PROZESKY, B. 2011. The practice of social
research. 12th Ed. Cape Town: Oxford University Press.
BAGOZZI, R. P & YI, Y. 1988. On the evaluation of structural equation models. Journal
of the academy of marketing science 16(1): 74-94.
127

BAILEY, K & FRANCIS, M. 2008. Managing information flows for improved value chain
performance. Int. J. Production Economics 111: 2–12
BALLOU, D.P & PAZER, H.L. 1985. Modeling data and process quality in multi-input,
multi-output information systems. Management Science 31 (2): 150–162.
BAYOU, M. E & De KORVIN, A. 2008. Measuring the leanness of manufacturing
systems—a case study of Ford Motor Organisation and General Motors. Journal of
Engineering and Technology Management 25(4): 287-304.
BERNDT, A & PETZER, D. 2013. Marketing research. Cape Town: Pearson Education
South Africa.
BERRY, L. L. 1995. Relationship marketing of services—growing interest, emerging
perspectives. Journal of the Academy of marketing science 23(4): 236-245.
BERRY, A.L, Von BLOTTNITZ, M., CASSIM, R., KESPER, A., RAJARATAM, B & van
SEVENTER D. E. 2002. The Economics of SMMES in South Africa. (Online) Available
at < http://www.tips.org.za/files/506.pdf.> [Accessed: 13/02/2014].
BHASIN, S. 2011. Measuring the Leanness of an organisation. International journal of
lean six sigma 2(1): 55-74.
BHASIN, S. 2012. Performance of Lean in large organisations. Journal of
Manufacturing Systems 31: 349– 357.
BICHENO, J., HOLWEG, M., & NIESSMANN, J. 2001. Constraint batch sizing in a lean
environment. International Journal of Production Economics 73(1): 41-49.
BICKMAN, A.P & BRANNEN, J. 2009. The SAGE Handbook of Social Research
Methods. London: SAGE Publications Ltd.
BLESS, C., HIGSON-SMITH, C & KAGEE, A. 2006. Fundamentals of social research
methods: An African perspective. 4th. Ed. Cape Town: Juta and Organisation Ltd.
BLUEPRINT STRATEGY & POLICY (PTY) LTD. 2005. Promotion of Small and Medium
Enterprises in South Africa. Prepared for NEDLAC Chemicals Summit. (Online)
128
Available at
<http://www.thedti.gov.za/industrial_development/docs/fridge/SME_Support_Chemicals
_Final_Draft.pdf > [Accessed: 2/13/2014].
BODDY, D., MACBETH, D & WAGNER, B. 2000. Implementing collaboration between
organisations: an empirical study of supply chain partnering. Journal of Management
studies 37(7): 1003-1018.
BOGOPANE, L. P. 2013. A Critical Review of Pertinent Qualitative Research Processes,
Approaches, and Tools in Social Sciences. North West University, Mafikeng Campus,
North West Province, Republic of South Africa. J Soc Sci 35(3): 217-229
BOTER HAKAN, ANDERS LUNDSROM. (2005). SME Perspectives on Business
Support Services: The role of organisation size, industry and location. Journal of Small
Business and Enterprise Development Vol. 12 No. 2, pp. 244-258.
BOUTY, I. 2000. Interpersonal and interaction influences on informal resource
exchanges between R&D researchers across organisational boundaries. Academy of
Management Journal 43(1): 50-65.
BURGESS, K., SINGH, P.J & KOROGLU, R. 2006. ‘‘Supply chain management: a
structured literature review and implications for future research’’. International Journal of
Operations and Production Management Vol. 26 No. 7, pp. 703-29.
BURT, D.N., DOBLER, D.W & STARLING, S. L. 2004. World Class Supply Chain: The
Key to Supply Chain Management. 7th. Ed. Tata McGraw-Hill.
BYNE, B. M. 2001. Structural equation modeling with AMOS, EQS, and LISREL:
Comparative approaches to testing for the factorial validity of a measuring instrument.
International Journal of Testing 1(1): 55-86.
CANT, M., GERBER-NEL, C., NEL, D. & KOTZE, T. 2003. Marketing research.
Clermont: New Africa Books (Pty) Ltd.
129
CARVALHO, H & CRUZ-MACHADO, V. 2008. Integrating Lean, Agile, Resilience and
Green Paradigms in Supply Chain Management (LARG_SCM). Journal of Supply Chain
Management 27-48.
CHEN, I.J. & PAULRAJ, A. 2004b. Understanding supply chain management: critical
research and a theoretical framework. International Journal of Production Research,
42(1): 131-63.
CHEN SH, ET AL. 2005.Pases and their novel F-box effector protein Rcy1 regulate protein recycling. Mol Biol Cell 16(1):178-92
CHENG, T & WU, Y. 2005. The impact of information sharing in a two-level supply
chain with multiple retailers, Journal of the Operational Research Society 56:1159–1165.
CHENGALUR-SMITH, I., DUCHESSI, P. J & GIL-GARCIA, R. 2012. Information sharing
and business systems leveraging in supply chains: An empirical investigation of one
web-based application. Information & Management 49: 58–67.
CHILDHOUSE, P & TOWILL, D.R. 2003. Simplified material flow holds the key to supply
chain integration. OMEGA 31 (1): 17–27.
CHIN, W. W. (1998). The partial least squares approach to structural equation modeling.
Modern methods for business research 295(2): 295-336.
CHIN, W. W. 1998. Commentary: Issues and opinion on structural equation modeling.
CHIZZO, S.A. 1998. Supply chain strategies: solutions for the customer driven
enterprise. Software Magazine, Supply Chain Management Directions Supplement: 4–
9.
CHURCHILL, G.A. (JNR). 1991. Marketing research: methodological foundations. 5th
ed. United States: Saunders College.
COOLICAN, H. 1992. Research methods and statistics psychology. London: Holder &
Stoughton.
130

COX, A., & CHICKSAND, D. 2005. The Limits of Lean Management Thinking: Multiple
Retailers and Food and Farming Supply Chains. European Management Journal Vol.
23: No. 6, pp. 648–662.
COX, J. F., BLACKSTONE, J .H & SPENCER, M. S. 1995. APICS Dictionary. American
Production and Inventory Control Society. 8th. Ed. Falls Church, VA.
CRESWELL, J. 2003. Research design: Qualitative, quantitative and mixed methods
approach. 2nd. Ed. Thousand Oaks, CA: SAGE Publications 21-109.
CULLEN, J. B., JOHNSON, J. L & SAKANO, T. 2000. Success through commitment and
trust: The soft side of strategic alliance management. Journal of World Business 35(3):
223-240.
DAS, T. K & TENG, B. S. 2000. A resource-based theory of strategic alliances. Journal
of management 26(1): 31-61.
DATT, R. 1994. Jobless growth: implications of new economic policies. Indian Journal of
Industrial Relations: 407-427.
DALE, B. G., LASCELLES, D. M & LLOYD, A. 1994. Supply chain management and
development. Managing quality: 292-315.
DU PLESSIS, P.J., & ROUSSEAU, G.G 2007. Buyer behaviour. Understanding consumer psychology and marketing. (4th edn.). Cape Town: Oxford University Press.
DELONE, W.H & McLEAN, E.R. 1992. Information systems success: the quest for the
dependent variable. Information systems research 3 (1): 60–95.
De VOS, A., STRYDOM, S., FOUCHE, C. B & DELPORT, C. S. L. 2005. Research at
Grass Roots: For the Social Sciences and Human Service Professions. 3rd.Edition.
Hatfield: Van Schaik.
DIAZ, A. 2000. E-business: From demand networks to techno logistics. Supply Chain
Forum-An International Journal 1(1): 4-9.
131
DRUCKER, P. F. 1992. The new society of organisations. Harvard Business Review, 70,
95–105.
DWYER, F. R., SCHURR, P. H., & OH, S. 1987. Developing buyer–seller relationships.
Journal of Marketing 51: 11–27.
ELLINGER, A. E., TAYLOR, J. C., & DAUGHERTY, P. J. 1999. Automatic replenishment
programs and level of involvement: Performance implications. International Journal of
Logistics Management 10: 25–36.
ELLRAM, L. M & HENDRICK, T. E. 1995. Partnering characteristics: a dyadic
perspective. Journal of Business Logistics 16: 41-41.
ELMUTI, D. 2002. ‘‘The perceived impact of supply chain management on
organisational effectiveness’’. Journal of Supply Chain Management Vol. 38 No. 3, pp.
49-57.
ETUMEAHU, H. E., OKEKEKE, C. C & Kingsley, U.C. 2009. SMALL BUSINESS
PROBLEMS IN NIGERIA: A COMPARISON WITH SWEDEN. School of Management
Blekinge Institute of Technology.
FALKENA, H., ABEDIAN, I., von BLOTTNITZ, M., COOVADIA, C., DAVEL, G.,
MADUNGANDABA, J., MASILELA, E & REES, S. 2001. SMES’ Access to Finance in
South Africa – A Supply-Side Regulatory Review. (Online) Available at
<http://www.treasury.gov.za/publications/other/access%20to%20finance%20in%20south
%20africa%20-%20a%20supply-side%20regulatory%20review.pdf> [Accessed:
13/02/2014]
FAWCETT, S. E., OSTERHAUS, P., MAGNAN, G. M., BRAU, J. C & McCARTER, M. W.
2007. Information sharing and supply chain performance: the role of connectivity and
willingness. Supply Chain Management: An International Journal 12 (5): 358–368
FAWCETT, S.E., WALLIN, C., ALLRED, C & MAGNAN, G. 2009. Supply chain
information-sharing: benchmarking a proven path. Benchmarking: An International
Journal 16 (2): 222–246.
132
FELDMANN M., MRLLER S. 2003. An incentive scheme for true information providing
in supply chains, OMEGA 31 (2): 63–73.
FIALA, P. 2005. Information sharing in supply chains. Omega, 33(5):419-423.
FISHER, M. L. 1997. What is the right supply chain for your product? Harvard business
review 75:105-117.
FLYNN, B. B., HUO, B. & ZHAO, X. 2010. The impact of supply chain integration on
performance: a contingency and configuration approach. Journal of Operations
Management 28(1): 58-71.
FU, S., LEE, S. S & MATTHEW, K. O. 2005. I.T Based Knowledge Sharing and
Organisational Trust: The Development and Initial Test of a Comprehensive Model.
European Conference on Information Systems (ECIS), 1(1):1-14.
GAVIRNENI, S., KAPUSCINSKI, R & TAYUR, S. 1999. Value of information of
capacitated supply chains. Management Science 45: 16–24.
GAVIRNENI, S., KAPUSCINSKI, R., & TAYUR, S. 1996. Value of information in
capacitated supply chains. Pittsburgh: Graduate School of Industrial Administration,
Carnegie Mellon University.
GERSICK, C. J., DUTTON, J. E & BARTUNEK, J. M. 2000. Learning from academia:
The importance of relationships in professional life. Academy of Management
Journal 43(6):1026-1044.
GHALAMI, S. Z. 2006. Strategic Partnership within Supply Chain: A Pragmatic Model for
Volvo. Safety 13:14.
GHALAMI, S. Z. 2004. Strategic Partnership within Supply Chain - A Pragmatic Model
for Volvo Power Train Corporation. School of Management: Blekinge Institute of
Technology. Blekinge: Sweden.
GHOSH, A. & FEDOROWICZ, J. 2008. The role of trust in supply chain governance.
Business Process Management Journal 14 (4): 453–470.
133
GOES, J. B & PARK, S. H. 1997. Inter-organisational links and innovation: The case of
hospital services. Academy of management journal 40(3): 673-696.
GOFFIN, K., LEMKE, F. & SZWEJCZEWSKI, M. 2006. An exploratory study of ‘close’
supplier–manufacturer relationships. Journal of operations management 24(2): 189-209.
GLEICK, J. 2011. Have Meme, Will Travel. Academic Search Complete, EBSCO host
42(2): 88-106. (Online) Available at
<http://www.thebawdycloister.com/cloister/2005/11/have_meme_will_.html> [Accessed:
13/02/2014]
GOH, Dr. M. 2001. Report of the Symposium on Supply Chain Management for Small
and Medium Enterprises. Taipei, Republic of China, 11–14 December (SYP-SY4-01).
(Online) Available at <www.apo-tokyo.org/00e-books/IS-10_SupplyChain/IS-
10_SupplyChain.pdf> [Accessed: 11/03/2014]
GOODHUE, D.L. 1995. Understanding user evaluations of information systems.
Management Science 41 (12): 1827–1844.
GOODSON, R. E. 2002. Read a Plant-Fast. Harvard Business Review 80:105-113.
GOVERNMENT OF SOUTH AFRICA (GSA). 2010. Industrial Policy Action Plan (IPAP),
2010/11- 2012/13.
GOVERNMENT OF SOUTH AFRICA (GSA). 2010. New Growth Path. (Online)
Available at <http://www.info.gov.za/view/Download-FileAction?id=135748 > [Accessed:
11/03/2014]
GRAEN, G. B & UHL-BIEN, M. 1998. Relationship-based approach to leadership:
Development of Leader–Member Exchange (LMX) theory of leadership over 25 years:
Applying a multi-level multi-domain perspective. ACAD MANAGE J June 1, vol. 41 no.
3: 340-350.
GRANT, R.M. 1996. Prospering in dynamically-competitive environments:
Organisational capability as knowledge integration. Organisation Science 7 (4): 375–
387.
134

GRIFFITH, D. A., HU, M. Y & RYANS JR, J. K. 2000. Process standardisation across
intra-and inter-cultural relationships. Journal of International Business Studies 303-324.
HANCKE, B. 1998. Trust or hierarchy? Changing relationships between large and small
firms in France. Small Business Economics 11(3): 237-252.
HAIR, J. F., BLACK, W. C., BABIN, B. J & ANDERSON, R. E. 2010. Multivariate data
analysis. 7th Ed. Englewood Cliffs: Prentice Hall.
HAIR, J. F., BABIN, B. J., ANDERSON, R.E & TATHAM, R. L. 2010. Multivariate Data
Analysis. A Global Perspective. 7th Ed. New York: Pearson Prentice Hall.
HALL, J. 2008. ‘Cross-sectional survey design’, in PJ Lavrakas (ed.), Encyclopedia of
survey research methods, SAGE Publications, Inc., Thousand Oaks, CA, pp. 173-4.
HALLIKAS, J., VIROLAINEN, V. M & TUOMINEN, M. 2002. Risk analysis and
assessment in network environments: a dyadic case study, International Journal of
Production Economics 78 (1): 45–55.
HARRISON, A & HOEK, R.V .2011. Logistics Management and Strategy. 4 th Ed. Harlow:
Pearson.
HARLAND, C.M., LAMMING, R.C. & ZHENG, J. 2006. ‘‘Supply management: is it a
discipline?’’. International Journal of Operations & Production Management Vol. 26 No.
7, pp. 730-53.
HARTONO, E., LI, X., NAB, K.S & SIMPSON, J.T. 2010. The role of the quality of
shared information in inter-organisational systems use. International Journal of
Information Management 30:399-407.
HAYWARD, C. 2001. Welsh SMEs ‘uncreative’. Supply Management, 10 (January 18).
HICKS, B. J. 2007. Lean information management: Understanding and eliminating
waste. International Journal of Information Management 27:233-249.
135
HINES, P., HOLWEG, M & RICH, N. 2004. Learning to evolve: a review of contemporary
lean thinking. International Journal of Operations & Production Management 24(10):
994-1011.
HOFER, C., EROGLU, C & HOFER, A. R. 2012. The effect of lean production on
financial performance: The mediating role of inventory leanness. Int. J. Production
Economics 138: 242–253
HSU, L. L., CHIU, C. M., JASON, C. H., CHEN, C. H & LIU, C. C. 2009. The impacts of
supply chain management systems on information sharing and integrated-performance.
Human Systems Management 28:101-121. (Online) Available at
<http://en.wikibooks.org/w/index.php?
title=Research_Methods/Types_of_Research&oldid=2616361 > [Accessed: 13/04/2014]
HUANG, G. Q., LAU, S. K., & MAK, K. L. 2003. The impacts of sharing production
information on supply chain dynamics: A review of the literature. International Journal of
Production Research 41: 1483–1517.
HUMPHREY, R. H & ASHFORTH, B. E. 2000. Buyer–supplier alliances in the
automobile industry: how exit‐voice strategies influence interpersonal
relationships. Journal of Organisational Behavior 21(6): 713-730.
HVOLBY, H & TRIENEKENS, J. H. 2002. ‘‘Supply chain planning opportunities for small
and medium sized companies’’. Computers in Industry Vol. 49, pp. 3-8.
JEPPESEN, S., KOTHUIS, B. & TRAN, A. N. 2012. Corporate Social Responsibility and
Competitiveness for SMEs in Developing Countries: South Africa and Vietnam.
JARKE, M. & VASSILIOU, Y. 1997. Data warehouse quality: a review of the DWQ
project. Proceedings of the Conference on Information Quality. Cambridge, MA: 299–
313.
JARRELL, J. L. 1998. Supply chain economics. World Trade 11 (11): 58–61.
JASSAWALLA, A. R & SASHITTAL, H. C. 1999. Building collaborative cross-functional
new product teams. The Academy of Management Executive 13(3): 50-63.
136
JOHN, T. C & RILEY, D.W. 1985. ‘‘Using inventory for competitive advantage through
supply chain management’’. International Journal of Physical Distribution & Materials
Management Vol. 15, pp. 16-26.
KALE, P., SINGH, H & PERLMUTTER, H. 2000. Learning and protection of proprietary
assets in strategic alliances: Building relational capital.
KAUFMAN, A., WOOD, C. H & THEYEL, G. 2000. Collaboration and technology
linkages: a strategic supplier typology. Strategic Management Journal 21: 649–663.
KE, W & WEI, K.K. 2007. Factors affecting trading partners’ knowledge sharing: Using
the lens of transaction cost economics and socio-political theories. Electronic
Commerce Research and Applications 6: 297–308.
KIM, K & UMANATH, N. 1999. An empirical investigation of electronic integration in
supply channel relationships, in: P. De, J. De-Gross (Eds.). Proceedings of the
Twentieth International Conference on Information Systems, Association for Information
Systems. Atlanta: pp. 546–551.
KNUDSEN, M. P & SERVAIS, P. 2007. Analysing Internationalization Configurations of
SME’s: The purchaser’s perspective. Journal of Purchasing & Supply Management 13 p
137–151.
KOGUT, B & ZANDER, U. 1992. Knowledge of the firm, combinative capabilities, and
the replication of technology. Organisation Science 3 (3): 383–397.
KRAATZ, M. S. 1998. Learning by association? Inter-organisational networks and
adaptation to environmental change. Academy of Management Journal 41(6): 621-643.
KROGSTIE, L & MARTINSEN, K. 2013. Beyond Lean and Six-Sigma: Cross-
Collaborative Improvement of Tolerances and Process Variations - A Case Study.
Procedia CIRP 7: 610 – 615
KUMAR, K & VAN DISSEL, H.G. 1996. Sustainable collaboration: Managing conflict
and cooperation in inter-organisational systems. MIS Quarterly 20(3):279-299.
137

KUMAR, R. 2005. Research Methodology. A step by step guide for beginners. 2nd Ed.
London: SAGE.
KWON, I.-W.G & SUH T. 2004. Factors affecting the level of trust and commitment in
supply chain relationships. Journal of Supply Chain Management 40 (2): 4–14.
KWON, I.-W.G & SUH, T. 2005. Trust, commitment and relationships in supply chain
management; a path analysis. Supply Chain Management 10 (1): 26–33.
LALONDE, B.J. 1998. Building a supply chain relationship. Supply Chain Management
Review 2 (2): 7–8.
LARSON, R. R. 2005. Information life cycle: A model of the social aspects of digital
libraries. (Online) Available at < /http:
//www.sims.berkeley.edu/courses/is202/f98/Lecture2/index.htmS.> [Accessed:
22/05/2014]
LEE, J.N & KIM, Y.G. 1999. The effect of partnership quality on its outsourcing success:
conceptual framework and empirical validation. Journal of Management Information
Systems 15 (4): 29–61.
LEE, Y. W., STRONG, D. M., KAHN, B. K. & WANG, R. Y. 2002. AIMQ: a methodology
for information quality assessment. Information & management 40 (2): 133-146.
LEWICKI, R. J & WIETHOFF, C. 2000. Trust, trust development, and trust repair. The
handbook of conflict resolution: Theory and practice 1(1): 86-107.
LEWIS, E. 2005. ‘‘Now is SMEs’ time to compete on-demand supply chain solutions are
affordable for the small distributor’’. Industrial Distribution, September.
LEWIS, M. A. 2000. Lean production and sustainable competitive advantage.
International Journal of Operations & Production Management 20(8): 959-978.
LI, S. & LIN, B. 2006. Accessing information sharing and information quality in supply
chain management. Decision Support Systems 42 (3):1641-1656.
138
LI S., LIN B. 2006. Accessing information sharing and information quality in supply chain
management. Decision Support Systems 42: 1641–1656
LI, S., RAO, S., RAGU-NATHAN, S., RAGU-NATHAN, T. & BHANU, S. 2005.
Development and validation of a measurement instrument for studying supply chain
management. Journal of Operations Management 23(6):618-641.
LI, S., RAGU-NATHAN, B., RAGU-NATHAN, T. S., & RAO, S. S. 2006. The impact of
supply chain management practices on competitive advantage and organisational
performance. OMEGA 34: 107–124.
LIEDTKA, J. M. 1996. Collaborating across lines of business for competitive
advantage. The Academy of Management Executive 10(2): 20-34.
LINCOLN, J., AHMADJIAN, C & MASON, E. 1998. Organisational learning and
purchase-supply relations in Japan: Hitachi, Matsushita, and Toyota compared',
California Management Review, Spring, Berkeley.
LOGAN, M.S. 2000. Using Agency Theory to Design Successful Outsourcing
Relationships. International Journal of Logistics Management 11(2): 21-32.
LONDON, K.A. & KENLEY R. 2001. ‘‘An individual organisation economic supply chain
approach for the construction industry: a review’’. Construction Management and
Economics, Vol. 19, pp. 777-88.
LUMMUS, R.R., VOKURKA, R.J. & ALBER, K.L. 1998. ‘‘Strategic supply chain
planning’’. Production and Inventory Management Journal, Vol. 39 No. 3, pp. 49-58.
MAGRETTA, J. 1998. The power of virtual integration: an interview with Dell Computer’s
Michael Dell. Harvard Business Review 76 (2): 72–84
MAHEMBE, E., CHIUMYA, C. & MBEWE, P. 2011. Literature Review on Small and
Medium Enterprises’ Access to Credit and Support in South Africa: Compiled by
Underhill Corporate Solutions. Pretoria.
139

MAHESHWARI, B., KUMAR, V. & KUMAR, U. 2006. Optimizing success in supply chain
partnerships. Journal of Enterprise Information Management 19(3): 277-291.
MALEFANE, S. R. 2013. Small Medium, and Micro Enterprise and local economic-base
restructuring-a South African local government perspective. Journal of Public
Administration, 48(4): 671-690.
MALHOTRA, N. K., PETERSON, M., & KLEISER, S. B. 1999. Marketing research: A
state-of-the-art review and directions for the twenty-first century. Journal of the
Academy of Marketing Science 27(2): 160-183.
MALONE, T. W. 1988. What is coordination theory? Cambridge, Mass.: Massachusetts
Institute of Technology.
MALONI, MICHAEL, J & BENTON W. C. 1997. "Supply chain partnerships:
opportunities for operations research." European Journal of Operational
Research 101.3: 419-429.
MANATSA, P. R., MCLAREN, R. & TIM S. 2008. Information Sharing in a Supply Chain:
Using Agency Theory to Guide the Design of Incentives. Supply Chain Forum: an
International Journal, 9 (1):18-26.
MANATSA, P. R., MCLAREN, T. S & ROGERS, T. 2008. Supply Chain Forum.
International Journal, 9(1):167-182.
Massachusetts Institute of Technology and University of Warwick. 2001. Lean
Enterprise Self-Assessment Tool (LESAT) Version 1.0: 1-75
MASON-JONES, R., TOWILL, D. R. 1997. Information enrichment: designing the supply
chain for competitive advantage. Supply Chain Management 2 (4):137–148.
MARTIN, R., PATTERSON, W. 2006. Data sharing in a multi-tiered supply chain
network. Supply Chain Forum 7 (1): 82–92.
MARTINEZ-JURADO, P. J., MOVANO-FUENTES, J. 2013. Lean Management, Supply
Chain Management and Sustainability: A Literature Review, Journal of Cleaner
140

Production 1-17. (Online) Available at <http://dx.doi.org/10.1016/j.jclepro.2013.09.042 >
[Accessed: 09/03/2013]
MENTZER, J. T., MIN, S., ZACHARIA, Z. G. 2000. ”The nature of inter-firm partnering in
supply chain management”. Journal of Retailing 76 (4):549–568.
MICHNIK, J & LO, M.C. 2009. The assessment of the information quality with the aid of
multiple criteria analysis. European Journal of Operational Research 195: 850–856.
MIN, J. H & HONG, P. 2011. A co-ordination theory approach to restructuring the supply
chain: an empirical study from the focal organisation perspective. International Journal
of Production Research 49(15):4517-4541.
MOHR, J., SPECKMAN, R. 1994. “Characteristics of partnership success: partnership
attributes, communication behavior, and conflict resolution techniques”. Strategic
Management Journal Vol. 15, No. 2, pp.135-152.
MOKSHA, S. 2013. Theorizing Middle-Way Research Approach from Nagarjuna’s
Mulamad hyamaka Karika of 2nd Century AD. International Journal of Scientific
Research and Reviews 2(4): 22 – 56.
MONCZKA, R. M., PETERSEN, K. J., HANDFIELD, R. B & RAGATZ G. L. 1998.
Success actors in strategic supplier alliances: the buying organisation perspective.
Decision Science 29 (3): 5553–5577.
MOYANO-FUENTES, J & SACRISTAN-DIAZ, M. 2012. Learning on lean: a review of
thinking and research. International Journal of Operations & Production Management
32(5): 551-582.
NARASIMHAN, R., SWINK, M & KIM, S. W. 2006. Disentangling leanness and agility:
an empirical investigation. Journal of operations management 24(5): 440-457.
NATIONAL PLANNING COMMISSION. 2011. Diagnostic Report. Pretoria.
NICOLAOU, A. I., IBRAHIM, I. & van HECK, E. 2013. Information quality, trust, and risk
perceptions in electronic data exchanges. Decision Support Systems 54: 986–996.
141
NOTMAN, D. 1998. All theories great and small? Supply Management 3 (9): 34–35.
NUNNALLY, J. C., & BERNSTEIN, I. H. 1994. Psychometric theory. 3rd. Ed. New York:
McGraw-Hill.
NYAGA, G., WHIPPLE, J. & LYNCH, D. 2010. Examining supply chain relationships: do
buyer and supplier perspectives on collaborative relationships differ? Journal of
Operations Management 28 (2): 101–114.
PARKER, H. 2000. Inter-firm collaboration and the new product development
process. Industrial Management & Data Systems 100(6): 255-260.
PATNAYAKUNI, R., RAI, A. & SETH, N. 2006. Relational antecedents of information
flow integration for supply chain coordination. Journal of Management Information
Systems 23 (1): 13–49.
PENG, M. W & LUO, Y. 2000. Managerial ties and firm performance in a transition
economy: The nature of a micro-macro link. Academy of management journal 43(3):
486-501.
PEREIRA, J. V. 2009. The new supply chain’s frontier: Information management.
International Journal of Information Management 29: 372–379.
POPPENDIEK, M. 2002. Principles of Lean Thinking. Poppendieck. LLC 7666
Carnelian Lane. Eden Prairie, MN 55346 USA 952-934-7998.
PORTA, D. D & KEATING, M. 2008. Approaches and Methodologies in the social
sciences: A Pluralist Perspective. Ney York: Cambridge University Press.
PORTER, M. E. 1980. Competitive Strategy. New York: Free Press.
PORTER, M. E. 1985. Competitive Advantage. New York: Free Press.
PUNCH, K. F 2010. Developing effective research proposals. 2nd. ed. Los Angeles:
Sage
142

QUAYLE, M. 2002. Supplier development and supply chain management in small and
medium size enterprises. International Journal of Technology Management 23: 172–
188.
RESEARCH METHODS / TYPES OF RESEARCH (Online) Available at <Source:
http://en.wikibooks.org/w/index.php?oldid=2616361 >: [Accessed 7/14/2014].
ROUSSEAU, D. M., SITKIN, S. B., BURT, R. S & CAMERER, C. 1998. Not so different
after all: A cross-discipline view of trust. Academy of management review 23(3): 393-
404.
SAMBAMURTHY, V., BHARADWAJ, A & GROVER, V. 2003. Shaping agility through
digital options: Re-conceptualizing the role of information technology in contemporary
firms. MIS Quarterly 27 (2): 237.
SANTORO, F. M., BORGES, M. R. S & REZENDE, E. A. 2006. Collaboration and
knowledge sharing in network organisations. Expert Systems with Applications 31:715-
727.
SAWERS J. L., PRETORIUS, M. W & OARLEMANS, L. A. G. 2008. Safeguarding
SMEs dynamic capabilities in technology innovative SME-large organisation
partnerships in South Africa. Technovation 28: 171–182
SCHUMACKER, R. E & LOMAX, R. G. 2004. A Beginner’s Guide to Structural Equation
Modeling. 2nd.Ed. London: Lawrence Erlbaum Associates, Inc., Publishers.
SHAH, R. H & SWAMINATHAN, V. 2008. Factors influencing partner selection in
strategic alliances: the moderating role of alliance context. Strategic Management
Journal 29(5): 471-494.
SHIN, S. K., ISHMAN, M., & SANDERS, G. L. 2007. An empirical investigation of socio-
cultural factors of information sharing in China. Information & Management Volume 44:
165–174.
143

SIDO. 2011. SIDO CORPORATE STRATEGIC PLAN (2011/2012 – 2013/2014). June
2011. (Online) Available at <http://sido.go.tz/UI/corporate-plan.pdf> [Accessed:
13/02/2014].
SOMERS, T.M., GORLA, N. & WONG, B. 2010. Organisational impact of system quality,
information quality, and service quality. Journal of Strategic Information Systems 19:
207-228.
SODHI, M. S. & SON, B. G. 2009. Supply-chain partnership performance.
Transportation Research Part E: Logistics and Transportation Review 45(6): 937-945.
STEIN, T & SWEAT, J. 1998. Killer supply chains. InformationWeek 708 (9): 36–46.
STOREY, J., EMBERSON, C., GODSELL, J & HARRISON, A. 2006. ‘‘Supply chain
management: theory, practice and future challenges’’. International Journal of
Operations & Production Management Vol. 26 No. 7, pp. 754-74.
SWAMINATHAN, J. M., SADEH, N. M., & SMITH, S. F. 1997. Effect of sharing supplier
capacity information. Berkeley: Haas School of Business, University of California.
SUNDER, N. 2013. Public-Private Partnerships in the Industry of insecurity. Rhetorics of
Insecurity: Belonging and Violence in the Neoliberal Era, 153.
TALEGHANI, M. 2010. Key factors for implementing the lean manufacturing
system. Journal of American science 6(7): 287-291.
TAN, G. W. 1999. The impact of demand information sharing on supply chain network.
PhD Thesis, University of Illinois at Urbana-Champaign.
TAN, K.C. 2001. A structural equation model of new product design and development.
Decision Sciences 32 (2): 195–226.
TANG, J. T. E., SHEE, D. Y., & TANG, T. I. 2001. A conceptual model for interactive
buyer- supplier relationship in electronic commerce. International Journal of Information
Management Vol. 21: 49–68.
144
THAKKAR, J., UDYOGNAGAR, V., KANDA, A & DESHMUKH, S. G. 2008. Supply chain
management in SMEs: development of constructs and propositions. Asia Pacific
Journal of Marketing and Logistics: Vol. 20 No. 1, pp. 97-131.
THE BANKING ASSOCIATION OF SOUTH AFRICA. 2013. Small & Medium
Enterprises. (Online) Available at < http://www.banking.org.za/index.php/our-
industry/small-medium-enterprise>
TIESSEN, J. H., & LINTON, J. D. 2000. The JV dilemma: cooperating and competing in
joint ventures. Canadian Journal of Administrative Sciences/Revue Canadienne des
Sciences de l'Administration 17(3): 203-216.
TOGAR, M. S., ALAN, C. W & RAMASWAMI, S. 2002. The knowledge of coordination
for supply chain integration. Business Process Management Journal 8(3):289 -308.
TOYIN, A. I. 2012. Supply Chain Management (SCM) practices in Nigeria today: impact
on SCM performance. European Journal of Business and Social Sciences 1(6):107-115.
TREASURY BOARD OF CANADA. 2005. Framework for management of information:
The information lifecycle. (Online) Available at < /http: //www.cio-dpi.gc.ca/S.>
TULIP, S. 2000. SMEs shun supply chain integration. Supply Management 5 (13): 10.
United Nations Industrial Development Organisation (UNIDO). 2005. Working Paper No.
15 Private Sector Development: The Support Programmes of the Small and Medium
Enterprises Branch.
VACHON, S., KLASSEN, R. D & GAVRONSKI, J. 2013. Lean management and supply
management: their role in green practices and performance. Journal of Cleaner
Production 39: 312-320.
VENKATARAMAN, S & VAN de VEN, A. H. 1998. Hostile environmental jolts,
transaction set, and new business. Journal of Business Venturing 13 (3): 231–255.
VINODH, S & JOY, D. 2012. Structural equation modeling of lean manufacturing
practices. Int.J.Prod.Res. 50(6): 1598–1607.
145
WAHAB, A. N. A., MUKHTAR, M & SULAIMAN, R. 2013. A Conceptual Model of Lean
Manufacturing Dimensions. Procedia Technology 11: 1292 - 1298.
WAND, Y & WANG, R.Y. 1996. Anchoring data quality dimensions in foundations,
Communications of the ACM 39 (11): 86–95.
WANG, E. T. G., & WEI, H. L. 2007. Inter-organisational governance value creation:
Coordinating for information visibility and flexibility in supply chains. Decision Sciences,
38: 647–674.
WANG, R.Y. & STRONG, D.M. 1996. Beyond accuracy: What data quality means to
data consumers. Journal of Management Information Systems, Spring 5-33.
WILLIAM, T. R., Jr., & DIANA, C. R. 2007. Compound relationships between firms.
Journal of Marketing 71:108–123.
WILLPOWER INFORMATION. 2005. What is ‘‘information management’’? (Online)
Available at </http: //www.willpowerinfo.co.uk/S.>
WISNER, J. D. 2003. A structural equation model of supply chain management
strategies and firm performance. Journal of Business Logistics 24(1): 1-26. (Online)
Available at <http://dx.doi.org/10.1002/j.2158-1592.2003.tb00030.x >
WOMACK, J. P. 2006. A measure of lean. Manufacturing Engineer 85(4): 6–7 ISSN
0956-9944.
WOMACK, J. P & JONES, D. T. 1996. Beyond Toyota: how to root out waste and
pursue perfection. Harvard business review 74(5): 140.
WOMACK, J. P & JONES, D. T. 1996. Lean thinking: Banish waste and create wealth in
your corporation. London: Simon and Schuster ISBN 0684810352.
WOMACK, J. P., JONES, D. T & ROOS, D. 1990. The machine that changed the world.
Toronto, Canada: Collier Macmillan ISBN 0892563508.
146

WOMACK, J.P., JONES, D.T. 1996. Lean Thinking: Banish Waste and Create Wealth In
Your Corporation. New York: Simon & Schuster.
WOMACK, J. P., JONES, D. T & ROOS, D. 2007. The elements of lean production. The
machine that changed the world—how lean production revolutionized the global car
wars. Simon & Schuster UK Ltd, London, 73-227.
WONG, A., TJOSVOLD, D & ZHANG, P. 2005. Developing relationships in strategic
alliances: Commitment to quality and cooperative interdependence. Industrial Marketing
Management 34: 722– 731
WONG, Y. C & WONG, K. Y. 2011. Approaches and practices of lean manufacturing:
The case of electrical and electronics companies. African Journal of Business
Management 5(6): 2164-2174.
WOOD, D. J., & GRAY, B. 1991. Toward a comprehensive theory of collaboration. The
Journal of Applied Behavioural Science 27(2): 139-162.
YANG, T.M & MAXWELL, T.A. 2011. Information-sharing in public organisations: A
literature review of interpersonal, intra-organisational and inter-organisational success
factors. Government Information Quarterly 28:164–175.
YOUN, S. et al. 2011. Strategic supply chain partnership, environmental supply chain
management practices, and performance outcomes: an empirical study of Korean firms.
Journal of Cleaner Production, doi:10.1016/j.jclepro.2011.09.026
YU, Z. X., YAN, H & CHENG, T.C.E. 2001. Benefits of information sharing with supply
chain partnerships. Industrial Management and Data Systems 101 (3): 114–119.
YON, R. & Evans, D. 2011. “Thought Paper”: The Role of Small and Medium
Enterprises in Frontier Capital Markets #1: “What defines a Small and Medium
Enterprise?”. Network Science Center, West Point www.netscience.usma.edu
845.938.0804
147
ZHAO, X., HUOB, B., SELEND, W & YEUNGA J. H. Y. 2011. The impact of internal
integration and relationship commitment on external integration. Journal of Operations
Management 29: 17–32
ZHOU, H., & BENTON JR, W. C. 2007. Supply chain practice and information
sharing. Journal of Operations Management 25(6): 1348-1365.
ZMUD, R. 1978. Concepts, theories and techniques: an empirical investigation of the
dimensionality of the concept of information. Decision Sciences 9 (2): 187–195.
ANNEXURE 1
Vaal University of Technology
Questionnaire
The Influence of Supplier Information- Sharing and Information Quality on Strategic Partnerships and Internal Lean Practices among SMEs in South Africa.
Thank you for paying attention to this academic questionnaire. The purpose of this
questionnaire is to gather information on the influence of supplier information- sharing
and information quality on strategic partnerships and internal lean practices among
Small and Medium Enterprises’ in South Africa.
I am therefore, requesting your assistance to complete the questionnaire below. The
research is purely for academic purposes and the information obtained will be kept
confidential. It will take you approximately 5 minutes to finish the whole questionnaire.
Researcher: T.M. SIKHWARI
SECTION A
148

GENERAL INFORMATION
The section consists of questions about your organisation background. Please indicate
your answer by ticking () in the appropriate box.
A1 Please indicate your type of business
Cooperative
Sole proprietor
Close corporation
PrivateorganisationPartnership
A2 Please indicate the nature of your business
A3 Please indicate the number of people employed by the business
149
Mining/QuarryingManufacturing Retail Construction Transport Community/personal serviceTourism Finance /insurance
Less than 20
20 - 50
50-100
100- 200
200 -500
500 +

A4 Please indicate the number of years your business has been operating
A5 Please indicate the province where your organisation is located
SECTION B
Supplier Information- Sharing
Below are statements about Supplier information- sharing you can indicate the extent to which you agree or disagree with the statement by ticking the corresponding number in the 5 point scale below:
1=strongly disagree 2= disagree 3= moderately agree 4= agree 5= strongly agree
Please tick only one number for each statement
B1 Our organisation’s major suppliers share
their production capacity information
with us.
Strongly
disagree
1 2 3 4 5 Strongly
agree
B2 Our organisation shares production plans
with our major supplier.
Strongly
disagree
1 2 3 4 5 Strongly
agree
150
Less than 5
5 - 10
10 - 15
15 - 20
20 +
Gauteng LimpopoFree State North West MpumalangaOther (Specify)
...........................

B3 Our suppliers keep us fully informed
about issues that affect our business.
Strongly
disagree
1 2 3 4 5 Strongly
agree
B4 Our organisation’s major suppliers share
their available inventory capacity with us.
Strongly
disagree
1 2 3 4 5 Strongly
agree
B5 Our organisation shares strategic
information (such as marketing
information, technology development)
with suppliers / customers.
Strongly
disagree
1 2 3 4 5 Strongly
agree
SECTION C
Information Quality
Below are statements about Information quality, you are requested to indicate theextent to which you agree or disagree with the statements below by ticking the appropriate number provided:
1=strongly disagree 2= disagree 3= moderately agree 4= agree 5= strongly agree
Tick only one number for each statement.
C1 Information exchange between our
suppliers and our organisation is credible
and understandable.
Strongly
disagre
e
1 2 3 4 5 Strongly
agree
C2 Information exchange between our
suppliers and our organisation is adequate.
Strongly
disagre
e
1 2 3 4 5 Strongly
agree
C3 Information exchange between our
suppliers and our organisation is timely.
Strongly
disagre
e
1 2 3 4 5 Strongly
agree
C4 Information exchange between our
suppliers and our organisation is accurate.
Strongly
disagre
e
1 2 3 4 5 Strongly
agree
C5 Information exchange between our
suppliers and our organisation is reliable.
Strongly
disagre
e
1 2 3 4 5 Strongly
agree
151
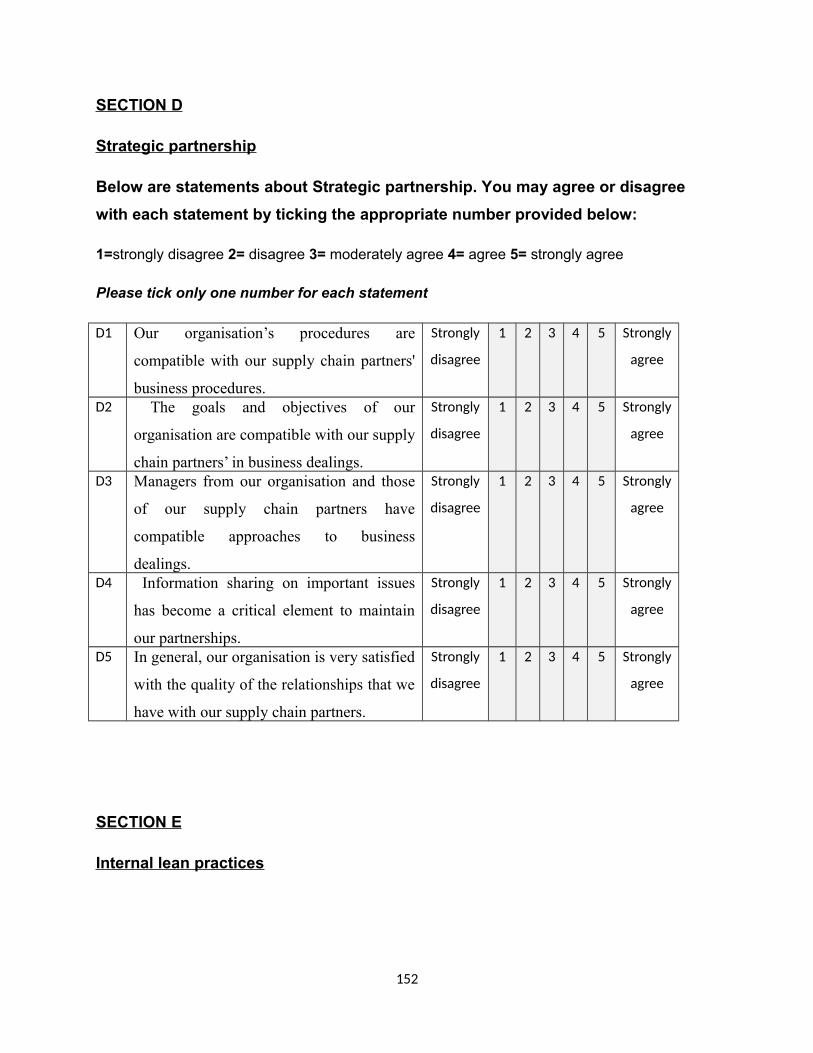
SECTION D
Strategic partnership
Below are statements about Strategic partnership. You may agree or disagree
with each statement by ticking the appropriate number provided below:
1=strongly disagree 2= disagree 3= moderately agree 4= agree 5= strongly agree
Please tick only one number for each statement
SECTION E
Internal lean practices
152
D1 Our organisation’s procedures are
compatible with our supply chain partners'
business procedures.
Strongly
disagree
1 2 3 4 5 Strongly
agree
D2 The goals and objectives of our
organisation are compatible with our supply
chain partners’ in business dealings.
Strongly
disagree
1 2 3 4 5 Strongly
agree
D3 Managers from our organisation and those
of our supply chain partners have
compatible approaches to business
dealings.
Strongly
disagree
1 2 3 4 5 Strongly
agree
D4 Information sharing on important issues
has become a critical element to maintain
our partnerships.
Strongly
disagree
1 2 3 4 5 Strongly
agree
D5 In general, our organisation is very satisfied
with the quality of the relationships that we
have with our supply chain partners.
Strongly
disagree
1 2 3 4 5 Strongly
agree
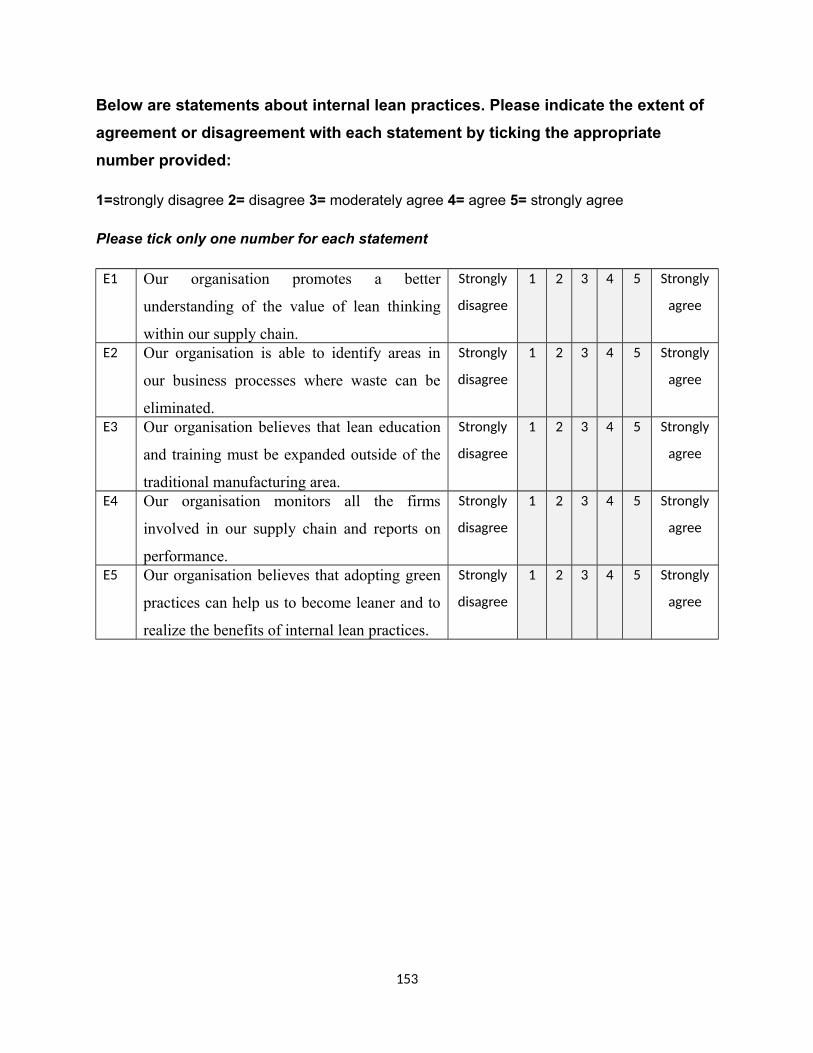
Below are statements about internal lean practices. Please indicate the extent of
agreement or disagreement with each statement by ticking the appropriate
number provided:
1=strongly disagree 2= disagree 3= moderately agree 4= agree 5= strongly agree
Please tick only one number for each statement
E1 Our organisation promotes a better
understanding of the value of lean thinking
within our supply chain.
Strongly
disagree
1 2 3 4 5 Strongly
agree
E2 Our organisation is able to identify areas in
our business processes where waste can be
eliminated.
Strongly
disagree
1 2 3 4 5 Strongly
agree
E3 Our organisation believes that lean education
and training must be expanded outside of the
traditional manufacturing area.
Strongly
disagree
1 2 3 4 5 Strongly
agree
E4 Our organisation monitors all the firms
involved in our supply chain and reports on
performance.
Strongly
disagree
1 2 3 4 5 Strongly
agree
E5 Our organisation believes that adopting green
practices can help us to become leaner and to
realize the benefits of internal lean practices.
Strongly
disagree
1 2 3 4 5 Strongly
agree
153

ANNEXURE 2
Asoka ENGLISH language editing CC
2011/065055/23
Cell no.: 0836507817
21 PONSFORD CRESCENT, ESCOMBE, KWAZULU NATAL
DECLARATION
This is to certify that I have English Language edited the dissertation:
THE INFLUENCE OF SUPPLEIR INFORMATION-SHARING AND INFORMATION QUALITY ON STRATEGIC
PARTNERSHIPS AND INTERNAL LEAN PRACTICES AMONG SME’s IN SOUTH AFRICA.
Candidate: Sikhwari T.
154

SATI member number: 1001872
DISCLAIMER
Whilst the English language editor has used electronic track changes to facilitate corrections and has inserted comments and queries in a right-hand column, the responsibility for effecting changes in the final, submitted document, remains the responsibility of the candidate in consultation with the supervisor/promoter.
Director: Prof. Dennis Schauffer, M.A.Leeds, PhD, KwaZulu Natal, TEFL, TITC Business English, Emeritus Professor UKZN, Cambridge University Accreditation for IGCSE (Drama).
155