THE INFLUENCE OF SECONDARY PROCESSING …opus.bath.ac.uk/42230/3/Accepted_version.pdf1 THE INFLUENCE...
42
1 THE INFLUENCE OF SECONDARY PROCESSING ON THE STRUCTURAL RELAXATION DYNAMICS OF FLUTICASONE PROPIONATE Roberto Depasquale 1 , Sau L. Lee 2 , Bhawana Saluja 3 , Jagdeep Shur 1 , Robert Price 1* 1 Pharmaceutical Surface Science Research Group, Department of Pharmacy & Pharmacology, University of Bath, Bath, BA2 7AY, UK. 2 Office of Pharmaceutical Science, Center for Drug Evaluation and Research, U.S. Food and Drug Administration, White Oak Building 51, 10903 New Hampshire Avenue, Silver Spring, MD 20993 3 Office of Generic Drugs, Center for Drug Evaluation and Research, U.S. Food and Drug Administration, White Oak Building 75, 10903 New Hampshire Avenue, Silver Spring, MD 20993 Keywords: mechanical activation, CAB, particle adhesion, process induced structural disorder, laagering *Corresponding author: Robert Price PhD, Telephone: +44 (0) 1225 383644; Fax: +44 (0) 1225 386114 E-mail: [email protected]
Transcript of THE INFLUENCE OF SECONDARY PROCESSING …opus.bath.ac.uk/42230/3/Accepted_version.pdf1 THE INFLUENCE...
1
THE INFLUENCE OF SECONDARY PROCESSING ON THE STRUCTURAL
RELAXATION DYNAMICS OF FLUTICASONE PROPIONATE
Roberto Depasquale1, Sau L. Lee2, Bhawana Saluja3, Jagdeep Shur1, Robert
Price1*
1 Pharmaceutical Surface Science Research Group, Department of Pharmacy &
Pharmacology, University of Bath, Bath, BA2 7AY, UK.
2 Office of Pharmaceutical Science, Center for Drug Evaluation and Research, U.S.
Food and Drug Administration, White Oak Building 51, 10903 New Hampshire
Avenue, Silver Spring, MD 20993
3 Office of Generic Drugs, Center for Drug Evaluation and Research, U.S. Food and
Drug Administration, White Oak Building 75, 10903 New Hampshire Avenue, Silver
Spring, MD 20993
Keywords: mechanical activation, CAB, particle adhesion, process induced structural
disorder, laagering
*Corresponding author:
Robert Price PhD,
Telephone: +44 (0) 1225 383644; Fax: +44 (0) 1225 386114
E-mail: [email protected]

2
3
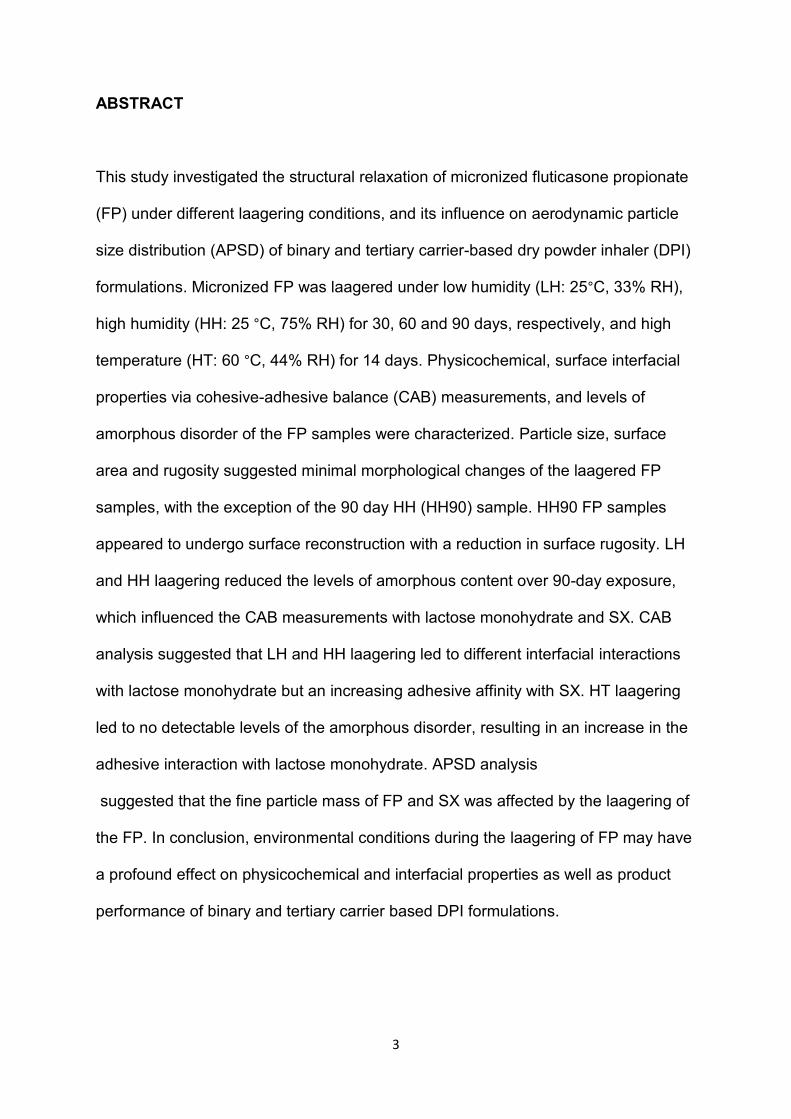
ABSTRACT
This study investigated the structural relaxation of micronized fluticasone propionate
(FP) under different laagering conditions, and its influence on aerodynamic particle
size distribution (APSD) of binary and tertiary carrier-based dry powder inhaler (DPI)
formulations. Micronized FP was laagered under low humidity (LH: 25°C, 33% RH),
high humidity (HH: 25 °C, 75% RH) for 30, 60 and 90 days, respectively, and high
temperature (HT: 60 °C, 44% RH) for 14 days. Physicochemical, surface interfacial
properties via cohesive-adhesive balance (CAB) measurements, and levels of
amorphous disorder of the FP samples were characterized. Particle size, surface
area and rugosity suggested minimal morphological changes of the laagered FP
samples, with the exception of the 90 day HH (HH90) sample. HH90 FP samples
appeared to undergo surface reconstruction with a reduction in surface rugosity. LH
and HH laagering reduced the levels of amorphous content over 90-day exposure,
which influenced the CAB measurements with lactose monohydrate and SX. CAB
analysis suggested that LH and HH laagering led to different interfacial interactions
with lactose monohydrate but an increasing adhesive affinity with SX. HT laagering
led to no detectable levels of the amorphous disorder, resulting in an increase in the
adhesive interaction with lactose monohydrate. APSD analysis
suggested that the fine particle mass of FP and SX was affected by the laagering of
the FP. In conclusion, environmental conditions during the laagering of FP may have
a profound effect on physicochemical and interfacial properties as well as product
performance of binary and tertiary carrier based DPI formulations.

4

5
INTRODUCTION
Particle size reduction of active pharmaceutical ingredients (APIs) for delivery to the
lungs requires secondary processing of primary crystals using highly energetic
comminution techniques, such as air-jet micronization [1]. For brittle materials,
particle-particle and particle-wall collisions within a micronizer often leads to the
formation of short-lived defects formed along existing flaws within a crystalline lattice
that can lead to crystal fracture [2,3]. However, at the brittle-ductile transition, the
material absorbs a significant amount of impact energy before undergoing any
further particle reduction [4]. This impact energy is stored as strain energy within the
crystalline lattice in the form of structural defects, dislocations and, at the limit, can
lead to localized amorphous regions on a particle surface [4-6].
Process induced structural disorder can lead to uncontrolled thermodynamic
changes to the materials, and is commonly described as “mechanical activation” [4-
7]. Mechanical activation may directly influence the physicochemical properties of a
substance, for example, surface free energy, reactivity, conductivity and true density
[6,8]. For carrier-based dry powder inhaler (DPIs) formulations, mechanical
activation can directly influence the interfacial free energy of the respirable drug
particles (e.g. < 5 µm), which may increase the tendency for agglomeration. This
may also affect the relative magnitude of the cohesive (drug-drug) and adhesive
(drug-excipient) inter-particulate forces. Since the performance of adhesive mixtures
is a function of the relative magnitude of these forces, the interfacial properties of
secondary processed APIs can dominate blending dynamics, formulation
microstructure and ultimately drug product quality and performance of carrier-based
DPI formulations [6].

6
Mechanically activated particles are thermodynamically unstable and are driven to
undergo structural relaxation to a more stable state [4,5]. Structural relaxation
kinetics has been shown to be strongly dependent on environmental conditions
(temperature and relative humidity), which may influence the degree of molecular
mobility within the material, and the period of exposure to such conditions [5,6]. The
laagering or quarantine period required for materials to undergo structural relaxation
may vary significantly from minutes, hours to months and appears to be highly
dependent on their hydrophilic/hydrophobic nature [4,6].
Accelerated stability conditions of both temperature and relative humidity have been
shown to expedite the rate of structural relaxation and may aid in stabilization of
particulate surfaces upon secondary processing [6,9]. Studies have also shown that
post-micronization relaxation may significantly reduce the levels of localized
amorphous disorder, and the tendency for micronized particles to aggregate [9]. The
use of post-micronization environmental conditioning appears to be widely applied to
hydrophilic compounds [10-12]. For example, micronized tiotropium bromide
monohydrate was exposed to the conditions of 70-80% RH and 25-30 °C for up to 28
hours on sheet metal racks prior to formulating as a DPI product [10]. The structural
relaxation of the conditioned tiotropium bromide monohydrate is characterized by
measuring the change in specific enthalpy of solution. Micronized salbutamol
sulphate was mechanically relaxed to a low energy, crystalline form for use in
suspension-based metered dose inhalers (MDIs) by exposing a shallow bed of
powder to the conditions of 60% RH and 25 °C for 65 hours [11]. Micronized
glycopyrrolate bromide could be exposed to a dry environment at an elevated
temperature between 60 and 90°C for at least six hours, but preferably between 24

7
and 50 hours, to limit the tendency of the particles to aggregate and/or agglomerate
upon storage of the DPI formulation [12].
For hydrophobic drugs, there is limited literature regarding the use of environmental
conditions for post-micronization surface conditioning of materials. Among these,
Joshi et al. showed an interesting observation on temperature-dependent stress
relaxation of budesonide that led to an anomalous increase in specific surface area
during post-micronization storage [3]. The significant increase in surface area of
budesonide upon storage was hypothesized to be related to the residual stress
stored in the form of defects and dislocation upon micronization, which may lead to
crack propagation and induce secondary particle fracture with the creation of new
surface [3].
Based on the above information, the properties of carrier-based DPI formulation
prepared with the freshly micronized or laagered (post-micronization and
conditioned) drug are likely to be different, particularly as its performance is strongly
dependent on the particle size, morphology and interfacial chemistry of the particle
surface [6]. Any processing or storage conditions that may affect such properties
need to be monitored and controlled to ensure formulation consistency during
processing and over the product shelf life. Therefore, the aim of this study is to
investigate the structural relaxation of micronized fluticasone propionate (FP) stored
under different conditions of temperature and relative humidity and their possible
influence on the FP physicochemical and interfacial properties. FP was chosen due
to its hydrophobic nature and our limited understanding of the structural relaxation
kinetics of such hydrophobic materials. The results of this study are expected to
8
provide a valuable insight into how changes to these material properties during
relaxation affect cohesive forces (FP-FP), adhesive forces with another drug
component such as salmeterol xinafoate (SX) and lactose monohydrate, and
consequently the in vitro performance of carrier-based DPI formulations.
MATERIALS AND METHODS
MATERIALS
Micronized FP (C25H31F3O5S, Molecular weight = 500.571) was purchased from
Chemagis (Lot no. 104364, 100 grams, Bnei Brak, Israel). The FP sample was
shipped directly upon micronization and supplied in very tight packaging and held
under 10% RH during transport. Salmeterol Xinafoate (C36H45NO7, molecular weight
= 603.745) was sourced from Neuland Pharmaceuticals (Lot no. 12004, 20 grams,
Mumbai, India). A milled grade (ML001) of lactose monohydrate (C12H24O12,
molecular weight = 360.312) was sourced from DFE Pharma (Lot no. 10474128,
Borculo, Netherlands). In vitro aerosolization testing of the binary and combination
DPI formulations was performed using a Cipla Rotahaler® DPI capsule device (Cipla,
Mumbai, India). Water used during the studies was Milli-Q reverse osmosis purified
(Merck Millipore, Darmstadt, Germany). Methanol and acetonitrile were of HPLC
grade and purchased from Sigma (Gillingham, UK).
METHODS

9
A 2g sample of FP was taken from a micronized batch for full physicochemical
characterization. The remaining drug sample was separated into three 6g batches
and conditioned under three different environmental conditions of temperature and
relative humidity for well-defined periods. An aged batch of micronized SX (>12
months) was used for tertiary DPI formulation preparations, and was kept under
ambient conditions during the period of the study. The use of such aged SX batch
allowed the investigation to focus on examining the effect of FP relaxation behavior
under different storage conditions on the in vitro performance of the tertiary DPI
formulation, as its physicochemical and interfacial properties were not expected to
change. The particle size distribution of the coarse lactose monohydrate was
monitored during the study to ensure that there was no change to particle size, since
any change to the fine or coarse end of the particle size distribution may influence
drug product performance.
Conditioning of micronized FP
The three conditioning environments chosen for this investigation were (1) ambient
temperature and low humidity (LH) (25 °C, 33% RH), (2) ambient temperature and
high humidity (HH) (25 °C, 75% RH), and (3) high temperature and ambient humidity
(HT) (60 °C, 44% RH). An aliquot of each conditioned FP sample (2 g) was taken
from the LH and HH conditions upon being laagered for 30, 60 and 90 days. The HT
sample was quarantined at a single time point of 14 days. All samples were sieved
through a 500 µm mesh sieve prior to physicochemical characterization. Table 1
provides a summary of the conditioning environments and periods for micronized FP
samples as well as their corresponding nomenclatures.

10
Laser Diffraction
Particle size distributions (PSDs) of all FP samples were measured in the wet state
using a Sympatec HELOS and CUVETTE (Sympatec GmbH, Clausthal-Zellerfeld,
Germany) laser diffraction system using an R3 lens (0.5 - 175 μm). Approximately 10
mg of FP was suspended in HPLC grade cyclohexane containing 0.5% w/v lecithin
(Acros Organics, Geel, Belgium) and sonicated for 5 mins and then immediately
transferred into a 50 mL cuvette to produce an appropriate optical concentration (8-
12 %). Each measurement was performed in triplicate. Particle size analysis was
performed using WINDOX 5.0 software (Sympatec GmbH, Clausthal-Zellerfeld,
Germany).
Scanning Electron Microscopy (SEM)
Particle morphology of all FP samples was investigated using scanning electron
microscopy (SEM). Sample aliquots were fixed onto sticky carbon tabs (Agar
Scientific, Cambridge, UK), followed by removal of excess powder using pressurized
air. Samples were subsequently sputter coated with gold (Edwards Sputter Coater
S150B, Edwards High Vacuum, Sussex, UK) to achieve a thickness of approximately
20 nm. Imaging was performed using a scanning electron microscope (JEOL
JSM6480LV, Tokyo, Japan) using 15 kV accelerating voltage.
X-ray powder diffraction (XRPD)
The X-ray powder diffraction (XRPD) patterns of FP samples were analyzed by a
Bruker Powder Diffractometer (D8; Bruker AXS Inc., Madison, USA) using CuKα
radiation (λ=1.54 Å). The data were collected over a single 2θ sweep with range 2θ =
5 - 30° and a step size of 0.025°/step with a step time of 1.5 s.
11
Differential Scanning Calorimetry (DSC)
The thermal properties of all samples were investigated using a differential scanning
calorimeter (DSC 2920, TA Instruments, Surrey, UK), calibrated with an indium
standard. Approximately 3 mg of sample was accurately weighted into an aluminium
pan and crimped with a lid to form a hermetic seal. The sample and reference pan
were heated at a rate of 10◦C/min from 30◦C to 350◦C. The calorimeter head was
continuously flushed with dry nitrogen gas at 0.2 L/min during all measurements.
Specific Surface Area by Brunauer–Emmett–Teller (BET)
The specific surface area (SSA) of FP samples was measured using a Gemini 2360
surface area analyser (Micromeritics Instrument Corporation, Norcross, USA). A five-
point BET nitrogen adsorption analysis was carried out in triplicate after degassing
the samples for 24 hours in a FlowPrep 060 degasser (Micromeritics Instrument
Corporation, Norcross, USA).
Rugosity (Ra)
Rugosity (Ra) is a semi-quantitative measure of shape and surface texture of
particles and can be calculated based on the ratio of the surface area calculated by
BET (SSA) to a product of the drug density and the surface area by laser diffraction
(Sv) [3]. As described above, the laser diffraction measurement assumes that
particles are smooth and spherical, and does not account for the surface roughness
or shape of particles in its theoretically calculated surface area. Thus, Ra can provide
an estimate of changes that could be attributed to surface texture and smoothness.

12
Thermal Activity Monitoring (TAM)
Calorimetric data were recorded using a 2277 Thermal Activity Monitor (TAM,
Thermometric AB, Jarfalla, Sweden) at 25°C equipped with a gas perfusion unit.
Briefly, the unit controls the relative humidity of a carrier gas flowing over the sample
by proportional mixing of two gas lines (0 and 100% RH) using independent mass-
flow controllers. This allows freshly loaded samples to be initially held under a dry
atmosphere, limiting humidity induced relaxation of amorphous disorder present and
allowing the apparatus to reach thermal equilibrium before the commencement of
data capture. Data were recorded every 10 s with an amplifier range of 3000 μW
using the dedicated software package Digitam 4.1. For the FP analysis, the RH
program was initially set to 0% RH for 3 hours and then switched to 90% RH for a
minimum of 12 hours and subsequently returned to 0% RH once the heat signal
returned to baseline. All data were recorded in triplicate. Peak analysis was
performed using Origin (Microcal Software Inc., USA). In all cases, the drying
response was subtracted from the wetting response to record the overall heat activity
that was then used to record the enthalpy difference. These enthalpy values were
then used to calculate the amorphous content of the samples by means of calibrated
enthalpy curves of 100 % crystalline and 100 % amorphous FP.
Cohesive-Adhesive Balance (CAB)
Preparation of crystal substrates
To perform quantitative scanning probe microscopy (SPM) measurements of the
cohesive-adhesive balance (CAB) of the FP samples, smooth single crystal surfaces

13
of FP, SX and lactose monohydrate were prepared [13] [1]. The procedure for these
preparations is briefly summarized below.
A saturated solution of FP in 2 mL of acetone was prepared and sonicated prior to
filtration via a 0.22 µm polytetrafluoroethylene (PTFE) membrane filter (Whatman
Inc., Clifton, NJ, USA). FP was crystallized using water as an anti-solvent.
Specifically, a microscope cover slip (12 mm x 12 mm) was supported on a vertical
post in a crystallization dish that contained the anti-solvent. A droplet of the FP
saturated solution was placed on the coverslip using a syringe attached to the 0.22-
µm-membrane filter. The system was sealed by inverting a glass lid in the
crystallisation dish to allow vapor phases of the miscible solvents to come into
equilibrium, resulting in heterogeneous nucleation and crystal growth within the
solution droplet. A similar approach was used for the preparation of smooth crystal
substrates of lactose monohydrate and SX and a detailed method is published
elsewhere [1].
Interaction force measurements
Prior to force measurements, individual particles from each sample of FP were
attached onto standard V-shaped tipless cantilevers with pre-defined spring
constants (DNP-020, DI, CA, USA) using an epoxy resin glue (Araldite, Cambridge,
UK). Five probes were prepared for the initial, LH, HH and HT conditioned FP
samples at each pre-defined laagering period. All probes were examined with an
optical microscope (magnification 50x) to ensure the integrity of the attached particle,
before allowing the thin layer of glue to cure and dry.

14
Single crystal substrates were loaded onto the scanner stage of a multi-mode
scanning probe microscope (SPM) (Bruker, Santa Babara, CA, USA), which was
enclosed in a custom-built environmental chamber, in which the ambient conditions
were maintained at a constant temperature of 25 °C (± 1.5 °C) and relative humidity
of 44% RH (± 3%). The interaction forces were measured by recording the deflection
of a cantilever as a function of the substrate displacement (z) by applying Hooke’s
Law. Individual force curves (n = 1024) were conducted over a 10 µm x 10 µm area
at a scan rate of 4 Hz and a compressive load of 40 nN.
A custom-built software was developed to extract data contained within each force-
volume dataset. These data were analyzed to ensure normal distribution, indicating
uniform contact area between the drug probe and the smooth substrate surfaces.
Arithmetic mean and standard deviation were measured to produce CAB plots for
the interactions of the different batches of FP with both lactose monohydrate and SX.
Preparation of powder formulations
Binary powder blends (4 g) were manufactured using lactose monohydrate and 1.0
% w/w FP (day 0, LH, HH, or HT). A pre-weighed amount of lactose monohydrate
(3.96 g) was initially passed through an 850 µm aperture sieve to break any large
agglomerates which may have formed during storage. A quarter of the mass of the
lactose monohydrate required was transferred to a stainless steel cylindrical vessel
with an internal diameter of 100 mm and a height of 150 mm, and all the FP (40 mg)
was sandwiched with another quarter of the sieved lactose monohydrate. This was
mixed in a T2F Turbula® mixer (Wily A Bachofen AG, Basel, Switzerland) for 10

15
minutes at 46 rpm. The remaining half of the lactose monohydrate was then added
and mixed for a further 45 minutes at 46 rpm. Upon blending, formulations were
passed through a 250 µm sieve and stored at 20 ± 2 °C and 44% RH for at least 48
hours before the content uniformity of the blends was assayed. Tertiary powder
blends containing FP (1.0% w/w), SX (0.2% w/w SX base) and lactose monohydrate
were similarly prepared by sandwiching 40 mg of FP and 8 mg of SX between ½ of
the lactose monohydrate then mixed for 10 min at 46 rpm and then the remaining ½
of the lactose added and mixed for a further 45 minutes at 46 rpm.
Following content uniformity testing, 25 ± 1 mg of the formulated blend was loaded
into size 3 hydroxypropylmethyl cellulose (HPMC, Shionogi Qualicaps, Madrid,
Spain) capsules. The targeted dose of the binary formulations was 250 µg of FP per
25 mg fill weight. For the tertiary formulations, the targeted dose of FP and SX were
250 µg and 50 µg, respectively, per 25 mg fill weight. The filled capsules were stored
at 20 ± 2 °C and 44 %RH for 24 hours prior to in vitro testing to ensure dissipation of
any electrostatic charges that may have been introduced during processing.
HPLC analysis of Fluticasone Propionate and Salmeterol Xinafoate
The drug content was quantified using HPLC. For the determination of drug content
in FP binary formulations, the HPLC method consisted of a pump coupled to an
auto-sampler and multi-wavelength UV detector (Agilent 1200, Wokingham, UK) with
a wavelength set at 235 nm. The pump flow rate was set to 1.5 mL/min through a
Hypersil ODS-C18 column (Fisher Scientific, Loughborough, UK, column length of
250 mm, internal diameter of 4.6 mm, and particle size of the packing material of 5
m), which was placed in a column oven (Agilent, Wokingham, UK) set to 40°C. The
16
mobile phase consisted of methanol, acetonitrile and water (45:35:20 % v/v). The
elution time for the FP peak using this method was 3.4 mins. For the drug content
determination of FP and SX in combination formulations, the HPLC method used a
flow rate of 1.0 mL/min through a Hypersil BDS-C18 column (Fisher Scientific,
Loughborough, UK, column length of 250 mm, internal diameter of 4.0 mm, and
particle size of the packing material of 5 m) placed in a column oven at 40 °C. The
mobile phase consisted of 75:25 % v/v methanol: 0.6 % w/v aqueous ammonium
acetate.
For both methods, a linear regression analysis was used for the assessment of the
HPLC calibration. Quantification was carried out by an external standard method,
and linearity was verified between 0.05 and 50 g/mL.
Content Uniformity
Ten random samples of 25 ± 1 mg, from different areas of the powder bed were
weighed and dissolved in 50 mL of mobile phase. The amount of drug in each
sample was obtained from HPLC assay and the content uniformity was expressed as
a relative standard deviation (%RSD).
In Vitro Aerosolization Analysis
In vitro testing was performed using a Next Generation Impactor (NGI, Copley
Scientific, Nottingham, UK) with a pre-separator, which was connected to two
vacuum pumps (Copley Scientific, Nottingham, UK) to create critical (sonic) flow.
The pre-separator contained 15 mL of mobile phase. The NGI cups were coated with
1 % v/v silicone oil in hexane to eliminate any particle bounce. For each experiment,
two capsules of the same blend were discharged into the NGI at 55 L/min for 4.4 s,

17
equivalent to a total volume of 4 L. Prior to each test, the flow rate was verified using
a digital flow meter (DFM 2000, Copley Scientific, Nottingham, UK). The amount of
API deposited on each part of the NGI was determined by HPLC. This protocol was
repeated three times for each formulation. The mass median aerodynamic diameter
(MMAD), geometric standard deviation (GSD), fine particle dose (FPD) and impactor
stage mass (ISM) were determined for each case. In all cascade impactor tests
conducted, the mass balance was within ±15 % of the total recovered dose.
Statistical Analysis
Statistical analysis between different populations carried out using one-way analysis
of variance. Comparison of the mean values was performed by Tukey’s multiple
comparison. All statistical analyses were performed using GraphPad Prism software
(GraphPad Software Inc, California, USA). Error bars in graphical representations of
data show ± standard deviation (SD) in all cases.
RESULTS AND DISCUSSION
To investigate the effect of controlled environmental laagering on the structural
relaxation behavior of micronized FP, a range of physicochemical properties were
systematically evaluated under different storage conditions and over pre-defined
time periods. Colloidal probe CAB-SPM was then utilized to provide a more
functional measurement of the influence of these physicochemical properties on the
surface interfacial interaction of conditioned FP samples with FP, SX and lactose
monohydrate substrate surfaces. These data were further compared to the in vitro

18
performance of binary and tertiary DPI formulations containing the micronized (used
as received) and laagered FP samples.
Physicochemical Characterization
Representative XRPD profiles of the Day 0, LH90, HH90 and HT FP samples are
shown in Figure 1 (other time point traces are not shown). The presence of distinct
peaks in the XRPD profiles between 10° and 40° angle 2θ for all samples suggested
that all FP samples were of the same polymorphic form and that conditioning of FP
samples under the environments and periods chosen in this study did not alter the
crystalline form [1]. There was, however, a broad diffuse peak below 10° angle 2θ for
both the LH90 and HH90 samples. The origin of this peak was not fully understood
but might suggest either incorporation of greater randomness within the crystalline
structure or possible changes in preferred orientation of the crystallites upon packing
into the instrument caused by extended exposure to low and high relative humidity.
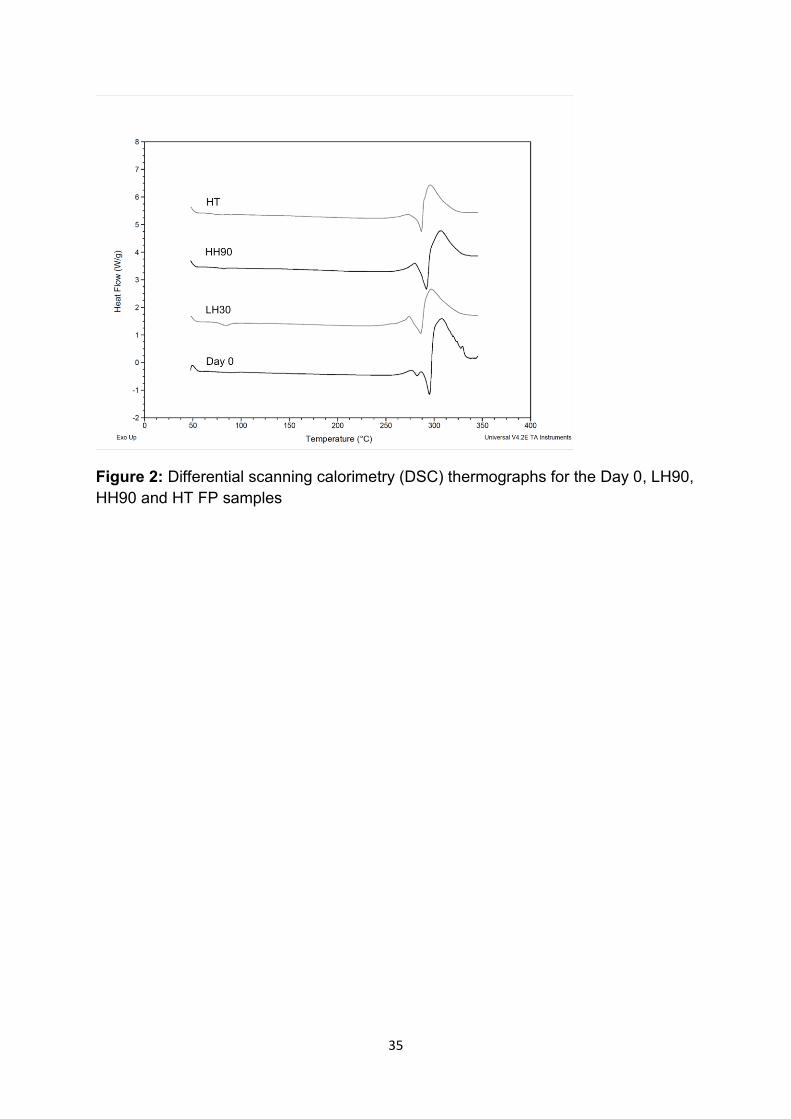
Representative DSC thermographs of the Day 0, LH90, HH90 and HT FP samples
are shown in Figure 2. Thermal analysis of all samples (other time point traces not
shown) indicated that all materials had an onset of melting at approximately 295 °C,
which was related to the melting point for form I of FP [14]. Again, the DSC data
further supported the same polymorphic form of all FP samples.
PSD of Day 0 and all laagered FP samples are summarized in Table 2. These data
showed that while the PSD was relatively insensitive to laagering at HT, laagering of
FP under controlled humidity conditions led to some observable changes in the PSD
of laagered FP samples. For example, upon exposure to LH, the d50 of FP showed

19
an increase at 30 days (2.74 µm), followed by a decrease at 60 days (2.18 µm) and
an increase at 90 day (2.68 µm) where the d50 remained below the initial value (2.41
µm). A similar qualitative trend was observed for HH samples.
The corresponding surface areas measured by laser diffraction and BET, as well as
the Ra of the FP samples are tabulated in Table 2. The SSA measurements followed,
in most cases, a similar qualitative trend to that observed in the particle size and Sv
measurements by laser diffraction. For example, upon exposure to 33% RH, there
were noticeable increase and subsequent decrease in the SSA at 60 and 90 days,
respectively, with respect to SSA at 30 days.
However, an anomalous finding was observed for the HH90 FP sample. Unlike the
particle size and Sv data of HH 30 and HH 60, the HH90 FP sample showed a
significant decrease in the SSA accompanied by a noticeably smaller value of Ra
with respect to all other FP samples. This observation indicated a marked reduction
in the surface roughness of the HH90 FP sample. These data suggested that the
morphology of the HH90 FP sample differed considerable from the other laagered
FP samples.
Representative SEM images of the Day 0, HT, LH90 and HH90 FP samples are
shown in Figure 3. With the limited spatial resolution of the SEM, it is difficult to
quantitatively discern morphological and surface roughness differences of the Day 0
FP sample from the HT and LH90 FP samples. However, it appeared that laagering
under high humidity conditions (HH90) created a noticeable change in morphology,
resulting in increased surface smoothening (Figure 3D) consistent with the decrease

20
observed in the SSA and Ra measurements. However, these topographical changes
were not apparent for HH30 and HH60 FP samples (data not shown). The surface
transformation of the HH90 FP samples suggested that laagering at high humidity
(>75% RH) for an extended period of time (60 < t < 90 days) may provide the
conditions to overcome the activation energy required for the molecular mobility in
the disordered regions to undergo surface reconstruction.
Post-micronization conditioning effects on amorphous content and interfacial
forces of FP samples
The amorphous contents by TAM for the FP samples are summarized in Table 2.
These data indicated that all laagering conditions led to a lowering in the amorphous
content. Laagering under high temperature (i.e., HT FP sample) reduced the
amorphous content to below the limit of quantification (LOQ) of the analytical
method. Under ambient temperatures, the partial water vapour pressure surrounding
the FP powder and the period of exposure also had a direct effect on the amorphous
content. Under high humidity conditions, there was a sharp decrease in the
amorphous content of the HH30 and HH60 FP samples. In contrast, under low
humidity, there was only a minor decrease in the amorphous content of the LH30
and LH60 FP samples. However, the amorphous contents of the LH90 and HH90
samples were low. Interestingly, while the relaxation pathway of the amorphous
disorder was different for FP conditioning under 33% RH and 75% RH, as suggested
in the previous physiochemical and SEM data, the amorphous content at 90 days
was similar for the both conditions, which was around 1.0 %.
Post-micronization Conditioning Effects on Interfacial Forces

21
The influence of different laagering conditions on the surface interfacial forces of the
micronized and laagered FP samples was investigated by CAB analysis. The
individual CAB plots of the FP samples with respect to both lactose monohydrate
and SX are provided as supplemental materials (Figs. S1-S3). A summary plot of
the CAB values versus low and high humidity laagering conditions are plotted in
Figure 4.
The CAB ratios with respect to lactose monohydrate for the low humidity laagering
conditions indicated a shift from a slightly cohesive-led interaction (FP-FP, CAB ratio
> 1.0) for the micronized FP to an adhesive-led system (FP-Lactose, CAB ratio <
1.0) as shown in Figures S1 and 4, and Table 2. In other words, these data
suggested that the adhesion of FP to lactose monohydrate increased upon extended
exposure of FP to low humidity conditions. The CAB ratios of the low humidity
laagered FP samples with SX (Table 2), also indicated that a significant change in
the interfacial forces between FP and SX substrates occurred upon laagering. The
cohesive nature of the Day 0 FP sample, which was two-fold greater than its affinity
to SX, only slightly decreased for the LH30 sample. However, upon laagering at low
humidity for 60 days the CAB measurements demonstrated a significant (p<0.02)
shift from a highly cohesive-led system to an adhesive-led (FP-SX > FP-FP) system.
This shift to an adhesive (FP-SX)-led system continued for the LH90 FP sample, with
the 90 day laagered FP sample shifting the balance of forces to an approximately
two-fold greater adhesive (FP-SX) interaction than its cohesive (FP-FP) interaction.
These data indicated that laagering micronized FP sample for 90 days at 33% RH,
increased the adhesive interaction to the SX by about four-fold with respect to the as
received micronized FP.

22
The low sensitivity of the FP-lactose CAB interactions and the highly sensitive nature
of the FP-SX CAB to surface chemistry of the secondary processed FP have been
observed previously by Kubavat et. al. [1]. They also showed that different solvent
and anti-solvent conditions during primary crystallization conditions could directly
affect the interfacial surface chemistry of the secondary processed FP.
A similar trend in the FP-SX CAB measurements was observed upon laagering
under high humidity conditions (Figure 4, Table 2). However, the FP-lactose CAB
measurements did not follow a similar trend as the low humidity laagered FP
samples. As reflected in the CAB ratios relisted in Table 2, initial exposure to
elevated humidity increased the adhesive tendency of FP to lactose monohydrate
(HH30), to a greater extent than 90-day exposure at 33% RH (i.e., LH90 FP sample).
However, both 60 and 90 day exposure to 75% RH subsequently reduced the
adhesive tendency of the laagered FP samples to lactose monohydrate. As a result,
the HH90 sample exhibited a greater cohesive tendency than its interaction with
lactose monohydrate. Such findings have been previously seen between a partially
and fully mechanically relaxed new chemical entity [15]. It should also be noted that
in Table 2 the HH90 FP sample showed both the greatest cohesive tendency with
respect to lactose monohydrate and a relatively high adhesive tendency to SX. This
unique combination of changes in the interactive force measurements is most likely
due to the structural reconstruction of the FP surface as indicated by the marked
decrease in SSA and rugosity values of the HH90 FP.
23
High temperature conditioning of FP at 60°C led to the greatest increase in the
adhesive tendency of the FP to lactose monohydrate, with respect to the cohesive
interaction (Table 2). However, for the FP-SX CAB measurements, while exhibiting a
significant (p<0.05) decrease in cohesiveness (Fig. 6B), the HT sample failed to shift
the dominant force to an adhesive led system that was observed with laagered FP
samples under high and low humidity conditions.
Drug content uniformity
The relative standard deviation (RSD) measurements of the drug content for binary
and tertiary DPI formulations containing micronized and laagered FP are shown in
Table 3. For all binary DPI formulations, the RSDs were ≤ 2.5%, indicating
homogeneity of the prepared mixtures. In the tertiary DPI formulations, the RSDs for
FP were ≤ 3 %, while for SX were ≤5.5 %, which suggested a homogeneous
distribution of the two active ingredients in the formulated mixtures.
In vitro aerosolization performance of binary DPI formulations
The in vitro APSD characterization of binary DPI formulations containing lactose
monohydrate and micronized or laagered FP sample are summarized in Table 3.
The MMAD and FPM are also plotted as a function of LH and HH laagering
conditions in Figure 5, together with a plot of their respective FP-lactose CAB values.
For the HT FP sample, there was a significant (p<0.05) increase in the FPM and
MMAD with respect to the Day 0 FP sample. Similarly, there was also a significant
(p<0.05) increase in MMAD and FPM of the LH FP samples over 60 and 90 days,
with respect to the Day 0 and LH30 samples.

24
These differences in APSD of the HT and LH FP samples did not appear to be
directly related to changes in the material physical properties (e.g. particle size and
surface area). The CAB measurements, however, suggested that the balance of
forces for the LH FP samples shifted from being cohesive at Day 0 and 30 day
exposure to being adhesive following laagering for 60 and 90 days. This was also
observed from the Day 0 to HT FP sample. Such a shift in the nature of interaction
force corresponds with an increase in MMAD of the formulations, which might be
related to formation of API/fines agglomerates owing to the higher adhesive affinity
of LH60 and LH90 FP samples to lactose monohydrate fines. It should be noted that
with the high levels of intrinsic lactose monohydrate fines (< 4.5 µm) present in the
ML001 grade of lactose (ca. 10-15 % w/w), a shift in the balance of forces between
FP and lactose monohydrate has been previously shown to lead to a greater
elutriation and deaggregation efficiency of FP from the coarse carrier surfaces due to
stable agglomerate formation with lactose monohydrate fines [16] [17]. This
mechanism of agglomerate formation, suggested by Jones et. al., indicated that a
greater adhesive affinity between API and lactose monohydrate led to a significant
increase in MMAD and fine particle mass deposited [16].
Laagering FP samples under high humidity conditions for 30, 60 and 90 days also
had a significant effect on APSD of the carrier-based DPI formulations (Figure 5,
Table 2). Laagering for 30 days under high humidity conditions led to an increase in
the MMAD but no significant change in FPM. The increase in MMAD is in agreement
with the slight changes in PSD and SSA measurements, and the relative increase in
adhesion to the lactose monohydrate, as measured by CAB, which may aid
formation of API/lactose monohydrate fines agglomerates [18] [16]. Increasing the

25
period of laagering at the high humidity condition led to an increase in FPM
accompanied by a decrease in MMAD (close to but slightly higher than that of the
Day 0 FP sample) over 90 days. It was not evident that a single parameter was
responsible for or could be used to explain this unique change in formulation
performance. Nevertheless, the trends observed here might be related to the
combined effect of changes in the physical shape, morphology and interfacial
properties of the HH FP particles that may affect the formulation microstructure
during processing and formulation performance. Further research is warranted to
better understand the fundamental factors and possibly their interactions that
influence the performance of binary DPI formulation containing HH30 and HH90 FP
samples.
In vitro aerosolization performance of tertiary DPI formulations
The in vitro APSD characterization of tertiary DPI formulations containing lactose
monohydrate, SX and micronized or laagered FP samples are summarized in Table
3. The MMAD and FPM of SX are plotted together with the FP-SX CAB values in
Figure 6. As mentioned above, an aged batch of micronized SX (> 12 months) was
used. Cohesive-adhesive balance (CAB) measurements indicated that there was no
noticeable difference in the interfacial properties of the SX during the duration of the
study (The average CAB ratio of SX with respect to lactose monohydrate over the
different time points was 1.85 ± 0.13).
The aerosolization performance of FP were not significantly (p>0.05) affected by
laagering at low humidity over 60 days. However, extended laagering (60 < t < 90
days) led to a significant (p<0.05) increase in FPM and a smaller MMAD. Laagering

26
under high humidity, similar to the binary DPI formulations, extended laagering
appeared to progressively affect the aerosolization performance of the FP
component in the tertiary formulations. However, increasing laagering increased the
FPM but decreased the MMAD of the FP component in the presence of SX, whereas
for the binary formulation extended laagering showed an initial marked increase
followed by a gradual decrease in FP MMAD and a consistent increase in FP FPM.
For the SX component, increasing the period of laagering led to an increase in FPM
recovery of SX and a decrease in MMAD of the SX component for LH and HH FP
samples.
The aerosolization performance of the tertiary DPI formulations (particularly with
respect to the SX component in Figure 6) appeared to be sensitive to shift in the
balance of forces between FP and SX upon FP laagering. As has been indicated in a
number of studies, the greater the adhesive tendency between FP and SX, the more
significant is the improvement in aerosolization performance of SX [1,16,19]. These
studies proposed that higher deaggregation efficiency of the SX occurred as a result
of the greater propensity of FP and SX to form fine particle agglomerates during
blending. Similar observations have also been reported for suspension MDI
formulations comprising of FP and SX [20]. However, additional studies will be
needed to fully understand the complex relationships between the interfacial
properties and aerosolization performance for such tertiary systems.
CONCLUSIONS
The ability to understand and predict interparticulate forces of secondary processing
of APIs in DPI systems is critical in our ability to predict and optimize DPI product
performance. The relative magnitudes of the cohesive (drug-drug) and adhesive

27
(drug-excipient, drug 1-drug 2 such as FP-SX) forces and how primary and
secondary processing of drug materials may directly impact these interparticulate
forces is a major research objective. In this study, we have shown that the relative
magnitudes of cohesive-to-adhesive forces of secondary processed FP are a direct
function of the conditioning environment and duration. While the time to re-
equilibrate the FP particles from their unstable amorphous state to the
thermodynamically stable crystalline state can be expedited, laagering is an
essential parameter requiring controlled conditions of temperature and relative
humidity. Unlike high temperature, humidity based conditioning failed to completely
eliminate amorphous related disorders and significantly affected the relative balance
of the adhesive and cohesive forces during storage. A significant morphological and
topographical change was seen following the conditioning of FP under high humidity
for 90 days, suggesting a surface reconstruction event. This study clearly shows that
the different post-micronization laagering conditions translated into different
interfacial behavior, accompanied by significant changes in product performance
characterized by APSD measurements by cascade impaction. However, the
fundamental factor(s) and mechanism(s) responsible for the observed differences in
product performance are not fully understood for the complex formulations in DPIs
investigated here. Therefore, the present study clearly indicates the critical
importance and need for more research in understanding the physical, chemical and
interfacial properties of secondary processed materials and their subsequent effect
on the product performance.

28
REFERENCES
1. Kubavat HA, Shur J, Ruecroft G, Hipkiss D, Price R. Investigation into the influence of primary crystallization conditions on the mechanical properties and secondary processing behaviour of fluticasone propionate for carrier based dry powder inhaler formulations. Pharm. Res. 2012;29:994–1006.
2. Ward GH, Schultz RK. Process-induced crystallinity changes in albuterol sulfate and its effect on powder physical stability. Pharm. Res. 1995;12:773–9.
3. Joshi V, Dwivedi S, Ward GH. Increase in the specific surface area of budesonide during storage postmicronization. Pharm. Res. 2002;19:7–12.
4. Huttenrauch R, Fricke S, Zielke P. Mechanical activation of pharmaceutical systems. Pharm. Res. 1985;2:302–6.
5. Brodka-Pfeiffer K, Langguth P, Grass P, Häusler H. Influence of mechanical activation on the physical stability of salbutamol sulphate. Eur J Pharm Biopharm. 2003;56:393–400.
6. Shur J, Pitchayajittipong C, Rogueda P, Price R. Effect of processing history on the surface interfacial properties of budesonide in carrier-based dry-powder inhalers. Ther Deliv. 2013;4:925–37.
7. Wildfong PLD, Hancock BC, Moore MD, Morri KR. Towards an understanding of the structurally based potential for mechanically activated disordering of small molecule organic crystals. J Pharm Sci. 2006;95:2645–56.
8. Colombo I, Grassi G, Grassi M. Drug Mechanochemical Activation. J Pharm Sci. 2009;98:3961–86.
9. Brodka-Pfeiffer K, Häusler H, Grass P, Langguth P. Conditioning following powder micronization: influence on particle growth of salbutamol sulfate. Drug Dev Ind Pharm. 2003;29:1077–84.
10. Bender H, Graebner H, Schindler K, Trunk M, Watz M.; Boehringer Ingelheim Pharma Gmbh & Co. Kg. Crystalline micronisate, process for the manufacture thereof and use thereof for the preparation of a medicament. US 20040002510 A1. 2004 Jan 1.
11. Riebe MT, Dwivedi SK, Li-Bovet L.; Smithkline Beecham Corporation. Aerosols containing annealed particulate salbutamol and tetrafluoroethane. US6558651 B1. 2003 May 6.
12. Muhrer G, Rasenack N.; Novartis AG. Process for reducing the tendency of a glycopyyronium salt to aggregate during storage. EP2234595 B1. 2012 Nov 28.
13. Begat P, Morton DAV, Staniforth JN, Price R. The cohesive-adhesive balances in dry powder inhaler formulations I: Direct quantification by atomic force microscopy. Pharm. Res. 2004;21:1591–7.
14. Pitchayajittipong C, Shur J, Price R. Engineering of crystalline combination
29
inhalation particles of a long-acting beta2-agonist and a corticosteroid. Pharm. Res. 2009;26:2657–66.
15. Shur J, Kaerger JS, Price R. Effect of Surface Amorphous Content of Active
Pharmaceutical Ingredients on the Performance of Dry Powder Inhaler Formulations.
RDD Europe 2007; Dalby RN, Byron PR, Peart J, Suman J, editors, Davis
Healthcare, Rover Grove, Illinois, Vol 1, pp. 341–4.
16. Jones MD, Harris H, Hooton JC, Shur J, King GS, Mathoulin CA, et al. An investigation into the relationship between carrier-based dry powder inhalation performance and formulation cohesive-adhesive force balances. Eur J Pharm Biopharm. 2008;69:496–507.
17. Shur J, Harris H, Jones MD, Kaerger JS, Price R. The role of fines in the modification of the fluidization and dispersion mechanism within dry powder inhaler formulations. Pharm. Res. 2008;25:1631–40.
18. Begat P, Morton DAV, Staniforth JN, Price R. The cohesive-adhesive balances in dry powder inhaler formulations II: influence on fine particle delivery characteristics. Pharm. Res. 2004;21:1826–33.
19. Jones MD, Hooton JC, Dawson ML, Ferrie AR, Price R. An investigation into the dispersion mechanisms of ternary dry powder inhaler formulations by the quantification of interparticulate forces. Pharm. Res. 2008;25:337–48.
20. Rogueda PGA, Price R, Smith T, Young PM, Traini D. Particle synergy and aerosol performance in non-aqueous liquid of two combinations metered dose inhalation formulations: an AFM and Raman investigation. J Colloid Interface Sci. 2011;361:649–55.
30
TABLES
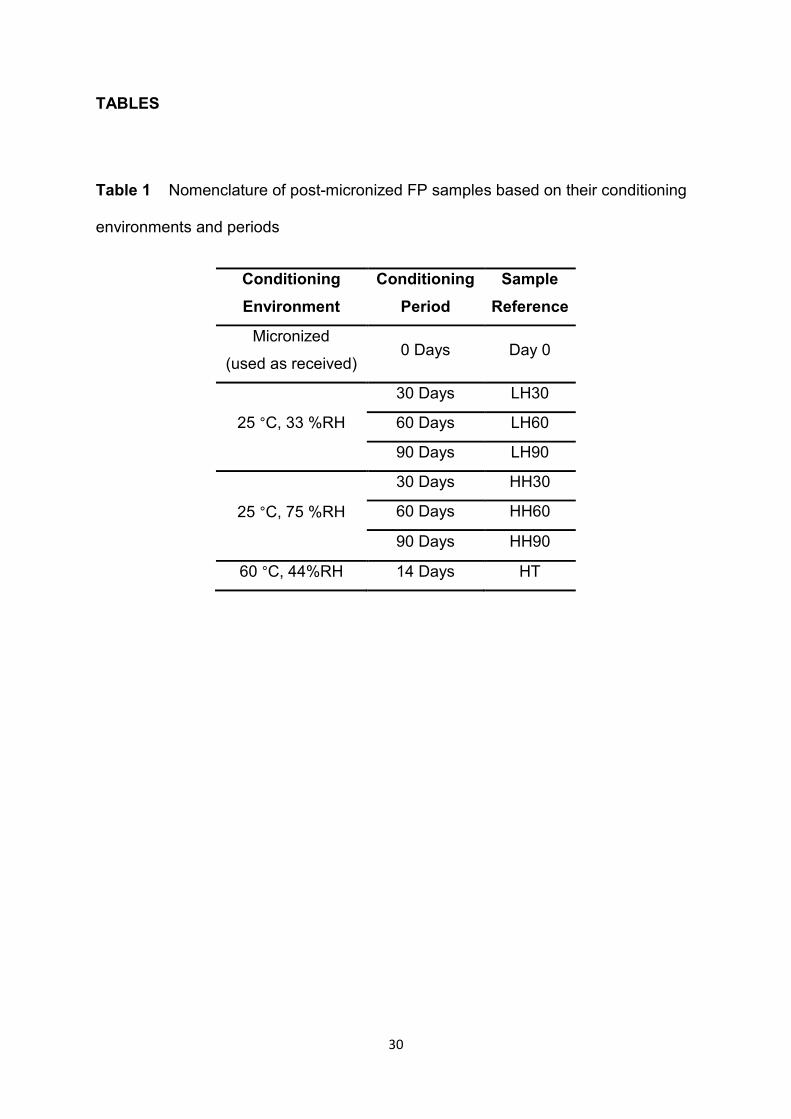
Table 1 Nomenclature of post-micronized FP samples based on their conditioning
environments and periods
Conditioning
Environment
Conditioning
Period
Sample
Reference
Micronized
(used as received) 0 Days Day 0
25 °C, 33 %RH
30 Days LH30
60 Days LH60
90 Days LH90
25 °C, 75 %RH
30 Days HH30
60 Days HH60
90 Days HH90
60 °C, 44%RH 14 Days HT

31
Table 2: Physico-chemical measurements of micronized (Day 0) and laagered samples of FP
FP sample d10
(µm) d50
(µm) d90
(µm) Sv
(m2/cm3) SSA (m2/g) Ra AC (%)a
CAB Ratio wrt Lactose
CAB Ratio wrt SX
Day 0 1.12 ±0.01 2.41 ±0.02 4.37 ±0.02 2.29 7.54 ±0.27 3.30 5.05 ±0.20 1.09 ±0.01 2.00 ±0.03
LH30 1.28 ±0.02 2.74 ±0.01 4.99 ±0.03 2.01 7.43 ±0.31 3.70 4.89 ±0.18 1.04 ±0.02 1.83 ±0.01
LH60 0.96 ±0.01 2.18 ±0.01 4.03 ±0.01 2.55 7.98 ±0.18 3.13 4.34 ±0.21 0.92 ±0.01 0.80 ±0.02 LH90 1.29 ±0.01 2.68 ±0.03 4.86 ±0.01 2.02 7.40 ±0.22 3.66 1.12 ±0.20 0.88 ±0.02 0.52 ±0.02
HH30 1.19 ±0.03 2.57 ±0.01 4.72 ±0.02 2.14 7.88 ±0.11 3.68 2.77 ±0.18 0.76 ±0.03 1.44 ±0.02
HH60 0.99 ±0.03 2.22 ±0.02 4.09 ±0.02 2.49 7.49 ±0.21 3.01 1.88 ±0.21 0.93 ±0.02 0.85 ±0.03 HH90 1.08 ±0.01 2.33 ±0.02 4.22 ±0.02 2.36 4.90 ±0.17 2.07 1.29 ±0.20 1.15 ±0.02 0.64 ±0.01
HT 1.14 ±0.02 2.40 ±0.01 4.28 ±0.03 2.27 7.01 ±0.33 3.08 <LOQ 0.74 ±0.01 1.17 ±0.02
aAC = amorphous content
32
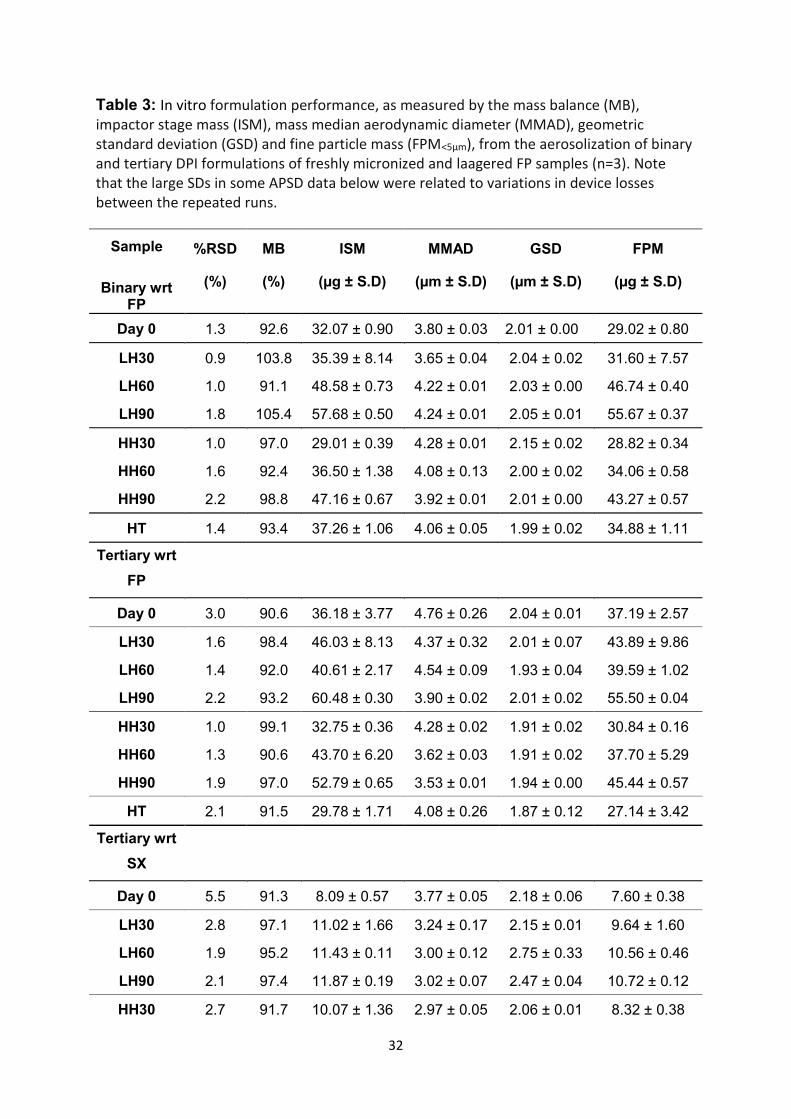
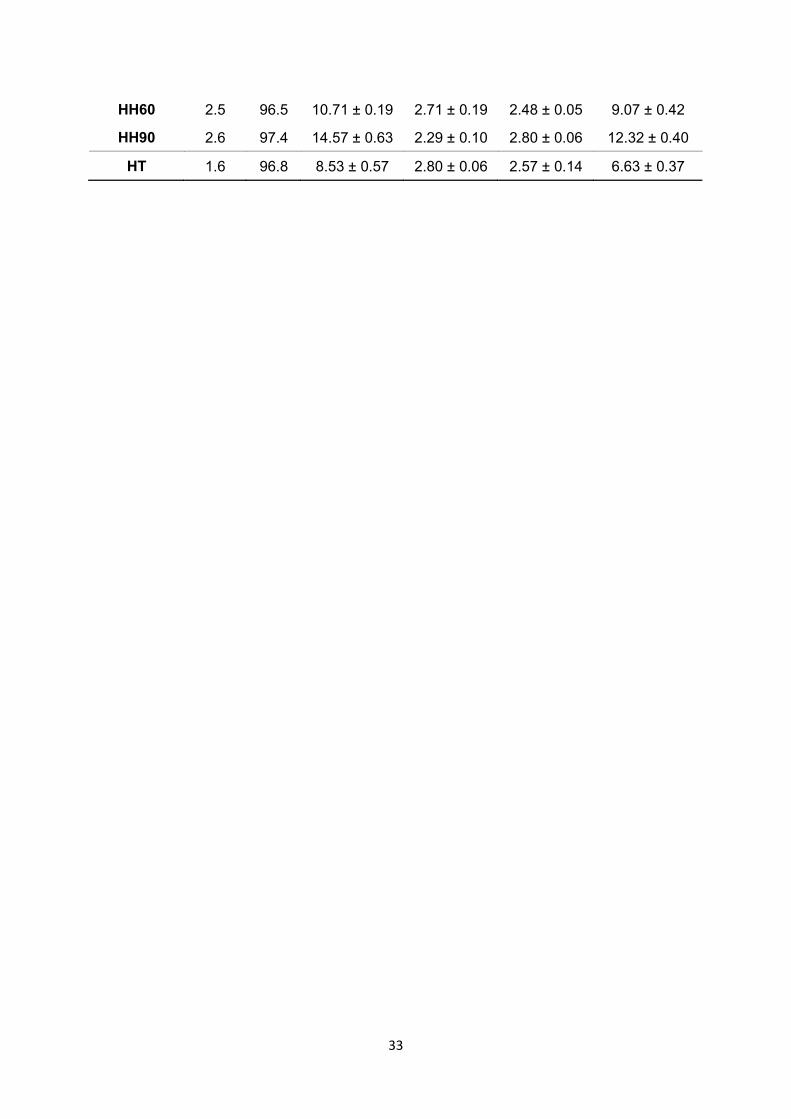
Table 3: In vitro formulation performance, as measured by the mass balance (MB), impactor stage mass (ISM), mass median aerodynamic diameter (MMAD), geometric standard deviation (GSD) and fine particle mass (FPM<5µm), from the aerosolization of binary and tertiary DPI formulations of freshly micronized and laagered FP samples (n=3). Note that the large SDs in some APSD data below were related to variations in device losses between the repeated runs.
Sample %RSD
(%)
MB
(%)
ISM
(µg ± S.D)
MMAD
(µm ± S.D)
GSD
(µm ± S.D)
FPM
(µg ± S.D) Binary wrt FP
Day 0 1.3 92.6 32.07 ± 0.90 3.80 ± 0.03 2.01 ± 0.00 29.02 ± 0.80
LH30 0.9 103.8 35.39 ± 8.14 3.65 ± 0.04 2.04 ± 0.02 31.60 ± 7.57
LH60 1.0 91.1 48.58 ± 0.73 4.22 ± 0.01 2.03 ± 0.00 46.74 ± 0.40
LH90 1.8 105.4 57.68 ± 0.50 4.24 ± 0.01 2.05 ± 0.01 55.67 ± 0.37
HH30 1.0 97.0 29.01 ± 0.39 4.28 ± 0.01 2.15 ± 0.02 28.82 ± 0.34
HH60 1.6 92.4 36.50 ± 1.38 4.08 ± 0.13 2.00 ± 0.02 34.06 ± 0.58
HH90 2.2 98.8 47.16 ± 0.67 3.92 ± 0.01 2.01 ± 0.00 43.27 ± 0.57
HT 1.4 93.4 37.26 ± 1.06 4.06 ± 0.05 1.99 ± 0.02 34.88 ± 1.11
Tertiary wrt
FP
Day 0 3.0 90.6 36.18 ± 3.77 4.76 ± 0.26 2.04 ± 0.01 37.19 ± 2.57
LH30 1.6 98.4 46.03 ± 8.13 4.37 ± 0.32 2.01 ± 0.07 43.89 ± 9.86
LH60 1.4 92.0 40.61 ± 2.17 4.54 ± 0.09 1.93 ± 0.04 39.59 ± 1.02
LH90 2.2 93.2 60.48 ± 0.30 3.90 ± 0.02 2.01 ± 0.02 55.50 ± 0.04
HH30 1.0 99.1 32.75 ± 0.36 4.28 ± 0.02 1.91 ± 0.02 30.84 ± 0.16
HH60 1.3 90.6 43.70 ± 6.20 3.62 ± 0.03 1.91 ± 0.02 37.70 ± 5.29
HH90 1.9 97.0 52.79 ± 0.65 3.53 ± 0.01 1.94 ± 0.00 45.44 ± 0.57
HT 2.1 91.5 29.78 ± 1.71 4.08 ± 0.26 1.87 ± 0.12 27.14 ± 3.42
Tertiary wrt
SX
Day 0 5.5 91.3 8.09 ± 0.57 3.77 ± 0.05 2.18 ± 0.06 7.60 ± 0.38
LH30 2.8 97.1 11.02 ± 1.66 3.24 ± 0.17 2.15 ± 0.01 9.64 ± 1.60
LH60 1.9 95.2 11.43 ± 0.11 3.00 ± 0.12 2.75 ± 0.33 10.56 ± 0.46
LH90 2.1 97.4 11.87 ± 0.19 3.02 ± 0.07 2.47 ± 0.04 10.72 ± 0.12
HH30 2.7 91.7 10.07 ± 1.36 2.97 ± 0.05 2.06 ± 0.01 8.32 ± 0.38
33
HH60 2.5 96.5 10.71 ± 0.19 2.71 ± 0.19 2.48 ± 0.05 9.07 ± 0.42
HH90 2.6 97.4 14.57 ± 0.63 2.29 ± 0.10 2.80 ± 0.06 12.32 ± 0.40
HT 1.6 96.8 8.53 ± 0.57 2.80 ± 0.06 2.57 ± 0.14 6.63 ± 0.37

34
Figures
Figure 1: X-ray powder diffraction profiles for Day 0, LH90, HH90 and HT FP
samples
35
Figure 2: Differential scanning calorimetry (DSC) thermographs for the Day 0, LH90,
HH90 and HT FP samples

36
Figure 3: Scanning Electron Micrographs for the Day 0 (A), HT (B), LH90 (C) and
HH90 (D) FP samples
A B
C D

37
Figure 4: Variations in the CAB ratios with respect to lactose monohydrate and SX
of micronized FP particles laagered under low and high relative humidity at 30, 60
and 90 day time points.

38
Figure 5: In vitro aerosolization performance of FP in binary DPI formulations upon
laagering a batch of micronized FP under low and high relative humidity for 30, 60
and 90 days. The corresponding CAB ratios with respect to lactose monohydrate
under such conditions are also plotted.

39
Figure 6: In vitro aerosolisation performance of SX in combination with FP in tertiary
formulations upon laagering a batch of micronized FP under low and high relative
humidity for 30, 60 and 90 days. The corresponding CAB ratios with respect to SX
under such conditions are also plotted.

40
Supplemental Figures
Figure S1: (A) Cohesion (Fcoh (FP-FP)) versus adhesion (Fcoh (FP-LAC)) plots of the
micronized FP sample (Day 0) and samples conditioned at low humidity (LH30,
LH60, LH90) with respect to lactose monohydrate, (B) Cohesion (Fcoh (FP-FP))
versus adhesion (Fcoh (FP-SX)) plots of the micronized FP sample (Day 0) and
samples conditioned at low humidity (LH30, LH60, LH90) with respect to SX.
A
B

41
Figure S2: (A) Cohesion (Fcoh (FP-FP)) versus adhesion (Fcoh (FP-LAC)) of the
micronized FP sample (Day 0) and samples conditioned at high humidity (HH30,
HH60, HH90) with respect to lactose monohydrate, (B) Cohesion (Fcoh (FP-FP))
versus adhesion (Fcoh (FP-SX)) of the micronized FP sample (Day 0) and samples
laagered at high humidity (HH30, HH60, HH90) with respect to SX.
A
B

42
Figure S3: (A) Cohesion (Fcoh (FP-FP)) versus adhesion (Fcoh (FP-LAC)) of the
micronized FP sample (Day 0) and samples conditioned at 60◦C (HT) with respect to
lactose monohydrate, (B) Cohesion (Fcoh (FP-FP)) versus adhesion (Fcoh (FP-SX)) of
the micronized FP sample (Day 0) and samples laagered at 60◦C (HT) with respect
to SX.
A
B