Municipal solid waste composition determination supporting the ...


ICCHT2010 - 5th International Conference on Cooling and Heating Technologies. Bandung, Indonesia
9-11 December 2010
126- 1
The Influence of Municipal Solid Waste Components
Composition on Main Parameters of Torrefaction
to Produce High-Calorie Solid Fuel
Amrul1, Aryadi Suwono2, Ari Darmawan Pasek2, Toto Hardianto2
1Lampung University, Bandar Lampung, Indonesia, [email protected]
2Bandung Institute of Technology, Bandung, Indonesia,
[email protected], [email protected],
ABSTRACT: Municipal solid waste is a mixture of various components of waste.
The composition of municipal solid waste varies from one place to another place.
In the process of municipal solid waste torrefaction, main parameters of
torrefaction, that is temperature and residence time is determined by the
composition of waste components. In this research carried out tests to determine
the influence of the composition of municipal solid waste components on the main
parameters of torrefaction to get the product as the high-calorie solid fuel. The
results showed that the torrefaction process on municipal solid waste which is
dominated by twigs and leaves produces the best calorific value at a temperature of
300C and the residence time of 45 minutes. While the torrefaction process on
municipal solid waste which is dominated by the food waste (rice, orange skin and
banana skins), best calorific value obtained at temperature of 275C and residence
time of 15 minutes.
Keywords: municipal solid waste, torrefaction, main parameters of torrefaction,
high-calorie solid fuel
1. INTRODUCTION
The world primary energy was still dominated by petroleum, natural gas, coal, nuclear, and
hydroelectric. The three largest sequence of the primary energy were the form of fossil fuels,
which would be exhausted in a short time. In Indonesia, the situation was even worse because
there is no use of nuclear energy, while hydroelectric had small portions, so that practically
only depended on petroleum, natural gas, and coal. Data from 2007 showed that consumption
of primary energy in Indonesia annually reached 114.6 million toe (tonnes oil equivalent) [1].
To ensure continuity of the domestic energy compliance, it would need to immediately find
new energy sources as an alternative energy that was renewable. The energy alternative has
two advantages at once that is as a substitute for fossil fuels and prevent global warming
caused the rate of CO2 production from burning fossil fuels. The alternative source promising
is biomass from agricultural residual and municipal solid waste.
The usage of municipal solid waste as solid fuel is a quick solution for the urban community
than composting the waste which require a long time process. However, the usage of municipal

ICCHT2010 - 5th International Conference on Cooling and Heating Technologies. Bandung, Indonesia
9-11 December 2010
126- 2
solid waste directly as a fuel has many obstacles because of the waste consists of multiple
components that are difficult to control the quality of combustion, as well as the nature of high
water content, so the waste is a poor fuel, which is characterized by a low calorific value. To
improve the properties of municipal solid waste as fuel, it takes a thermal process, where the
waste components undergo decomposition so it’s calorific value increase.
The continuous research joint with the research team of Thermodynamics Laboratory ITB
has produced solid fuel derived from municipal solid waste through a process Torrefaction [2].
The result is a solid fuel with quality equivalent to the calorific value of coal Subbituminous
(HHV) 4900-6800 kcal/kg.
Municipal solid waste is a mixture of various components of waste. The composition of
municipal solid waste components are different at each location and can also be changed from
time to time. The main parameters that influence torrefaction products are temperature and
residence time [3]. Torrefaction experiment on individual components of municipal waste
showed that the higher calorific value for organic components (twigs and leaves) is obtained at
higher temperature and longer residence time. Meanwhile, for the others components, ie, foods
waste (rice, orange skin and banana skin), the higher calorific value is obtained at a lower
temperature and shorter residence time [4]. This paper will discuss the influence of waste
composition to optimum temperature and residence time to produce high-calorie solid fuel.
2. WASTE TORREFACTION
Torrefaction is a thermal treatment process of solid material at temperature of 200-300C
and atmospheric pressure in absence of oxygen. Torrefaction has been applied to homogeneous
materials such as woody biomass and peat, and managed to increase its calorific value. In this
study will be developed the torrefaction method for multi-component used as a waste
processing technology. This method expected able to improve fuel characteristics of municipal
solid waste so that become high-calorie solid fuel, equivalent to subbituminous C coal
according to ASTM D 388 standard qualifications.
2.1. Sample Preparation
The samples used in this experiment are the combustible materials and any components that
not utilized by scavengers, i.e. biomass fraction and non-recycled plastics which come from
municipal solid waste. The sample composition can be divided into three main groups i.e. the
organic components (twigs and leaves), food waste (rice, orange skins and banana skins) and
non-recycled plastic (food packaging plastic)
Before experiment, samples are dried for approximately one week for consistency of
moisture until it is used. Samples used are also clean and dry. All sample material is cut into
small pieces. Twig chosen is the size of less than 1 cm in diameter and cut into approximately
1 cm long. Leaves, orange skin, banana skin and plastic, cut small with a size of about 1 cm2.
Rice is not treated specially, just maintained so as not to agglomerate in order to remain
appropriate grain size.
2.2. Methodology
Waste components that is varied in composition is the organic component and food waste,
because their amount is large enough, i.e. around 49% (organic) and 31% (food waste)
compared to plastic which is only about 8% of the total weight of municipal waste that can be
burned and not taken by scavengers [5]. For each experiment, the samples were mixed

ICCHT2010 - 5th International Conference on Cooling and Heating Technologies. Bandung, Indonesia
9-11 December 2010
126- 3
manually according to the each component proportion based on percent by weight to obtain the
total sample weight of 20 grams.
Torrefaction experiment conducted in two steps for each composition. First step is testing
for temperature variation and second step is testing for residence time variation. Testing for
temperature variation conducted to determine the optimum temperature that is the temperature
which gives the highest calorific value at certain composition. After that, at the optimum
temperature, testing for residence time variation conducted to obtain optimum residence time
that is the residence time which gives the highest calorific value. Composition and variation of
experimental parameters is showed in Table 1.
Table 1: Composition and parameters of torrefaction experiment.
Sample
Composition (wt-%), adb
Temperature (°C)
Residence time (min)
Organic waste
Food waste
Non-recycled plastic
Mixed-702010-T250t45 70 20 10 250 45
Mixed-702010-T275t45 70 20 10 275 45
Mixed-702010-T300t45 70 20 10 300 45
Mixed-702010-T300t15 70 20 10 300 15
Mixed-702010-T300t30 70 20 10 300 30
Mixed-207010-T250t45 20 70 10 250 45
Mixed-207010-T275t45 20 70 10 275 45
Mixed-207010-T300t45 20 70 10 300 45
Mixed-207010-T275t15 20 70 10 275 15
Mixed-207010-T275t30 20 70 10 275 30
2.3. Experimental Set-up
Waste torrefaction equipment is a bench-scale torrefaction reactor and use superheated
steam as medium. The schematic figure of torrefaction equipment is shown in Figure 1.
Figure 1: The schematic figure of torrefaction equipment.

ICCHT2010 - 5th International Conference on Cooling and Heating Technologies. Bandung, Indonesia
9-11 December 2010
126- 4
The sample was put in a stainless steel mesh container. The container was placed at the
center of reactor chamber, which was the main part of the apparatus. The chamber was heated
by an electrical heater and controlled electronically. The superheated steam got into the reactor
through a flow regulator valve. A centrifugal blower was needed for start up and shut down
purpose. The weight loss of sample was monitored with a digital balance and recorded by a
data acquisition system.
3. RESULTS AND DISCUSSION
3.1. Weight Loss of Experimental Sample
The graphs of weight loss for various samples of waste components, that is the relative mass
of specimens which measured at any time divided by the mass of initial sample obtained from
the experiment showed in Figure 2. Weight loss profiles of the samples with various
composition show the same pattern, where the rate of mass loss is relatively rapid at the
beginning of the process, then slow down and eventually tend to be asymptotic at end of the
process. For the same composition but varying in temperature process, the time taken until
reach a constant weight was more quickly for higher temperatures than the lower one. The
relative weight remains at the end of process is smaller for higher temperature at the same
composition.
Biomass which has a high content of hemicelluloses would undergo greater alterations in its
properties during torrefaction so that leave fewer solid product [6]. Torrefaction process on
mixed municipal solid waste which is dominated by food waste remains smaller relative weight
of sample than mixed municipal solid waste which is dominated by organic components. It
indicates that hemicelluloses content in the food waste is greater than in the organic waste.
Figure 2: Curve of weight loss for various temperatures of experimental samples.
0
20
40
60
80
100
120
0 300 600 900 1200 1500 1800 2100 2400
Mixed-702010-T250t45
Mixed-702010-T275t45
Mixed-702010-T300t45
Mixed-207010-T250t45
Mixed-207010-T275t45
Mixed-207010-T300t45
Rel
ativ
eM
ass
(%
)
Time (second)
ICCHT2010 - 5th International Conference on Cooling and Heating Technologies. Bandung, Indonesia
9-11 December 2010
126- 5
3.2. Calorific Value of Torrefaction Products
The calorific value of torrefaction products for municipal solid waste composition which
dominated by organic component is shown in Figure 3. Figure 3 (a) show the calorific value
obtained from the temperature variation, and Figure 3 (b) show the calorific value obtained
from residence time variation. Calorific value increases for higher temperature and longer
residence time. The highest calorific value was obtained at temperature of 300C and residence
time of 45 minutes, that is 5430 kcal/kg or increasing of 9% compared to calorific value of raw
materials in the same composition, that is 4980 kcal/kg.
(a) (b)
Figure 3: Graphs of calorific value of municipal solid waste which is dominated by twigs and leaves: (a) for various
temperatures and, (b) for various residence times.
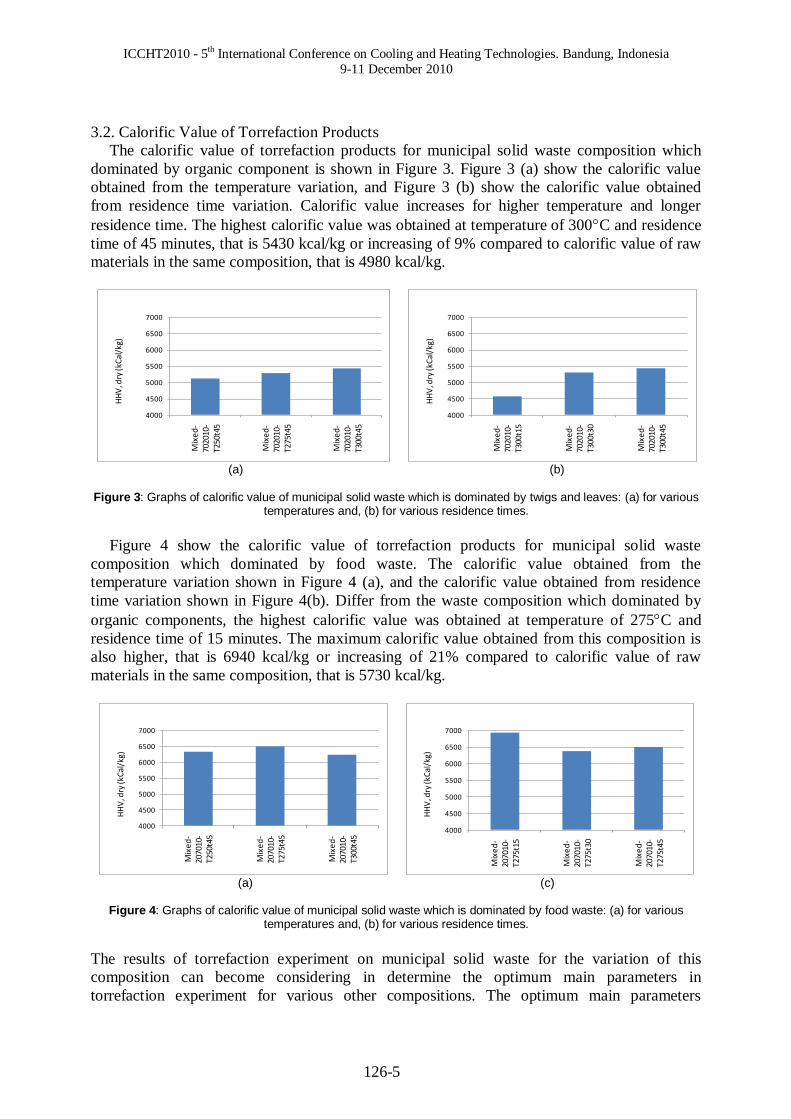
Figure 4 show the calorific value of torrefaction products for municipal solid waste
composition which dominated by food waste. The calorific value obtained from the
temperature variation shown in Figure 4 (a), and the calorific value obtained from residence
time variation shown in Figure 4(b). Differ from the waste composition which dominated by
organic components, the highest calorific value was obtained at temperature of 275C and
residence time of 15 minutes. The maximum calorific value obtained from this composition is
also higher, that is 6940 kcal/kg or increasing of 21% compared to calorific value of raw
materials in the same composition, that is 5730 kcal/kg.
(a) (c)
Figure 4: Graphs of calorific value of municipal solid waste which is dominated by food waste: (a) for various
temperatures and, (b) for various residence times.
The results of torrefaction experiment on municipal solid waste for the variation of this
composition can become considering in determine the optimum main parameters in
torrefaction experiment for various other compositions. The optimum main parameters
4000
4500
5000
5500
6000
6500
7000
Mix
ed
-70
2010
-T2
50t4
5
Mix
ed
-70
2010
-T2
75t4
5
Mix
ed
-70
2010
-T3
00t4
5
HH
V, d
ry (k
Cal
/kg)
4000
4500
5000
5500
6000
6500
7000
Mix
ed
-70
2010
-T3
00t1
5
Mix
ed
-70
2010
-T3
00t3
0
Mix
ed
-70
2010
-T3
00t4
5
HH
V, d
ry (k
Cal
/kg)
4000
4500
5000
5500
6000
6500
7000
Mix
ed
-20
7010
-T2
50t4
5
Mix
ed
-20
7010
-T2
75t4
5
Mix
ed
-20
7010
-T3
00t4
5
HH
V, d
ry (k
Cal
/kg)
4000
4500
5000
5500
6000
6500
7000
Mix
ed
-20
7010
-T2
75t1
5
Mix
ed
-20
7010
-T2
75t3
0
Mix
ed
-20
7010
-T2
75t4
5
HH
V, d
ry (k
Cal
/kg)

ICCHT2010 - 5th International Conference on Cooling and Heating Technologies. Bandung, Indonesia
9-11 December 2010
126- 6
(temperature and residence time) will produce solid fuel with the best calorific value and more
economical operating costs.
4. CONCLUSION
The main parameters of torrefaction process, temperature and residence time, is influenced by
the composition of municipal solid waste components. The optimum main parameter is
temperature and residence time that able to produce the solid fuel with the highest calorific
value. The composition of municipal solid waste which is dominated by twigs and leaves
produce the best calorific value (5430 kcal/kg) at relatively high temperatures and relatively
long residence time, that is 300C and 45 minutes. Meanwhile, the composition of municipal
solid waste which is dominated by food waste (rice, orange skins and banana skins), produce
the best calorific value (6940 kcal/kg) at not too high temperatures and relatively short
residence time, that is 275C and 15 minutes.
REFERENCES
[1] Hayward, T., 2008. BP Statistical Review of World Energy June 2008.
[2]Bergman, Patric C.A., Boersma, Arjen R., Kiel. Jacob H.A., 2004. “Torrefaction For
Entrained-Flow Gasification Of Biomass”, Energy Research Center of Netherlands (ECN),
Unit ECN Biomass, Einhoven.
[3]Amrul, Aryadi Suwono, and Ari Darmawan Pasek and Toto Hardianto, 2010. “A Study on
Indonesian Municipal Solid Waste Potential for High Calorific Solid Fuel by Torrefaction
Process”, Proceedings of the International Conference on Fluid and Thermal Energy
Conversion 2009, Tongyeong, South Korea.
[4]Aryadi Suwono, Amrul, Ari Darmawan Pasek and Toto Hardianto, 2010. “Solid Fuel From
Torrefied Municipal Solid Waste”, Proceedings of Renewable Energy 2010, 27 June-2 July,
2010, Pacifico Yokohama, Yokohama, Japan.
[5]Ari Darmawan Pasek, Toto Hardianto, Willy Adriansyah, dll., 2007, Laporan Akhir Studi
Kelayakan Pembangkit Listrik Dengan Bahan Bakar Sampah Di Kota Bandung, LPPM
ITB, Bandung.
[6]Bridgeman, T.G., Jones, J.M., Shield, I., Williams, P.T., 2007. “Torrefaction of Reed
Canary Grass, Wheat Straw and Willow To Enhance Solid Fuel Qualities and Combustion
Properties”, Fuel 87 (2008) 844–856.