
Vertical Shear-Wave Velocity Profiles Generated from Spectral
1
THE INFLUENCE OF MOISTURE, VERTICAL WIND SHEAR AND STORM MOTION ON THE RAINFALL DISTRIBUTION PATTERN OF TROPICAL CYCLONES IN THE
SOUTHERN GULF COASTAL STATES
By
Sanghoon Kim
A THESIS PRESENTED TO THE GRADUATE SCHOOL OF THE UNIVERSITY OF FLORIDA IN PARTIAL FULFILLMENT
OF THE REQUIREMENTS FOR THE DEGREE OF MASTER OF SCIENCE
UNIVERSITY OF FLORIDA
2017

2
© 2017 Sanghoon Kim

3
To my family and all who supported me

4
ACKNOWLEDGMENTS
I would like to say thank you for all who support me to finish the thesis. First, I
appreciate my advisor, Dr. Corene Matyas, for the guidance of my hurricane studies
during my master’s program. She tried not to give the answers immediately for questions,
but encouraged me to find the right direction to pursue research about hurricanes. She
has reviewed this thesis intensely to be publishable and is supported with a grant from the
National Science Foundation (BCS-1053864). Also, I would like to thank Dr. Mossa and
Dr. Binford for being members of my committee. I also thank the hurricane group
members, and especially Yao Zhou. They gave me helpful feedback for this research in
terms of datasets and methods.
Finally, I would like to dedicate all my appreciation to my family. My wife, my son,
my parents, and my brother gave me endless support to study in the United States.

5
TABLE OF CONTENTS
Page
ACKNOWLEDGMENTS ................................................................................................... 4
LIST OF TABLES ............................................................................................................. 6
LIST OF FIGURES ........................................................................................................... 7
ABSTRACT ....................................................................................................................... 8
CHAPTER
1 INTRODUCTION ....................................................................................................... 10
2 THE INFLUENCE OF MOISTURE, VERTICAL WIND SHEAR AND STROM MOTION ON THE RAINFALL DISTRIBUTIN PATTERN OF TROPICAL CYCLONE IN THE SOUTHERN GULF COASTAL STATES .................................... 21
Introduction ............................................................................................................................ 21 Literature Review ................................................................................................................... 21 Vertical Wind Shear and Storm Motion .......................................................................... 21 Tropical Cyclone Intensity .............................................................................................. 22 Topography ................................................................................................................... 22 ET process .................................................................................................................... 23 Moisture ......................................................................................................................... 24 Tropical Cyclone Rainfall and Total Precipitable Water .................................................. 24 Research Objectives .............................................................................................................. 26 Data and Methods ................................................................................................................. 27 Tropical Cyclone Datasets ............................................................................................. 27 Methods ......................................................................................................................... 29 The Results ........................................................................................................................... 34 TPW Conditions ............................................................................................................. 34 Vertical Wind Shear and Storm Motion .......................................................................... 37 Rainfall Patterns ............................................................................................................ 37 Rainfall Patterns by TPW, Vertical Wind Shear and Storm Motion ................................. 38 Discussion and Limitations .................................................................................................... 43
3 CONCLUSION ........................................................................................................... 63
LIST OF REFERENCES ................................................................................................. 67
BIOGRAPHICAL SKETCH ............................................................................................. 75

6
LIST OF TABLES
Table Page
2-1 The 12 selected storms (Western Group) that made landfall over from 1998 to 2015 .................................................................................................................. 46
2-2 The 17 selected storms (Central Group) that made landfall over Louisiana, Mississippi, Alabama, and the western Florida from 1998 to 2015 ...................... 46
2-3 The 14 selected storms (Eastern Group) that made landfall over Florida Peninsula from 1998 to 2015 ............................................................................... 47
2-4 The Mann-Whitney U Test results (p-values) of the averaged total TPW during 24 hours .................................................................................................... 48
2-5 The Mann-Whitney U Test results (p-values) of the averaged total TPW on the left side (Cells 1, 4, 7) of storm motion during 24 hours ................................. 48
2-6 The Mann-Whitney U Test results (p-values) of the averaged total TPW on the right side (Cells 3, 6, 9) of storm motion during 24 hours ............................... 49
2-7 The Mann-Whitney U Test results (p-values) of the averaged total TPW on the left side (Cells 1, 4, 7) versus on the right side (Cells 3, 6, 9) of the storm during 24 hours ..................................................................................................... 49
2-8 The Mann-Whitney U Test results (p-values) of the angle difference between vertical wind shear and storm motion between two groups .................................. 50
2-9 The Mann-Whitney U Test results (p-values) of the storm total volumetric rain over the entire outlined area between the left and the right side of storm motion at t00 by groups ........................................................................................ 50
2-10 The percentage of storms’ rainfall patterns that can be explained by TPW or vertical wind shear and storm motion ................................................................... 50

7
LIST OF FIGURES
Figure Page
1-1 The study region within the Gulf of Mexico and the Gulf coastal states in the U.S ....................................................................................................................... 20
2-1 Three regional groups with selected storm tracks every 3 hours from 24 hours prior to landfall to the time closest to landfall ............................................. 51
2-2 The amount of TPW at 00 UTC 29 August 2005 during the landfall of Hurricane Katrina ................................................................................................. 52
2-3 Regions where the rain rate exceeds of 5 mm hr-1 were selected for analysis ..... 53
2-4 The symmetry of TC rainfall distribution. .............................................................. 54
2-5 The boxplots for the averaged total TPW in the grid boxes surrounding storms by regional groups during 24 hours .......................................................... 55
2-6 The boxplots for the averaged total TPW on the left side (Cells 1, 4, 7) of storm motion by regional groups during 24 hours ................................................ 56
2-7 The boxplots for the averaged total TPW on the right side (Cells 3, 6, 9) of storm motion by regional groups during 24 hours ................................................ 57
2-8 The 40mm line of TPW boundary at t00 ............................................................... 58
2-9 The box plots for the averaged shortest distance between the storm centers and TPW contour line of 40 mm by regional groups during 24 hours .................. 59
2-10 The boxplots for the distance to TPW contour line of 40mm at t00 by the rainfall distribution pattern .................................................................................... 59
2-11 The averaged storm motion vector and the averaged vertical wind shear vector in quadrants by regional groups ................................................................ 60
2-12 The boxplots for the total volumetric rainfall over the entire outlined area at t00 by groups ....................................................................................................... 61
2-13 The boxplots for the volumetric rainfall over the entire outlined area between the left and the right side of storm motion at t00 by groups .................................. 61
2-14 The number of cases exhibiting each rainfall distribution patterns by group ........ 62

8
Abstract of Thesis Presented to the Graduate School Of the University of Florida in Partial Fulfillment of the
Requirements of the Degree of Master of Science
THE INFLUENCE OF MOISTURE, VERTICAL WIND SHEAR AND STORM MOTION ON THE RAINFALL DISTRIBUTION PATTERN OF TROPICAL CYCLONES IN THE
SOUTHERN GULF COASTAL STATES
By
Sanghoon Kim
August 2017
Chair: Corene Matyas Major: Geography
Tropical cyclones (TCs) cause a lot of damage to society when they make landfall
due to heavy rainfall and flash flooding. Many scientists have studied TC rainfall patterns
to improve the forecasting of TC rainfall in order to reduce the impacts of flooding.
However, there is still a need to improve the prediction of the spatial distribution of rainfall
so that forecasts can be more accurate. A large supply of moisture is required to sustain
TC rainfall production. When the relatively dry air that exists over the land surface
intrudes into a TC, less rainfall should be produced on that side of the storm due to
increased stability. Previous research has also found that of the vectors of vertical wind
shear and storm motion work together to determine TC rainfall patterns.
In this research, total precipitable water (TPW) surrounding TCs is analyzed along
with vertical wind shear and storm motion to investigate their influence on the symmetry of
TC rainfall at the time closest to landfall. The 43 storms that made landfall over the Gulf
states in the U.S. from 1998 to 2015 are analyzed. A Geographic Information System is
used to examine the TC rainfall patterns to determine if they are symmetrically distributed
on each side of the storm. The amounts of TPW on the left side and the right side of the

9
storm are compared for 24 hours prior to landfall to determine if they are significantly
different according to the results of Mann-Whitney U Tests. In addition, the shortest
distance between a contour line representing 40 mm of TPW and the storm center was
calculated to determine the proximity of the non-tropical air mass. Finally, the vector of the
vertical wind shear was analyzed in conjunction with the storm motion vector.
The results show that TC rainfall patterns vary regionally, and these variations are
related to moisture conditions, vertical wind shear and storm motion. TCs that made
landfall over the western Gulf states usually produced more rainfall on the right side of the
storm, and the rainfall patterns are influenced by not only shear/motion but also the dry air
mass from the continent. For TCs that made landfall over the central Gulf states, storms
usually produced more rainfall on the right side of the track, and the vertical wind shear is
the main factor influencing the rainfall distribution. Many storms among those that made
landfall over the Florida peninsula produced more rainfall on the left side of storm due to
enhanced convergence along a moisture boundary. In addition, the distance of < 330-340
km between a storm center and TPW values of 40 mm was a threshold for interaction
between the moist air mass from the TCs and a frontal boundary behind which a more dry
and cool air mass was found.

10
CHAPTER 1 INTRODUCTION
According to the National Hurricane Center (NHC), tropical cyclones (TCs)
generally are defined as organized rotating low pressure systems of clouds and
thunderstorms on the synoptic scale. TCs develop over tropical or subtropical oceans
when environmental conditions are ideal, including low amounts of vertical wind shear,
high sea surface temperatures (SSTs), low level positive vorticity and high moisture
content in the lower and middle troposphere (Gray 1968). When generated over the
Atlantic basin, TCs are classified according to their maximum sustained winds: tropical
depression (< 38 mph, 33 knots), tropical storm (> 39 mph, 34 knots, < 73mph, 63 knots),
hurricane (> 74 mph, 64 knots), and major hurricane (> 111 mph, 96 knots). On average,
13 Atlantic tropical storms and hurricanes have occurred per year in the twenty-first
century (Landsea et al., 2010).
During the development cycle of TCs over the ocean, the low-pressure region near
the surface causes convergence of air which rotates counterclockwise in the northern
hemisphere due to the pressure gradient force (PGF), the Coriolis force, centrifugal force
and friction. As TCs intensify, their wind speeds increase which enhances evaporation of
warm ocean surface water, and convergence forces the warm moist air to arise. The
moisture-laden air spirals upwards near the storm center and condensation creates
clouds in a band about 10–20 km wide. There is a warm core inside of the TC due to
latent heat exchange as the air cools with height (Emanuel, 2003; Frank, 1977). In
addition, the condensed moisture releases the latent heat into the atmosphere, causing
the air to expand outside away from the TC center, causing divergence at the upper
levels. Eventually, the air above the storm center begins to sink to the surface, causing
the formation of an eye, which is a region about 5–50 km in radius with calm winds and a

11
clear sky (Frank, 1977). Outside the eyewall, spiral rain bands are observed, with deep
convective cells and stratiform precipitation (Willoughby 1978, Barnes et al., 1990). The
rain bands are formed near the eyewall first and propagate hundreds of kilometers
outward (Senn and Hiser, 1959) in regions where moisture convergence occurs. The size
of Atlantic basin TCs as measured by the radius of the outermost closed isobar varies
55–1030 km, and 90% of TCs are observed to be less than 555 km in radius (Kimball and
Mulekar, 2004). In addition, Matyas (2010b) revealed that the edges of hurricane rain
fields are located within the size of the radius of the outermost closed isobar from 90% of
the TC observations between 1998 and 2008, and Guo and Matyas (2016) showed that
TC rain fields are correlated positively with TC size as measured by the radius of gale-
force winds.
When the center of a TC moves across the coast and over the land surface, it is
classified as having made landfall. After landfall, TCs may dissipate depending on the
surface roughness and depletion of evaporation for the storm’s core. Over the land, the
increase of surface roughness enhances the moisture inflow of the boundary layer into
the storm’s core, leading more convection and precipitation. However, this increased
updraft causes stronger adiabatic cooling. In addition, the inefficiency of the land surface
evaporation and the dry air advection from the continent into storm core leads to the
depletion of humidity and latent heat exchange, inhibiting the production of precipitation,
ultimately leading to decay (Tuleya and Kurihara, 1978).
If TCs move into the mid-latitudes, they can undergo extratropical transition (ET)
by interacting with an upper-level trough and the polar jet stream. The ET process causes
TCs to lose their warm core and gain the characteristics of an extratropical storm, and the
process can be divided into two stages, transformation and reintensification stages.

12
During the transformation stage, TCs interact with the baroclinic system in the mid-
latitudes, translation speed increases, storm intensity decreases, and the structure of the
storm is distorted. A baroclinic zone, defined by National Oceanic and Atmospheric
Administration (NOAA), is a broad region where a thermal gradient exists on a constant
pressure surface, and it is associated with vertical wind shear which is referred to as a
difference of wind speed and/or direction between the higher-level and lower-level
atmosphere. Afterward, some storms may dissipate while others may experience the
reintensification stage. In the reintensification stage, a transformed TC reintensifies by
interacting with the upper-tropospheric divergence and positive vorticity advection (PVA),
developing a cold core and frontogenesis (DiMego and Bosart, 1982: Foley and
Hanstrum, 1994; Klein et al., 2000; Matano and Sekioka, 1971; Palmen, 1958). It usually
takes 1-3 days for storms to complete ET (Matyas 2010a; Kitabatake 2011; Zagrodnik
and Jiang 2013). Climatologically, the transition of Atlantic TCs happens frequently
between the latitudes of 30° and 50° N, and between 1950 and 1996, 46% of Atlantic TCs
experienced an ET phase (Hart and Evans, 2001). Among TCs that have made landfall
over Florida since 1998, almost 60% of them completed an ET (Matyas 2014). When
transitioning into an extratropical cyclone, TC rain fields become asymmetrical and
disperse away from the storm center (Zick and Matyas 2016) but may continue to grow in
areal coverage (Atallah et al. 2007; Matyas 2013; Zhou and Matyas, 2017), thereby
producing rainfall far inland from the point of landfall. However, not all TCs dissipate or
transform into extratropical cyclones after making landfall. For example, Tropical Storm
Erin (2007) re-intensified due to moist soils from heavy rainfall, which increased water
vapor and evaporation in the boundary layer, providing the latent heat exchange
necessary to regenerate the low-pressure center. (Anderson and Shepherd, 2013; Kellner

13
et al., 2012).
When TCs make landfall, they can cause many casualties from high rainfall totals,
flash floods, strong winds, and storm surges, and tornadoes (Rappaport, 2000.
Rappaport, 2014). Water-related incidents from Atlantic TCs accounted for roughly 90%
of the total deaths for the 50-year period from 1963 to 2012, and rainfall-induced
freshwater floods and mudslides were responsible for 27% of the total deaths for the
same period (Rappaport, 2014). In response to global warming, several numerical
simulations suggest that storm intensity and TC rainfall rates will increase, although the
overall frequency of TC events will decrease (Knutson and Tuleya, 2004; Knutson et al.,
2010; Knutson et al., 2013; Trenberth 2005; Zhao and Held, 2012). In addition, the
economic damage caused by TCs is expected to increase and be concentrated in North
America by the year 2100 due to infrastructure and housing growth in the coastal zone
(Mendelsohn et al., 2012). Therefore, it is important to have a better understanding of TC
precipitation and its spatial patterns to reduce vulnerability and increase resilience against
natural hazards caused by TC activity.
Many studies have been done to find which factors influence TC rainfall and its
distribution patterns to improve the accuracy of TC rainfall prediction. TC rainfall and its
distribution are influenced by various factors, such as vertical wind shear, storm motion,
storm intensity, topography, ET, and moisture availability (Chen et al., 2006; Knutson et
al., 2004; Lonfat et al., 2004; Lonfat et al., 2007; Matyas, 2008).
Vertical wind shear and TC motion are critical factors that produce asymmetrical
rain fields. High vertical wind shear has an impact on TC structure, tilting the TC vortex
and causing the upward motion on the downshear side of the eyewall which is tilted to the
surface and downward motion on the upshear side. Also, storm’s cyclonic motion can

14
transport moisture in counterclockwise rotation. Therefore, storms are likely to have more
rain on the downshear left side (Chen et al., 2006; Corbosiero and Molinari, 2002;
DeMaria, 1996; Jones, 1995; Matyas, 2010b; Raymond, 1992). In addition, a short time
lag of less than 6 hours exists for vertical wind shear to influence TC rainfall distribution
(Wingo and Cecil 2010).
The asymmetrical distribution of TC rainfall can be influenced by a TC’s motion as
well. It is found that heavier rainfall could be produced on the front to front-right quadrants
of TC motion. This is because frictional updraft and winds are stronger at the front of the
storm, enhancing low-level convergence in the TC boundary layer (Corobosiero and
Molinari, 2003; Lonfat et al., 2004; Shapiro, 1983). As a result, TCs that have faster
translation speed than those with slower translation speeds experience stronger frictional
convergence, resulting in a larger rainfall asymmetry (Corbosiero and Molinari, 2003;
Lonfat et al., 2004; Matyas, 2010a). When strong vertical wind shear (> 5 m s-1) is across
the storm motion, the combined motion (front right) and shear (downshear left)
components overlap, causing storms to produce an asymmetrical rainfall distribution.
However, if vertical wind shear is weak (< 5 m s-1) and along the track, the storm
produces a symmetrical rainfall distribution across the front side of the storm (Chen et al.,
2006).
TC intensity is another factor that can influence the spatial distribution of TC
rainfall. More intense TCs have stronger vorticity that produces more swirling winds and
convection, resulting in stronger storm structure with more symmetrical rainfall patterns
than less intense TCs. Also, this stronger spiral wind can transport and redistribute more
precipitation around the entire storm. As a result, the distribution of TC rainfall is likely to
become broader while TC intensity increases (Lonfat et al., 2004; Rodgers and Adler,

15
1981). Previous studies have confirmed that at maximum intensity, TCs have the most
circular, compressed, and symmetrical distribution of clouds and rainfall (Dvorak 1975,
Zick and Matyas 2016).
Topography is also related to TC rainfall. Strong orographic lifting is often
generated on the windward side of mountains. When TCs pass over a mountain range,
their vorticity advection upstream is enhanced by the orographic effect, causing heavy
rainfall on the windward side (Lin and Savage, 2011) For example, Hurricane Camille
(1969) produced up to 686 mm of rainfall in one place during 12 hours along the slope of
the Appalachian Mountains in central Virginia (Schwarz, 1970). However, even small
changes in elevation such as that occurring near the Edward’s Plateau in central Texas
can enhance precipitation as a TC passes nearby (Matyas 2007). In addition, topographic
barriers can also block low-level moisture, reducing the moisture supply for TCs (Bender
et al., 1985; Schubert et al., 1998).
TC rainfall patterns can be impacted by ET process (Atallah and Bosart, 2003). In
the case of Hurricane Floyd, the rainfall distribution was influenced by a mid-latitude
weather system during ET. The cool and dry air mass from a mid-latitude trough met the
warm and moist air masses of Floyd, producing a tropospheric-deep baroclinic zone. This
new environment changed the structure of Floyd, and therefore, the heaviest rainfall was
produced on the left side of the storm (Atallah and Bosart, 2003). Although rainfall
decreases behind the storm center, isentropic uplift such as warm air advection in the
broad area ahead of the storm can cause the total raining area to increase during the ET
process (Matyas 2013) and be more dispersed away from the storm center (Zick and
Matyas 2016).

16
Moisture and its phase change are one of the most important factors in producing
clouds and precipitation. As a result, it is important to understand the linkage between the
moisture availability around TCs and the amount of TC rainfall or TC rainfall patterns. For
example, sea surface temperatures (SSTs) are related to moisture availability. Higher
SSTs produce more water vapor in the lower troposphere, generating more energy for
atmospheric convection, which is associated with thunderstorm clouds. Therefore, TC
rainfall rates are likely to increase in the vicinity of higher SSTs due to more water vapor
in the atmosphere (Holland, 1997; Knutson et al, 2010; Trenberth, 2005). Matyas and
Cartaya (2009) also found that increasing atmospheric moisture surrounding the storms
that traveled with a slow forward velocity caused increased rainfall accumulation when
contrasting Hurricanes Frances (2004) and Jeanne (2004) during their passage over
Florida.
Encountering a relatively dry continental air mass can limit rainfall production
and/or cause an asymmetrical rainfall pattern to develop. For TCs approaching land in the
northern hemisphere, more rainfall was produced on the right side of the storm, and the
shape of the rain field was asymmetrical due to dry air intrusion from the land (Chan et al.,
2004; Kimball, 2008). This is because the relatively dry air at the low level from the
continental land mass surrounds the TC from the left and penetrates into the storm at
higher altitudes. As a result, atmospheric stability on the left side of the storm increases,
inhibiting convection development, and instability of the right side increases with more
convection, causing an asymmetry in rainfall distribution. Also, modeling and
observational studies have shown that TCs can reach greater sizes when environmental
moisture surrounding the storm is relatively high (Hill and Lackmann 2009, Matyas and
Cartaya 2009, Matyas 2010b). Furthermore, a time lag exists between an increase in
17
available moisture and increase in TC rainfall production. Jiang et al. (2008) found that
there is a 12-hour time lag between volumetric rain and the combination of maximum TC
wind speed and total precipitable water (TPW), and Matyas (2010) also found a 12-hour
lag between changes in relative humidity and rainfall extent in hurricanes making landfall
along the U.S. coastline.
Due to the complicated TC structure and its production of rainfall it is still difficult to
get an accurate forecast of rainfall from TCs in coastal areas (Jiang et al., 2008; Villarini
et al., 2011). Relatively few studies have examined environmental moisture conditions
surrounding TCs during landfall and no previous research has investigated the symmetry
of TC rainfall in conjunction with moisture distribution and vertical wind shear/storm
motion components according to the location of U.S. landfall.
Jiang et al. (2008c) found that TPW can be used as a parameter of moisture
conditions to improve the accuracy of TC rainfall prediction. It is defined as the total water
vapor in a column of the atmosphere from the surface to the top of the atmosphere and it
is a part of the moisture budget. As a result, many studies have used TPW to examine the
relationship between atmospheric moisture and TC rainfall. Rogers and Pierce (1995)
found that TPW was associated with the precipitation distribution in the case of Typhoon
Bobbie 1992. The influx of moist (TPW greater than 50mm) or dry air into Typhoon
Bobbie 1992 initiated or reduced convective rain bands in its outer-core region. Jiang et
al. (2008a, 2008b) investigated the cases of Hurricane Isidore (2002) and Lili (2002) by
using moisture budget as well. They found that Isidore had more rainfall and larger rain
fields than Lili, because Isidore was wetter and its environment had more humidity. Also,
in the two cases, they found that moisture convergence and TPW are very important
factors to produce and maintain the heavy rainfall before a TC makes landfall. Another

18
study by Jiang et al. (2008) revealed that TC rainfall over both land and ocean is highly
correlated with the combination of TPW and TC maximum wind speed, while TPW and
proximity to land were the key predictors of TC rainfall over Puerto Rico as discovered by
Hernandez and Matyas (2016). Due to the importance of the TPW, it even has been used
to study the frequency of TC formation (Matyas, 2015).
Therefore, this research investigates how the spatial patterns of TC rainfall differ
according to the TPW spatial patterns surrounding the TCs as well as variations in
topography, vertical wind shear and storm motion. This research has three main steps.
First, the spatial patterns of TPW surrounding each TC are measured and compared
regionally to find a linkage between the distribution patterns of TC rainfall and the TPW
conditions. The second step is to analyze the regional variations in the speed and
direction of the vertical wind shear vector and its influence on the symmetry of TC rainfall
distribution. Third, the symmetry of TC rainfall at the time closest to landfall are measured
and compared among different landfall regions along the U.S. Gulf Coast. The main
hypothesis is that the spatial pattern of TC rainfall at the time closest to landfall will differ
according to the spatial pattern of TPW and the vectors of vertical wind shear/storm
motion and that these conditions vary regionally across the U.S. Gulf Coast.
This study examines 43 storms attaining at least tropical storm intensity during 24
hours before the time closest to landfall from 1998 to 2015. A Geographic Information
System (GIS) is mainly utilized to analyze the data of TC tracks, TC rainfall patterns and
TPW conditions. The Mann-Whitney U Tests are calculated to test the hypothesis. Figure
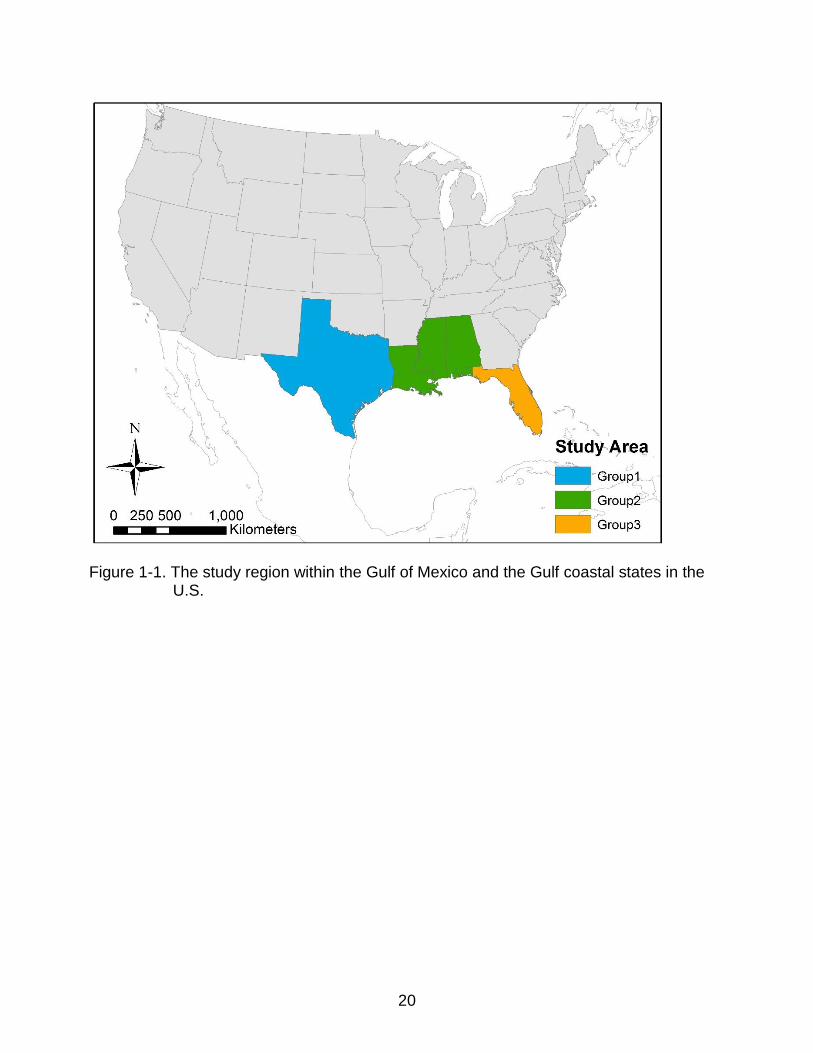
1-1 shows the study area of this research. In Chapter 2, the data and the research
methods are explained with details. Also, results will be discussed. Chapter 3 consists of

19
the TC research in Geography, the summary of the research, the contribution to literature,
and the future research plan.
20
Figure 1-1. The study region within the Gulf of Mexico and the Gulf coastal states in the U.S.

21
CHAPTER 2
THE INFLUENCE OF MOISTURE, VERTICAL WIND SHEAR AND STORM MOTION ON THE RAINFALL DISTRIBUTION PATTERN OF TROPICAL CYCLONES IN THE
SOUTHERN GULF COASTAL STATES
Introduction
Tropical cyclones (TCs) are one of the most destructive and dangerous single
events in the atmosphere as they can bring strong winds and heavy rainfall when moving
over land. In the history of Atlantic TCs from 1963 to 2012, water-related hazards from
TCs were responsible for approximately 90% of the total deaths, and 27% of deaths were
associated with freshwater floods and mudslides caused by heavy rainfall from TCs
(Rappaport, 2014). By the year 2100, it is expected that the financial damage caused by
TCs will increase and will be concentrated in North America, causing approximately $ 26
billion damage per year due to population and income growth in the coastal regions
(Mendelsohn et al., 2012). Although forecasts of TC tracks have improved significantly
(McAdie and Lawrence, 2000), the forecast of TC rainfall in coastal areas still remains a
difficult problem due to the complicated process of precipitation formation in TCs (Jiang et
al., 2008c; Villarini et al., 2001).
To improve TC rainfall forecasts, it is important to understand the processes that
control the spatial distribution of rainfall about the storm center. Through both modeling
and observational studies, previous researchers determined that environmental factors
such as vertical wind shear, storm motion, storm intensity, topography, extratropical
transition (ET), and moisture are key components that contribute to TC rainfall patterns
(Chen et al., 2006; Jiang et al., 2008a; Knutson et al., 2004; Lonfat et al., 2004; Lonfat et
al., 2007; Matyas, 2008).
Literature Review
Vertical Wind Shear and Storm Motion
22
High vertical wind shear and storm motion are the dominant factors for
asymmetrical TC rainfall distribution (Corbosiero and Molinari 2003; Chen et al., 2006,
Rogers et al. 2003). Vertical wind shear tilts the vortex of TCs as faster winds occur in the
upper troposphere and slower winds exist in the lower troposphere. As the vortex adjusts
to the tilt, upward motion is generated on the downshear side in which the direction of
tilted axis faces to the surface with downwind, enhancing more convection near the
eyewall and propagating cloud and precipitation outward, while downward motion is
enhanced on the upshear side which limits rainfall production, resulting in more rainfall on
the downshear side (Chen et al., 2006; Corbosiero and Molinari, 2002, 2003; DeMaria,
1996; Jones, 1995; Matyas 2010b). Chen et al (2006) also revealed that if the speed of
vertical wind shear exceeds of 5 m s-1, TC rainfall patterns are likely to be influenced by
vertical wind shear regardless of storm motion. If not, the rainfall patterns are determined
by storm motion, more rainfall on the front to front-right side of vortex due to stronger
frictional convergence ahead of the storm (Corbosiero and Molinari, 2003; Lonfat et al.,
2004; Matyas, 2010a).
Tropical Cyclone Intensity
In addition, TC rainfall patterns are also influenced by TC intensity. If TC intensity
increases, the storm’s cyclonic motion becomes faster and stronger, forcing more swirling
wind upwards with a better-developed storm structure that produces more symmetrical
rainfall patterns. In addition, TC rainfall distributions become wider because rainfall can be
redistributed by stronger spiral winds. However, weaker TCs produce more asymmetrical
rainfall patterns (Lonfat et al., 2004; Rodgers and Adler, 1981).
Topography

23
Topography can cause either heavy rainfall or less rainfall from storms. Lin and
Savage (2011) found that a storm can produce more heavy rainfall on the windward side
when the moisture transported by the storm that approaching to land is blocked by
mountains. As a result, if moisture influx from the Gulf of Mexico is blocked by
topographic barriers such as North America Cordillera, moisture convergence can occur
with the dry or cool air mass from the continent, causing heavy rainfall over Great plains
in the U.S. (Schubert et al. 1998). However, the topographic barriers can inhibit low-level
moisture transport from the west side of mountains to Texas or the east side of Mexico
(Bender et al., 1985, Schubert et al., 1998). Therefore, moisture supply can be limited for
the left side of the storm that making landfall over Texas.
ET process
TC rainfall patterns are also influenced by the ET process. If TCs move into the
mid-latitudes, they can transform into extratropical cyclones by interacting with a mid-
latitude weather system such as upper-level trough or a frontal boundary (DiMego and
Bosart, 1982: Foley and Hanstrum, 1994; Klein et al., 2000; Matano and Sekioka, 1971;
Palmen, 1958). The interaction between the cool and dry air mass from a mid-latitude
trough and the warm and moist air mass from TCs produces a deep baroclinic zone that
provides a mechanism for convergence and uplift of tropical moisture that promotes
heavy rainfall on the left side of the storm (Atallah and Bosart, 2003). In the new
environment, TCs are transformed by increasing the storm speed, decreasing TC
intensity and having distorted storm’s structure, resulting in the loss of warm core.
Afterward, if TCs interact with the upper-tropospheric divergence and positive vorticity
advection (PVA), a cold core and frontogenesis is developed instead with isentropic uplift

24
in the broad area ahead of the storm. As a result, the rain field is more dispersed away
from the storm center (Zick and Matyas 2016).
Moisture
A sufficient supply of moisture in the atmosphere is required for TC formation and
rainfall production. Although TCs are driven by gaining energy from the evaporation of
moisture in the boundary layer (Elsner and Kara, 1999; Frank 1977), there has been a
limited amount of research examining the relationship between moisture and TC rainfall
distribution patterns during and after landfall. TCs can produce asymmetrical rainfall
patterns when they approach land due to the influx of dry air mass (Chen et al., 2004;
Kimball, 2008). When the drier air from the continental land masses flows
counterclockwise around the left side of northern hemisphere TCs and penetrates into the
TC core, the atmospheric instability on the left side decreases, which limits rainfall
production. However, storms can gain large amounts of moisture over warm ocean waters
from their equatorward side as they approach land, and the moisture increases instability
and rainfall production on the right side of the storm. As a result, TCs may produce less
rain on the left side and more rain on the right side when encountering a somewhat drier
continental air mass ahead and left of its circulation center. Therefore, it is important to
examine the amount and spatial distribution of moisture to better predict where a TC will
produce rainfall once over land.
Tropical Cyclone Rainfall and Total Precipitable Water
Jiang et al. (2008c) suggested that the accuracy of TC rainfall forecasts can be
improved by using total precipitable water (TPW) as a parameter of moisture conditions.
TPW is the total water vapor in a column of the atmosphere from the earth’s surface to
the top of the atmosphere. The amount of TPW over regions where TCs form is
25
approximately 40-50 mm globally (Chu 2002; Inoue et al., 2002; Matyas 2015). Rogers
and Pierce (1995) revealed that the influx of moist (TPW greater than 50 mm) or dry air
(TPW less than 50 mm) surrounding Typhoon Bobbie 1922 was related to the
precipitation pattern by initiating or reducing convective rain bands in its outer-core region.
Jiang et al. (2008a, 2008b) assessed the moisture budgets of Hurricanes Isidore (2002)
and Lili (2002). They found that Isidore produced more rainfall than Lili because the
environment for Isidore was wetter and TPW was crucial for the moisture convergence
needed to produce heavy rainfall from large-sized TCs. Hernandez Ayala and Matyas
(2016) showed that TPW and proximity to land were responsible for variations in TC
rainfall totals and their spatial patterns over Puerto Rico.
Because a TC must gather moisture from a large radius (Trenberth et al. 2003) and
moisture converges towards the TC center to generate its rain fields, there is a lag
between the onset of increased or decreased moisture in the TC’s surrounding
environment and its effect on rainfall production. Jiang et al. (2008c) found that the
combination of TPW and TC maximum wind speed is highly positively correlated with TC
rainfall over land and ocean with 12-hour time lag between TPW and TC rainfall.
Therefore, it is important to examine how the amount of available moisture changes as a
TC approaches land to predict the rainfall pattern.
Although it has been established that TPW is an important component of TC
precipitation production, no previous research has studied the symmetry of TC rainfall in
conjunction with TPW distribution patterns for the TCs that made landfall over the U.S.
The moisture content of air masses present over the southern U.S. differs regionally,
becoming increasingly wetter toward the east (Thornthwaite 1931). Also, more moisture
exists over the ocean than the land (Trenberth et al., 2011). The distribution of TPW

26
varies according to whether a TC moves into a hot and dry continental air mass, or
encounters a relatively cool and dry air mass associated with a middle latitude trough or a
frontal system.
Research Objectives
Given the spatial variation of moisture in the southern U.S. and the importance of
moisture for rainfall production in TCs, the main objective of this research is to investigate
whether symmetrical or asymmetrical patterns of volumetric rainfall develop with respect
to the left and right side of the storm as they make landfall over the Gulf Coast of the U.S.
and whether these patterns coincide with the spatial distribution of TPW as well as the
vectors of vertical wind shear and storm motion. We examine with the amount of TPW on
each side of the storm and measure the distance between the storm center and the
contour line representing 40 mm of TPW to determine if a different air mass exists close
to the storm’s circulation. As the direction of storm motion influences where rainfall
develops with respect to the storm center and motion vectors vary regionally in Gulf of
Mexico shifting from northwest to northeast direction toward the east (Ho et al., 1987), the
43 TCs examined are placed into three groups based on the landfall location and the
storm motion direction (Figure 2-1, Table 2-1, 2, 3). The data for the amount of volumetric
rainfall at the time closest to landfall and spatial characteristics of TPW during the 24
hours prior to landfall are analyzed within a Geographic Information System (GIS). The
results of Mann-Whitney U tests reveal whether TCs in each landfall location group have
different median values of moisture and volumetric rainfall, and whether these
relationships change during the 24-hour period surrounding landfall. Less moisture should
be present on the left side of TCs that made landfall over the western and central Gulf
Coast due to the dry continental air mass causing less rain on the left side of the TCs.

27
However, more moisture should surround TCs and rainfall should be more symmetrically-
distributed ahead of TCs that made landfall over the eastern Gulf because the Florida
peninsula is so narrow that moisture can be supplied from the Atlantic Ocean, creating a
more symmetrical rainfall pattern.
The second goal is to determine how frequently the relationship between vertical
wind shear and storm motion accounts for the spatial pattern of rainfall along with or in
spite of the spatial distribution of moisture. The atmospheric flow has a strong westerly or
southwesterly component over the study region during the hurricane season, meaning
that rainfall should be enhanced east and north of the storm center (Corbosiero and
Molinari 2003, Goldenberg and Shapiro, 1996). All TCs examined have a strong
northward component to their motion, with TCs in the west Gulf having a stronger
westward component and those in the east Gulf a stronger eastward component. If the
directions of storm motion and vertical wind shear are compared, the angle difference
should vary regionally to produce more rainfall on the right side of the storm in the west
and central Gulf, but similar directions of shear and motion vectors for TCs in the east
Gulf should lead to rainfall that is either symmetrical or left of the storm center. Mann-
Whitney U tests are conducted to test these hypotheses as well.
Data and Methods
Tropical Cyclone Datasets
Data from the Tropical Rainfall Measuring Mission (TRMM) 3B42 product were
utilized to determine if TC rainfall was distributed symmetrically or asymmetrically on the
left or right side relative to TC track at the time closest to landfall. Three-hourly data
pertaining to rain rates are available since January 1998. Therefore, the period of study
from 1998 to 2015 was chosen due to the availability of TRMM data. The 3B42 dataset is
produced by combining both microwave and infrared precipitation estimates from the
28
TRMM satellite (Huffman et al., 2007). The products are improved by adding rain gauge
data, ground-based radar data, and data from other satellites (Huffman and Bolvin, 2012).
The TRMM dataset covers areas from 50°N to 50°S in latitude and 180°W to 180°E in
longitude, with 0.25° x 0.25° pixels as the spatial resolution, which is approximately 27 km
at the equator. This dataset has the limitation that high rain (>5 mm hr-1) is
underestimated and light rain (≤1 mm hr-1) is overestimated over the land and the ocean
(Chen et al., 2013). In addition, the rain rate is measured differently over the ocean and
the land because two different algorithms are employed (Kummerow et al., 2001).
TPW data were obtained from the North American Regional Reanalysis (NARR)
dataset (Mesinger et al., 2006), derived from the National Oceanic and Atmospheric
Administration’s (NOAA) National Centers for Environmental Prediction (NCEP) Eta
Model with the Regional Data Assimilation System (RDAS) using historical observations
across the North American region. The spatial resolution is about 0.3° which is 32 km at
the lowest latitude (1 N). The temporal resolution is 3 hourly from January 1979 to the
present, and the unit of TPW is mm or kg m-2 which is the instantaneous amount at the
time. Zick and Matyas (2015 a, b) showed that since 1998, this reanalysis dataset is
competitive in TC research by comparing TC position and structure with another
reanalysis dataset and by comparing TC precipitation with TRMM 3B42.
Vertical wind shear data were obtained from the Statistical Hurricane Intensity
Scheme (SHIPS) database of NCEP Global Forecast System (GFS) model analysis
(DeMaria et al., 2005). The wind vectors between 200-800 km radius from storm centers
are averaged and the vector differences between 850 and 200 hPa are computed for the
wind speed and the direction. As vertical wind shear values are only available with 6
hourly temporal resolution at UTC 00, 06, 12, and 18, the data were interpolated lineally
29
every three hours to match with the TRMM and NARR data sets (Matyas 2013). However,
wind shear data from SHIPS stopped before the time closest to landfall for several storms
(Earl 1998, Mitch 1998, Harvey 1999, Gordon 2000, Matthew 2004, and Barry 2007). The
available data from the time closest to landfall (3-6 hours away in most cases) was used
for these storms because the vector of wind shear was fairly consistent over the 24 hours
leading up to the final observation.
The International Best Track Archive for Climate Stewardship (IBTrACS) was used
to determine the position and intensity of each TC (Knapp et al., 2010). IBTrACS provides
the position of the storm center and storm intensity every six hours (00, 06, 12, and 18
UTC). As the TRMM and NARR data sets have a three-hour temporal resolution, TC
positions were lineally interpolated every three hours to match these datasets. In addition,
previous research has shown that there is a time lag of 12-24 hours for the influence of
environmental conditions on TC structure (Jiang et al., 2008c; Matyas, 2010b). Therefore,
this study examined environmental moisture at landfall and during the preceding 24
hours. Time periods were designated as landfall 00 (t00), and 3 (t03), 6 (t06), 9 (t09), 12
(t12), 15 (t15), 18 (t18), 21 (t21), and 24 (t24) hours before landfall. TCs that formed over
the Gulf of Mexico less than 24 hours prior to landfall were not examined. The direction
and speed of the storm motion was determined by the TC’s position over the preceding
three hours. For example, the TC direction 12 hours prior to landfall (t12) was decided by
the TC position at t12 and t15.
Methods
The 43 storms (Table 2-1, 2, 3) were divided into three groups based on landfall
location and storm motion to investigate if rainfall patterns varied regionally as should
moisture and the difference between shear and motion vectors. The first group contained
30
12 landfalls occurring over Texas, where TCs tended to track towards the northwest
before landfall. The 17 landfalls in Central Group included TCs with the strongest
northward component to their motion. Here, landfalls spanned Louisiana, Alabama,
Mississippi, and northwestern Florida. Florida was divided into two regions along 86°W
longitude due to its unique shape. On the west side of 86°W, TCs with motion vectors
between north-northwest and north-northeast directions were included in Central Group.
However, east of 86°W, most TCs had tracks with stronger eastward motion. Therefore,
Eastern Group contained 14 landfalls occurring on the Gulf of Mexico side of Florida on
the east side of 86°W longitude (Figure 2-1).
A Geographic Information System (GIS) was utilized to plot and analyze data
obtained from IBTrACS and NARR during the 24 hours before t00, and TRMM data at
t00. These data were transformed into an equal-area projection: North America Albers
Equal Area Conic.
The first step was to measure the TPW around each TC (Figure 2-2). Trenberth et
al. (2003) found that rainfall-producing weather systems typically gather water vapor from
a distance approximately 4x the radius of the precipitating region. As the average rain
field extends 223 km from the storm center at the time closest to landfall (Matyas, 2010b)
and the average rainfall region extends approximately 240 km from the storm center on
the day of landfall (Zhou and Matyas, 2017), 250 km was used as an average radius of a
TC rain field at landfall and this equated to a radius of 1000 km for the incorporation of
environmental moisture. This study centered a 3 x 3 grid on the TC’s position that was
oriented parallel to the storm’s trajectory to measure moisture on the left and right side of
the storm within the 1000 km radius. Each box had a 500 km length and a 500 km width;
thereby measuring 750 km left, right, in front of, and behind the TC, and measuring 1060
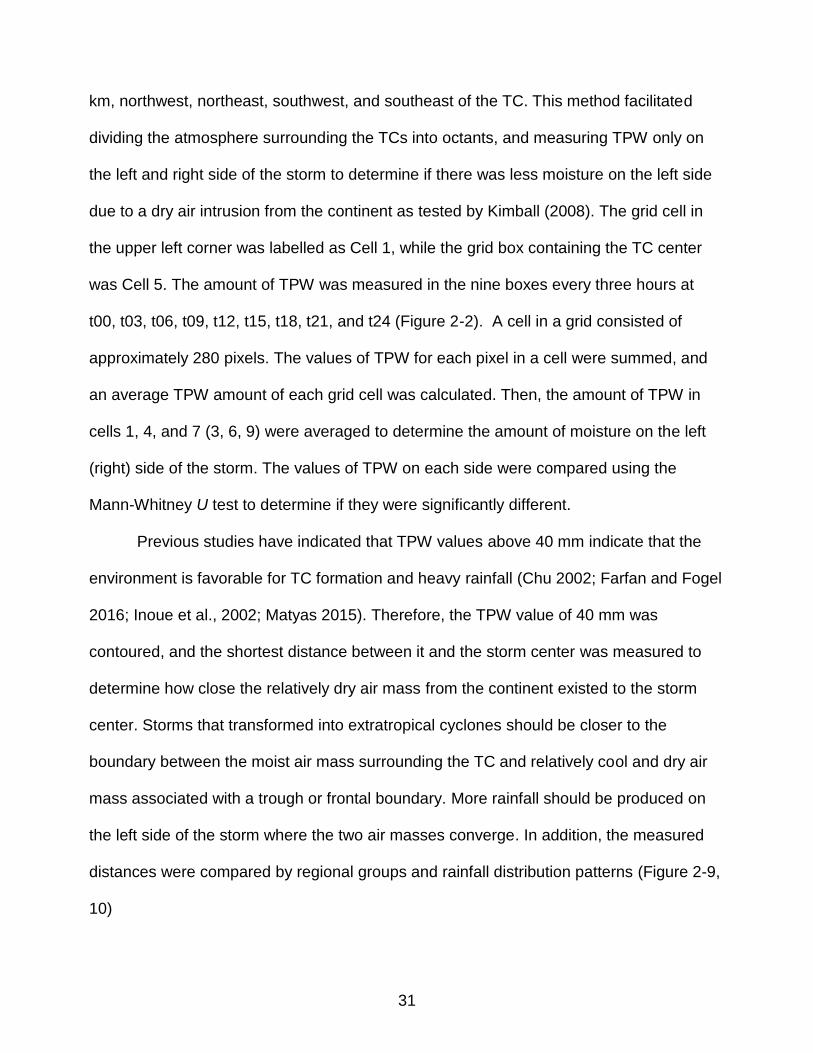
31
km, northwest, northeast, southwest, and southeast of the TC. This method facilitated
dividing the atmosphere surrounding the TCs into octants, and measuring TPW only on
the left and right side of the storm to determine if there was less moisture on the left side
due to a dry air intrusion from the continent as tested by Kimball (2008). The grid cell in
the upper left corner was labelled as Cell 1, while the grid box containing the TC center
was Cell 5. The amount of TPW was measured in the nine boxes every three hours at
t00, t03, t06, t09, t12, t15, t18, t21, and t24 (Figure 2-2). A cell in a grid consisted of
approximately 280 pixels. The values of TPW for each pixel in a cell were summed, and
an average TPW amount of each grid cell was calculated. Then, the amount of TPW in
cells 1, 4, and 7 (3, 6, 9) were averaged to determine the amount of moisture on the left
(right) side of the storm. The values of TPW on each side were compared using the
Mann-Whitney U test to determine if they were significantly different.
Previous studies have indicated that TPW values above 40 mm indicate that the
environment is favorable for TC formation and heavy rainfall (Chu 2002; Farfan and Fogel
2016; Inoue et al., 2002; Matyas 2015). Therefore, the TPW value of 40 mm was
contoured, and the shortest distance between it and the storm center was measured to
determine how close the relatively dry air mass from the continent existed to the storm
center. Storms that transformed into extratropical cyclones should be closer to the
boundary between the moist air mass surrounding the TC and relatively cool and dry air
mass associated with a trough or frontal boundary. More rainfall should be produced on
the left side of the storm where the two air masses converge. In addition, the measured
distances were compared by regional groups and rainfall distribution patterns (Figure 2-9,
10)
32
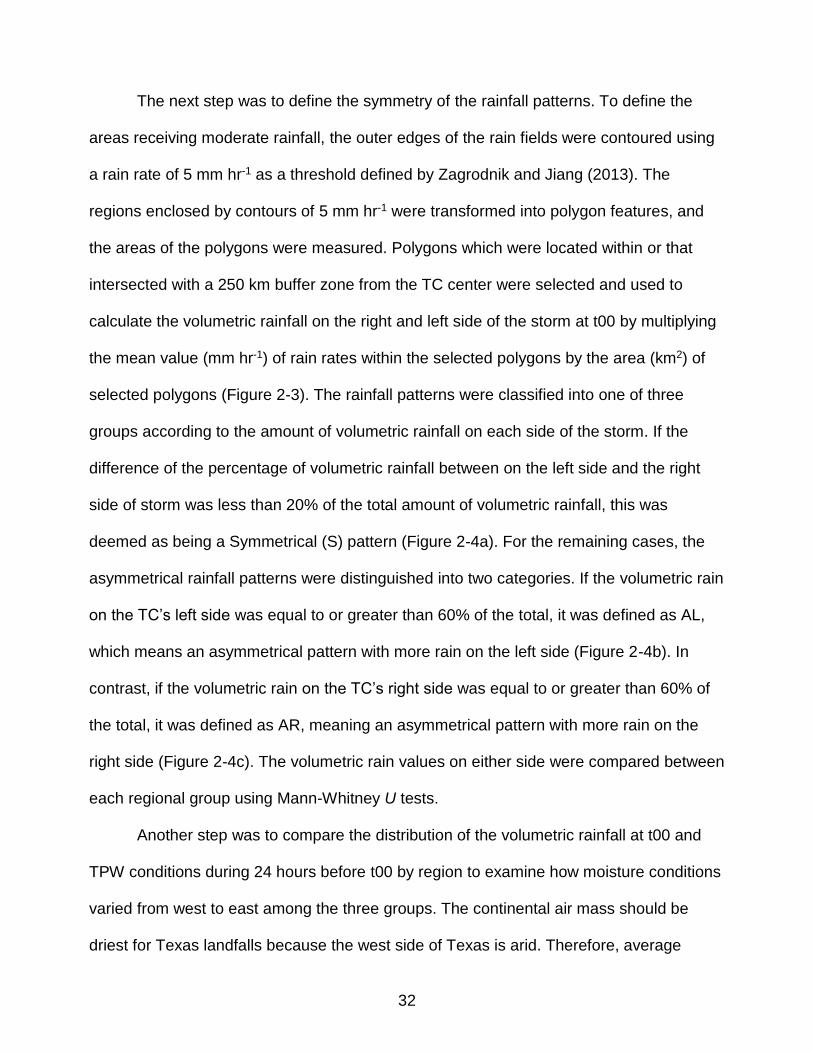
The next step was to define the symmetry of the rainfall patterns. To define the
areas receiving moderate rainfall, the outer edges of the rain fields were contoured using
a rain rate of 5 mm hr-1 as a threshold defined by Zagrodnik and Jiang (2013). The
regions enclosed by contours of 5 mm hr-1 were transformed into polygon features, and
the areas of the polygons were measured. Polygons which were located within or that
intersected with a 250 km buffer zone from the TC center were selected and used to
calculate the volumetric rainfall on the right and left side of the storm at t00 by multiplying
the mean value (mm hr-1) of rain rates within the selected polygons by the area (km2) of
selected polygons (Figure 2-3). The rainfall patterns were classified into one of three
groups according to the amount of volumetric rainfall on each side of the storm. If the
difference of the percentage of volumetric rainfall between on the left side and the right
side of storm was less than 20% of the total amount of volumetric rainfall, this was
deemed as being a Symmetrical (S) pattern (Figure 2-4a). For the remaining cases, the
asymmetrical rainfall patterns were distinguished into two categories. If the volumetric rain
on the TC’s left side was equal to or greater than 60% of the total, it was defined as AL,
which means an asymmetrical pattern with more rain on the left side (Figure 2-4b). In
contrast, if the volumetric rain on the TC’s right side was equal to or greater than 60% of
the total, it was defined as AR, meaning an asymmetrical pattern with more rain on the
right side (Figure 2-4c). The volumetric rain values on either side were compared between
each regional group using Mann-Whitney U tests.
Another step was to compare the distribution of the volumetric rainfall at t00 and
TPW conditions during 24 hours before t00 by region to examine how moisture conditions
varied from west to east among the three groups. The continental air mass should be
driest for Texas landfalls because the west side of Texas is arid. Therefore, average

33
TPW, distance to TPW contour line of 40 mm, and the amount of rainfall should be lowest
in Western Group. However, landfalls in the eastern part of the study region might have
been more influenced from oceanic air masses because most of Florida is surrounded by
the ocean. Therefore, average TPW, distance to TPW contour line of 40 mm, and rainfall
should be highest in Eastern Group when ET cases are not considered. In this study, the
rainfall pattern at t00 was compared to the amount of TPW on the left and right side of the
storm during 24 hours before t00, following Kimball’s study (2008). If less moisture exists
on the left side of the storm (Cells 1, 4, and 7) than the right side (Cells 3, 6, and 9) due to
the continental air mass, there should be lower average rainfall on the left side of the
storm than on the right side, which is an AR pattern. If the amount of moisture on either
side is not different due to the moisture influx from Atlantic Ocean and Gulf of Mexico,
storms should produce symmetrical rainfall distribution, which is a S pattern. If storms
produce more rain on the right side of the storm than on the left side, it is defined as an
AL pattern. To test these hypotheses, the Mann-Whitney U tests were calculated to
compare TPW conditions on the left side versus the right side of the storm within each
group to determine whether statistically significant differences in moisture existed. In
addition, TPW conditions on the left (right) side of the storm were compared in pairs for
the three regional groups using the Mann-Whitney U tests to examine if there were
different moisture conditions depending on regions. The null hypothesis was that TPW is
similar on both sides of the TCs and between the groups.
The final step was to analyze the angle difference between the directions of storm
motion and vertical wind shear at t00 to apply it to the distribution of rainfall. Potential time
lags between the onset of wind shear and asymmetries in rainfall distribution were not
considered because Wingo and Cecil (2010) revealed that a short time lag less than 6
34
hours exists between them. The angle between the vectors of storm motion and vertical
wind shear were calculated for each storm by subtracting motion vector from shear vector
and then an average was computed for each group (Figure 2-11). If the angle of vertical
wind shear was different from the angle of storm motion between -15 and 45 or 165
and 225, the vortex of storms would tilt ahead of or behind the direction of storm motion.
Therefore, the rainfall would be distributed ahead or behind of storm symmetrically,
creating a S pattern. If the angle of vertical wind shear was different from the angle of
storm motion between 45 and 165, it was assumed that the rainfall would exhibit an AR
pattern. This is because the direction of wind shear is toward the right side of storm
motion, and the vortex of storm tilts to the right side producing more rainfall on the right
side. If the angle of vertical wind shear was different from the angle of storm motion
between 225 and 345, it was assumed that the storms would have an AL pattern
because more rainfall could be produced on the left side due to the tilt of the vortex. If the
shear speed didn’t exceed of 5 m s-1, the motion component was more influential rather
than shear component and thus an AR pattern would be produced. The Mann-Whitney U
Tests were utilized to see if the distribution of angles between motion vector and shear
vector was significant for each group (Table 2-8).
The Results
TPW Conditions
As the TCs approached landfall, the total amount of TPW for the eight grid cells
surrounding the storms (Cells 1-4 and 6-9) decreased in all regions as the grid moved
deeper into the continental air mass (Figure 2-5). When the total amounts of TPW across
all analysis times were averaged by groups, a statistically significant difference in group
median values existed between not only Western and Central Group, but also Central

35
and Eastern Group (Table 2-4). However, values did not increase from west to east as
originally hypothesized, with the highest values belonging to TCs in Central Group
(Figure 2-5).
In Western Group, the nearest edge of the 40 mm value of TPW was positioned in
Cell 1 or 4 in 10 cases, and the distance to the TPW contour line of 40 mm was the
smallest, averaging 521 km at t24 and averaging 349 km at t00 (Figure 2-9), causing the
lowest averaged total TPW values among the three groups. The amount of TPW on the
left side of the storm decreased as TCs approach to the land due to the continental air
mass (Figure 2-6), while TPW on the right side of the storm remained constant due to the
advection of the oceanic air mass from the Gulf of Mexico (Figure 2-7). As a result, the
value for the amount of TPW on the right side was significantly higher than the TPW on
the left side (Figure 2-6 &7, Table 2-7), suggesting there could be more rainfall on the
right side which should produce the AR pattern.
In Central Group, the averaged total TPW values were the highest on both sides
among the three groups (Figure 2-6 & 7). In addition, the average distance to the TPW
contour line of 40 mm was much larger for TCs in Central Group, averaging 675 km at
t24 and 490 km at t00 (Figure 2-9). This result suggests that either the storms were
embedded in a larger pool of moisture, or that the continental air mass was not as dry as
it was for Groups 1 and 3 (Figure 2-6, Table 2-7). Another explanation for the relatively
high average TPW values for Central Group is that the outer reaches of the grid boxes
did not encounter as much land on either side as did the other groups due to the width of
the Gulf of Mexico. As a result, TPW conditions were similar on both sides of the storm
(Figure 2-6 &7, Table 2-7), suggesting that rainfall should be symmetrical.
In Eastern Group, given the asymmetrical distribution of environmental moisture,
36
the distribution of TPW between the left and the right side was significantly different for
Group3 from t24 until t00, suggesting the rainfall distribution should be the AR pattern
(Figure 2-6 &7, Table 2-7). The TPW contour line of 40mm was generally located much
closer to the storm center on the left (16 cases) than the right side (1 case) of the storm
at an average distance of approximately 483 km at t24 and 389 km at t00 which was
much closer than expected due to the fact that 11 out of 14 storms completed an ET
(Figure 2-9). Therefore, it was expected that the storms that completed ET should
produce the AL pattern.
Although Central Group had statistically significantly higher values of total TPW
surrounding storms than the other two groups, values for Groups 1 and 3 did not
significantly differ (Table 2-4). Also, the values of TPW on the left and the right between
Western and Eastern Group did not differ significantly (Table 2-5, 6). The main reason
for the similarity between Groups 1 and 3 for the values of TPW on the left side is that
the TPW contour lines of 40 mm were generally located closer to the storm center on the
left side (cell 1, 4 or 7) of the storm. The position of TPW contour line in Western Group
was due to the fixed location with topography in western Texas and Mexico such as the
North American Cordillera, which can block the influx of low-level moisture supply to TCs
(Bender et al., 1985; Schubert et al., 1998). However, 11 storms out of 14 in Eastern
Group completed an ET, while only 1 storm experienced an ET in Western Group. Due
to the favorable environment for storms to complete an ET for Eastern Group, the close
proximity of TPW contour lines on the left side are likely due to a frontal boundary in
Eastern Group. A visual inspection of surface analysis weather maps from NOAA on the
day of landfall for TCs in Groups 1 and 3 confirmed that the 40 mm TPW contour line
was generally linked to topography or dry continental air mass for Western Group and a

37
frontal boundary for Eastern Group. Therefore, in contrast to the expected AR pattern
from TPW conditions surrounding the storms in Eastern Group, the frontal boundary or
trough can be a focusing mechanism to trigger an AL pattern during the ET process.
Vertical Wind Shear and Storm Motion
The vertical wind shear and storm motion vectors at t00 were analyzed for each
TC and each group. The averaged values of the vertical wind shear (storm motion
speed) increased from west to east with 6.8 m s-1 (5.6 m s-1) for Western Group, 11.3 m
s-1 (5.9 m s-1) for Central Group, and 16.1 m s-1 (7.5 m s-1) for Eastern Group. The
speeds of vertical wind shear for 39 storms among the 43 storms were high enough to
influence the rainfall distribution as they were higher than the 5 m s-1 threshold
established by Chen et al (2006). When the angles of vertical wind shear were compared
to the angles of storm motion by regional groups, a statically significant difference
existed between them in Western and Central Group (Table 2-8). The average angle
difference was 136.8 for Western Group suggesting the rainfall should be right side of
the storm to produce the AR pattern. The angle difference of 91.3 for Central Group also
suggests that the AR pattern should be common. Lastly, the angle difference was 8.2
for Eastern Group (Figure 2-11). This generally suggests that storms that didn’t complete
ET in Eastern Group should have rainfall ahead of storm motion which is considered as
the S pattern and storms that completed ET should produce an AL pattern (Matyas
2010b).
Rainfall Patterns
The averaged total volumetric rain over the entire outlined area where the rain
rate was greater than 5 mm hr-1 increased from West to East as expected (Figure 2-12),
but it was not due to the first hypothesis that the more moisture can be supplied into the
38
storms in Eastern Group due to the oceanic environment. The averaged volumetric rain
on the left and right side of the storm were compared within groups. In Groups 1 and 2,
the Mann-Whitney U test showed that there was a significant difference between the
amount of rainfall on the left and right side of the storm, with more rainfall on the right
side to produce the AR pattern. (Figure 2-13, Table 2-9). In fact, the majority of cases
exhibited this pattern in both groups (Figure 2-14). In Eastern Group, the amount of
volumetric rain between on the left and the right side didn’t differ significantly according
to the Mann-Whitney U Test, indicating more S patterns (Figure 2-13, Table 2-9).
However, the result of the rainfall distribution comparison between the left side and the
right side of the storm for each storm in Eastern Group was different from the
suggestion of Mann-Whitney U Test result. In Eastern Group, 50% of storms had AL
patterns because many cases completed ET (Figure 2-14).
Rainfall Patterns by TPW, Vertical Wind Shear, and Storm Motion
From the analysis of the distance to TPW contour line of 40 mm for the rainfall
distribution patterns of 43 storms, the value for the storms that had AR or S pattern was
clearly larger than for the storms that had the AL pattern, with a natural break of
approximately 330-340 km (Figure 2-10). This result can be explained by the ET
process. When a trough or a frontal boundary approaches close to the storm center from
the left side of the storm, they bring a cooler and drier air mass from the middle latitudes.
The cyclonic motion of air flow associated with a TC can transport the moist and warm
tropical air mass to converge with the somewhat cooler and drier middle latitude air mass
in the left front quadrant of the TC (Figure 2-8c). This process of interaction between two
different air masses generates an advection for uplift and more rainfall in the region,
producing an AL pattern, and the distance of 330-340 km should be the threshold for the
39
interaction. The storms that produced AL patterns generally completed ET less than 24
hours after t00.
Analyzed averaged TPW conditions and vertical wind shear conditions suggested
there should be more AR patterns for Western Group. As expected, most storms had the
AR pattern. There were two S pattern cases (Claudette 2003 and Ike 2008), and one AL
pattern case (Edouard 2008). The rainfall distribution pattern of Claudette was matched
well with both TPW and the shear/motion conditions. The values of TPW during 24 hours
prior to landfall between the left and the right side were similar. The angle difference
between motion vector and shear vector was 189, suggesting the S pattern. In the case
of Ike, the values of TPW between the left and right side were similar during 24 hours
prior to landfall according to the Mann-Whitney U tests. However, the angle difference
between motion vector and shear vector was 84.3, suggesting the AR pattern. Although
Ike completed an ET 30 hours later from t00, the storm might not interact with a frontal
boundary at t00 because the shortest distance to the 40 mm line of TPW about 647 km
which might be too far away for the interaction to occur. The rainfall AL pattern of
Edouard was not explained by either TPW conditions or shear and motion factors. One
possible explanation for this result is that the vertical wind shear changed rapidly
between t03 and t00, so that the rainfall pattern might not change along with the
shear/motion condition. If the wind shear data at t03 was used for the case of Edouard,
the AL pattern was explained. In Western Group, 10 out of 12 cases (83%) of rainfall
patterns were explained by TPW distribution and 8 out of 12 cases (67%) were explained
by shear and motion vectors (Table 2-10). Thus, in this region, both TPW and vertical
wind shear are important for predicting the symmetry of rainfall.
In Central Group, TPW distribution and the distance to TPW contour line of 40mm

40
suggested that storms should have more S patterns. Wind shear and storm motion
conditions suggested that storms should have more AR patterns. The rainfall analysis
showed that the AR pattern dominated for 12 out of 17 storms, while 5 storms (Matthew
2004, Arlene 2005, Gustav 2008, Claudette 2009, and Isaac 2012) had the S pattern. As
expected, no storms had the AL pattern. Although eight storms eventually completed an
ET after landfall, the averaged distance to TPW boundary at t00 for the storms was
approximately 505 km and the storms usually completed ET more than 36 hours later
from t00. As a result, the storms might be too far away to interact with a frontal boundary
at t00, likely explaining why no AL patterns were observed. For the storms that had the
AR pattern, the average speed of wind shear was approximately 11 m s-1, which is
considered strong (> 5 m s-1) so that the shear component contributed to the rainfall
distribution more than storm motion (Chen et al., 2006). As a result, the rainfall
distribution of 11 out of 12 storms was explained by vertical wind shear. The rainfall
distribution for the remaining storm (Katrina 2005) was explained by TPW distribution.
Among the storms that had the S pattern, the rainfall patterns for 4 storms except Arlene
2005 were explained by either shear/motion component or TPW distribution. However,
the case of Arlene was not explained by TPW conditions and the component of
shear/motion. One possible explanation is that the 40 mm line of TPW didn’t match with
a frontal boundary, so that there could be data errors for TPW conditions. Among all 17
storms, the rainfall pattern for 9 storms (53%) was explained by TPW distribution, and 14
storms (82%) was explained by shear/motion factors. (Table 2-10).
In Eastern Group, it was more complicated to apply the TPW distribution and the
wind shear/motion component for the rainfall distribution patterns than for other groups’
cases because many storms completed ET. As a result, only 4 cases (29%) of rainfall

41
patterns were explained by TPW distribution, and 7 cases (50%) were explained by
vertical wind shear and storm motion without considering ET process (Table 2-10).
Among all 14 storms, 7 storms (50%) had the AL pattern, and 6 storms (Mitch 1998,
Gordon 2000, Gabrielle 2001, Henri 2003, Alberto 2006, and Barry 2007) completed ET
from the 7 storms. Except for the case of Gabrielle and Henri, the distances to the 40mm
line of TPW for other 4 storms were less 340 km which indicates a likely interaction with
a frontal boundary. In the case of Gabrielle, the distance to the 40mm line of TPW was
about 365 km which is close to the natural break of 340 km. However, the storm
completed an ET after 120 hours from landfall, so that it could possibly indicate not
interaction with a front. The surface weather map confirmed that a long cold front was
located far away than the distance of 340 km. The factor of shear/motion suggested that
the storm should have an AL pattern. In the case of Henri, the distance to TPW was
about 622 km, and the storm completed an ET after 81 hours from landfall. However, the
rainfall pattern was explained by the component of shear/motion. Debby 2012 produced
the AL rainfall pattern, but didn’t complete an ET. In the case of Debby, a cold front was
located on the left side of storm center within 227 km, transporting a cool air mass near
to the storm to produce more rainfall on the left side of the storm.
In Eastern Group, three storms (Irene 1999, Charley 2004, Wilma 2005) had S
patterns, and all they completed ET more than 24 hours later (87, 27, and 39 hours) from
landfall. In the case of Irene, an AR pattern was suggested based on TPW distribution,
and the distance to the 40mm line of TPW line on the left side of storm was about 555
km at t00. However, the shear/motion component explained the S pattern due to the
346 of angle difference and approximately 13 m s-1 of shear speed. In the case of
Charley, the distance to the 40mm line of TPW line on the left side of storm was about

42
473 km at t00. TPW distributions between on the left and the right side of the storm were
not significantly different, explaining the S pattern even though the shear/motion
component suggested that the storm should produce an AL pattern. For Wilma 2005, the
distance to the 40mm line of TPW line on the left side of the storm was about 364 km at
t00 which could be close enough to interact with the frontal boundary, and the position of
the TPW line coincided with a cold front from the analysis of a surface weather map.
However, the storm completed an ET after 39 hours from the time closest to landfall, so
the storm might not interact with the frontal boundary at t00. The rainfall pattern of this
storm was caused by shear/motion component of 29 of angle difference and 22 m s-1 of
shear speed.
There were 4 storms (Earl 1998, Harvey 1999, Bonnie 2004, and Fay 2008) that
had AR patterns in Eastern Group. In the case of Earl, the AR pattern was only explained
by the significantly different TPW distribution between on the left and the right side.
Although Earl completed an ET after 12 hours from landfall and the distance to the
40mm line of TPW at t00 was about 264 km, the measured distance was caused by the
transported dry air mass from a high-pressure system over the Central U.S, resulting in
the AR pattern. A cold front was located more than 550 km away from the storm center.
In the case of Harvey, the distance to the 40mm of TPW line was 332 km which means
that the storm should interact with a frontal boundary. However, a cold front was located
farther away than this distance, so that no interaction likely took place. The amount of
TPW on the left was significantly less than on the right side of the storm, explaining the
AR pattern. For the case of Bonnie, the difference of TPW distribution on both sides of
the storm explained the AR pattern. In the case of Fay, the storm completed an ET, but it
took 189 hours to experience an ET process after landfall. Also, the distance to the 40

43
mm line of TPW was about 734 km at t00. The AR pattern was explained by the
component of wind shear/storm motion.
Discussion and Limitation
The availability of moisture changes as TCs make landfall over major land
masses, and the amount of moisture available is an important factor for rainfall
production. This research measured the distribution of volumetric rainfall around TCs at
the time closest to landfall and associates its spatial patterns with atmospheric moisture
and the combination of vertical wind shear and storm motion. The hypothesis related to
moisture was that if less moisture exists on the left (right) side of the storm, then less
rainfall would be produced on the left (right) side. Also, the distance to TPW contour line
of 40 mm was calculated to determine how close the continental dry air mass or a frontal
boundary existed to storms. In addition, the angle difference between the direction of
storm motion and vertical wind shear at the time closest to landfall was analyzed to test
the hypothesis that more rainfall should occur on the right side of the storm, considering
storm’s cyclonic motion. The analysis included the 43 TCs that made landfall over the
U.S. Gulf Coast from 1998 to 2015. The cases were divided into 3 groups depending on
the landfall location and storm motion direction. A GIS was utilized to perform the spatial
analysis of rainfall and TPW, and Mann-Whitney U tests determined whether statistically
significant differences existed between the groups in terms of moisture, vertical wind
shear, storm motion, and rainfall.
The results of this study support those of previous studies (Chen et al., 2006;
Corbosiero and Molinari, 2002, 2003; Hernandez and Matyas, 2016; Jiang et al., 2008b,
c; Kimball 2008; Lonfat et al., 2007; Matyas, 2010b) by showing that the storm’s rainfall
distribution patterns are influenced by moisture, vertical wind shear, and storm motion.

44
This research also identified which factors contributed more to the storm’s rainfall
distribution regionally. Although TPW conditions and vertical wind shear were the crucial
component for the symmetry of storm’s rainfall in general, the storms that made landfall
over Texas were influenced by the dry air from the continent to produce less rainfall on
the left side of the storm. The rainfall distribution patterns for the storms making landfall
over the central Gulf coastal states were mainly determined by the vector of vertical wind
shear as moisture was generally plentiful, and had more rainfall on the right side of the
storm. In the case of storms making landfall over the Florida peninsula, vertical wind
shear was the dominant factor for the symmetry of rainfall distribution. However, the
storms tended to interact with a cooler and drier air mass from a frontal boundary to
produce more rainfall on the left side of the storm if the moisture boundary existed within
approximately 330-340 km of the storm center. This study is the first attempt to measure
the distance to TPW boundary from a TC center to explain the distribution patterns of TC
rainfall and reveals that moisture conditions are as much important as the component of
shear/motion for TC rainfall distribution in the western Gulf states and the Florida
peninsula.
There are several limitations of this research. The rainfall patterns were not
explained by moisture conditions and combined shear and motion vectors in two cases.
One possible explanation is that TC rainfall was only examined at the time closest to
landfall so that changes in the spatial patterns were not measured as TCs approached
the coastline and moved inland. Future research should analyze the evolution of TC
rainfall patterns prior to landfall as TPW conditions change through time, considering a
potential time lag between TPW conditions and TC rainfall distribution. Another limitation
was that only 40 mm of TPW was considered when determining the location of a non-

45
tropical air mass, and this contour line didn’t match with the location of an actual cold
front in all cases. Therefore, a future research should investigate which values of TPW
are the most representative of the location of a frontal boundary in NARR.

46
Table 2-1. The 12 selected storms (Western Group) that made landfall over from 1998
to 2015. TS: Tropical in Nature, DS: Disturbance, ET: Extra tropical
Storms that made landfall over Texas
(Western Group)
Year
Time closest to landfall in NARR data
End phase
CHARLEY 1998 09 UTC 22 Aug TS
FRANCES 1998 06 UTC 11 Sep TS
BRET 1999 00 UTC 23 Aug TS
FAY 2002 09 UTC 07 Sep DS
CLAUDETTE 2003 15 UTC 15 Jul DS
GRACE 2003 12 UTC 31 Aug TS
RITA 2005 09 UTC 24 Sep DS
ERIN 2007 12 UTC 16 Aug DS
HUMBERTO 2007 06 UTC 13 Sep DS
DOLLY 2008 18 UTC 23 Jul DS
EDOUARD 2008 12 UTC 05 Aug DS
IKE 2008 06 UTC 13 Sep ET
Table 2-2. The 17 selected storms (Central Group) that made landfall over Louisiana,
Mississippi, Alabama, and the western Florida from 1998 to 2015. TS:
Tropical in Nature, DS: Disturbance, ET: Extra tropical
Storms that made landfall over Louisiana, Mississippi, Alabama, and NW Florida
(Central Group)
Year
Time closest to landfall in NARR
data End phase
GEORGES 1998 12 UTC 28 Sep TS
HERMINE 1998 06 UTC 20 Sep TS
HELENE 2000 12 UTC 22 Sep TS
BARRY 2001 06 UTC 06 Aug DS
HANNA 2002 09 UTC 14 Sep TS
ISIDORE 2002 06 UTC 26 Sep ET
LILI 2002 12 UTC 03 Oct TS
BILL 2003 18 UTC 30 Jun ET
IVAN 2004 06 UTC 16 Sep ET
MATTHEW 2004 12 UTC 10 Oct ET
ARLENE 2005 18 UTC 11 Jun ET
CINDY 2005 03 UTC 06 Jul DS
DENNIS 2005 18 UTC 10 Jul ET
KATRINA 2005 12 UTC 29 Aug ET
GUSTAV 2008 15 UTC 01 Sep ET
CLAUDETTE 2009 06 UTC 17 Aug TS
ISAAC 2012 09 UTC 29 Aug TS

47
Table 2-3. The 14 selected storms (Eastern Group) that made landfall over Florida
Peninsula from 1998 to 2015. TS: Tropical in Nature, DS: Disturbance, ET:
Extra tropical
Storms that made landfall over Florida Peninsula
(Eastern Group)
Year
Time closest to landfall in
NARR data End Phase
EARL 1998 06 UTC 03 Sep ET
MITCH 1998 12 UTC 05 Nov ET
HARVEY 1999 18 UTC 21 Sep TS
IRENE 1999 21 UTC 15 Oct ET
GORDON 2000 03 UTC 18 Sep ET
GABRIELLE 2001 12 UTC 14 Sep ET
HENRI 2003 09 UTC 05 Sep ET
BONNIE 2004 15 UTC 12 Aug DS
CHARLEY 2004 21 UTC 13 Aug ET
WILMA 2005 09 UTC 24 Oct ET
ALBERTO 2006 18 UTC 13 Jun ET
BARRY 2007 15 UTC 02 Jun ET
FAY 2008 09 UTC 19 Aug ET
DEBBY 2012 21 UTC 26 Jun TS
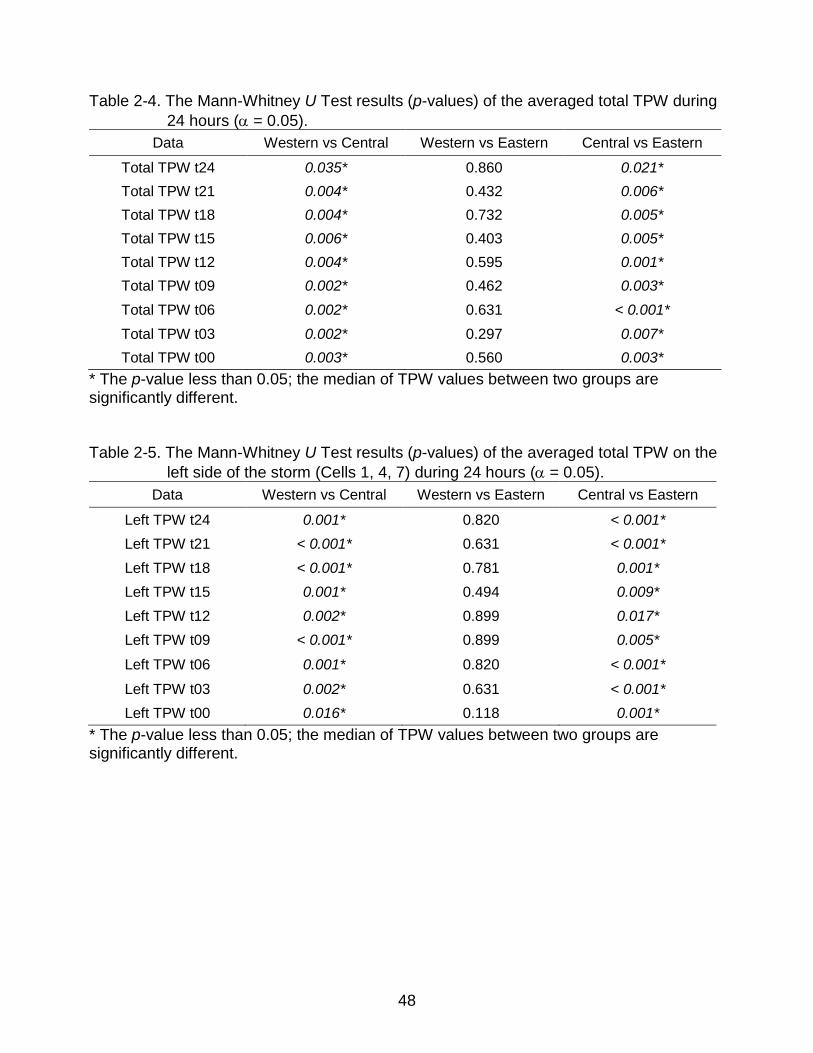
48
Table 2-4. The Mann-Whitney U Test results (p-values) of the averaged total TPW during
24 hours ( = 0.05).
Data Western vs Central Western vs Eastern Central vs Eastern
Total TPW t24 0.035* 0.860 0.021*
Total TPW t21 0.004* 0.432 0.006*
Total TPW t18 0.004* 0.732 0.005*
Total TPW t15 0.006* 0.403 0.005*
Total TPW t12 0.004* 0.595 0.001*
Total TPW t09 0.002* 0.462 0.003*
Total TPW t06 0.002* 0.631 < 0.001*
Total TPW t03 0.002* 0.297 0.007*
Total TPW t00 0.003* 0.560 0.003*
* The p-value less than 0.05; the median of TPW values between two groups are significantly different.
Table 2-5. The Mann-Whitney U Test results (p-values) of the averaged total TPW on the
left side of the storm (Cells 1, 4, 7) during 24 hours ( = 0.05).
Data Western vs Central Western vs Eastern Central vs Eastern
Left TPW t24 0.001* 0.820 < 0.001*
Left TPW t21 < 0.001* 0.631 < 0.001*
Left TPW t18 < 0.001* 0.781 0.001*
Left TPW t15 0.001* 0.494 0.009*
Left TPW t12 0.002* 0.899 0.017*
Left TPW t09 < 0.001* 0.899 0.005*
Left TPW t06 0.001* 0.820 < 0.001*
Left TPW t03 0.002* 0.631 < 0.001*
Left TPW t00 0.016* 0.118 0.001*
* The p-value less than 0.05; the median of TPW values between two groups are significantly different.

49
Table 2-6. The Mann-Whitney U Test results (p-values) of the averaged total TPW on the
right side of the storm (Cells 3, 6, 9) during 24 hours ( = 0.05).
Data Western vs Central Western vs Eastern Central vs Eastern
Right TPW t24 1.000 0.969 0.868
Right TPW t21 0.325 0.742 0.399
Right TPW t18 0.656 0.705 0.710
Right TPW t15 0.471 0.940 0.518
Right TPW t12 0.647 0.870 0.681
Right TPW t09 0.283 0.382 0.830
Right TPW t06 0.245 0.231 0.984
Right TPW t03 0.140 0.041* 0.710
Right TPW t00 0.043* 0.004* 0.830
* The p-value less than 0.05; the median of TPW values between two groups are significantly different.
Table 2-7. The Mann-Whitney U Test results (p-values) of the averaged TPW on the left side (Cells 1, 4, 7) versus on the right side (Cells 3, 6, 9) of the storm during 24
hours ( = 0.05).
Data Western Group Central Group Eastern Group
TPW left vs right t24 0.001* 0.518 < 0.001*
TPW left vs right t21 < 0.001* 0.205 < 0.001*
TPW left vs right t18 < 0.001* 0.114 < 0.001*
TPW left vs right t15 0.001* 0.073 0.001*
TPW left vs right t12 < 0.001* 0.057 0.001*
TPW left vs right t9 < 0.001* 0.053 < 0.001*
TPW left vs right t6 < 0.001* 0.029* < 0.001*
TPW left vs right t3 0.003* 0.008* < 0.001*
TPW left vs right t0 0.005* 0.006* < 0.001*
* The p-value less than 0.05; the median of TPW values between two groups are significantly different.
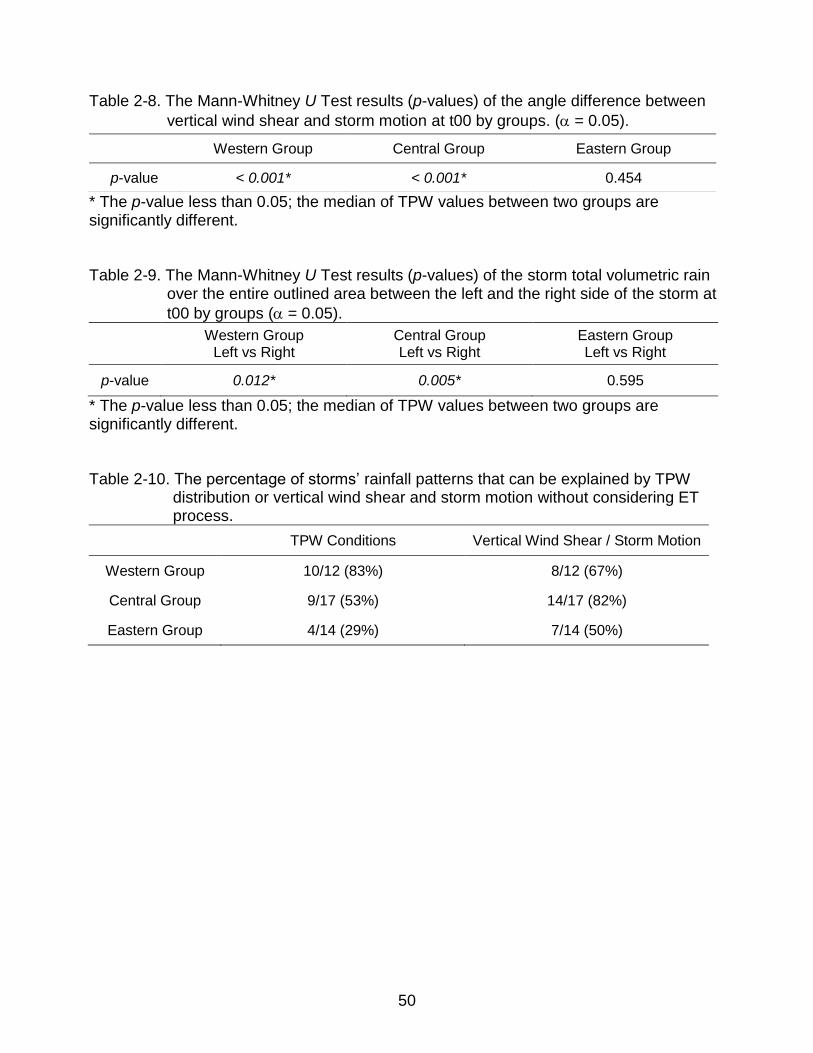
50
Table 2-8. The Mann-Whitney U Test results (p-values) of the angle difference between
vertical wind shear and storm motion at t00 by groups. ( = 0.05).
* The p-value less than 0.05; the median of TPW values between two groups are significantly different.
Table 2-9. The Mann-Whitney U Test results (p-values) of the storm total volumetric rain over the entire outlined area between the left and the right side of the storm at
t00 by groups ( = 0.05).
Western Group
Left vs Right Central Group Left vs Right
Eastern Group Left vs Right
p-value 0.012* 0.005* 0.595
* The p-value less than 0.05; the median of TPW values between two groups are significantly different.
Table 2-10. The percentage of storms’ rainfall patterns that can be explained by TPW distribution or vertical wind shear and storm motion without considering ET process.
TPW Conditions Vertical Wind Shear / Storm Motion
Western Group 10/12 (83%) 8/12 (67%)
Central Group 9/17 (53%) 14/17 (82%)
Eastern Group 4/14 (29%) 7/14 (50%)
Western Group Central Group Eastern Group
p-value < 0.001* < 0.001* 0.454

51
Figure 2-1. Three regional groups with selected storm tracks every 3 hours from 24
hours prior to landfall to the time closest to landfall
(a) (b)
(c)

52
Figure 2-2. The amount of TPW at 00 UTC 29 August 2005 during the landfall of
Hurricane Katrina. Nine cells comprise the grid (orange) centered on the TC position and oriented according to storm forward motion. The yellow dashed line represents a diameter for the region within which a TC obtains its moisture according to Trenberth et al., (2003). TPW on the left side of a storm (Cell 1, 4 & 7) and on the right side of a storm (Cell 3, 6 & 9) are measured separately. The shortest distance to TPW contour line of 40mm (red) from a storm center is measured.

53
Figure 2-3. Regions where the rain rate exceeds of 5 mm hr-1 were selected for analysis
(red line). Then, the rain-field areas that intersected with or were within 250km of the storm center (black line) were selected for analysis.
Legend
Storm center
Within 250km of the storm center
5mm hr-1 contour line
Precipitation rate (mm hr-1)
&3 04iv_Tr_091606
04iv_Buffer500km_091606
ct091606_polygon
ct091606_select
3B42_20040916_06_7A_nc.img
<VALUE>
0 - 5
5-10
10-15
15-20
10-25
25-30
30-35
35-40
40-45

54
Figure 2-4. The symmetry of TC rainfall distribution. (a) Asymmetrical rainfall distribution
pattern with more rain rate on the right side (AR) demonstrated at the time of landfall with Charley 1998. (b) Symmetrical rainfall distribution pattern (S) demonstrated at the time closest to landfall with Matthew 2004. (c) Asymmetrical rainfall distribution pattern with more rain rate on the left side (AL) demonstrated at the time closest to landfall with Gabrielle 2001.
Storm motion
direction
Storm motion direction
Storm motion direction
(a) (b)
(c)

55
Figure 2-5. The boxplots for the averaged total TPW in the grid boxes surrounding storms
by regional groups during 24 hours.
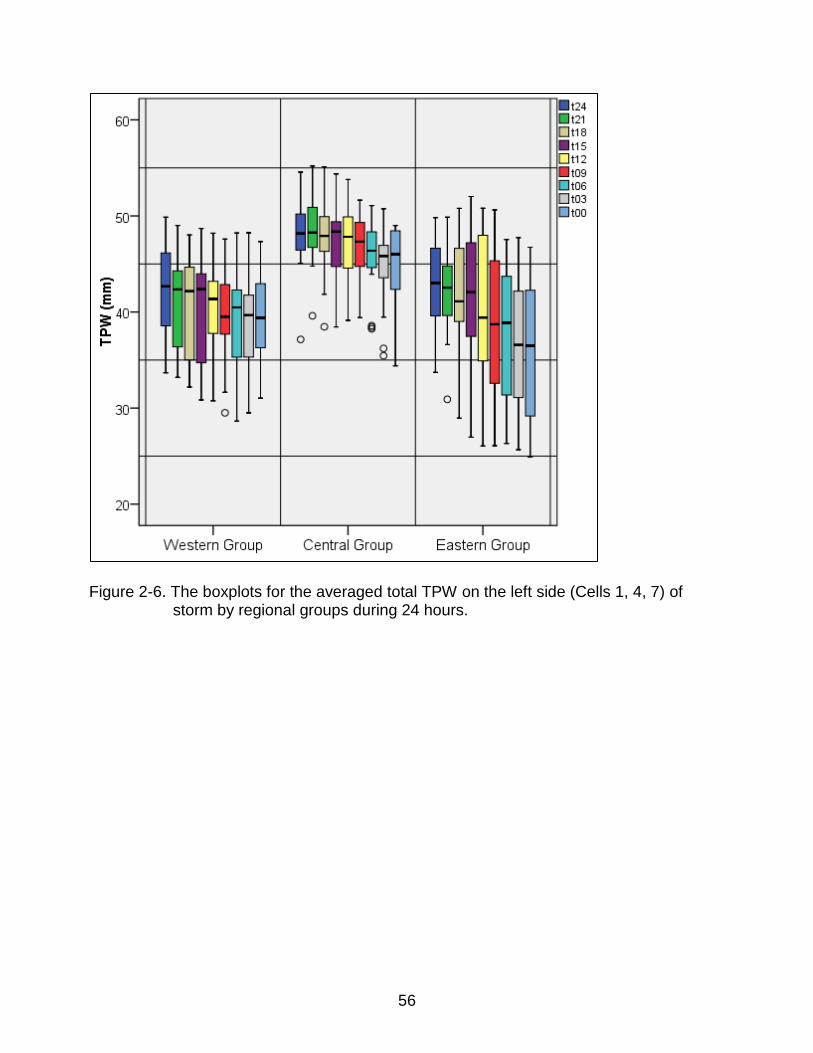
56
Figure 2-6. The boxplots for the averaged total TPW on the left side (Cells 1, 4, 7) of storm by regional groups during 24 hours.
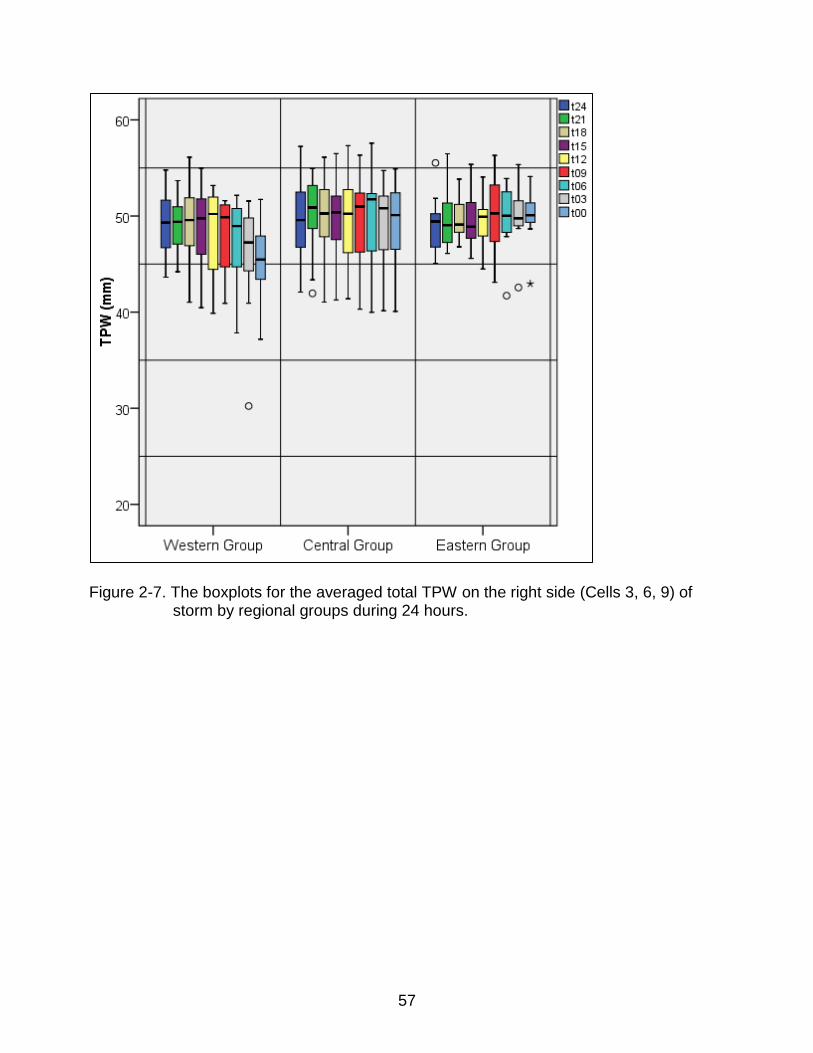
57
Figure 2-7. The boxplots for the averaged total TPW on the right side (Cells 3, 6, 9) of storm by regional groups during 24 hours.

58
Figure 2-8. The 40mm line of TPW boundary at t00 (a red line). (a)1998 Charley from
Western Group, (b) 2004 Ivan from Central Group, (c) 1998 Mitch from
Eastern Group

59
Figure 2-9. The boxplots for the averaged shortest distance between the storm centers
and TPW contour line of 40 mm by regional groups during 24 hours.
Figure 2-10. The boxplots for the distance to TPW contour line of 40 mm at t00 by the
rainfall distribution pattern. The X demarcates the mean value.
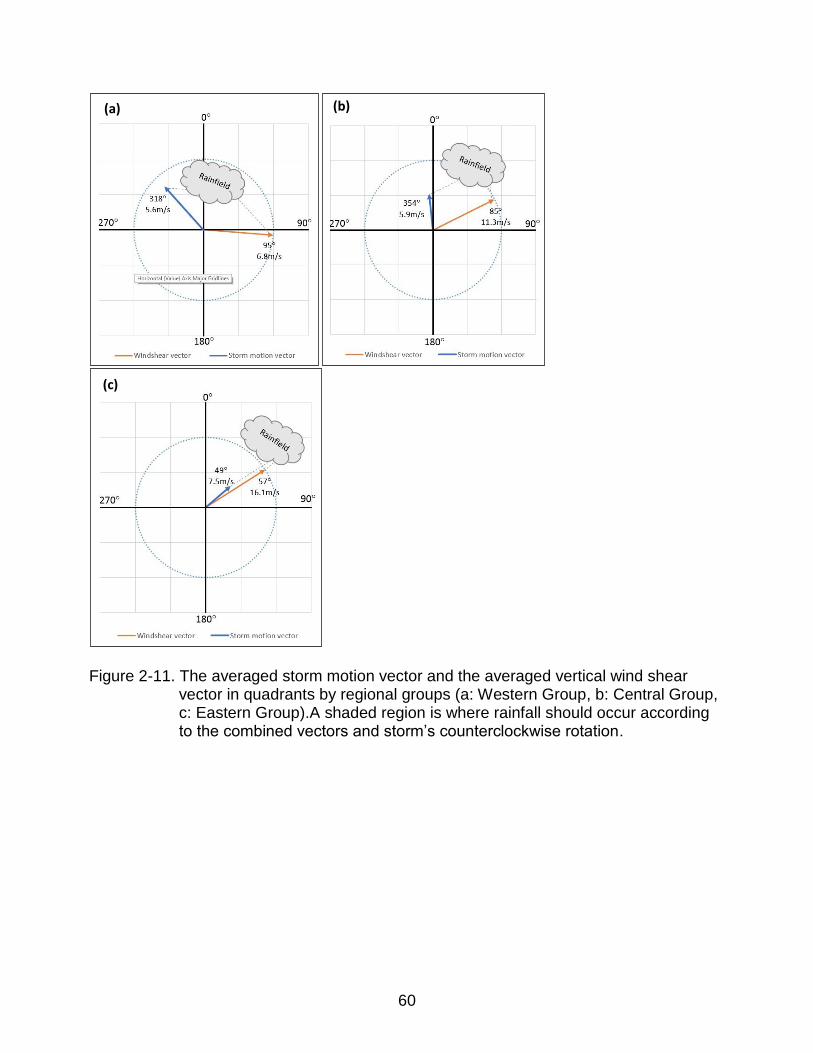
60
Figure 2-11. The averaged storm motion vector and the averaged vertical wind shear
vector in quadrants by regional groups (a: Western Group, b: Central Group, c: Eastern Group).A shaded region is where rainfall should occur according to the combined vectors and storm’s counterclockwise rotation.
(a) (b)
(c)
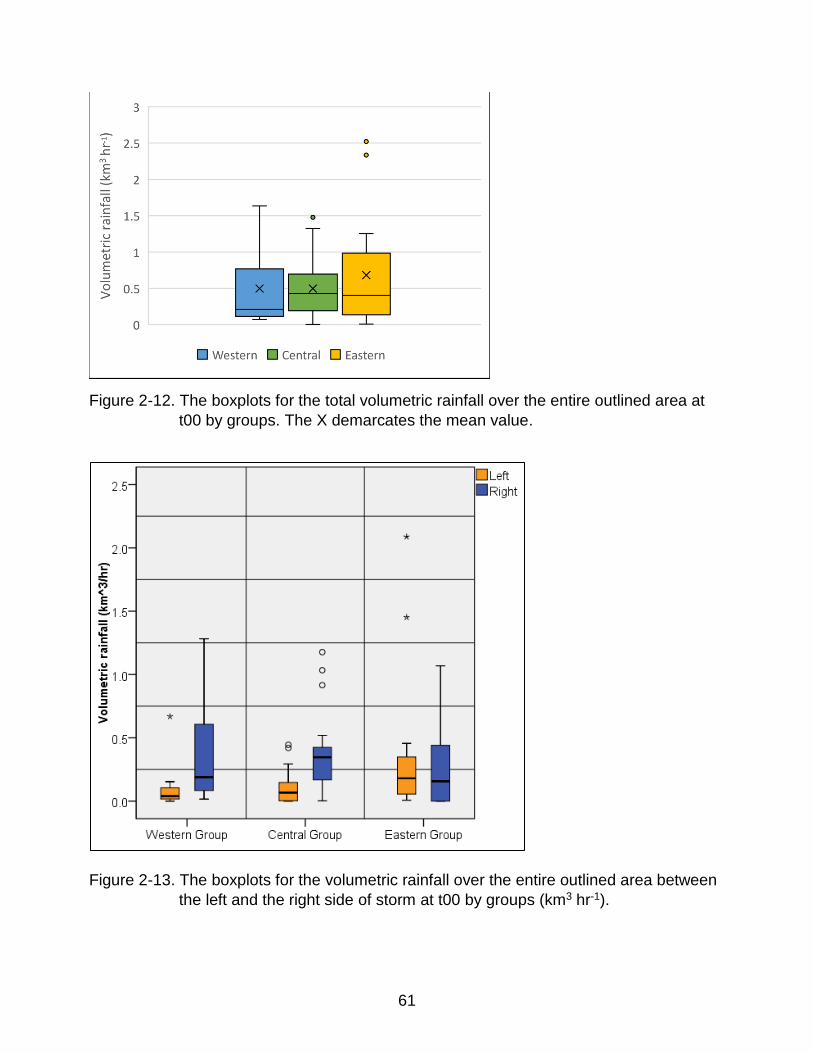
61
Figure 2-12. The boxplots for the total volumetric rainfall over the entire outlined area at
t00 by groups. The X demarcates the mean value.
Figure 2-13. The boxplots for the volumetric rainfall over the entire outlined area between
the left and the right side of storm at t00 by groups (km3 hr-1).

62
Figure 2-14. The number of cases exhibiting each rainfall distribution pattern by group.
0
2
4
6
8
10
12
14
AL S AR
Western Central Eastern

63
CHAPTER 3 CONCLUSION
Corene Matyas is a representative Geographery who studies TCs. Her research
philosophy and effort to blend between Geography and Meteorology has shown a
different way to conduct TC research from a different perspective. She and her research
group have investigated TC precipitation patterns spatially and climatologically. She has
mainly utilized a GIS to analyze TC precipitation patterns by measuring the shape of TC
rain fields (Matyas 2007, 2008), examining TC rainfall patterns specific to Florida (Matyas
2006, Matyas and Cartaya 2009, Matyas 2014), or examining conditions related to TC
rain field size (Matyas 2010b, 2013, 2014). In addition, she guided her research group to
investigate TC rainfall patterns over Puerto Rico (Hernandez and Matyas 2016) and the
U.S. (Zhou and Matyas 2017) and the evolution of TC precipitation pattern by using shape
metrics (Matyas 2007, 2008, Zick and Matyas 2016). As Geographers specialize in the
examination of spatial patterns, my current research developed a new approach to
examine rainfall asymmetry that compliments the work published by Dr. Matyas and her
students.
Previous researchers have found that TC rainfall patterns are influenced by
moisture conditions surrounding the TCs. For an example, Kimball’s (2008) modeling
study revealed that a dry air intrusion on the left side of the storm from the land caused
increased stability on the left side and increased instability on the right side as the dry air
circulates counterclockwise from the boundary layer, resulting in lower (higher) rainfall
rates on the left (right) side of the storm. However, the current observational study
focuses more on the moisture conditions present in the entire atmospheric column by
utilizing the value of TPW and determining how it varies in the environment surrounding
TCs as they approach landfall. The goal of this research is to investigate the symmetry of

64
the rainfall distribution pattern for TCs making landfall over the Gulf coastal states and
associate these patterns with the spatial distribution of atmospheric moisture as
measured using a GIS. In addition, vertical wind shear and storm motion which are crucial
factors that influence TC rainfall patterns and have been extensively examined by other
researchers are also analyzed along with the moisture conditions.
The 43 storms are selected from 1998 to 2015 and they are divided into 3 groups
depending on the landfall location and storm motion. The TPW data are obtained from
NARR. The TPW distribution surrounding TCs is measured for the 24-hour time period
before the time closest to landfall. To measure TPW, a grid box containing 9 cells is
positioned at the storm center and both sides of each cell are 500 km in length. Also, the
shortest distance between the storm center and TPW contour line of 40 mm is measured
to investigate if dry air from the continental air mass is close to the storms or storms
interact with a frontal boundary. The vector of vertical wind shear from SHIPS data is
compared to the vector of storm motion at the time closest to landfall. Finally, the
volumetric rainfall distribution is examined at the time closest to landfall for each storm
and it is determined whether it is symmetrical or asymmetrical regards to the right and left
side of the storm. The data for TC rainfall are obtained from TRMM. The rainfall
distribution patterns are compared with TPW conditions, vertical wind shear and storm
motion components.
This research shows that TC rainfall distribution patterns are different regionally
and moisture conditions such as dry air mass from the continent or cooler and drier air
mass from the mid-latitude weather system are important for TC rainfall distribution along
with vertical wind shear and storm motion. In addition, the influence of moisture, shear
and motion factors vary regionally. The storms that made landfall over Texas generally

65
produced more rainfall on the right side of the storm and the rainfall distribution was
mainly impacted by the proximity of the dry continental air mass west of the storm. Storms
made landfall over the central Gulf coastal states generally produced more rainfall on the
right side of the storm. This study shows that the rainfall pattern in this region was
generally determined by vertical wind shear as ample moisture was present within
approximately 585 km of the storm center. The storms that traveled over the Florida
peninsula generally produced more rainfall on the left side of the storm. This pattern was
associated not only with the vectors of vertical wind shear and storm motion but also
interaction with a frontal boundary. When a frontal boundary existed within approximately
330-340 km of a storm center, the interaction between cooler air from a frontal boundary
and warm/moist air from a TC occurred, resulting in more rainfall on the left side of the
storm.
This study contributes to the literature by suggesting that TC rainfall patterns vary
regionally in the Gulf states and the main environmental conditions that influence on TC
rainfall are also different depending on where the storm is located. Also, this study
suggests that the distance of 330-340 km between a storm center and TPW line of 40mm
can be a key threshold for interaction between the tropical and continental air masses for
the first time.
However, there are some limitations in this research. In particular, TPW values of
40 mm didn’t coincide with the actual location of a cold front that interacted with a storm
in 3 out of 14 cases in Eastern Group. As a result, it is suggested for the future research
to investigate determine the values of TPW that more accurately indicate the location of
a frontal boundary. One possible reason for the mismatch between TPW values and a
frontal boundary is that a front is a surface feature, but TPW is measured from the entire
66
column of the atmosphere. As a result, temperature and moisture near the surface
should be analyzed in conjunction with TPW to better define the location of a frontal
boundary when examining TCs that interact with the middle latitude westerlies.
Therefore, future research should examine in more detail how the availability of moisture
changes as TCs approach land and quantify which values of TPW are most
representative of moisture boundaries that can enhance rainfall production.

67
LIST OF REFERENCES Andersen, T. K., and M. Shepherd., 2014: A global spatiotemporal analysis of inland tropical cyclone maintenance or intensification. International Journal of Climatology, 34, 391-402. DOI: 10.1002/joc.3693. Atallah, E. H., and L. F. Bosart, 2003: The extratropical transition and precipitation distribution of Hurricane Floyd (1999). Monthly Weather Review, 131, 1063–1081. DOI: 10.1175/1520-0493(2003)131<1063:TETAPD>2.0.CO;2 Atallah, E. H., L. F. Bosart, and A. R. Aiyyer. 2007. Precipitation distribution associated with landfalling tropical cyclones over the eastern United States. Monthly Weather Review 135 (6):2185-2206. DOI: 10.1175/MWR3382.1 Barnes, G. M., J.F. Gamache, M. A. Lemone and G. J. Stossmeister, 1990: A convective cell in a hurricane rainband. Monthly Weather Review, 119, 776-794. DOI: 10.1175/1520-0493(1991)119<0776:ACCIAH>2.0.CO;2 Bender, M., R. E. Tuleya, and Y. Kurihara, 1985: A numerical study of the effect of a mountain range on a landfalling tropical cyclone. Monthly Weather Review, 113, 567–583. DOI: 10.1175/1520-0493(1985)113<0567:ANSOTE>2.0.CO;2 Cecil, D. J., 2007: Satellite-derived rain rates in vertically sheared tropical cyclones. Geophysical Research Letters, 34(2), L02811. DOI: 10.1029/2006GL027942 Chan, J. C. L., K. S. Liu, S. E. Ching, and E. S. T. Lai, 2004: Asymmetric distribution of convection associated with tropical cyclones making landfall along the south China coast. Monthly Weather Review, 132, 2410–2420. DOI: 10.1175/1520-0493(2004)132<2410:ADOCAW>2.0.CO;2 Chen, S. S., Knaff, J. A., Marks Jr, F. D, 2006: Effects of vertical wind shear and storm motion on tropical cyclone rainfall asymmetries deduced from TRMM. Monthly Weather Review, 134, 3190–3208. DOI: 10.1175/MWR3245.1 Chen, Y., E. E. Ebert, K. J. Walsh, and N. E. Davidson, 2013: Evaluation of TRMM 3B42 precipitation estimates of tropical cyclone rainfall using PACRAIN data. Journal of Geophysical Research-Atmospheres, 118, 2184–2196. DOI: 10.1002/jgrd.50250 Chu P-S. 2002: Large-scale circulation features associated with decadal variations of
tropical cyclone activity over the central North Pacific. Journal of Climate, 15, 2678–2689.
DOI: 10.1175/1520-0442(2002)015<2678:LSCFAW>2.0.CO;2 Corbosiero, K. L., and J. Molinari, 2002: The effects of vertical wind shear on the distribution of convection in tropical cyclones. Monthly Weather Review, 130, 2110–2123. DOI: 10.1175/1520-0493(2002)130<2110:TEOVWS>2.0.CO;2

68
Corbosiero K. L., and J. Molinari, 2003: The relationship between storm motion, vertical wind shear, and convective asymmetries in tropical cyclones. Journal of Atmospheric science, 60, 366–376. DOI: 10.1175/1520-0469(2003)060<0366:TRBSMV>2.0.CO;2 DeMaria, M., and J. Kaplan, 1994: A statistical hurricane intensity prediction scheme (SHIPS) for the Atlantic basin. Weather and Forecasting, 9, 209-220. DOI: 10.1175/1520- 0434(1994)0092.0.CO;2. DeMaria, M., 1996: The effect of vertical shear on tropical cyclone intensity change. Journal of the Atmospheric Sciences, 53, 2076–2087. DOI: 10.1175/1520-0469(1996)053<2076:TEOVSO>2.0.CO;2 DiMego, G. J., and L. F. Bosart, 1982: The transformation of Tropical Storm Agnes into an extratropical cyclone. Part I: The observed fields and vertical motion computations. Monthly Weather Review, 110, 385–411. DOI: 10.1175/1520- 0493(1982)110<0385:TTOTSA>2.0.CO;2 Elsner, J. B., and A. B. Kara, 1999: Hurricanes of the North Atlantic: Climate and Society. Oxford University Press. Emanuel, K. A., 1991: The theory of hurricanes. Annual Review of Fluid Mechanics, 23, 179-196. DOI: 10.1146/annurev.fl.23.010191.001143 Emanuel, K. A., 2003: Tropical cyclones. Annual Review of Earth and Planetary Sciences 31, 75-104. DOI: 10.1146/annurev.earth.31.100901.141259 Farfán LM, Fogel I., 2007. Influence of tropical cyclones on humidity patterns over
Southern Baja California, México. Monthly Weather Review.135, 1208–1224, DOI:
10.1175/MWR3356.1. Foley, G. R., and B. N. Hanstrum, 1994: The capture of tropical cyclones by cold fronts off of the west coast of Australia. Weather and Forecasting, 9, 577–592. DOI: 10.1175/1520-0434(1994)009<0577:TCOTCB>2.0.CO;2 Frank, W. M., 1977: The structure and energetics of the tropical cyclone I: Storm structure. Monthly Weather Review, 105, 1119-1135. DOI: 10.1175/1520-0493(1977)105<1119:TSAEOT>2.0.CO;2 Gray, W. M., 1968: A global view of the origin of tropical disturbances and storms. Monthly Weather Review, 96, 669-700. DOI: 10.1175/1520-0493(1968)096<0669:GVOTOO>2.0.CO;2 Gray, W. M., 1979: Hurricanes: Their formation, structure, and likely role in the tropical circulation. Meteorology over the Tropical Oceans, D. B. Shaw, Ed., Royal Meteorological Society, 155–218.
69
Goldenberg, S. B., and L. J. Shapiro, 1996: Physical mechanisms for the association of El Niño and West African rainfall with Atlantic major hurricane activity. Journal of Climate, 9, 1169–1187, DOI: 10.1175/1520-0442(1996)009,1169:PMFTAO.2.0.CO;2. Guo, Q. and C. J. Matyas, 2016: Comparing the spatial extent of Atlantic basin tropical cyclone wind and rain fields prior to land interaction. Physical Geography, DOI: 10.1080/02723646.2016.1142929 Hart and J. Evans, 2001: A climatology of the extratropical transition of Atlantic tropical cyclones. Journal of Climate, 14, 546–564. DOI: 10.1175/1520-0442(2001)014<0546:ACOTET>2.0.CO;2 Hernandez Ayala, J. J., and C. J. Matyas, 2016: Tropical cyclone rainfall over Puerto Rico and its relations to environmental and storm-specific factors. International Journal of Climatology, 36, 2223–2237. DOI: 10.1002/joc.4490 Hill, K., and G. M. Lackmann, 2009: Influence of environmental humidity on tropical cyclone size. Monthly Weather Review, 137, 3294-3315. DOI: 10.1175/2009MWR2679.1
Ho, F. P., Su, J. C., Hanevich, K. L., Smith, R. J., and Richards, F. P, 1987: Hurricane
climatology for the Atlantic and Gulf coasts of the United States. NOAA Tech. Rep.
NWS38, Federal Emergency Management Agency, Washington, D.C.
Holland, G. J., 1997: The maximum potential intensity of tropical cyclones. Journal of the Atmospheric Sciences, 54, 2519–2541. DOI: 10.1175/1520-0469(1997)054<2519:TMPIOT>2.0.CO;2
Huffman, G. J., and D. T. Bolvin, 2011: TRMM and other data precipitation data set documentation. NASA GSFC Rep., 29 pp. [Available online at ftp://precip.gsfc.nasa.gov/pub/trmmdocs/3B42_3B43_doc.pdf.] Huffman, G. J., D.T. Bolvin, E. J. Nelkin, D. B. Wolff, R. F. Adler, G. Gu, E. F. Stocker, 2007. The TRMM Multisatellite Precipitation Analysis (TMPA): Quasi-Global, multiyear, combined-sensor precipitation estimates at fine scales. Journal of Hydrometeorology, 8, 38–55. DOI: 10.1175/JHM560.1 Inoue M, I.C. Handoh, G. R. Bigg, 2002: Bimodal distribution of tropical cyclogenesis in the Caribbean: characteristics and environmental factors. Journal of Climate. 15: 2897–2905, DOI: 10.1175/1520-0442(2002)015<2897:bdotci>2.0.co;2. Jiang, H., J. B. Halverson, and J. Simpson, 2008a: On the differences in storm rainfall from Hurricanes Isidore and Lili. Part I: Satellite observations and rain potential, Weather Forecasting, 23, 44– 61. DOI: 10.1175/2007WAF2005096.1 Jiang, H., J. B. Halverson, J. Simpson, and E. J. Zipser, 2008b: On the differences in storm rainfall from Hurricanes Isidore and Lili. Part II: Water budget, Weather Forecasting, 23, 29–43. DOI: 10.1175/2007WAF2005120.1

70
Jiang, H., J. B. Halverson, and E. J. Zipser, 2008c: Influence of environmental moisture on TRMM-derived tropical cyclone precipitation over land and ocean. Geophysical Research Letters, 35. DOI: 10.1029/2008gl034658 Jiang, H., C. Liu, and E. J. Zipser, 2011: A TRMM-based tropical cyclone cloud and precipitation feature database. Journal of Applied Meteorology and Climatology, 50, 1255-1274. DOI: 10.1175/2011JAMC2662.1. Jones, S. C., 1995: The evolution of vortices in vertical shear. I: Initially barotropic vortices. Quarterly Journal of the Royal Meteorological Society, 121, 821–851. DOI: 10.1002/qj.49712152406 Kellner O., D. Niyogi, M. Lei, and A. Kumar, 2012: The role of anomalous soil moisture on the inland reintensification of Tropical Storm Erin (2007). Natural Hazards, 63, 1575–1600. DOI: 10.1007/s11069-011-9966-6 Kimball, S. K., 2008: Structure and evolution of rainfall in numerically simulated landfalling hurricanes. Monthly Weather Review, 136, 3822–3847. DOI: 10.1175/2008MWR2304.1 Kimball, S. K., and M. S. Mulekar, 2004: A 15-year climatology of north Atlantic tropical cyclones. Part I: Size parameters. Journal of Climate, 17(18): 3555–3575. DOI: 10.1175/1520-0442(2004)017<3555:AYCONA>2.0.CO;2 Kitabatake, N, 2011: Climatology of extratropical transition of tropical cyclones in the western North Pacific defined by using cyclone phase space. Journal of the Meteorological Society of Japan. Ser. II, 89(4), 309–325. DOI: :10.2151/jmsj.2011-402 Klein, P. M., P. A. Harr, and R. L. Elsberry, 2000: Extratropical transition of western North Pacific tropical cyclones: An overview and conceptual model of the transformation stage. Weather and Forecasting, 15, 373–395. DOI: 10.1175/1520-0434(2000)015<0373:ETOWNP>2.0.CO;2 Knapp, K. R., M. C. Kruk, D. H. Levinson, H. J. Diamond, and C. J. Neuman, 2010: The international best track archive for climate stewardship (IBTrACS): Unifying tropical cyclone best track data. Bulletin of the American Meteorological Society, 91, 363–376, DOI: 10.1175/2009BAMS2755.1. Knutson, T. R., J. L. McBride., J. Chan., K. Emanuel., G. Holland., C. Landsea., I. Held., J.P. Kossin., A. K. Srivastava, and M. Sugi, 2010: Tropical cyclones and climate change. Nature Geoscience, 3, 157–163. DOI: 10.1038/ngeo779 Knutson, T. R., J. J. Sirutis., G. A. Vecchi., S. Carner., M. Zhao., H. Kim., M. Bender., R. E. Tuleya., I. M. Held, and G. Villarini, 2013: Dynamical downscaling projections of twenty-first-century Atlantic hurricane activity: CMIP3 and CMIP5 model-based scenarios. Journal of Climate, 26, 6591–6617. DOI: 10.1175/JCLI-D-12-00539.1 Knutson, T. R., and R. E. Tuleya, 2004: Impact of CO2-induced warming on simulated hurricane intensity and precipitation: Sensitivity to the choice of climate model and

71
convective parameterization. Journal of Climate, 17, 3477–3495. DOI: 10.1175/1520-0442(2004)017<3477:IOCWOS>2.0.CO;2 Konrad, C. E., 2001: Diurnal variations in the landfall times of tropical cyclones over the eastern United States. Monthly Weather Review, 129, 2627–2631. DOI: 10.1175/1520-0493(2001)129<2627:DVITLT>2.0.CO;2 Konrad, C. E., and L. B. Perr, 2010: Relationships between tropical cyclones and heavy rainfall in the Carolina region of the USA. International Journal of Climatology, 30, 522–534. DOI: 10.1002/joc.1894 Kummerow, C., Y. Hong, W. S. Olson, S. Yang, R. F. Adler, J. McCollum, R. Ferraro, G. Petty, D. B. Shin, and T. T. Wilheit, 2001: The evolution of the Goddard Profiling Algorithm (GPROF) for rainfall estimation from passive microwave sensors, Journal of Applied Meteorology and Climatology, 40, 1801–1820. DOI: 10.1175/1520-0450(2001)040<1801:TEOTGP>2.0.CO;2 Landsea,C.W., G.A. Vecchi, L. Bengtsson, and T. R. Knutson, 2010: Impact of duration thresholds on Atlantic tropical cyclone counts. Journal of Climate, 23, 2508-2519. DOI: 10.1175/2009JCLI3034.1 Lin, Y.-L., and L. C. Savage III, 2011: Effects of landfall location and the approach angle of a cyclone vortex encountering a mesoscale mountain range. Journal of the Atmospheric Sciences, 68, 2095–2106, DOI: 10.1175/2011JAS3720.1 Lonfat, M., F. D. Marks Jr., and S. S. Chen, 2004: Precipitation distribution in tropical cyclones using the Tropical Rainfall Measuring Mission (TRMM) microwave imager: A global perspective. Monthly Weather Review, 132, 1645–1660. DOI: 10.1175/1520-0493(2004)132<1645:PDITCU>2.0.CO;2 Lonfat, M., R. Rogers, T. Marchok, and F. D. Marks Jr, 2007: A parametric model for predicting hurricane rainfall. Monthly Weather Review, 135, 3086–3097. DOI: 10.1175/MWR3433.1 Matano, H., and M. Sekioka, 1971: Some aspects of the extratropical transformation of a tropical cyclone. Journal of the Meteorological Society of Japan, 49, 736–743. Matyas, C. J., 2006: Florida tropical cyclone rainfall totals as related to storm location and intensity. The Florida Geographer, 37, 58-71. Matyas, C. J., 2007: Quantifying the shapes of U.S. landfalling tropical cyclone rain shields. The Professional Geographer. 59(2), 158-172. DOI: 10.1111/j.1467-9272.2007.00604.x Matyas, C. J., 2008: Shape measures of rain shields as indicators of changing environmental conditions in a land falling tropical storm. Meteorological Applications, 15: 259–271. DOI: 10.1002/met.70

72
Matyas, C. J., 2010a: A geospatial analysis of convective rainfall regions within tropical cyclones after landfall. International Journal of Applied Geospatial Research, 1, 71–91. DOI: 10.4018/jagr.2010020905 Matyas, C. J., 2010b: Associations between the size of hurricane rain fields at landfall and their surrounding environments. Meteorology and Atmospheric Physics, 106,135–148. DOI: 10.1007/s00703-009-0056-1 Matyas, C. J. 2013: Processes influencing rain-field growth and decay after tropical cyclone landfall in the United States. Journal of Applied Meteorology and Climatology, 52, 1085–1096. DOI: 10.1175/JAMC-D-12-0153.1 Matyas, C. J., 2014: Conditions associated with large rain-field areas for tropical cyclones landfalling over Florida. Physical Geography, 35, 93-106. DOI: 10.1080/02723646.2014.893476 Matyas, C. J., 2015: Tropical cyclone formation and motion in the Mozambique Channel. International Journal of Climatology, 35, 375-390. DOI: 10.1002/joc.3985 Matyas, C. J., and M. Cartaya, 2009: Comparing the rainfall patterns produced by Hurricanes Frances (2004) and Jeanne (2004) over Florida. Southeastern Geographer, 49, 132-156. DOI: 10.1353/sgo.0.0046 Mendelsohn, R., K. Emanuel, S. Chonabayashi, and L. Bakkensen, 2012: The impact of climate change on global tropical cyclone damage. Nature Climate Change, 2, 205–209. DOI: 10.1038/nclimate1357 Mesinger, F., and Coauthors, 2006: North American Regional Reanalysis. Bulletin of the American Meteorological Society, 87, 343–360. DOI: 10.1175/BAMS-87-3-343 NCEP Reanalysis data provided by the NOAA/OAR/ESRL PSD, Boulder, Colorado, USA, from their Web site at http://www.esrl.noaa.gov/psd/ Palme n, E., 1958: Vertical circulation and release of kinetic energy during the development of hurricane Hazel into an extratropical storm. Tellus, 10, 1–23. DOI: 10.1111/j.2153-3490.1958.tb01982.x Rappaport, E. N., 2000: Loss of life in the United States associated with recent Atlantic tropical cyclones. Bulletin of the American Meteorological Society, 81, 2065-2073. DOI: 10.1175/1520-0477(2000)081<2065:LOLITU>2.3.CO;2 Rappaport, E. N., 2014: Fatalities in the United States from Atlantic tropical cyclones: New data and interpretation. Bulletin of the American Meteorological Society, 95, 341–346. DOI: 10.1175/BAMS-D-12-00074.1 Rodgers, E. B., and H. F. Pierce, 1995; Environmental influence on Typhoon Bobbie’s precipitation distribution, Journal of Applied Meteorology and Climatology, 34, 2513– 2532. DOI: 10.1175/1520-0450(1995)034<2513:EIOTBP>2.0.CO;2

73
Rodgers, E. B., and R. F. Adler, 1981: Tropical cyclone rainfall characteristics as determined from a satellite passive microwave radiometer. Monthly Weather Review, 109, 506–521. DOI: 10.1175/1520-0493(1981)109<0506:TCRCAD>2.0.CO;2 Rogers, R. F., S. S. Chen, J. Tenerelli, and H. E. Willoughby, 2003: A numerical study of the impact of vertical shear on the distribution of rainfall in Hurricane Bonnie (1998), Monthly Weather Review, 131, 1577-1599. DOI: 10.1175//2546.1 Schnadt C., A. Fink, D. G. Vincent, J. M. Schrage, and P. Speth, 1998: Tropical cyclones, 6–25 day oscillations, and tropical–extratropical interaction over the northwestern Pacific. Meteorology and Atmospheric Physics, 68, 151–169. DOI: 10.1007/BF01030207 Schubert, S. D., H. M. Helfand, C-Y. Wu, and W. Min, 1998: Subseasonal variations in warm-season moisture transport and precipitation over the central and eastern United States. Journal of Climate, 11, 2530–2555. DOI: 10.1175/1520-0442(1998)011<2530:SVIWSM>2.0.CO;2 Schwarz, F. K., 1970: The unprecedented rains in Virginia associated with the remnants of Hurricane Camille. Monthly Weather Review, 98, 851–859. DOI: 10.1175/1520-0493(1970)098<0851:TURIVA>2.3.CO;2 Senn H. V., and H. W. Hiser, 1959: On the origin of hurricane spiral rainbands. Journal of Meteorology, 16, 419–426. DOI: 10.1175/1520-0469(1959)016<0419:OTOOHS>2.0.CO;2 Shapiro, L. J., 1983: The asymmetric boundary layer flow under a translating hurricane. Journal of the Atmospheric Sciences, 40, 1984–1998. DOI: 10.1175/1520-0469(1983)040<1984:TABLFU>2.0.CO;2 Thornthwaite, C. W., 1931: The climates of North America: According to a new classification. Geographical Review, 24, 633-655. DOI: 10.2307/209372 Trenberth K, A. Dai, R. M. Rasmussen, and D.B. Parsons, 2003: The changing character of precipitation. Bulletin of the American Meteorological Society, 84, 1205–1217. DOI: 10.1175/BAMS-84-9-1205 Trenberth, K., 2005: Uncertainty in hurricanes and global warming, Science, 308, 1753–1754. DOI: 10.1126/science.1112551 Trenberth, K. E., J. T. Fasullo, and J. Mackaro, 2011: Atmospheric moisture transports
from ocean to land and global energy flows in reanalyses. Journal of Climate, 24, 4907–
4924, DOi: 10.1175/ 2011JCLI4171.1.
Tuleya, R. E., and Y. Kurihara, 1978: A numerical simulation of the landfall of tropical cyclones. Journal of the Atmospheric Sciences, 35, 242–257.
Villarini, G., J. A. Smith, M. L. Baeck, T. Marchok, and G. A. Vecchi, 2011: Characterization of rainfall distribution and flooding associated with U.S. landfalling tropical cyclones: Analyses of Hurricanes Frances, Ivan, and Jeanne (2004). Journal of Geophysical Research, 116, D23116, DOI: 10.1029/2011JD016175

74
Willoughby, H.E., 1978: A possible mechanism of the formation of hurricane rainbands. Journal of Atmospheric Science, 35, 838-848. DOI: 10.1175/1520-0469(1978)035<0838:APMFTF>2.0.CO;2 Wingo, M. T., and D. J. Cecil, 2010: Effects of vertical wind shear on tropical cyclone precipitation. Monthly Weather Review, 138, 645– 662, DOI: 10.1175/2009MWR2921.1 Zagrodnik, J. P., and H. Jiang, 2013: Investigation of PR and TMI version 6 and version 7 rainfall algorithms in landfalling tropical cyclones relative to the NEXRAD stage-IV multisensor precipitation estimate dataset. Journal of Applied Meteorology and Climatology, 52: 2809-2827. DOI: 10.1175/JAMC-D-12-0274.1 Zhao, M., and I. M. Held, 2012: TC-permitting GCM simulations of hurricane frequency response to sea surface temperature anomalies projected for the late-twenty-first century. Journal of Climate, 25, 2995–3009. DOI: 10.1175/JCLI-D-11-00313.1 Zhou, Y., and C. J. Matyas, 2017: Spatial characteristics of storm-total rainfall swaths associated with tropical cyclones over the Eastern United States. International Journal of Climatology, DOI: 10.1002/joc.5021. Zick, S. E., and C. J. Matyas, 2015a: Tropical cyclones in the North American Regional Reanalysis: An assessment of spatial biases in location, intensity, and structure. Journal of Geophysical Research-Atmospheres, 120, 1651-1669. DOI: 10.1002/2014JD022417 Zick, S. E., and C. J. Matyas, 2015b: Tropical cyclones in the North American Regional Reanalysis: The impact of satellite-derived precipitation over ocean. Journal of Geophysical Research-Atmospheres, 120, 8724-8742. DOI: 10.1002/2015JD023722. Zick, S.E. and C.J. Matyas, 2016: A shape metric methodology for studying the evolving geometries of synoptic-scale precipitation patterns in tropical cyclones. Annals of the Association of American Geographers, 106,1217-1235. DOI: 10.1080/24694452.2016.1206460.

75
BIOGRAPHICAL SKETCH
Mr. Sanghoon Kim is from Seoul, South Korea. He studied meteorology for his
bachelor’s degree from Northern Illinois University. He received his Master of Science
degree from the Department of Geography at the University of Florida in the summer of
2017. He is interested in spatial analysis, climate, hurricanes and natural hazards.