The influence of leaf litter and plants on soil...
55
The influence of leaf litter and plants on soil respiration before, during and after a severe drought James Edgerley Lancaster University Lancaster LA1 4YQ UK Submitted: January 2016 Supervisors: Emma Sayer and Luis Lopez-Sangil This manuscript was submitted for the degree MSc (by research) in Ecology
-
Upload
phungquynh -
Category
Documents
-
view
218 -
download
3
Transcript of The influence of leaf litter and plants on soil...

The influence of leaf litter and plants on soil respiration before, during and after a severe drought
James Edgerley
Lancaster University
Lancaster
LA1 4YQ
UK
Submitted: January 2016
Supervisors: Emma Sayer and Luis Lopez-Sangil
This manuscript was submitted for the degree MSc (by research) in Ecology

Declaration
This thesis is my own work and it has not been submitted in substantially the same form to any other institution for the award of a higher degree.
Acknowledgements
I wish to thank everybody who has helped with my research, in particular Eduardo Medina Barcenas, Deirdre Kerdraon Byrne, John Crawford, Catherine Baxendale, Ali Birkett, Mounir Takriti, Maria Makaronidou, Annette Ryan, Noorliana Mohd Zan and both my supervisors Emma Sayer and Luis Lopez-Sangil.

Page | i
Table of Contents
Sections
1. Abstract Pg.1
2. Introduction Pg.3
3. Methods
i. Incubation experiments Pg.9
ii. Greenhouse experiments Pg.11
iii. Soil analyses Pg.15
iv. Data analyses Pg.15
4. Results
i. Incubation experiments Pg.16
ii. Greenhouse experiments Pg.24
5. Discussion
i. Incubation experiments Pg.34
ii. Greenhouse experiments Pg.36
6. Conclusions Pg.40
7. Bibliography Pg.42
8. Appendix Pg.48

Page | ii
List of Tables
Table 1 Pg.12
Initial chemical and physical properties of soil used in greenhouse experiment
Figures
Figure 1 Pg.7
Illustration of soil priming
Figure 2 Pg.17
Soil CO2 efflux in incubation jars with different drought and litter treatments
Figure 3 Pg.18
Cumulative soil CO2 efflux in incubation jars with different drought and
litter treatments
Figure 4 Pg.20
Differences in soil CO2 efflux between drought treatments for incubations
with single-litter and double-litter inputs
Figure 5 Pg.21
Soil carbon content in incubations with different drought and litter
treatments before and after rewetting
Figure 6 Pg.21
Soil nitrogen content in incubations with different drought and litter
treatments before and after rewetting
Figure 7 Pg.22
Soil microbial biomass carbon in incubations jars with different drought and
litter treatments before and after rewetting
Figure 8 Pg.22
Relative mass loss of litter in incubations jars with different drought and
litter treatments
Figure 9 Pg.24

Page | iii
Soil CO2 efflux for drought and watered treatments in pots planted
with poplars trees and with different litter inputs.
Figure 10 Pg.25
Cumulative soil CO2 efflux from the greenhouse experiment
Figure 11 Pg.26
Differences in soil respiration between drought treatments in pots planted
with poplar cuttings for double-litter, single-litter and no-litter treatments
Figure 12 Pg.27
Differences in soil respiration between drought treatments in unplanted pots
with poplar cuttings for double-litter, single-litter and no-litter treatments
Figure 13 Pg.29
Soil carbon content in the greenhouse experiment with different drought
and litter treatments
Figure 14 Pg.30
Soil nitrogen content in the greenhouse experiment with different drought
and litter treatments
Figure 15 Pg.31
Soil microbial biomass carbon in the greenhouse experiment with different drought
and litter treatments
Figure 16 Pg.32
Soil carbon content, soil nitrogen content and soil microbial biomass carbon
before and after rewetting in planted pots that received a drought treatment
Figure A Pg.48
Photographs of the experiments
Figure B Pg.49
Soil temperature for the greenhouse experiment.
Figure C Pg.50
Gravimetric soil water content for the incubation expermetnt

Page | 1
Abstract
Drought frequency is projected to increase under future climate change. Large-scale
droughts may have a huge effect on ecosystem carbon storage but despite the
importance of drought events, their effect on soil carbon dynamics are less well
understood. The above-belowground linkages that affect soil dynamics in forested
areas during drought and immediately after rewetting can have a substantial impact
on how soil carbon is stored. Soil respiration increases with addition of organic
material, which also facilitates the release of stored carbon in the soil; known as a
'priming effect'. In addition, soils that have undergone drought produce a large pulse
of CO2 when rewet; a phenomenon known as the 'Birch effect'.
I conducted lab incubations and a greenhouse experiment with poplar saplings to
quantify soil carbon release during and after drought. I measured soil respiration to
investigate potential interactions between the Birch and the priming effects and to
establish whether post-drought soil CO2 release is intensified or mitigated with the
addition of different amounts of leaf litter and the presence or absence of tree roots.
In both experiments, soil respiration increased with litter inputs and decreased
strongly during drought. However, I observed a larger pulse of soil CO2 efflux in
response to litter inputs compared to rewetting after drought. In the incubation
experiments, the low carbon content of the soil explains the overriding effect of the
litter treatments, because the litter inputs represented the main source of carbon
and nutrients to soil microbes. In the greenhouse experiment, I observed a
substantial increase in soil carbon and microbial biomass upon rewetting after

Page | 2
drought but no clear peak in soil CO2 efflux. The apparent lack of a Birch effect in the
greenhouse experiment is intriguing, because it suggests that plants have a
mitigating effect on soil microbial responses to drought and rewetting.
Page | 3
Introduction
Soils are huge repositories of carbon. Terrestrial carbon stocks contain three
times the amount of carbon in the atmosphere and are vulnerable to change due to
human activity (Batjes 1996). The vast majority of terrestrial carbon is stored
belowground in soils and yet potential changes in soil carbon pools in climate change
models are often inaccurate because we lack a detailed understanding of the
processes involved in soil carbon storage and release (Wieder et al. 2013).
Most organic carbon is introduced to the soil matrix during microbial
decomposition of plant input; it is also released from the soil during this process by
heterotrophic respiration. Organic carbon entering the soil is predominately part of
long complex polymer chains; cellulose, proteins, hemicellulose and lignin are the
most abundant forms of carbon in decaying organic matter (Swift 2001). As most soil
microorganisms are heterotrophic, they are primarily limited by carbon and these
large organic polymers need to be depolymerised by specialised bacteria and fungi to
release the simple compounds and sugars that can be used for a source of energy for
the rest of the soil microbial community (Killham 1995). After processing by
decomposer organisms, most of the carbon from fresh organic matter is either: 1)
incorporated into the organisms feeding off the organic matter; 2) released as CO2
through microbial respiration; or 3) becomes part of the carbon pool in the soil
(Killham 1995). The storage of carbon in soils is of critical importance because much
of it is eventually stabilised, with turnover times in the range of hundreds or
thousands of years (Swift 2001). Hence, the response of soils to climate change can
influence ecosystem or even global carbon dynamics, and yet we still know little

Page | 4
about the processes underlying the storage or release of carbon from soils under
different conditions.
The functional rates of the biological processes that govern soil carbon dynamics
are highly dependent on environmental conditions, in particular temperature and
water availability (Raich & Schlesinger 2002). Drought can result in decreased
microbial biomass and activity, however this is not uniform (van Gestel et al. 1993;
Bapiri et al. 2010) as some slower-growing microorganisms, such as the slower
growing fungi, are thought to be more resistant to desiccation (Schimel et al. 2007;
Bapiri et al. 2010). Temperature is crucial for regulating microbial activity but it also
plays a part in determining the size and diversity of the microbial community: an
increase in temperature alone can result in greater microbial biomass but it can also
decrease the diversity of the microbial community because it favours fast-growing
competitive organisms (Scheik et al. 2011). However, a rise in temperature combined
with low precipitation can cause more severe drought in soil, leading to an overall
greater loss in microbial biomass (Scheik et al. 2011).
Two phenomena are of particular interest for the study of soil carbon dynamics
because they can release large pulses of CO2 from soils: 1) the 'Birch effect', which
occurs after rewetting of dried soils, and 2) the 'priming effect', which occurs in
response to increased inputs of fresh organic matter. Both phenomena involve
complex microbial, biochemical and organo-mineral interactions that have been
studied for decades, but the mechanisms underlying the pulsed release of CO2 from
soils have yet to be conclusively identified.

Page | 5
The Birch effect was first described in experiments by H.F. Birch in the 1950s; he
discovered that repeated drying and rewetting cycles in soils stimulate the
mineralisation of soil organic matter, releasing carbon and mineral nitrogen (see
Jarvis et al. 2007 for a review). Three principal mechanisms have been proposed for
the pulse of CO2 associated with the Birch effect (Jarvis et al. 2007 and Kim et al.
2012):
i) Labile organic substrate accumulates during drought, which facilitates rapid
growth and expansion of the microbial community when the drought is
alleviated. This substrate is derived from numerous sources such as dead roots,
bacterial and fungal cells that did not survive the drought, and litter that has
started to decompose on the surface of the soil. The rewetting of the soil
therefore produces a pulse of labile substrate that surviving microbes can
exploit, leading to rapid initial growth and activity, which in turn produces a
large and sudden increase in microbial respiration. (Bottner et al. 1985);
ii) Intracellular osmolytes are synthesized by soil microbes to counteract the
decrease in water potential as drought increases. Upon rewetting, the osmolytes
are rapidly released and used as substrate because they are labile organic
compounds. (Fierer andSchimel 2002)
iii) Physical mechanisms are responsible for the spike in CO2, where drought breaks
up soil aggregates, releasing physically protected organic matter accounting for
part of the observed pulse in soil respiration. (Denef et al. 2001)
Although it is generally accepted that these mechanisms contribute to increased CO2
efflux during Birch effects, we still lack a good understanding of the processes

Page | 6
involved and their wider impact on ecosystem carbon dynamics (Xiang et al. 2008;
Kim et al. 2012).
The priming effect is characterised by additional decomposition of the soil
organic carbon after increased inputs of easily-degradable organic material. The
pulse of CO2 observed after substrate addition is largely derived from older soil
organic matter, rather than the fresh organic inputs (Kuzyakov et al. 2000). There are
currently three widely proposed theories for the mechanisms underlying priming
effects:
i) Soil microbes are typically C-limited, so the addition of easily degradable fresh
organic matter provides energy and stimulates extracellular enzyme production,
which results in the break down of soil organic matter (Kuzyakov et al. 2000).
ii) Specific microbial functional groups control the turnover of distinct pools of
organic matter. Additions of more complex substrates give a competitive
advantage to slow-growing groups of microorganisms, which are capable of
degrading more recalcitrant soil organic matter (Fontaine et al. 2003).
iii) Microbial decomposition processes occur within a narrow range of the carbon-
to-nitrogen ratio (C:N). Soil organic matter is mineralized to acquire nitrogen to
enable the decomposition of a high-C substrate (Craine et al. 2007;
Blagodatskaya & Kuzyakov 2008).
Studies of both “Birch” and priming effects have usually tested these theories in
isolation and found evidence to support each of them. It is therefore unclear
whether any single mechanism can explain each of these two effects or whether
specific mechanisms apply under different conditions, soil types or ecosystems.

Page | 7
a) b)
Figure 1. Illustration of expected changes in soil respiration with a) positive priming and b)
negative priming. i) represents CO2 respired from the soil without additional organic input; ii)
shows the soil respiration in blue plus the CO2 released from the additional substrate in red;
iii) shows changes in CO2 measured during positive and negative priming effects, where
additional CO2 released by positive priming effects is shown in yellow; dashed lines indicate
the difference in expected soil respiration with and without priming effects.
Linking Birch effects and priming effects
The mechanisms underlying Birch effects and priming effects have largely been
studied in laboratory experiments. However, many of these studies were carried out
without the presence of plants, even though there is strong evidence that plant roots
can modify the response of soil microbes to drought (Fuchslueger et al. 2014) and
play a key role in priming effects (Subke et al. 2004; Crow et al. 2009). Recent work
demonstrates that either the presence of roots or litter alone can release carbon as
CO2 through priming effects but interactions between plant roots and litter inputs

Page | 8
can reduce CO2 release and increase soil C storage (Xu et al. unpublished data).
Given that drought also affects the growth and production of organic matter by
plants as well as microbial activity, it is reasonable to assume that the presence of
plants can also modify Birch effects after a drought.
There have been a number of drought experiments in grasslands, where the
small size of individual plants and low vegetation allow observations of ecosystem
processes. In contrast, studies of environmental change involving trees or wooded
ecosystems are logistically challenging (Sayer 2014). Experiments to determine
drought effects in forest soils often use partial throughfall exclusion to reduce water
availability (e.g. Ogaya & Peñuelas 2007; Brando et al. 2008), or rainfall shelters in
the understorey, which affect the surface soil and ground flora but not canopy tree
growth (e.g. Borken et al. 2006; Cleveland et al. 2011). Initially, trees respond to
water shortage by shifting biomass allocation from aboveground growth to root
production to increase water uptake (Ryan 2011). A severe forest drought can also
result in large quantities of dead plant material through leaf abscission to reduce
transpiration losses and mortality both above- and belowground (Munné-Bosch &
Alegre 2004). At the end of a strong drought, it is therefore conceivable that the first
rainfall could cause the simultaneous occurrence of Birch effects and priming effects,
as the soil is rewetted and the accumulated plant material starts to decompose. If
this is the case, and priming effects and Birch effects occur simultaneously (or in
close succession) at the end of a drought, the release of CO2 could be larger than
currently estimated by experiments studying either effect in isolation.

Page | 9
To address this, I established laboratory incubations combining different levels
of leaf litter inputs with drought treatments, and a greenhouse experiment using
pots with and without poplar saplings to investigate the influence of live roots on the
amount of CO2 released during Birch- and priming effects. I measured soil CO2 efflux
to assess changes in microbial activity in response to litter inputs, drought
treatments and rewetting. The main aim of my experiments was to test the following
hypotheses:
1) Birch effects and priming effects are additive, resulting in a larger pulse of CO2
upon rewetting when litter inputs are increased;
2) The presence of plant roots moderates the release of CO2 through Birch effects
after severe drought;
3) Plant roots also reduce the amount of CO2 released through priming effects in
response to increased litter inputs.
Methods
Incubation experiments
Sample preparation
Fresh commercial topsoil was homogenised by sieving (2-mm mesh). Three
subsamples were weighed and then dried to constant weight for 48 hours at 105°C to
measure soil water content. Soil water holding capacity was determined by placing
200 g of dried soil in a 500 ml container with small holes to allow water to drain

Page | 10
freely. The soil was then submerged in water for 24 hours, left to drain for a further
24 hours and then weighed to determine the water holding (field) capacity.
A mixture of ash and sycamore leaf litter was collected during October 2013 from
litter traps in Wytham Woods, mixed deciduous woodland in Oxfordshire UK. The
litter was oven-dried to constant weight at 60ºC according to existing lab protocols,
shredded, homogenised, and then sieved to retain fragments of 2-4mm diameter.
Leachate was prepared following Schreeg et al. (2013) with modifications. Briefly, 1.5
g of litter were shaken with 45 ml of deionised water and centrifuged at 3500 rpm for
5 mins; 90 mL of leachate were prepared each week and stored at 5 ºC until needed.
The dissolved organic content for the leachate was determined to be 240 μg kg -1.
Incubations
For the incubations, soil samples (80 g dry weight equivalent) were placed into 56 jars
(500 ml) and rewetted to 60% water holding capacity (WHC). The jars were incubated
at room temperature. The controls were maintained at 60 ±5% WHC throughout the
experiment by measuring the weight lost by evaporation every 3-4 days and adding a
corresponding amount of deionised water (dH2O).
The soil CO2 efflux in each incubation jar was measured at least once a week and
daily after applying treatments until the CO2 efflux settled. This was done using an
infrared gas analyser with a multiplexer (Li-8100, LiCor Biosciences, Nebraska, USA)
adapted for incubation vessels. Each incubation jar was capped before the
measurements and then flushed for 30 seconds before measuring CO2 efflux for 2
minutes.
Page | 11
Once the soil CO2 efflux of the incubations had stabilised (after 1 week), the
incubation jars were grouped into seven blocks by mean soil CO2 efflux and two jars
within each block were assigned to one of the following treatments: single-litter,
double-litter, litter leachate, and controls without inputs. For the single-litter
treatment, 1.22 g of chopped litter was spread evenly across the surface of the soil;
the litter mass was based on field data from Wytham Woods and represents the
monthly total during peak litterfall in October. Accordingly, 2.44 g of litter were added
to the double-litter treatment. The leachate treatment represented the amount of
leachate from rainfall and prepared litter leachate was added to these incubations to
maintain WHC instead of dH2O. To maintain 60% soil WHC while accounting for the
amount of water absorbed by the litter, the target weight of the single-litter
treatments was increased by 2.5 g and the double-litter treatments by 5 g.
Litter treatments were applied after 1 week and soil CO2 flux from the incubation jars
was measured every 2 days for the following week. Once soil CO2 efflux had
stabilised, half the incubations of each treatment were subjected to severe drought,
whereas the other half was maintained at 60% WHC. This resulted in seven replicate
incubations for each of eight treatments in a factorial design (four litter treatments ×
two drought treatments).
When the soil in the drought treatments reached 5% WHC, the soils were rewet to
60% WHC using dH2O for the control, single-litter and double-litter treatments, and
leachate solution for the leachate treatment. Soil CO2 efflux of all incubations was
measured daily for another seven days after rewetting.

Page | 12
Three to four jars per treatment were destructively sampled for soil analyses
immediately before rewetting and the remaining jars were sampled at the end of the
experiment, c. 1 week after rewetting. The litter was removed from the soil surface
and the soil was homogenised by sieving prior to chemical analyses. Additional soil
samples were taken from each incubation jar to determine total carbon and nitrogen
content, gravimetric soil water content, and soil pH.
Litter mass was determined using 17 extra single-litter and double-litter incubation
jars, which were dried to constant weight at 60 ºC before the litter was carefully
separated from the soil and weighed.
Greenhouse experiment
Experimental set-up
The greenhouse experiment comprised 96 cylindrical pots (21.2 L) filled with 8.5 kg
commercial topsoil (Table 1). 72 pots were planted with established poplar saplings
grown from cuttings (height c. 30-40 cm) and 24 pots were left unplanted. All the
pots were watered to field capacity. To enable measurements of soil CO2 efflux from
the pots, a soil collar made of PVC pipe (9-cm long x 10-cm diameter) was sunk into
the soil to 5-cm depth in each pot; the collar was placed on the north-facing side of
each pot. The pots were kept well-watered for two weeks (establishment period) to
allow the saplings to recover from transplantation before the start of the
experiment.
Page | 13
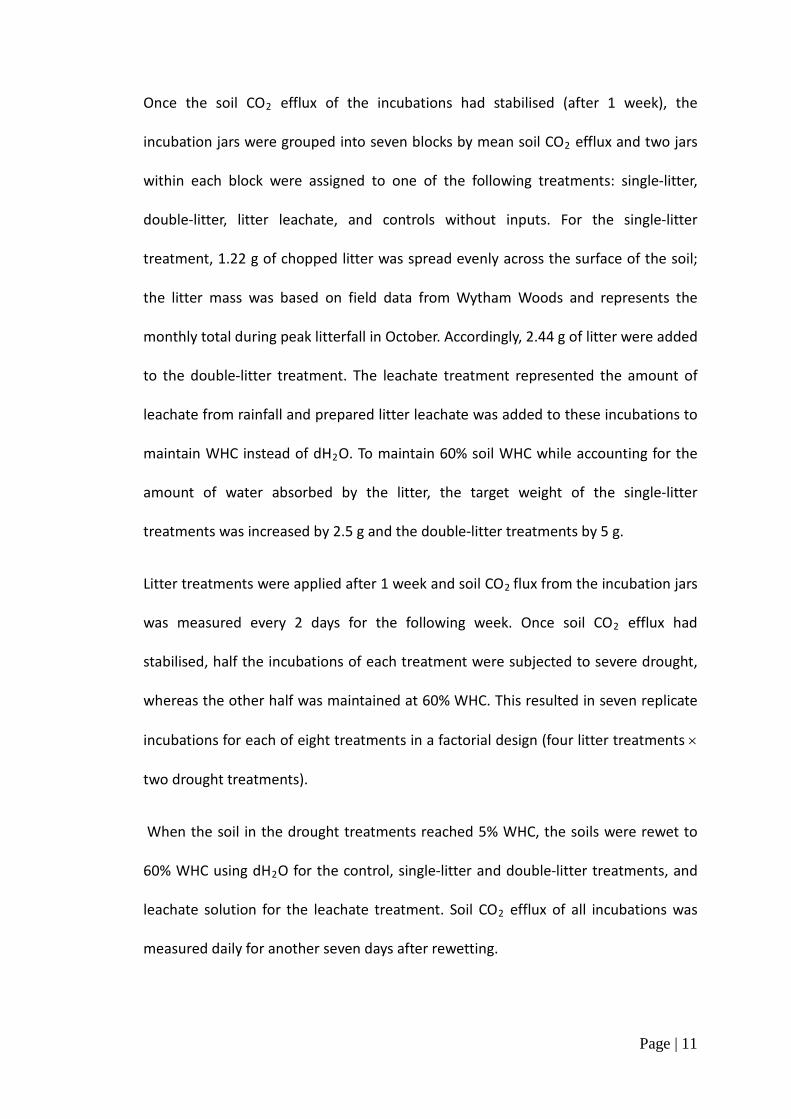
Senesced maize leaves (C content: 43.10%; N content: 1.47%) were used as a
standard litter. The leaves were gathered from Raines Hall Farm in Cumbria, England
after the maize harvest in October 2014. The leaves were dried to constant weight at
60ºC, shredded, homogenised, and then sieved to retain fragments of 2-4 mm
diameter.
Table 1. Initial chemical and physical properties of the commercial topsoil used in the greenhouse experiment, as given by the supplier; the pH value is given for a 1:1 ratio of soil to water.
Soil chemistry Soil texture
Total organic matter (%) 5 Clay 23% Available P (µg g-1) 4.5 Silt 35% Available K (µg g-1) 135 Sand 41% Soil pH 7.1 Fine gravel 1%
Experimental treatments and data collection
Baseline measurements of soil CO2 efflux were taken during the initial establishment
period, after which the pots were randomly subdivided into three groups and the
following litter treatments were applied to 32 pots each: 'single-litter' with 19 g
chopped maize, 'double-litter' with 38 g chopped maize and 'no-litter' controls
without litter inputs. Soil CO2 efflux was measured during 2 weeks after the litter
treatments were applied until it stabilised. Then half the pots per litter treatment
were subjected to a drought treatment and the other half were watered daily.
Hence, there were six treatments in a factorial design (three litter levels and two
drought levels) with a total of 12 replicate planted pots and four replicate unplanted
pots per treatment.

Page | 14
The drought treatment was applied for three weeks, at which point the trees would
not have survived any longer without water (water content: 4.85%) and all pots were
watered to field capacity.
Soil CO2 efflux, soil moisture and soil temperature measurements were taken weekly
throughout the experiment using an Infrared gas analyser (Li-8100, LiCor Biosciences,
Lincoln NE, USA) with a 10-cm diameter soil chamber. Soil CO2 efflux was measured
daily for four days after the start of the litter treatments and for six days after the
soils were rewetted. The litter in the soil collars was carefully removed by hand
before each measurement and then replaced immediately afterwards. Each soil CO2
efflux measurement lasted 2 minutes and the system was flushed for 30 seconds
between each measurement. Soil temperature readings were taken at the same time
as CO2 measurements using a 20 cm probe. Measurements of soil water content
were taken at 0-6 cm using a Theta-probe (Delta-T Devices Ltd., Cambridge UK).
During the drought period, additional measurements were taken at 10-cm and 20-cm
depth by inserting the probe through holes drilled into the side of a subset (32) of
the pots.
Soil cores (0-10 cm depth) were taken at the peak of the drought (planted pots only),
and 1 week after rewetting (all pots). Soil subsamples were used to determine total
carbon and nitrogen content, gravimetric soil water content, and soil pH.

Page | 15
Soil analyses
Soil microbial biomass was determined by chloroform fumigation following Vance et
al. (1987) with modifications as described by Jones & Willett (2006). Briefly, two soil
subsamples of 8 g (dry weight equivalent) were taken from each incubation jar. One
subsample was fumigated with chloroform for 24 hours and both subsamples were
extracted in 40 ml 0.5M K2SO4. The extracts were shaken at 200 rpm for 1 hour,
centrifuged at 3000 rpm and then filtered (2.5 μm). The extracts were stored at 5 ºC
until analysis for total carbon.
For total soil carbon and nitrogen content, subsamples were dried at 60 ºC for 24
hours and ground using a ball mill before analysis on a Vario ELIII Element Analyser
(Elementar, Hessia, Germany). Soil pH was measured in a slurry of 3 g soil in 9 ml
dH2O using a S220 SevenCompact pH meter (Mettler Toledo, Columbus OH, USA).
Data analyses
All statistical analyses were conducted in R version 3.1.3 (R Core Team 2015); linear
mixed effects models were constructed using the nmle package (Pinheiro et al.
2015).
To investigate the effects of litter treatment, drought treatment, and their
interaction on soil respiration, I used linear mixed effects models (lme function) with
litter and drought treatments as fixed effects and time as a random effect. To
account for the variation in room temperature in the greenhouse experiment, the
Page | 16
pots were blocked by average soil temperature, and block was included as an
additional random effect in the models. To determine the significance of each term, I
used nested models and compared the AICs to check for model improvement
(Pinheiro & Bates 2000); where there was no significant difference in the model fit,
the simpler model was chosen.
To assess the effects of litter and drought treatments on soil properties (total C and
N, microbial biomass C) I used linear models. The full models included litter
treatment, drought treatment, and their interaction. The models were simplified by
sequentially dropping terms until a minimal adequate model was reached (Crawley
2007). For the drought treatment only, I also used this approach to investigate the
effects of rewetting and the influence of plants on soil properties. The full model for
the rewetting effect included litter treatment and sampling date (before or after
rewetting) and their interaction; the full model for planting effect included litter
treatment, the presence of plants (planted or unplanted) and their interaction
Results
Incubation experiments
Soil respiration in the incubation jars was extremely low before the start of
treatments. Indeed, soil CO2 efflux was verging on the detection limit of the infrared
gas analyser (0.01 µmol m-2 s-1). Soil CO2 efflux increased by more than one order of
magnitude upon addition of leaf litter to the jars in the double- and single-litter
incubations (Fig. 1). The initial pulse of soil CO2 at the time of litter application was

Page | 17
approximately twice as high in the double-litter compared to the single-litter
treatment. However, there was no detectable change in the incubations that
received the leachate treatment. During the drought phase of the experiment (20th
March - 27th April), there was a noticeable decrease in soil CO2 efflux, with a more
rapid decline in the double-litter treatment compared to the single-litter incubations
(Fig. 2).

Page | 18
Figure 2. Soil CO2 efflux from incubation jars during a three-month experiment with factorial drought and litter manipulation treatments, showing means and standard errors for n = 7 before rewetting and n = 3 or 4 after rewetting. Vertical dotted lines show the application of litter treatments, the start of the drought treatment and the time of rewetting; red squares = 2L drought, orange circles = 2L watered, lime green triangles = 1L drought, green diamonds = 1L watered, turquoise crosses = 0L drought, blue circles = 0L watered, purple triangles = leachate drought and pink squares = leachate watered, where 2L, 1L and 0L are double- single and no-litter treatments, respectively.
Page | 19
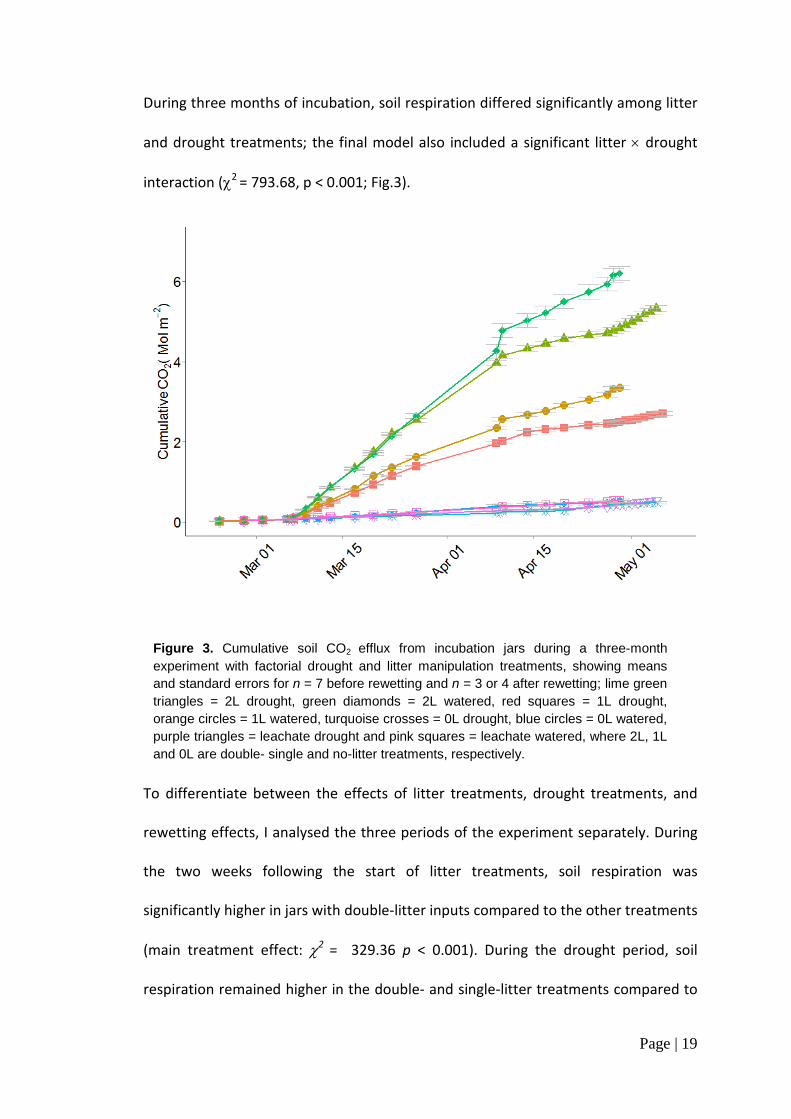
During three months of incubation, soil respiration differed significantly among litter
and drought treatments; the final model also included a significant litter × drought
interaction (χ2 = 793.68, p < 0.001; Fig.3).
To differentiate between the effects of litter treatments, drought treatments, and
rewetting effects, I analysed the three periods of the experiment separately. During
the two weeks following the start of litter treatments, soil respiration was
significantly higher in jars with double-litter inputs compared to the other treatments
(main treatment effect: χ2 = 329.36 p < 0.001). During the drought period, soil
respiration remained higher in the double- and single-litter treatments compared to
Figure 3. Cumulative soil CO2 efflux from incubation jars during a three-month experiment with factorial drought and litter manipulation treatments, showing means and standard errors for n = 7 before rewetting and n = 3 or 4 after rewetting; lime green triangles = 2L drought, green diamonds = 2L watered, red squares = 1L drought, orange circles = 1L watered, turquoise crosses = 0L drought, blue circles = 0L watered, purple triangles = leachate drought and pink squares = leachate watered, where 2L, 1L and 0L are double- single and no-litter treatments, respectively.
Page | 20
the no-litter and leachate treatments. However, the decrease in soil respiration with
drought was greatest in the double-litter treatment and the final model included a
significant litter × drought interaction (χ2 = 491.72 p < 0.001; Fig. 4).
Similarly, the increase in soil respiration after rewetting was greatest in the double-
litter treatment and the final model included a significant litter × drought interaction
(χ2 = 223.94 p < 0.001; Fig. 4).
Total soil carbon and nitrogen content at the end of the drought period were
significantly higher in the double-litter incubations compared to the other litter
treatments (soil C: F3,24 = 4.21, p = 0.016; soil N: F3,24 = 3.86, p = 0.022; Figs. 4 and 5,
respectively). Despite the differences in soil respiration, microbial biomass C was
similar among drought and litter treatments both before and after rewetting (Fig. 7).
In the incubation jars with litter additions, there was no effect of drought on litter
decomposition but relative mass loss was greater in the single-litter compared to the
double-litter treatments (F2,14 = 5.44, p = 0.018; Fig. 8).
In the incubations subjected to drought, there were no significant differences in soil
C, N or microbial biomass before and after rewetting in any of the litter treatments.

Page | 21
a)
b)
Figure 4 Differences in soil CO2 efflux between drought treatments for incubation jars with a) double-litter inputs and b) single-litter inputs during a three-month experiment, showing means and standard errors for n = 7 before rewetting and n = 3 or 4 after rewetting; vertical dotted lines show the application of litter treatments, the start of the drought treatment and the time of rewetting, respectively; red squares indicate the drought treatment and blue circles are watered jars.

Page | 22
Figure 5 Soil carbon content in droughted (orange) and watered (blue) incubations with different litter addition treatments, measured before rewetting and after rewetting; boxplots show 1st and 3rd quartiles and 95% confidence interval of medians for n = 3 or 4.
Figure 6 Soil nitrogen content in droughted (orange) and watered (blue) incubations with different litter addition treatments, measured before and after rewetting; boxplots show 1st and 3rd quartiles and 95% confidence interval of medians for n = 3 or 4.

Page | 23
Figure 7. Soil microbial biomass carbon in droughted (orange) and watered (blue) incubations with different litter addition treatments, measured before rewetting and after rewetting; boxplots show 1st and 3rd quartiles and 95% confidence interval of medians for n = 3 or 4.
Figure 8. Relative mass loss of litter at the end of a three-month incubation experiment in droughted
(orange) and watered (blue) jars with different litter addition treatments; boxplots show 1st and 3rd
quartiles and 95% confidence interval of medians for n = 3-5.

Page | 24
Greenhouse experiment
Similar to the incubation experiments, there were four distinct periods in the pattern
of soil respiration during the course of the study: 1) a one-week establishment period
before the application of the litter treatments; 2) a two-week pre-drought period, in
which the largest litter treatment effects were observed; 3) the main drought period
in which soil CO2 efflux declined steadily in most drought pots; and 4) the rewetting
period, with highly variable soil CO2 efflux (Fig. 9).
Soil respiration
Overall, soil CO2 efflux was significantly affected by litter additions and drought
treatments relative to controls (χ2 = 175.35, p < 0.001). Soil respiration was
noticeably lower in the drought treatment compared to the watered pots and soil
respiration also tended to increase with the amount of litter added (Fig. 8) but there
was no significant litter × drought interaction (χ2 = 0.981, p = 0.7542).
In the planted pots, I observed a distinct peak in soil CO2 efflux in response to the
application of litter treatments in the second week of the study (Fig. 11). Over the
remaining study period, soil CO2 efflux in the watered pots was consistently higher in
the double-litter treatment (mean: 2.33 umol m-2 s-1) compared to the no-litter
treatment (mean: 1.62 umol m-2 s-1).
In pots without trees, there was a similar peak in respiration after litter addition and
soil respiration was also highest in the double-litter treatments but the effects of
drought were less clear because soil CO2 efflux was lower in the watered pots than in
the drought treatment (Figure 12).

Page | 25
a)
b)
Figure 9 Soil respiration in pots planted with poplar cuttings with different litter treatments and a) subjected to a drought treatment or b) watered daily, showing the distinct periods during the experiment; means and standard errors are given for n = 12; red circles are double-litter treatments, blue squares are single-litter treatments and green triangles are no-litter treatments.

Page | 26
a)
b)
Figure 10 Cumulative soil CO2 efflux in a) pots planted with poplar seedlings and b) unplanted pots during a three-month greenhouse experiment with factorial drought and litter manipulation treatments; means and standard errors are given for n = 12 and n = 4 for planted and unplanted pots, respectively; yellow circles = 2L watered, red squares = 2L drought, turquoise diamonds = 1L watered, green triangles = 1L drought, pink circles = 0L watered and blue crosses = 0L drought, where 2L, 1L and 0L are double- single and no-litter treatments, respectively.

Page | 27
a)
b)
c)
Figure 11 Soil respiration in pots planted with poplar cuttings and with a) double-litter, b) single-litter and c) no-litter treatments; blue triangles indicate watered treatments and red circles show droughted pots; means and standard errors are shown for n = 12.

Page | 28
a)
b)
c)
Figure 12 Soil respiration in unplanted pots with a) double-litter, b) single-litter and c) no-litter treatments; blue triangles indicate non-drought treatments and red circles show droughted pots; means and standard errors are shown for n = 4.

Page | 29
Effects of drought and litter additions on soil respiration
For the drought period, the best model included the litter and drought treatments
but not their interaction (χ2 = 89.299, p < 0.001); overall, the litter treatments
explained more of the variation in soil CO2 efflux than drought (litter treatment
effect: χ2 = 10.7668 p < 0.001; Fig. 11).
In the period immediately after the drought, when the birch effect is typically
observed, only the litter treatments had a significant effect on soil CO2 efflux (χ2 =
38.089, p < 0.001). Surprisingly, including the drought treatment did not improve the
model fit (χ2 = 1.3438; p = 0.2464). A comparison of planted and unplanted pots after
rewetting showed the presence of trees and the litter treatments had a significant
effect on soil CO2 efflux (χ2 = 33.05, p < 0.001), but there were no interactions
between any of the treatments.
Treatment effects on soil microbial biomass and soil chemistry
In pots planted with poplar cuttings, there were no differences in soil C, soil N or
microbial biomass C at the peak of the drought period. However, after rewetting,
total soil C was higher in drought treatments compared to watered pots regardless of
litter treatment (F3,18 = 3.93, p = 0.025; Fig. 13) and there was a significant litter x
drought interaction on total soil N (F5,16 = 5.11; p = 0.005); total N in the soil after
rewetting was highest in the drought treatments with single-litter addition (Fig. 14).

Page | 30
In the unplanted pots, total soil C after rewetting was best described by the model
including the interaction of drought and litter treatments (F5,18 = 3.011; p = 0.038);
total soil C was higher in drought treatments compared to watered pots and the
difference was greatest with single-litter addition (Fig. 13). Soil microbial biomass C
in unplanted pots was unaffected by litter addition but was marginally lower in
Figure 13. Total soil carbon in droughted (orange) and watered (blue) pots with different litter addition treatments, measured at the peak of the drought period (before rewetting, planted pots only) and after rewetting at the end of the experiment; boxplots show 1st and 3rd quartiles and 95% confidence interval of medians for n = 12 and n = 4 for planted and unplanted pots, respectively.

Page | 31
drought treatments compared to watered pots at the end of the study (main
treatment effect: F3,20 = 2.83; p = 0.064; Fig. 15).
Figure 14. Total soil nitrogen in droughted (orange) and watered (blue) incubations with different litter addition treatments, measured at the peak of the drought period (before rewetting, planted pots only) and after rewetting at the end of the experiment; boxplots show 1st and 3rd quartiles and 95% confidence interval of medians for n = 12 and n = 4 for planted and unplanted pots, respectively.

Page | 32
Figure 15. Microbial biomass carbon in droughted (orange) and watered (blue) pots with different litter addition treatments, measured at the peak of the drought period (before rewetting, planted pots only) and after rewetting at the end of the experiment; boxplots show 1st and 3rd quartiles and 95% confidence interval of medians for n = 12 and n = 4 for planted and unplanted pots, respectively.
In the pots subjected to drought, there was a significant increase in total soil C after
rewetting (F3,20 = 3.29, p = 0.04), and although there was no significant drought x
litter interaction, the most pronounced increase was observed in the single-litter
treatment (Fig. 15). Microbial biomass carbon was greater after rewetting regardless
of litter treatment or the presence of plants (F3,17 = 3.22, p = 0.049; Fig. 16).

Page | 33
Figure 16. Soil carbon and nitrogen content and microbial biomass carbon in droughted pots planted with polar cuttings and with different litter addition treatments, measured at the peak of the drought period (red boxes) and after rewetting at the end of the experiment (yellow boxes); boxplots show 1st and 3rd quartiles and 95% confidence interval of medians for n = 12.

Page | 34
Discussion
The main goal of my experiments was to investigate the possible interaction
between the Birch effect and the priming effect and their influence on soil
respiration after drought. The results from the two different experiments tell
different stories: in the incubation experiment, I only observed a response to drought
in the treatments with added litter but there was little or no response to drought in
the leachate and no-litter treatments. On the other hand, the results from the
greenhouse show a strong drought response in planted pots but little interaction
between litter and drought treatments. Extra litter additions increased respiration
whereas the presence of poplar trees decreased the size of the Birch effect.
Incubation experiment
In my incubation experiments, the litter additions had an overall greater effect on
soil respiration and soil properties than the drought treatment. The soil I used for the
incubations was an artificial commercial ‘topsoil’, with very poor soil structure and
very low biologically available carbon. As soil microorganisms are generally carbon-
limited (Smith & Paul 1990), the litter additions were probably necessary for
microbial growth. Consequently, soil nitrogen and carbon content was higher in the
double-litter treatment before rewetting, regardless of whether the incubations had
been subjected to drought or kept watered.
The extremely low respiration rates in the incubation jars at the start of the
experiment indicates that the soil organic matter content was insufficient to sustain
much microbial activity. Consequently, it is likely that the pulse of CO2 measured
after the application of the litter treatments was largely due to soil microbial growth

Page | 35
and the rapid colonization by microorganisms (fungal mycelia and bacteria) of the
added litter (Romani et al. 2006; Steffen et al. 2007; Snajdr et al. 2008). This is
supported by the larger peak in response to the double-litter addition, which was
approximately twice as high as the single-litter treatment. Correspondingly, soil
respiration in the double-litter incubations declined much more rapidly after the
start of drought, as water becomes limiting and the litter on the soil surface dried out
rapidly (Clein and Schimel 1994; Berg et al. 1998). Leaching of organic solutes
contributes to litter decomposition (Cotrufo et al. 2015) but the negligible effects of
the leachate treatments on CO2 efflux suggest that the mineralization of dissolved
organic carbon from litter and artificial leachates did not contribute substantially to
the observed microbial respiration in my study.
Although the drought imposed on the incubations was severe, I did not observe the
characteristic peak in soil CO2 efflux during the first three to four days upon
rewetting that is usually associated with the Birch effect (Kim et al. 2012; Fig. 3). This
is likely a result of the lack of soil structure in the artificial ‘commercial topsoil’, as
the presence of soil aggregates (Denef et al. 2001) and fine particles to which organic
solutes associate (Lundquist et al. 1999; Wang et al. 2003; Casals et al. 2009) are
thought to play a key role in the Birch effect. Instead, respiration increased steadily
over the course of a week after rewetting. Three different mechanisms could explain
the pattern in soil CO2 efflux after rewetting: i) leaching of labile components from
the litter (Hagedorn and Machewitz 2007), ii) further microbial colonisation of the
remaining litter, and iii) soil microbial growth and recovery from dormancy (Schimel
et al. 2007). In my study, the peak in respiration in the droughted double-litter jars
after rewetting is probably a combination of the three mechanisms, whereby a larger
Page | 36
amount of labile carbon from the remaining litter was available to microbial
decomposers, which fuelled a sudden increase in microbial growth and colonisation
of the litter. This explains the higher microbial biomass after rewetting (Fig. 6) and
the greater relative mass loss of litter in the double-litter drought treatments (Fig. 7).
Unexpectedly, the leachate treatment appeared to have no effect on soil respiration
and a negligible effect on microbial biomass. Tree litter leachates are thought to be a
major source of labile C for soil microbes (Kalbitz et al. 2000; Don and Kalbitz 2005).
However, some studies have challenged this assumption, suggesting that only a
fraction of the carbon in leachates is immediately available to soil microbes (Qualls
and Haines 1992; De Troyer et al. 2011). The easily-degradable carbon in leachate
can be consumed in a matter of hours (De Troyer et al. 2011), whereas recalcitrant
solutes take a long time to decompose (Qualls and Haines 1992). In my incubations,
soil respiration in the leachate treatments was very low (Figs. 1 and 2) which
supports the notion that only a small fraction of the carbon was available for
microbial use. In addition, I took soil CO2 measurements at least one day and up to
four days after applying leachates. Hence, given the rapid cycling of the labile carbon
from leachate (De Troyer et al. 2011), any potential microbial respiration in response
to leachate addition could have happened very rapidly and not shown up in my
measurements.
Greenhouse experiment
Overall the litter treatments had a greater effect on soil respiration than rewetting. It
is important to note that soil respiration in the greenhouse experiment was strongly
influenced by litter treatment, even though litter was removed from the soil collars

Page | 37
before measurements. This approach has previously been used in field studies using
litter manipulation treatments because it excludes variation due to decomposition of
different amounts of litter on the soil surface (Sayer et al. 2007), which allowed me
to observe belowground responses to litter and drought treatments.
Once the drought treatment was applied, there was a notable rapid drop in soil
respiration in the drought treatments with poplar cuttings (Fig. 10), whereas the
unplanted pots maintained high respiration rates throughout the drought period (Fig.
11). The drought treatment was more effective in planted pots because plant water
uptake (and transpiration) will have contributed to rapid desiccation of the soil
(Jackson et al. 2000). To partly compensate for this in the unplanted pots, I extended
the drought period for an extra week until they reached the same soil moisture
content as the planted pots.
I only analysed the data from unplanted pots subjected to the drought treatment
because the watered pots without poplar cuttings quickly became waterlogged. At
the start of the experiment, I decided to add the same quantity of water to all the
watered pots because it was not feasible to individually determine water holding
capacity in all 96 pots. I calculated the required amount of water for the planted pots
but this proved to be too much for the unplanted pots due to the lack of water
uptake by plants and the soil became waterlogged. Soil waterlogging is likely to have
contributed to the lower respiration rates observed in the unplanted watered pots
(Fig. 11), as it reduces air volume in soil pores, which can suppress microbial activity
and gas diffusion (Linn and Doran 1984).

Page | 38
The drought treatment in the planted pots was highly effective; I observed
substantial leaf loss from the poplars, which highlights the importance of considering
the effect of additional litter inputs to the soil during severe drought. Indeed, the
lack of clear differences in respiration rates between litter treatments after rewetting
in the droughted pots could conceivably be a result of litterfall from the stressed
plants. Even though I endeavoured to remove the extra litter from the pots regularly,
it could have contributed nutrients and carbon to the soil before it was removed and
may explain the large increase in total soil carbon in the single-litter treatment after
rewetting (Fig. 12).
I rewet the soil shortly before the plants had reached permanent wilting point to
maximise the drought conditions but avoid killing the poplars. As the poplar trees
were placed under severe stress, it is likely that significant fine-root mortality
occurred within the pots. This would have provided another source of carbon and
nutrients into the soil after rewetting (Jones et al. 2004). The additional carbon and
nitrogen from plant litter probably decreased the difference in microbial biomass
carbon among the litter treatments by providing labile C for immediate use by soil
microbes. It could also partly explain the higher carbon and nitrogen content after
rewetting in drought treatment compared to the watered treatments (Fig. 12-14).
Many soils have a tendency to crack when undergoing drought. This phenomenon is
normally exacerbated where the soil is contact with a solid object, such as the soil
collars and the edge of pots. I did not measure soil respiration when the soil inside
the collars was badly cracked, as the cracking would have changed the CO2 efflux in
two ways; first the cracking increases the surface area of the soil while at the same

Page | 39
time exposing lower depths to the air; this exposure can increase the amount of CO2
released from the soil (Rochette and Hutchinson 2005). Secondly, the cracks in the
soil can potentially compromise the seal between the chamber and the soil collars
during measurements. If the system is not properly sealed, air will be exchanged with
the atmosphere during the measurements and the accumulation of the CO2 is
disrupted.
After the rewetting event, there was a much smaller CO2 efflux response in the pots
planted with poplar cuttings compared to those without plants, even though the
drought had a greater effect on soil respiration in the planted pots. Soil respiration in
the planted pots recovered to values similar to those observed in the non-drought
treatments but did not exceed them (Fig. 10), which would be expected with Birch
effects. This lack of a large peak in soil CO2 efflux differs from the majority of the
literature on drying and rewetting effects on soil, as many of the experiments are
conducted without plants (Mikha et al. 2005; Miller et al. 2005; Wu & Brookes 2005;
Beare et al. 2009; Xiang et al. 2008). This change in the pattern of soil CO2 efflux with
the presence of plants is most likely due to the complex interaction between soil
microbes and root products, in particular root exudates. Although a full investigation
of these interactions was beyond the scope of my experiments, it presents an
interesting avenue for future research. Plant-soil interactions are central to a large
number of important biogeochemical processes and they are also influenced by
properties of both the soil and the roots (Bouma & Bryla 2000). To further
complicate matters, interactions between the rhizosphere and the bulk soil are not
uniform throughout the soil, as root growth varies greatly in space and time.

Page | 40
The comparison of the drought treatments before and after rewetting revealed a
sizeable increase in microbial biomass carbon suggesting an increase in microbial
growth upon rewetting, possibly as a result of dead root material (discussed above).
The higher soil carbon content in droughted pots after rewetting is probably largely
accounted for by this microbial growth (Fig. 15). Thus, although I did not observe the
clear peak in soil CO2 efflux associated with typical Birch effects, my results indicate
that the more gradual increase in soil respiration after rewetting is a result of
increased microbial biomass and activity, which is sustained by root carbon inputs.
Conclusions
I found evidence to suggest that the presence of plant roots moderated the release
of CO2 from the soil after severe drought and that plant roots reduced the amount of
CO2 potentially released through priming effects in response to increased litter
inputs However, I was unable to determine conclusively whether the observed
responses were indeed Birch effects and priming effects. Further work is required to
determine whether Birch effects and priming effects have an interactive effect on
soil carbon release. There are also many possibilities to take the work beyond the
initial scope of these experiments; interesting future avenues for research could
include the effect of tree species, the influence of soil type, differences in the length
and severity of drought, repeated rewetting and drying cycles, and importantly,
scaling up experiments to simulate field conditions. This last point is critical, as both
priming and Birch effects could result in substantial release of CO2 from soils after

Page | 41
drought, and we need to understand how different mechanisms and feedbacks affect
one another to predict carbon dynamics in ecosystems under global change.

Page | 42
References
Bapiri, A., Baath, E. & Rousk, J. (2010) Drying-rewetting cycles affect fungal and
bacterial growth differently in an arable soil. Microbial Ecology 60:419-428.
Batjes N.H. (1996) Total carbon and nitrogen in the soils of the world. European
Journal of Soil Science 47: 151–163.
Beare, M.H., Gregorich, E.G. & St-Georges, P. (2009) Compaction effects on CO2 and
N2O production during drying and rewetting of soil. Soil Biology and
Biochemistry 41:611-621.
Berg, M.P., Kniese, J.P., & Verhoef, H.A. (1998) Dynamics and stratification of
bacteria and fungi in the organic layers of a scots pine forest soil. Biology and
Fertility of Soils 26:313-322.
Blagodatskaya, E. & Kuzyakov, Y. (2008) Mechanisms of real and apparent priming
effects and their dependence on soil microbial biomass and community
structure: critical review. Biology and Fertility of Soils 45:115-131.
Borken, W., Savage, K., Davidson, E.A. & Trumbore, S.E. (2006) Effects of
experimental drought on soil respiration and radiocarbon efflux from a
temperate forest soil. Global Change Biology 12: 177–193
Bottner, P. (1985). Response of microbial biomass to alternate moist
and dry conditions in a soil incubated with 14C and 15N labelled plant material dynamics Soil Biology and Biochemistry . 17:329–337
Bouma, T.J. & D.R. Bryla. (2000) On the assessment of root and soil respiration for
soils of different textures: interactions with soil moisture contents and soil CO2
concentrations. Plant and Soil 227:215-221.
Brando, P.M., Nepstad, D.C., Davidson, E.A., Trumbore, S.E., Ray, D. & Camargo, P.
(2008) Drought effects on litterfall, wood production and belowground carbon
cycling in an Amazon forest: results of a throughfall reduction experiment.
Philosphical Transactions of the Royal Society B 363:1839-1848

Page | 43
Casals, P., Gimeno, C., Carrara, A., Lopez-Sangil, L. & Sanz, M.J. (2009) Soil CO2 efflux
and extractable organic carbon fractions under simulated precipitation events in
a Mediterranean Dehesa. Soil Biology and Biochemistry 41:1915-1922.
Clein, J.S. & Schimel, J.P. (1994) Reduction in microbial activity in birch litter due to
drying and rewetting events. Soil Biology and Biochemistry 26:403-406.
Cleveland, C.C., Wieder, W.R., Reed, S.C. and Townsend, A.R. (2010) Experimental
drought in a tropical rain forest increases soil carbon dioxide losses to the
atmosphere. Ecology 91: 2313–2323.
Cotrufo, M.F., Soong, J.L., Horton, A.J., Campbell, E.E., Haddix, M.L., Wall, D.H. &
Parton, W.J. (2015) Formation of soil organic matter via biochemical and physical
pathways of litter mass loss. Nature Geoscience 8:776-779.
Craine, J.M., Morrow, C. & Fierer, N. (2007) Microbial nitrogen limitation increases
decomposition. Ecology, 88:2105-2113.
Crawley, M. J. (2007) The R Book, Chichester, Wiley-Blackwell.
Crow, S.E., Lajtha, K., Bowden R.D., Yano, Y. Brant, J.B., Caldwell, B., et al. (2009)
Increased coniferous needle inputs accelerate decomposition of soil carbon in an
old-growth forest. Forest Ecology and Management 258:2224-2232.
De Troyer, I., Amery, F., Van Moorleghem, C., Smolders, E. & Merckx, R. (2011)
Tracing the source and fate of dissolved organic matter in soil after incorporation
of a 13C labelled residue: A batch incubation study. Soil Biology and Biochemistry
43, 513–519.
Denef, K., Six, J., Paustian, K. & Merckx, R. , H. Bossuyt, S.D. Frey, E.T. Elliot (2001)
Influence of dry–wet cycles on the interrelationship between aggregate, particulate organic matter, and microbial activity dynamics Soil Biology and Biochemistry 33, 1599–1611
Denef, K., Six, J., Paustian, K. & Merckx, R. (2001) Importance of macroaggregate
dynamics in controlling soil carbon stabilization: short-term effects of physical
disturbance induced by dry-wet cycles. Soil Biology and Biochemistry 33, 2145-
2153

Page | 44
Don, A. & Kalbitz, K. (2005) Amounts and degradability of dissolved organic carbon
from foliar litter at different decomposition stages. Soil Biology and Biochemistry
37, 2171-2179.
Fierer, N. and J.P. Schimel. (2002). Effects of drying–rewetting frequency on soil
carbon and nitrogen transformations Soil Biology and Biochemistry.34:777–787.
Fontaine, S., Mariotti, A. & Abbadie, L. (2003) The priming effect of organic matter: a
question of microbial competition? Soil Biology and Biochemistry 35:837-843.
Fuchslueger, L., Bahn, M., Fritz, K., Hasibeder, R. & Richter, A. (2014) Experimental
drought reduces the transfer of recently fixed carbon to soil microbes and alters
the bacterial community composition in a mountain meadow. New Phytologist
201:916-927.
Hagedorn, F. & Machewitz, M. (2007) Controls on dissolved organic matter leaching
from forest litter grown under elevated atmospheric CO2. Soil Biology and
Biochemistry 39:1759-1769.
Jackson, R.B., Sperry, J.S., & Dawson, T.E. (2000) Root water uptake and transport:
using physiological processes in global predictions. Trends in Plant Science 5:482-
488.
Jarvis, P., Rey, A., Petsikos, C., Wingate, L., Rayment, M., Pereira, J., Banza, J., David,
J., Miglietta, F., Borghetti, M., Manca, G. & Valentini, R. (2007) Drying and
wetting of Mediterranean soils stimulates decomposition and carbon dioxide
emission: the “Birch effect”. Tree Physiology 27:929-940.
Jones, D.L., Hodge, A., Kuzyakov, Y. (2004) Plant and mycorrhizal regulation of
rhizodeposition. New Phytologist 163:459-480.
Jones, D.L. & Willet, V.B. (2006) Experimental evaluation of methods to quantify
dissolved organic nitrogen (DON) and dissolved organic carbon (DOC) in soil. Soil
Biology & Biochemistry 38:991-999.
Kalbitz, K., Solinger, S., Park, J.H., Michalzik, B. & Matzner, E. (2000) Controls on the
dynamics of dissolved organic matter in soils: a review. Soil Science 165:277-304.
Killham K. (1994) Soil Ecology. Cambridge University Press, Cambridge, UK. 242 pp.

Page | 45
Kim, D.G., Vargas, R., Bond-Lamberty, B. & Turetsky, M.R. (2012) Effects of soil
rewetting and thawing on soil gas fluxes: a review of current literature and
suggestions for future research. Biogeosciences 9:2456-2483.
Kuzyakov, Y., Friedel, J. K. & Stahr, K. (2000) Review of mechanisms and
quantification of priming effects. Soil Biology and Biochemistry 32:1485-1498.
Linn, D.M. & Doran, J.W. (1984) Effect of water-filled pore-space on carbon-dioxide
and nitrous-oxide production in tilled and nontilled soils. Soil Science Society of
America Journal 48:1267-1272.
Lundquist, E.J., Jackson, L.E. & Scow, K.M. (1999) Wet-dry cycles affect dissolved
organic carbon in two California agricultural soils. Soil Biology and Biochemistry
31:1031-1038.
Mikha, M.M., Rice, C.W. & Milliken, G.A. (2005) Carbon and nitrogen mineralization
as affected by drying and wetting cycles. Soil Biology and Biochemistry 37:339-
347.
Miller, A.E., Schimel, J.P., Meixner, T., Sickman, J.O. & Melack, J.M. (2005) Episodic
rewetting enhances carbon and nitrogen release from chaparral soils. Soil
Biology and Biochemistry 37:2195-2204.
Munné-Bosch, S. & Alegre, L. (2004) Die and let live: leaf senescence contributes to
plant survival under drought stress. Functional Plant Biology 31:203-216.
Ogaya, R. & Peñuelas, J. (2007) Tree growth, mortality, and above-ground biomass
accumulation in a holm oak forest under a five-year experimental field drought.
Plant Ecology 189:291-299.
Pinheiro J.C., Bates D.M., DebRoy S., Sarkar D. & R Core Team (2015) nlme: Linear
and Nonlinear Mixed Effects Models. R package version 3.1-120.
Pinheiro, J.C. & Bates, D.M. (2000) Mixed-Effects Models in S and S-PLUS. Springer,
New York.
Qualls, R. & Haines, B.L. (1992) Biodegradability of dissolved organic matter in forest
throughfall, soil solution, and stream water. Soil Science Society of America
Journal 56:578-586.

Page | 46
R Core Team (2015) R: A language and environment for statistical computing. R
Foundation for Statistical Computing, Vienna, Austria. http://www.R-
project.org/.
Raich, J.W. & Schlesinger, W.H. (2002) The global carbon dioxide flux in soil
respiration and its relationship to vegetation and climate. Tellus B 44: 81–99.
Rochette, P. & Hutchinson, G.L. (2005) Measurement of soil respiration in situ:
chamber techniques. In: Hatfield, J.L. & Baker, J.M. (Eds), Micrometeorology in
agricultural systems, pp. 247-286. American Society of Agronomy, Madison, WI,
USA.
Romani, A.M., Fischer, H., Mille-Lindblom, C. & Tranvik, L.J. (2006) Interactions of
bacteria and fungi on decomposing litter: differential extracellular enzyme
activities. Ecology 87:2559-2569.
Ryan, M.G. (2011) Tree responses to drought. Tree Physiology 31:237-239
Sayer, E.J., Powers, J.S. & Tanner, E.V.J. (2007) Increased litterfall in tropical forests
boosts the transfer of soil CO2 to the atmosphere. PLoS One 2:e1299.
Sayer, E.J. (2014) The forest for the trees. Frontiers of Biogeography, 6(3) fb_23853.
Scheik, C.S., Beaslet, W.H., Elshahed, M.S., Zhou, X., Luo, Y. & Krumholz R. (2011)
Effect of warming and drought on grassland microbial communities. The ISME
Journal 5:1692-1700.
Schimel, J., Balser, T.C. & Wallenstein, M. (2007) Microbial stress-response
physiology and its implication for ecosystem function. Ecology 88:1386-1394.
Schreeg, L. A., Mack, M. C., & Turner, B. L. (2013) Leaf litter inputs decrease
phosphate sorption in a strongly weathered tropical soil over two time scales.
Biogeochemistry 113:507-524.
Smith, J.L. & Paul, E.A. (1990) The significance of soil microbial biomass estimations.
In: Soil Biochemistry Eds. J Bollag & G Stotzky. Vol. 6, pp 357-396. Marcel Decker,
New York.
Snajdr, J., Valaskova, V., Merhautova, V., Cajthmal, T. & Baldrian, P. (2008) Activity
and spatial distribution of lignocellulose-degrading enzymes during forest soil

Page | 47
colonization by saprotrophic basidiomycetes. Enzyme and Microbial Technology
43:186-192.
Steffen, K.T., Cajthaml, T., Snajdr, J. & Baldrian, P. (2007) Differential degradation of
oak (Quercus petraea) leaf litter by litter-decomposing basidiomycetes. Research
in Microbiology 158:447-455.
Subke, J.A., Hahn, V., Battipaglia, G., Linder, S., Buchmann, N. & Cotrufo, M.F. (2004)
Feedback interactions between needle litter decomposition and rhizosphere
activity. Oecologia 139:551-559.
Swift, R.S. (2001) Sequestration of carbon by soil. Soil Science 166:858-871.
Vance, E.D., Brookes, P.C. & Jenkinson, D.S. (1987) An extraction method for
measuring soil microbial biomass C. Soil Biology & Biochemistry 19:703–707.
van Gestel, M., Merck, R. & Vlassak, K. (1993) Microbial biomass responses to soil
drying and rewetting: The fate of fast- and slow-growing microorganisms in soils
from different climates. Soil Biology and Biochemistry 25:109-123.
Wang, W.J., Dalal, R.C., Moody, P.W. & Smith, C.J. (2003) Relationships of soil
respiration to microbial biomass, substrate availability and clay content. Soil
Biology and Biochemistry 35:273-284.
Wieder, W.R., Bonan, G.B., & Allison, S.D. (2013) Global carbon projections are
improved by modelling microbial processes. Nature Climate Change 3:909-921.
Wu, J. & Brookes, P.C. (2005) The proportional mineralisation of microbial biomass
and organic matter caused by air-drying and rewetting of a grassland soil. Soil
Biology and Biochemistry 37:507-515.
Xiang, S.-R., Doyle, A., Holden, P.A. & Schimel, J.P. (2008) Drying and rewetting
effects on C and N mineralization and microbial activity in surface and
subsurface California grassland soils. Soil Biology and Biochemistry 40:2281-
2289.
Zak, D.R., Pregitzer, K.S., Burton, A.J., Edwards, I.P. & Kellner, H. (2011) Microbial
responses to a changing environment: implications for the future functioning of
terrestrial ecosystems. Fungal Ecology 4:386-395.

Page | 48
Appendix
a)
b)
Figure A. Photographs of the experiments described in this thesis a) jars used for the incubation experiment with and without lids and different drought treatments b) some of the poplar
saplings in the greenhouse pot experiment.

Page | 49
Figure B. Average soil temperatures in pots in the greenhouse experiment, showing standard errors of means for n = 96.

Page | 50
1
Figure C Gravimetric soil water content for individual incubation jars with varying amounts of litter, where 0L is no litter, 1L is single litter and 2 2L is double litter addition. . 3
0
5
10
15
20
25
30
17-Mar 22-Mar 27-Mar 01-Apr 06-Apr 11-Apr 16-Apr 21-Apr 26-Apr
Gra
vim
etric
Wat
er C
onte
nt (
g)
0L-10L-20L-30L-40L-50L-61L-11L-21L-31L-41L-51L-61L-72L-12L-22L-32L-42L-52L-62L-7Leachate-1Leachate-2Leachate-3Leachate-4Leachate-5Leachate-6Leachate-7