The Influence of Enterprise Risk Management on Insurers ...
14
The Influence of Enterprise Risk Management on Insurers’ Stock Market Performance: An Event Analysis Dr. Madhu Acharyya Copyright 2009 by the Society of Actuaries. All rights reserved by the Society of Actuaries. Permission is granted to make brief excerpts for a published review. Permission is also granted to make limited numbers of copies of items in this monograph for personal, internal, classroom or other instructional use, on condition that the foregoing copyright notice is used so as to give reasonable notice of the Society's copyright. This consent for free limited copying without prior consent of the Society does not extend to making copies for general distribution, for advertising or promotional purposes, for inclusion in new collective works or for resale.
Transcript of The Influence of Enterprise Risk Management on Insurers ...

The Influence of Enterprise Risk Management on Insurers’ Stock Market Performance: An Event Analysis
Dr. Madhu Acharyya
Copyright 2009 by the Society of Actuaries. All rights reserved by the Society of Actuaries. Permission is granted to make brief excerpts for a published review. Permission is also granted to make limited numbers of copies of items in this monograph for personal, internal, classroom or other instructional use, on condition that the foregoing copyright notice is used so as to give reasonable notice of the Society's copyright. This consent for free limited copying without prior consent of the Society does not extend to making copies for general distribution, for advertising or promotional purposes, for inclusion in new collective works or for resale.

2
Abstract Enterprise risk management (ERM) increases shareholder value. In this study we test whether
ERM influences insurers’ stock market performance. The results indicate that insurers’ stock market performance is linked to the characteristic of industry events and specific firm characteristics rather than to the success of ERM. In this study the 2007–2008 subprime mortgage and financial market crisis was found unique compared to other industry events. The study recommends further research on the methodology of determining the value of ERM from the joint perspective of finance theories and management theories.

3
Introduction Risk management is the primary function of insurance companies. In the traditional business
model, insurance companies underwrite insurable risks and manage such risks through pooling with reinsurers, insurers and other risk carriers. The proceeds of the premium are invested in the real estate market and capital market in the form of bonds and shares to generate revenue. In addition, insurers raise capital (debt) from investors to fund their commitment to policyholders in case of any adverse movement of liabilities. In particular, insurers always must maintain a certain level of capital to remain technically solvent. Consequently, the key concern of all insurers is “solvency risk.” Research suggests that due to the globalized insurance market and capital market and changed business models due to the increased incidence of natural and man‐made catastrophes, it is insufficient to management risk in silos, in particular, large global insurers. This has further been accelerated by the release of the sophisticated version of the solvency regulations (e.g., Solvency II, RBC) and advanced financial rating criteria fostering a holistic view of risk management.
The purpose of this study is to examine the link of insurers’ ERM to their stock market
performance. In this study ERM in insurance is defined as the management of insurers’ all significant risks in a holistic framework. It operationally includes the integration of financial (including market, credit and liquidity), insurance, operational and hazard risks—termed hereinafter as enterprise risk (Casualty Actuarial Society, 2003). The fundamental idea of ERM is to evaluate the performance (e.g., risk‐adjusted returns on operations) of the line of businesses including business units in a common framework (or basis) across the group. In other words, ERM is to manage the business of the entire organization under one capital umbrella. It is believed that aggregating enterprise risk in a holistic framework maximizes benefits of the diversification of the portfolio of insurance risks across its lines of business (general insurance, life insurance and retirement services, financial services and asset management), risk categories (property & casualty insurance, life insurance, credit, market and operational risks) and geographies based on the degree of correlations amongst them. Theoretically, the risk‐adjusted return on a well constructed, diverse portfolio of risk will, all other things being equal, be greater than the risk‐adjusted return on a concentrated portfolio. It is assumed that diversification benefits significantly reduce required economic capital and, thus, increase the firm’s estimate of excess capital. It is understood that a lot of insurers have made significant investments to implement ERM since the 1990s. However, there are challenges of implementing ERM, such as inconsistency in risk models (due to uneven risk profiles); inadequacy and inconsistency of data; developing appropriate assumptions and methodologies to support simulation‐based modeling; and communicating the terminology, purpose, approach and initial results at various levels across the organization.
The article is arranged in four sections. First, the literature of risk management has been
reviewed. A brief of several insurance industry events including their impact has been added. The lack of literature in valuing the performance of ERM is described. The hypotheses of the study are explained. Second, the data of the study (including their limitations) are described. The methodology of analyzing data is proposed. Third, the data is analyzed and the findings are noted. Finally, the conclusions of the study are drawn.
Literature Review The overall purpose of insurers’ ERM is to achieve a balance between the three key objectives of an
insurance company. They are (i) optimization of the risk‐adjusted returns for investors; (ii) maintenance of the capital strength required to support firms’ businesses and future growth opportunities; and (iii) maintenance of capital and risk governance requirements of regulatory and rating agencies. Although a limited number of studies have been completed to determine the characteristics of ERM (e.g., Liebenberg & Hoyt (2003), Beasley, et al. (2005)), no study has yet been initiated to link the performance of ERM with insurers’ stock market performance. As stated earlier, the objective of this article is to observe the implication of insurers’ ERM on their stock market performance. Altogether six events that influenced insurers’ stock market performance have been considered in the analysis. The events are briefly described in the following paragraphs.
• September 11 incident: World Trade Center losses in 2001 impacted the insurance industry over
USD 21 billion (Swiss Re, 2004). As a result, the economy experienced strong increases of rates in the reinsurance market despite the government’s bailout.
• 2001–2002 credit crises: Following the long bull market from 1982 to 2000, the world stock market crashed in 2002. The market capitalization plunged by billions of dollars where price losses in the U.S. capital market was calculated at USD 7,000 billion since March 2000. In the insurance sector, the life insurers, in particular, struggled to generate cash from the business. Consequently, many life insurers were forced into a fire sale of their equity portfolios and withdrew unprofitable businesses.
• 2004 U.S. hurricanes: In 2004 the insured losses from Hurricanes Charley, Frances, Ivan and Jeanne were priced at USD 28 billion and the economic losses were calculated at USD 56 billion (Swiss Re, 2005).
• 2005 KRW worst‐ever insurance loss: The insurance industry losses from Hurricanes Katrina, Rita and Wilma (KRW) in 2005 are estimated at USD 65 billion and total damage to the economy is calculated at USD 170 billion (Swiss Re, 2006). The loss resulted in higher insurance prices and restricted coverage in the areas likely to hit by natural catastrophes. A recent study conducted by Aon Insurance of stock price reaction to KRW found that the stock prices of insurance companies were more sensitive to a single large loss rather than to an aggregation of loss events. The study concludes that insurance companies can illustrate better stock market performance if they introduce ERM to manage the catastrophic losses.
• 2002 D&O related losses from Enron & WorldCom: Several insurers settled a substantial amount of losses for D&O related losses arising from the collapse of Enron and WorldCom. Thereafter the cost of D&O insurance went up 260 percent from mid‐2001 to mid‐2003, driven by the lawsuits that arose from the wake of the accounting scandals of these companies.
• 2007–2008 subprime mortgage crisis and subsequent financial meltdown: The subprime mortgage crisis threatens some well ranked insurance companies that have exposure on the structured financial products (e.g., collateralized debt obligations (CDOs)). Although the insurance industry as a whole does not hold large exposure on the financial market due to that crisis, the life insurance industry is very affected by interest rate falls. In addition, the industry is affected by the 2008 equity market disruption that eroded its investment income and reduced its capital reserves.
There is not enough information about the ERM initiatives of insurance companies. Although several
insurers realize the need for ERM, there is no consistent understanding and framework of ERM in the

5
global insurance industry (Acharyya & Johnson, 2006). In addition to the industry recognition, the regulators and rating agencies place emphasis on the holistic management of insurers’ risk. Some rating agencies, in particular S&P and A.M. Best, take insurers’ ERM initiatives on their financial strength rating process. Despite the initiatives of several parties it is not still clear which insurance companies are practicing ERM—in particular, what is the correct structure of their ERM, how is it implemented and how the performance of their ERM is evaluated. In this circumstance, it is difficult to research the ERM initiatives of insurers from an empirical perspective. With these limitations, the study holds the view that ERM is the management of all risks irrespective of type, whether they come from financial and non‐financial activities of the insurer. Indeed, such a concept is purely theoretical and difficult to formulate in mathematical terms. The selection of performance measurement criteria of ERM is even difficult in the lack of market consistent infrastructure and understanding.
In literature the performance of ERM of the financial sector is limited within hedging activities of the
firm (Stulz, 1996; Nacco & Stulz, 2006). The financial literature suggests that firms should hedge based on the understanding of efficient market hypothesis of finance. In practice, the market is not efficient, and shareholders, at least in theory, do not value firms’ risk management initiatives. They can manage their unsystematic risk through diversification. In contrast, the strategic management literature argues that risk management provides a competitive advantage (Collins & Ruefli, 1992; Miller, 1998). However, such theoretical perspectives about the performance of risk management always remain inconsistent and mutually exclusive. In fact, the understanding of risk management could provide contrasting views if analyzed either from management theories or finance theories. Notwithstanding, ERM should the theorized by integrating these two matured disciplines while giving appropriate weight to the consideration of the purpose and resource of the specific organization. Despite several attempts of academics (e.g., Hoyt & Liebenberg (2008)), the ultimate question that still remains unanswered is whether ERM above disciplinary silos adds value to the firm. Notwithstanding, all the previous studies were unable to provide a single indicator in measuring firms’ risk management capabilities. In such incomplete theoretical foundation, the study, in line with the asymmetric information theories, accepts insurers’ stock market performance as the ultimate indicator of the combination of both perspectives. In line with the conclusion of Mehr and Forbes (1973), the study assumes that the increase of shareholder value (i.e., finance theory expectation) and achievement of competitive advantage (management theory expectation) is truly reflected in insurers’ superior stock market performance. Alternatively, the performance of ERM has been aligned with the overall performance of the organization in the stock market. Consequently, the hypothesis of the study is that in a normal situation insurers’ stock market performance is positively correlated with the performance of ERM. It is further hypothesized that if the stock market performance of the insurer maintains an increasing trend, then it can be assumed that the ERM is functioning well. In other words, ERM‐practicing insurers will demonstrate superior stock market performance. If the trend is negative, then the performance of ERM is not up to the industry level.
6
Data and Methodology
The research studies the share price of Chief Risk Officer (CRO) Forum members (hereinafter referred as "Forum”). The Forum, a professional risk management group, was established in 2004 to work on key relevant risk issues for advanced practitioners. It focuses on developing and promoting industry best practices in risk management with three objectives: alignment of regulatory requirements with sophisticated/best practice risk management; acknowledgement of group synergies, in particular, the diversification benefits; and simplification of regulatory interaction. There are altogether 16 members and five associate members in the Forum. They include both primary insurers and reinsurers with life and non‐life businesses from several geographical locations. Although the majority of them operate globally, they are not all listed with the stock exchanges. Information about the CRO Forum can be found on www.croforum.org, and a list of members is attached in Appendix A. Their daily closing share prices have been downloaded from the Thomson Analytics database. Munich Re’s share prices are not available in the database but can be downloaded from the reinsurer’s homepage free of cost.
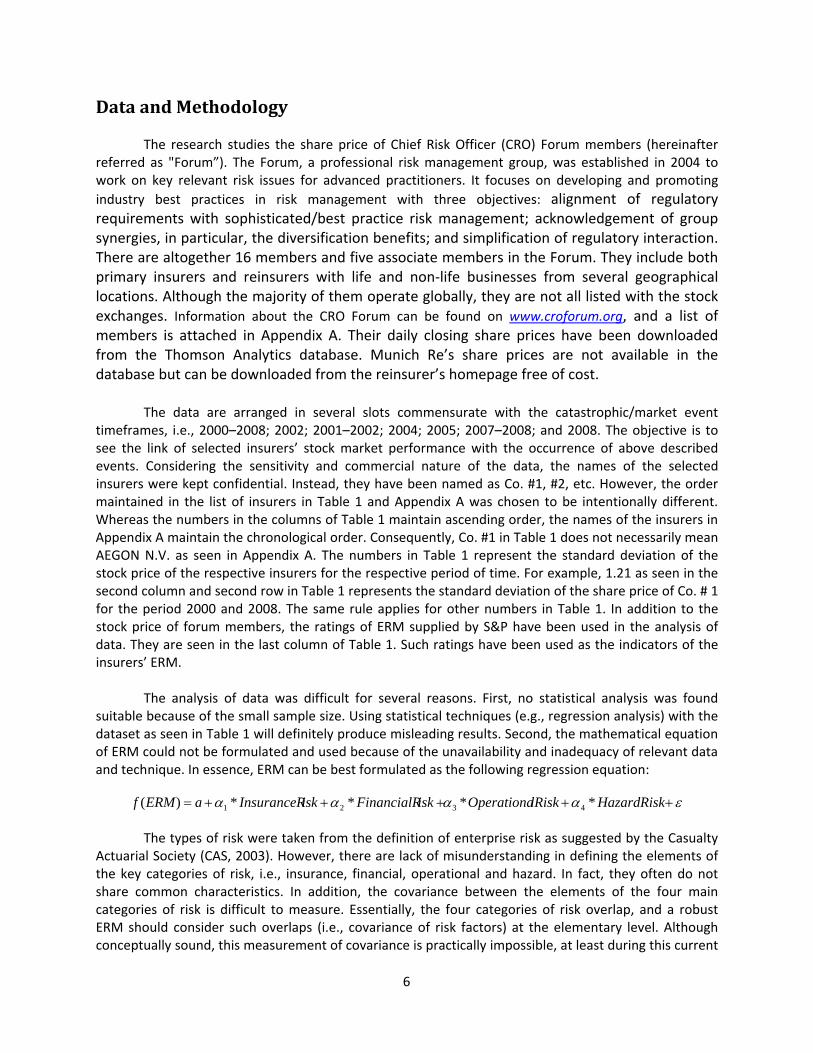
The data are arranged in several slots commensurate with the catastrophic/market event
timeframes, i.e., 2000–2008; 2002; 2001–2002; 2004; 2005; 2007–2008; and 2008. The objective is to see the link of selected insurers’ stock market performance with the occurrence of above described events. Considering the sensitivity and commercial nature of the data, the names of the selected insurers were kept confidential. Instead, they have been named as Co. #1, #2, etc. However, the order maintained in the list of insurers in Table 1 and Appendix A was chosen to be intentionally different. Whereas the numbers in the columns of Table 1 maintain ascending order, the names of the insurers in Appendix A maintain the chronological order. Consequently, Co. #1 in Table 1 does not necessarily mean AEGON N.V. as seen in Appendix A. The numbers in Table 1 represent the standard deviation of the stock price of the respective insurers for the respective period of time. For example, 1.21 as seen in the second column and second row in Table 1 represents the standard deviation of the share price of Co. # 1 for the period 2000 and 2008. The same rule applies for other numbers in Table 1. In addition to the stock price of forum members, the ratings of ERM supplied by S&P have been used in the analysis of data. They are seen in the last column of Table 1. Such ratings have been used as the indicators of the insurers’ ERM.
The analysis of data was difficult for several reasons. First, no statistical analysis was found
suitable because of the small sample size. Using statistical techniques (e.g., regression analysis) with the dataset as seen in Table 1 will definitely produce misleading results. Second, the mathematical equation of ERM could not be formulated and used because of the unavailability and inadequacy of relevant data and technique. In essence, ERM can be best formulated as the following regression equation:
εαααα +++++= HazardRisklRiskOperationaiskFinancialRiskInsuranceRaERMf ****)( 4321
The types of risk were taken from the definition of enterprise risk as suggested by the Casualty
Actuarial Society (CAS, 2003). However, there are lack of misunderstanding in defining the elements of the key categories of risk, i.e., insurance, financial, operational and hazard. In fact, they often do not share common characteristics. In addition, the covariance between the elements of the four main categories of risk is difficult to measure. Essentially, the four categories of risk overlap, and a robust ERM should consider such overlaps (i.e., covariance of risk factors) at the elementary level. Although conceptually sound, this measurement of covariance is practically impossible, at least during this current

7
stage of development of ERM research. Consequently, this study takes a very simple approach of analyzing data without using any statistical technique. The data in Table 1 are compared and contrasted to each other and logical conclusions were drawn from the findings of the analysis of pictorial presentations of data. Standard deviation has been considered to represent the volatility (i.e., risk) of the stock price of the selected sample.
TABLE 1
Standard Deviations of Stock Prices of CRO Forum Members
Co. No/ Year 2000‐2008 2002 2001‐2002 2004 2005 2007‐2008 2008
Rating of ERM for 2007 by S&P(as of April, 2008)***
Co # 1 1.21 0.31 0.28 0.53 0.49 0.99 0.25 Information unavailable
Co # 2 4.36 2.72 3.67 1.25 1.19 4.87 5.31 Strong
Co # 3 5.36 4.51 6.47 0.92 1.06 4.00 3.80 Adequate with positive trend
Co # 4 6.26 3.72 4.48 0.88 1.28 8.61 5.96 Adequate
Co # 5 7.82 4.75 7.65 0.75 2.42 5.96 3.52 Excellent
Co # 6 7.87 5.34 7.66 1.26 2.02 7.97 6.54 Excellent
Co # 7 8.94 2.08 1.73 1.79 1.92 5.53 6.49 Excellent
Co # 8 10.81 6.23 8.31 1.23 1.23 3.68 2.46 Adequate with positive trend
Co # 9 15.39 3.22 2.73 2.52 4.28 11.27 12.17 Strong
Co # 10 17.34 6.56 9.28 4.28 5.47 24.08 19.34 Information unavailable
Co # 11 35.26 12.56 30.98 12.25 10.86 41.93 30.47 Information unavailable
Co # 12 38.10 28.32 29.34 6.96 5.77 21.92 18.70 Strong
Co # 13 89.76 64.05 75.85 8.50 11.29 31.68 24.30 Strong
Co # 14 93.10 64.97 72.19 6.88 8.08 12.13 10.59 Strong
Co # 15 108.06 77.31 116.73 9.29 12.80 12.97 9.57 Strong
Co # 16 156.25 78.94 164.78 13.39 21.30 45.61 37.10 Strong
Co # 17 184.98 127.66 165.43 23.54 23.94 128.67 131.21 Strong
Co # 18 188.19 153.67 208.61 30.45 29.60 141.90 104.16 Adequate
Co # 19 209.64 75.26 72.42 37.37 40.90 355.73 209.00 Information unavailable
Max 209.64 153.67 208.61 37.37 40.90 355.73 209.00
Min 1.21 0.31 0.28 0.53 0.49 0.99 0.25
*** S&P divides the strength of insurers’ ERM into five categories. They are orderly (high to low) listed as Excellent; Strong; Adequate with positive trend; Adequate; and Weak. More information including the definition of ERM rating criteria are available on RatingDirect, an S&P publication.

8
Analysis and Findings The following Figures 1 and 2 represent the volatility of stock price of Co. #1 and Co. #19. They
indicate that Co. #1 represents the lowest volatility in all period of years. However, Co. #19 shows highest volatility in most of the years except 2000 and 2000–2001. The results, at least theoretically, indicates that Co. #1 practices a strong ERM but Co. # 19 is the weakest. Unfortunately, their ERM ratings information from S&P is unavailable for both insurers i.e., Co. # 1 and Co. #19.
Figures 1&2
Stock Price Volatility of Co. #1 and Co. #19
A further analysis shows that both insurers (Co. #1 and Co. #19) show highest volatility during
the period 2007–2008. In fact, the volatility in the stock price of Co. #19 performs 360 times higher than Co. #1. However, it is not clear from the above Figures 1 and 2 whether they both maintain increasing or decreasing trends in their share market performance during 2007–2008.
Figures 3&4
Stock Price of Co. #19 and Co. #1 During 2007–2008
Figures 3 and 4 represent the stock price of Co. #1 and Co. #19 during 2007–2008. It is seen that although both insurers suffered from decreasing stock market performance during 2007–2008, the performance of Co. #19 is worse than Co. #1 because of the stiff declining in the trend line (see the slopes of the regression lines).
The purpose of the analysis involving Co. #1 and Co. #19 (as apparently seen the highest
performer and the lowest performer in the stock market) is to link their ERM strength with their stock market performance. Although the S&P ERM ratings for 2007 are not available for these two insurers, it can be concluded that Co. #1 holds superior ERM performance compared to Co. #19.

9
While comparing and contrasting the stock market performance of Co. #17 and Co. #15, it appears that both insurers experienced highest volatily during the period 2001–2002. Interestingly, the volatility in the stock prices of Co. #17 and Co. #15 is close during 2001–2002 as seen in Figures 5 and 6. Moreover, both insurers’ ERM was rated as ”strong” by S&P. Now let’s look into their stock market performance during 2001–2002.
Figures 5 & 6
Stock Price Volatility of Co. # 17 and Co. #15 in Event Periods
In Figures 7 and 8 it is seen that they both maintain similar downturn in their stock market performance in 2001–2002. However, a significant difference is found in their stock market performance in the same period.
Figures 7 & 8
Stock Price Movements of Co. #15 and Co. #17
There appears to be a considerable difference between Co. #15 and Co. #17 in the movements of their stock prices. Whereas Co. #15 maintains a downturn trend, Co. #17 illustrates an upward trend as seen in Figures 9 and 10 below.

10
Figures 9 & 10 Stock Price Movements of Co. #15 and Co. #17
Consequently their rating of ERM supplied by S&P can not be justified by analyzing only their
stock price movement. Indeed, the characteristics of events during 2007–2008 dominate insurers’ stock market performance.
Now let us consider two insurers, i.e., Co. #3 and Co. #8, which hold an ”excellent” ERM rating
by S&P. They both experienced highest volatility during 2001–2002 as seen in Figures 11 and 12. Interestingly, they both show similar volatility in 2004 and 2005. However, they are different in 2001–2002 as Co. #3 is approximately two times higher than Co. #8 in terms of their stock price volatility.
Figures 11 & 12
Stock Price Volatility of Co. #8 and Co. #3
In analyzing their stock market performance during the same period of time, it is seen that they
both demonstrate decreasing trends as illustrated in Figures 13 and 14 below.
Figures 13 & 14 Stock Price Movements of Co. #8 and Co. #3

11
In analyzing their stock market performance during 2007–2008 as seen in Figures 15 and 16, it can be observed that while Co #3 goes up, Co. #8 actually illustrates a decreasing trend. Since they maintain excellent ERM trend from S&P, the hypothesis is contradictory in concluding that stock market trend is a reliable indicator of insurers’ ERM performance. It is the nature of the events and specific firm characteristics that influence more on the insurers’ stock market performance rather than the strength of insurers’ ERM. This finding is consistent with the conclusion of Chen et al. (2008), which emphasizes that firm type, loss estimates, financial strength, underwriting risk and reinsurance are key determinants of the firm’s long‐run position in the event of catastrophic losses (e.g.., 9/11 event).
Figures 15 & 16
Stock Price Movements of Co. #3 and Co. #8
12
Conclusion The purpose of this article was to verify whether insurers’ ERM performance is reflected on their
stock price. In the absence of an adequate amount of data, the CRO Forum members were selected as a sample for the research. It is understood that the Forum members are committed to practicing ERM at least on the group level. The period from 2000 to 2008 was divided into six slots—2000, 2001 and 2002, 2004, 2005, 2007 and 2008. They are in line with the several industry events where insurance companies suffered losses either from insurance market or capital market. The ratings supplied by S&P were considered as the scale of measuring the performance of insurers’ ERM. The hypothesis of this study assumed that insurers’ successful ERM practice demonstrates their superior stock market performance. In addition, it was assumed that if the performance of insurers’ stock market maintains upward trends in any specific event period irrespective of high or low levels of volatility, then the performance of ERM is satisfactory.
The study has several limitations and challenges, as some of them have already been mentioned
above. However, the key challenge is the limitation of both quantitative and qualitative data. In addition to the uneven understanding and framework of insurers’ ERM programs, there exists a lack of a theoretical approach of perceiving ERM. In fact, ERM cannot be understood utilizing either a financial or management approach alone. It is suggested that the theories of ERM should come from both the area of financial theories and management theories. However, it is challenging to link and integrate these two levels of philosophical understanding into a common framework.
The analysis found that the subprime crisis event affected insurers’ stock price quite differently
compared to the other events considered in the study. Although insurers’ stock market performances maintained similar patterns in most of the events, e.g., 2001–2002 credit crisis, 2004 U.S. hurricanes (i.e., Charley, Frances, Ivan and Jeanne), 2005 KRW and 2002 D&O claims, it was not the case in the subprime and financial crisis during 2007–2008. Interestingly, there appears to be an inconsistency in the insurers’ stock market performance during this latest financial crisis as some insurers demonstrated superior performance and others were found severely vulnerable in the financial meltdown. Consequently, it was concluded that insurers’ stock market performance depends much on the characteristics of industry events rather than on the performance of their ERM. Alternatively, insurers’ stock market performance is an event‐driven phenomenon without maintaining any direct link with their ERM practice.
In addition to integrating the finance and management approaches as described above, the
study discovers several venues of further research on the topic. First, the identification of risk factors by four types of insurers’ risk (i.e., insurance, financial, operational and hazard) and measuring their interrelations (i.e., covariance) need further research as proposed in the regression equation in the data analysis section. Second, despite the initiative of S&P, the methodology of measuring insurers’ ERM performance needs further clarification. In particular, how the several components of ERM—i.e., risk management culture, risk controls, emerging risk management, risk and economic capital models and strategic risk management—are integrated into a holistic model to derive a single value of insurers’ ERM strength needs further research concentration. However, with the development of the ERM research the link between insurers’ success of ERM and their stock market performance might become prominent.

13
Bibliography Acharyya, M., and Johnson, J.E.V. 2006. “Investigating the Development of Enterprise Risk Management in the
Insurance Industry: An Empirical Study on Four Major European Insurers.” The Geneva Papers on Risk and Insurance, Special Issue July: 55–80.
Beasley, M. S., Clune, R., and Hermanson, D.R. 2005. “Enterprise Risk Management: An Empirical Analysis of
Factors Associated with the Extent of Implementation.” Journal of Accounting and Public Policy 24(6): 521–531.
Casualty Actuarial Society. 2003. “Overview of Enterprise Risk Management.” Enterprise Risk Management
Committee, May. Accessed at: www.ucop.edu/riskmgt/erm/documents/overview.pdf. Chen, X., Doerpinghaus, H., and Lin, B.‐X. 2008. “Catastrophic Losses and Insurer Profitability: Evidence from 9/11.”
The Journal of Risk and Insurance 75(1): 39–62. Collins, J.M., and Ruefli, T.W. 1992. "Strategic Risk: An Ordinal Approach. Management Science 38(12): 1707–
1731. Hoyt, R.E., and Liebenberg, A.P. 2008. “The Value of Enterprise Risk Management: Evidence from the U.S.
Insurance Industry,” unpublished paper, accessed at: http://www.aria.org/meetings/2006papers/Hoyt_Liebenberg_ERM_070606.pdf.
Liebenberg, A.P., and Hoyt, R.E. 2003. “The Determinants of Enterprise Risk Management: Evidence from the
Appointment of Chief Risk Officers.” Risk Management and Insurance Review 6(1): 37–52. Mehr, R.I., and Forbes, S.W. 1973. “The Risk Management Decision in the Total Business Setting.” The Journal of
Risk and Insurance 40(3): 389–401. Miller, K.D. 1998. "Economic Exposure and Integrated Risk Management.” Strategic Management Journal 19(5):
497–514. Nacco, B.W., and Stulz, R.M. 2006. “Enterprise Risk Management—Theory and Practice.” Journal of Applied
Corporate Finance 18(4): 8–20. Standard & Poor’s (S&P). 2008. “Enterprise Risk Management is Improving in North American and Bermudian
Insurers.” Standard and Poor’s, RatingsDirect, May. Standard & Poor’s (S&P). 2008. “European Insurers Continue to Develop their Enterprise Risk Management
Capabilities.” Standard & Poor’s, RatingsDirect, April. Standard and Poor’s (S&P). 2005, Insurance Criteria: Evaluating The Enterprise Risk Management Practices of
Insurance Companies, Standard & Poor’s, RatingsDirect, October. Stulz, R.M. 1996. “Rethinking Risk Management.” Journal of Applied Corporate Finance 9(3): 8–24. Swiss Re. 2004. “Natural Catastrophes and Man‐made Disasters 2003” Sigma, No. 1 accessed on www.swissre.com. Swiss Re. 2005. “Natural Catastrophes and Man‐made Disasters 2005” Sigma, No. 1 accessed on www.swissre.com. Swiss Re. 2006. “Natural Catastrophes and Man‐made Disasters 2005” Sigma, No. 2 accessed on www.swissre.com.

14
Appendix A. List of CRO Member Insurers
Insurer/Member Origin
1 AEGON N.V. Netherlands
2 American Insurance Group (AIG) USA
3 Allianz Germany
4 Assicurazioni Generali SpA Italy
5 Aviva Plc UK
6 AXA France
7 Eureko B.V.** Netherlands
8 Fortis N. V. Belgium
9 Groupama S.A.** France
10 Hannover Re Germany
11 HBOS* UK
12 ING Grope N.V. Netherlands
13 Insurance Australia Group* Australia
14 ManuLife Financial* Canada
15 MetLife USA
16 Munich Re Germany
17 Old Mutual* South Africa
18 Prudential Plc UK
19 Royal & SunAllaince* UK
20 Swiss Re Switzerland
21 Zurich Financial Services Switzerland
*Associate members; **Shares are not listed on stock exchange
Dr. Madhu Acharyya is lecturer in Risk Management at The Business School, Bournemouth University, United Kingdom. He can be reached at [email protected]; Tel: 00 44 (0)23 80583600.