THE INFLUENCE OF CURING AND SURFACE PREPARATION ON ... - CORE
120
THE INFLUENCE OF CURING AND SURFACE PREPARATION ON THE ADHESION OF PROTECTIVE COATINGS ON CONCRETE Bernard Thomas Benn A Research Report submitted to the Faculty of Engineering and the Built Environment, University of the Witwatersrand, Johannesburg in partial fulfilment of the requirements for the degree of Master of Science in Engineering Johannesburg 2008
Transcript of THE INFLUENCE OF CURING AND SURFACE PREPARATION ON ... - CORE

THE INFLUENCE OF CURING AND SURFACE PREPARATION ON
THE ADHESION OF PROTECTIVE COATINGS ON CONCRETE
Bernard Thomas Benn
A Research Report submitted to the Faculty of Engineering and the Built
Environment, University of the Witwatersrand, Johannesburg in partial fulfilment of
the requirements for the degree of Master of Science in Engineering
Johannesburg 2008

B T Benn 7231599 i
DECLARATION I declare that this project is my own unaided work. It is being submitted for the
conversion of the Graduate Diploma in Engineering to the degree of Master of
Science in Engineering from the University of the Witwatersrand, Johannesburg. It
has not been submitted before for any degree or examination at any other university.
B T Benn
On this 18th day of December 2008.

B T Benn 7231599 ii
ABSTRACT
In cases where concrete has to be repaired or protected due to exposure to an
aggressive environment, a protective coating is often used. The guidelines
referenced on the subject of repairs and coatings of concrete require the substrate
must be clean, dry and free from loose material but no mention is made of a
preferred method of surface preparation.
This research report presents details of an investigation in which concrete was
subjected to different curing regimes in order to induce different qualities of surface
concrete. The different surface qualities were prepared using four alternative surface
preparation methods prior to coating. After an initial investigation, five different
coatings were chosen in order to cover a broad spectrum of coatings available to the
construction industry.
Once the applied coatings had cured they were tested using a pull-off testing device
to determine the adhesion properties. The mode of failure was determined by visual
examination. In addition, surface characteristics were determined using an optical
microscope and the water sorptivity test.
Results indicate that preparing the surface before application of coatings does
improve adhesion. The preparation that was easiest to carry out, and which also
gave the best adhesion results, was the wire brushing technique. Considering the
practicality for site application, the mechanical method would be most appropriate.
From the findings, aliphatic coating exhibited the best adhesion properties, while
epoxy resin and cementitious-based materials also gave satisfactory results.
B T Benn 7231599 iii
Elastomeric coating with lower adhesion strengths at early ages may be suited to
surfaces that are expected to crack, as the elastic nature of the material will bridge
the gap. Masonry paint, which was only used for comparative purpose did not
perform as well as expected and had the lowest bond strengths. Where the removal
of defective concrete is likely to result in a rough surface the cementitious material
may be preferable.

B T Benn 7231599 iv
ACKNOWLEDGEMENTS
Professor Y Ballim, my supervisor, for encouragement, advice, and valuable
assistance on both technical and editorial matters.
Dr. G. Grieve and the staff of the Cement and Concrete Institute for encouraging me
to commence my postgraduate studies.
Mr. J. Schluep of Spec-con (Pty) Ltd. for the loan of the Hilti TE 72 combi-hammer.
Mr. R. Davis of Hilti (Pty) Ltd for the loan of the needle chisel and Bushing tool.
Mr. H. Woodman of abe-Forsroc for the loan of the “Elcometer Adhesion Tester” and
for samples of coatings.
Mr. A. Niemand of Prominent Paints for sample of masonry paint.
Mr. S Letcher of Sika South Africa for samples of coating materials.
Alpha Cement and Alpha Readymix: West (now AfriSam) for the use of the laboratory
facilities.
The staff, of the Group Concrete Laboratory at Alpha Technical Services, for
assisting with the preparation of the concrete.
Adelaide Brighton Cement, South Australia, for the support to continue the project
and the printing.
My wife, Sonja, who always believed I would complete the thesis.
My children, Erica for the editing advice, Kerri for her cheerful encouragement and
Claire for her continual reminders to keep working.

B T Benn 7231599 v
ORGANISATION OF THE DISSERTATION
The report has been organised into the following chapters. The Introduction states
the problem, the proposed investigation and the limitations. The Literature Review
refers to technical papers on the subject of adhesion of coatings to concrete that
were read with particular reference to the two RILEM conferences on adhesion
between polymers and concrete. The chapter on the Experimental Details includes
information on the concrete materials used, the coatings, preparation of specimens
and the test methods used during the investigation.
The Results and Discussions sections present each set of test results with the aid of
tables, statistical analysis, graphics and photographs. This is followed by the
Conclusions and Recommendations for Further Work. Finally the References,
Bibliography and Appendices are included.

B T Benn 7231599 vi
CONTENTS
DECLARATION i
ABSTRACT ii
ACKNOWLEDGEMENTS iv
ORGANISATION OF THE DISSERTATION v
CONTENTS vi
LIST OF FIGURES xi
LIST OF TABLES xiii
Chapter 1: INTRODUCTION 1
1.1 Statement of the Problem 1
1.2 Need for Further Data on Adhesion 2
1.3 The Investigation 3
1.3.1 Specimens 3
1.3.2 Coatings and Primers 3
1.3.3 Test Methods 4
1.4 Limitations of the Investigation 5
B T Benn 7231599 vii
Chapter 2: LITERATURE REVIEW 7
2.1 Introduction 7
2.2 Science of Adhesion 8
2.3 Surface Properties of Concrete Substrates 11
2.4 Properties Affecting Bond 13
2.4.1 Permeability of Substrate 13
2.4.2 Environmental Aspects 14
2.4.3 Physical Effects Affecting Bond 15
2.5 Adhesion of Thin Coatings to Concrete 16
2.5.1 Repair Mortars 16
2.5.2 Thin Coatings 17
2.6 Available Test Procedures 17
2.7 Preferred Properties 21
2.8 Surface Preparation 23
Chapter 3: EXPERIMENTAL DETAILS 25
3.1 Introduction 25
3.2 Concrete Materials 25
3.2.1 Cementitious Material 25
3.2.2 Aggregates 25
3.2.3 Water 26
3.3 Mix Details 26
3.3.1 Mix Proportions and Specimens 26
3.3.2 Concrete Manufacture 27
B T Benn 7231599 viii
3.4 Testing the Concrete 28
3.4.1 Introduction 28
3.4.2 Fresh Concrete 28
3.4.3 Hardened Concrete 28
3.5 Curing Regime for the Beams 29
3.6 Specimen Preparation 30
3.6.1 Climatic Exposure 30
3.6.2 Cutting the Beams 30
3.6.3 Surface Preparation 32
3.7 Coating of Surface 36
3.7.1 Introduction 36
3.7.2 Coating Application Procedure 37
3.7.3 Controlling Film Thickness 38
3.7.4 Elastomeric Coating 39
3.7.5 Aliphatic Coating 40
3.7.6 Epoxy Resin Based Coating 40
3.7.7 Cementitious Based Coating 40
3.7.8 Masonry Paint 41
3.8 Water Sorptivity Test 41
3.9 Microscopic Evaluation 42
3.10 Adhesion Testing 43
3.10.1 Adhesion Tester 43
3.10.2 Method of Operation 43

B T Benn 7231599 ix
Chapter 4: RESULTS AND DISCUSSIONS 46
4.1 Introduction 46
4.2 Fresh Concrete 46
4.2.1 Fresh Wet Density 46
4.2.2 Slump 47
4.3 Hardened Concrete 47
4.3.1 Long-term Exposure Conditions 47
4.3.2 Compressive Strength 48
4.4 Water Sorptivity 51
4.4.1 Summary of Results 51
4.4.2 Analysis of Results 52
4.5 Application of Coatings 55
4.5.1 General Assessment 55
4.5.2 Elastomeric Coating 55
4.5.3 Aliphatic Coating 56
4.5.4 Epoxy Resin Based Coating 56
4.5.5 Cementitious Based Coating 57
4.5.6 Masonry Paint 58
4.6 Microscopic Evaluation 58
4.7 Adhesion Tests 59
4.7.1 Introduction 59
4.7.2 Mode of Failure 60
4.7.3 Test Results 62
4.7.3.1 Elastomeric Coating 62
4.7.3.2 Aliphatic Coating 63

B T Benn 7231599 x
4.7.3.3 Epoxy Resin Based Coating 65
4.7.3.4 Cementitious Based Coating 66
4.7.3.5 Masonry Paint 68
4.7.4 Effect of Surface Preparation 69
4.8 General Discussion 73
Chapter 5: CONCLUSIONS AND RECOMMEDATIONS 74
RECOMMENDATIONS FOR FURTHER WORK 75
REFERENCES 76
BIBLIOGRAPHY 81
APPENDIX I
A. Laboratory Batch Weights and Detailed Concrete Test Results I
B. Analysis of slump differences II
C. Statistical Analysis of Laboratory Test Results III
D. Water Sorptivity Calculations IV
E. Adhesion Test Results XXI

B T Benn 7231599 xi
LIST OF FIGURES
Figure Page
1. Failure types 9
2. Modes of failure 10
3. Methods of testing bond strength 18
4. In situ bond strength test arrangements 19
5. Blister test, creating a local defect in a specimen 20
6. Sketch of the beam segments 30
7. Photograph of the concrete surfaces obtained when using different
preparation techniques 32
8. Mechanical wire brush 33
9. Surface after preparation by mechanical wire brush 33
10. Hand held wire brush 34
11. Surface after preparation by hand held wire brushing technique 34
12. Bushing tool 35
13. Surface after preparation with bushing tool 35
14. The unprepared concrete surface 36
15. Wet film thickness gauge (front view) 39
16. Wet film thickness gauge (rear view) 39
17. Water sorptivity test arrangement 42
18. Adhesion stud 43
19. Elcometer adhesion tester 44
20. Test studs attached to coating before testing 44
21. Strength development curve 51
22. Chart of sorptivity and curing time 52
B T Benn 7231599 xii
23. Chart of sorptivity and preparation method 53
24. Water sorptivity of OPC concretes with different curing regimes 54
25. Specimens coated with elastomeric coating 55
26. Specimens coated with aliphatic coating 56
27. Specimens coated with epoxy resin based coating 57
28. Specimens coated with cementitious based coating 57
29. Specimens coated with masonry paint 58
30. Cracking in the aggregate of concrete prepared with the bushing tool 59
31. Cracking near the surface of concrete prepared with the bushing tool 59
32. Adhesion strengths of the elastomeric coating at 4-weeks & 16-weeks
after application 63
33. Adhesion strengths of the aliphatic coating at 4-weeks & 16-weeks
after application 64
34. Adhesion strengths of the epoxy resin based coating at 4-weeks and
16-weeks after application 65
35. Adhesion strengths of the cementitious based coating at 4-weeks and
16-weeks after application 67
36. Adhesion strengths of the masonry paint at 4-weeks and 16-weeks
after application 68
37. Graphical comparison of surface preparations and bond strengths 72
B1. Change in water content to change the slump II

B T Benn 7231599 xiii
LIST OF TABLES
Table Page
1. Required conditions for barrier products 12
2. Stresses acting at the coating-concrete interface 14
3. Typical physical properties of the coarse and fine aggregates 26
4. Mix proportions 27
5. Summary of adhesion test programme 31
6. Summary of coatings and technical details 37
7. Wet film thickness and over-coating time 38
8. Average temperature and rainfall for Johannesburg 48
9. Physical properties of concrete as measured for each batch 50
10. Water sorptivity results 51
11. Correlation coefficient for water sorptivity test results 54
12. Description of mode of failure obtained during pull-off test 61
13. Percentage of samples exceeding selected minimum adhesion strengths 70
A1.Laboratory recordings of batch weights and concrete test results I
C1.Statistical analysis of the wet and hardened properties of the concrete III
E1.Bond strength and mode of failure for elastomeric coating XXI
E2.Bond strength and mode of failure for aliphatic coating XXII
E3.Bond strength and mode of failure for epoxy resin based coating XXIII
E4.Bond strength and mode of failure for cementitious based coating XXIV
E5.Bond strength and mode of failure for masonry paint XXV

B T Benn 7231599 1
Chapter 1: INTRODUCTION
1.1 Statement of the Problem
In many instances where repairs are carried out or where structural concrete is
exposed to aggressive environments, the original or repaired concrete is often
painted with a protective coating. Data sheets on the protective coatings available
from suppliers, as well as information published in technical journals [1] and by
specifying bodies [2] usually mention that the substrate should be clean, dry and
sound. None of them, however, suggest a preferred method of substrate preparation
probably because in every instance where protective coatings are required the
condition and/or quality of the concrete onto which the coating has to be applied will
first have to be assessed. Once the initial investigation has been completed the
substrate preparation, repair method and coating application specification can be
issued such that it relates to the conditions prevailing at that particular site. Some,
but not all, of the site conditions that would need to be considered are: soundness of
the concrete, condition of the reinforcing, accessibility of the site, availability of
utilities, health and safety of the general public and site workers and ambient weather
conditions during the preparation and coating period. There are also no
recommendations on the use of different surface preparation methods for different
near-surface concrete qualities. The near-surface concrete quality will have been
affected by the degree of curing, curing methods and curing conditions at the time of
construction. Aggressive environments such as physical abrasion or chemical attack
from agents such as soft water and acidic pollutants will also have affected the near-
surface quality of the concrete. As described above, the complexity of assessing

B T Benn 7231599 2
repairs and areas that require protective coatings make it extremely difficult to cover
every eventuality in a data sheet or specification.
This investigation aims to examine the effect of both different surface preparation
methods and the influence of the near-surface concrete quality (induced by means of
different wet curing regimes) on adhesion by evaluating the performance of different
commercially available protective coatings.
1.2 Need for Further Data on Adhesion
The need for further understanding of the adhesion of protective coatings on
concrete is based on both personal experiences, when employed in the protective
coatings industry, as well private conversations [3, 4] held with the major suppliers of
protective coatings.
The following aspects were evident:
• There is little information available on the damage done to the substrate by
equipment used to prepare the surface.
• The suppliers are generally reluctant and cautious to specify a particular method
of substrate preparation, mainly due to the variable quality of in-situ concrete.
• There is little data on how the type of surface preparation influences the adhesion
properties of a coating.
• There is little or no data available on the effect of the near-surface concrete
quality on the adhesion properties of a protective coating.
• In a majority of cases where failure of coating has occurred, these failures have
been attributed to inadequate surface preparation by the contractor.

B T Benn 7231599 3
It is hoped that this investigation will provide information useful to specifiers,
contractors and suppliers that is relevant to application of coatings on concrete
surfaces in structures.
1.3 The Investigation
1.3.1 Specimens
Four sets of concrete beams 750 x 150 x 150 mm in size were made, and then
subjected to different controlled curing conditions to produce distinctly different near-
surface concrete quality in each set. The beams were then exposed to the prevailing
Johannesburg Highveld climatic conditions for at least one year before preparation
and coating. The twelve batches of concrete were made in the Alpha Cement
Concrete Laboratory (now AfriSam) from locally available coarse and fine
aggregates, with four 50 kg bags of cement collected from a single pallet to ensure it
was from the same production run. From each beam six specimens were cut to size.
Four specimens were cut to nominal sizes 160 x 150 x 150 mm and two were cut to
50 x 150 x 150 mm. The latter (small) specimens were used for examination by
optical microscope and for the sorptivity test. Three of the larger specimens were
subjected to three different methods of surface preparation while the one remaining
specimen coated as cast, without any surface preparation.
1.3.2 Coatings and Primers
From the list of potential suppliers, sourced from the Library at the Cement and
Concrete Institute (C&CI), four readily available propriety concrete surface coatings
were selected because they were accepted as high quality products by the
construction industry. They also contain the most commonly used raw materials in
B T Benn 7231599 4
their formulation. The different coatings were brush applied and allowed to cure in
accordance with manufacturers’ instructions before adhesion tests were carried out.
Primers, usually packaged as separate products, are recommended when the
adhesion of the protective coating to the concrete substrate without a primer is not
considered adequate by the manufacturer. Primers bond either physically and/or
chemical with the concrete substrate while the coating bonds chemically to the
primer. The combination, of primer and coating, provides a monolithic protective layer
to the concrete. Three of the propriety coatings were used with the primer
recommended by the manufacturer, while the fourth coating and the masonry paint
were applied without a primer. The latter was included in the investigation to compare
adhesion characteristics and because it is normally, used without any primer, for
decorative not protective purposes it was applied without a primer. The aim of the
investigation was to assess propriety coatings as used in practice with different
substrate preparations on concrete substrates of differing quality and thus it was
outside the scope of the investigation to assess the affect of primers on those
coatings that normally do not require primers
1.3.3 Test Methods
The particle size distribution and relative density of both coarse and fine aggregates
were determined but the loose and compacted bulk density was only ascertained for
the coarse aggregate. The consistency of each fresh concrete mix was obtained by
means of the slump test, the wet density determined and the compressive strength of
the hardened concrete measured at various ages.

B T Benn 7231599 5
After the specimens had been cut and prepared, sorptivity tests were carried out to
assess the effect of the different methods of preparation on the near-surface
concrete. Optical microscopic examination using thin slices was carried out to
determine the extent to which the different methods of preparation had damaged the
“sound” concrete that would be coated.
After the specified curing period for the coating had elapsed, the adhesion of the
coating to the various concrete surfaces was determined using an “Elcometer”
adhesion tester as described by Judge et al. [5]. The pull-off test was carried out by
gluing a 20 mm diameter stud to the coating using a two-part epoxy glue, and then
applying a direct tensile force. This force was applied until the coating was torn from
the concrete surface and the magnitude of the stress measured was recorded in
N/mm2 (MPa). On completion of the test, the stud was visually examined to
determine if the failure had occurred at the interface or in the substrate.
1.4 Limitations of the Investigation
As mentioned in the previous section, the C & CI Library has a comprehensive
database of suppliers for the building and construction industry. From a possible 21
suppliers, the investigation was limited to four propriety products and one, readily
available, masonry paint. The four propriety coatings were selected because they are
each manufactured with different basic raw materials but several other coatings not
used in this investigation may have different performance characteristics. Based on
the data available from the manufacturers the coatings used in this investigation can
be used under all South African weather conditions and thus it has been accepted
that the affect of moist conditions on the polymers has been considered by the

B T Benn 7231599 6
manufacturer and therefore was not investigated as part of this study. There are
many permutations regarding the 28-day characteristic strengths that could be
specified for a structure. In this study only one water/cement ratio (w/c) was used and
only four mixes were made. Each mix was subjected to a different controlled curing
regime, which was expected to give different surface qualities of concrete.
Although coatings are formulated to last several years before maintenance may be
necessary, long-term testing was not practical for the purposes of this investigation.
The initial adhesion test was carried out at four weeks as the Product Data Sheet for
the cementitious coating quoted the 28-day bond strengths. The second series of
adhesion tests were carried out three months after the initial tests, approximately
sixteen weeks after application of the coating in order to assess if any changes in the
adhesion properties had occurred during the intervening period.
The size of the test specimens also limits the investigation, as they are significantly
smaller than an actual structure. When a structure is coated, all the exposed surfaces
are normally coated to provide total protection and to prevent delamination of the
coating due to the build up of moisture under the coating, whereas the test
specimens were only coated on one side. In order to prevent moisture ingress to
beneath the coating by being absorbed through the uncoated sides of the specimens,
and thus creating a vapour pressure that would disrupt the adhesion of the coating
[6]), the samples were kept indoors for a month before coating and were kept under
the same conditions after the coatings had been applied.

B T Benn 7231599 7
Chapter 2: LITERATURE REVIEW
2.1 Introduction
The limitation of assessing protective coatings in a laboratory investigation is the
difficulty of simulating the conditions most likely to occur on a site and the number of
possible coatings. The broad classification of the protective coatings available for
concrete in South Africa has been based on the descriptions given in the Product
Data Sheets and includes:
• Polymer modified cements.
• Polymer dispersions including ethylene copolymers, elastomeric acrylics and
aliphatic acrylics.
• Epoxy resins including pitch (tar) extended epoxies.
• Bitumen emulsions.
• Polyurethanes and polyurethane modified cements.
This means that interpretation of results of laboratory based test methods should
take into consideration that:
• Surface preparations carried out in the laboratory may be difficult to replicate on
site.
• The test methods used may be more difficult to utilise on site than in the
laboratory.
• Actual coating should ideally be carried out under site conditions.
The most comprehensive information on the subject of “The adhesion of coatings to
concrete” was contained in publications:
1. The Concrete Society Technical Report No. 50 [1].

B T Benn 7231599 8
2. The proceedings of the International RILEM Symposium on “Adhesion between
Polymers and Concrete”, Aix-en-Provence, France, September 1986 [7].
3. Proceedings of the Second International RILEM Symposium on “Adhesion
between Polymers and Concrete”, Dresden, Germany, September 1999 [8].
Much of the review focuses on these three publications as they represent the “State
of the Art” up to the time this study was undertaken.
2.2 Science of Adhesion
Coatings may have a thickness that ranges from 100 µm to several millimetres. To
fulfil the expected function satisfactorily over an extended period there must be a
strong bond between the near-surface concrete and the coating. The surface
condition required for concrete to accept a coating is just as important to the success
and longevity of the coating as the foundation is to a structure [9]. Surface defects
that will affect adhesion include tie holes, honeycombing and fins.
The presence of water must be recognised at all times [6] whether present as a liquid
or vapour under varying degrees of relative and absolute humidity. Not only is the
moisture present on the surface, air, soil but also on or in the concrete that is to be
protected. Protective coatings are based on organic compounds, while concrete is
inorganic and thus there is little or no physical or chemical affinity between the two.
Therefore, obtaining satisfactory adhesion obviously poses some problems and
these are complicated by the presence of water. Coatings will normally interrupt and
stop the equilibrium reactions with respect to the “exchange” of water between the
near-surface concrete and the ambient air. The result is an increase of moisture

B T Benn 7231599 9
content immediately underneath the coating, at the contact interface, that can cause
inadequate curing of the coating and subsequent loss of adhesion.
Cardon and Hiel [10] argue that in the case of a thin layer, the properties of the
transition zone are the fundamental control elements of the realised adhesion
whereas for a thick adhesive layer, the properties of the bulk adhesive are the control
elements.
Peier [11] describes two types of failure, shown in Figure 1, that can occur as
shrinkage stresses develop in the coating layer after application
1. Cohesive failure (cracking) if:
1. The adhesive strength > shrinkage stresses and
2. The shrinkage stresses > cohesion
2. Adhesion failure if:
The adhesive strength < shrinkage stresses
For the system to remain intact the following two conditions must be satisfied:
1. Adhesive strength > shrinkage stresses and
2. Cohesive strength > shrinkage stresses
Figure 1: Failure types [11]
B T Benn 7231599 10
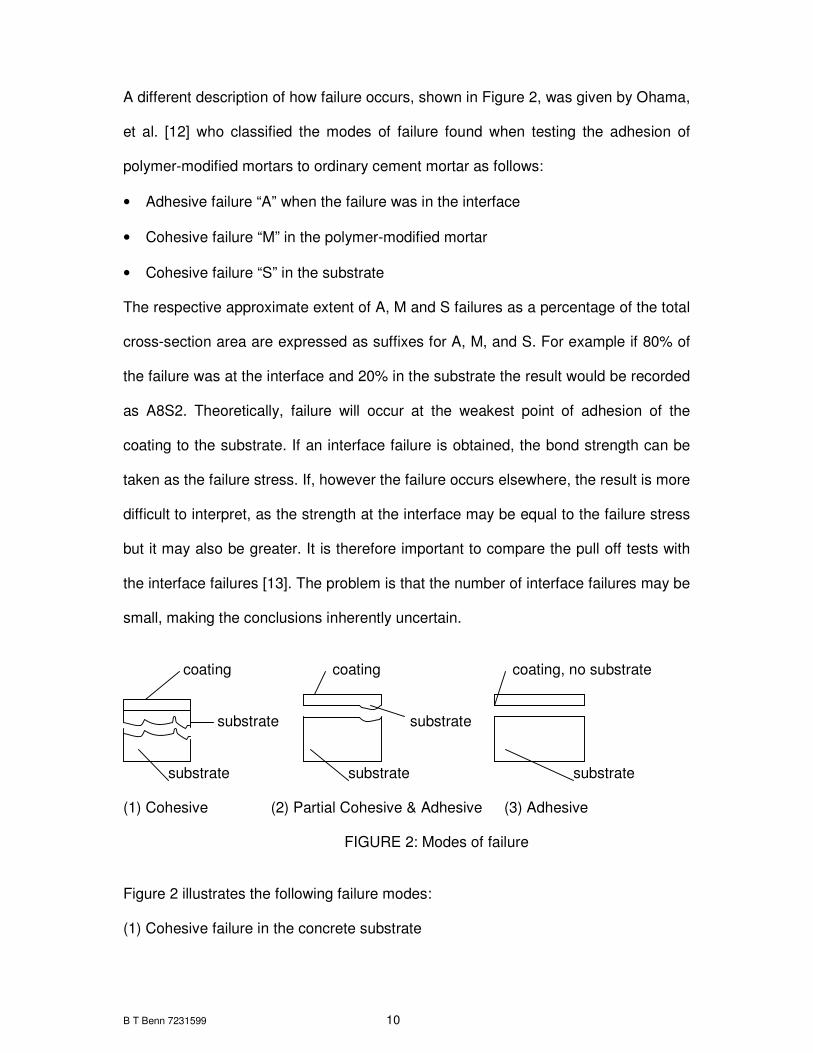
A different description of how failure occurs, shown in Figure 2, was given by Ohama,
et al. [12] who classified the modes of failure found when testing the adhesion of
polymer-modified mortars to ordinary cement mortar as follows:
• Adhesive failure “A” when the failure was in the interface
• Cohesive failure “M” in the polymer-modified mortar
• Cohesive failure “S” in the substrate
The respective approximate extent of A, M and S failures as a percentage of the total
cross-section area are expressed as suffixes for A, M, and S. For example if 80% of
the failure was at the interface and 20% in the substrate the result would be recorded
as A8S2. Theoretically, failure will occur at the weakest point of adhesion of the
coating to the substrate. If an interface failure is obtained, the bond strength can be
taken as the failure stress. If, however the failure occurs elsewhere, the result is more
difficult to interpret, as the strength at the interface may be equal to the failure stress
but it may also be greater. It is therefore important to compare the pull off tests with
the interface failures [13]. The problem is that the number of interface failures may be
small, making the conclusions inherently uncertain.
coating coating coating, no substrate
substrate substrate substrate substrate substrate
(1) Cohesive (2) Partial Cohesive & Adhesive (3) Adhesive
FIGURE 2: Modes of failure
Figure 2 illustrates the following failure modes:
(1) Cohesive failure in the concrete substrate

B T Benn 7231599 11
(2) Partial cohesive and adhesive failure
(3) Adhesive failure at the interface of the coating and the concrete surface
It is relatively easy to coat a surface with a correctly formulated protective coating if
this surface is sound, well cleaned and accessible. Of importance is the magnitude of
adhesion that is related to the dynamic wetting of the concrete surface (adherent) by
the coating (adhesive) [14] and is affected by:
• Potential adhesion between the coating and the adherent
• Roughness of the adherent
• Dynamic viscosity of the coating
• Spreading accuracy of the coating on the adherent
The results of blister-tests carried out by Gűnter [15] indicated that if the near-surface
concrete is prepared (e.g. by sand blasting), the pressure required to cause
delamination is greater than if no preparation is carried out. The results also showed
that as the coating thickness is increased, the pressure required to produce
delamination is also increased but that as temperature increased lower pressure is
required to cause blisters. Courard [16] considered thermodynamic properties of
solids and liquids in relation to adhesion and although this may be of value it was
beyond the scope of this investigation to consider the thermodynamic aspects.
2.3 Surface Properties of Concrete Substrates
Gaul [9] refers to four general types of barriers/coatings and suggests that the
surface requirements will depend on the type of coating and its specific
characteristics. Table 1 indicates the surface condition required for the different
coatings and was consistent with the requirements listed in the Product Data Sheets

B T Benn 7231599 12
of the protective coatings reviewed at the start of this investigation. The near-surface
concrete is usually required to be dry when the coating or primer is applied, however
Bundies [17] demonstrates that even in the dry concrete surface exposed to ambient
conditions, there is 20 to 30 g/m2 of water within the top 0.5 mm of concrete.
TABLE 1: Required conditions for barrier products [9]
Type of barrier Concrete surface condition
Clean Dry Free of Laitance Strength below surface of concrete
Decorative paint Yes Some No No
Damp proof Yes Some No No
Waterproof Yes Yes Some Some
Protective Yes Yes Yes Yes
The applicator should therefore carefully follow the standards and limits laid down in
the job specification and in the suppliers’ technical literature. Concrete surfaces that
are used as a substrate may cause problems that are not necessarily present with
other materials:
• Concrete surfaces are often very rough and have partly open air voids.
• Concrete surfaces are adsorbent to varying degrees.
• Concrete surfaces may be dusty and friable.
• Formed and floated surfaces commonly have a thin and relatively weak layer
(laitance).
• Formed surfaces can contain significant amounts of adhered release agent.
• Surfaces with irregularities due to casting or shrinkage can lead to variable
thickness of the coating layer.

B T Benn 7231599 13
2.4 Properties Affecting Bond
The International Concrete Repair Institute (ICRI) document [18] states that repair
materials should not be specified until the properties that will best satisfy overall
project objectives are identified. This principle, along with many of the properties
mentioned in the ICRI document, is applicable to coatings.
2.4.1 Permeability of Substrate
Previous studies have found that after application of a coating to a concrete surface,
stresses may develop in this composite system that are caused by various chemical
and physical properties of both the coating and the near-surface concrete. Work
carried out by Gűnter and Hilsdorf [19] showed that a concrete surface treated with
an epoxy coating or some of the commonly used primers will have semi-permeable
properties. Experiments have shown that osmotic pressure can reach up to 45 bars,
which is approaching the bond strength between the near-surface concrete and the
coating. This pressure is much less if the coating is flexible or if blisters have formed.
Local defects in the coating or at the concrete-coating interface may lead to local
stress concentrations that may cause delamination or damage at lower than normally
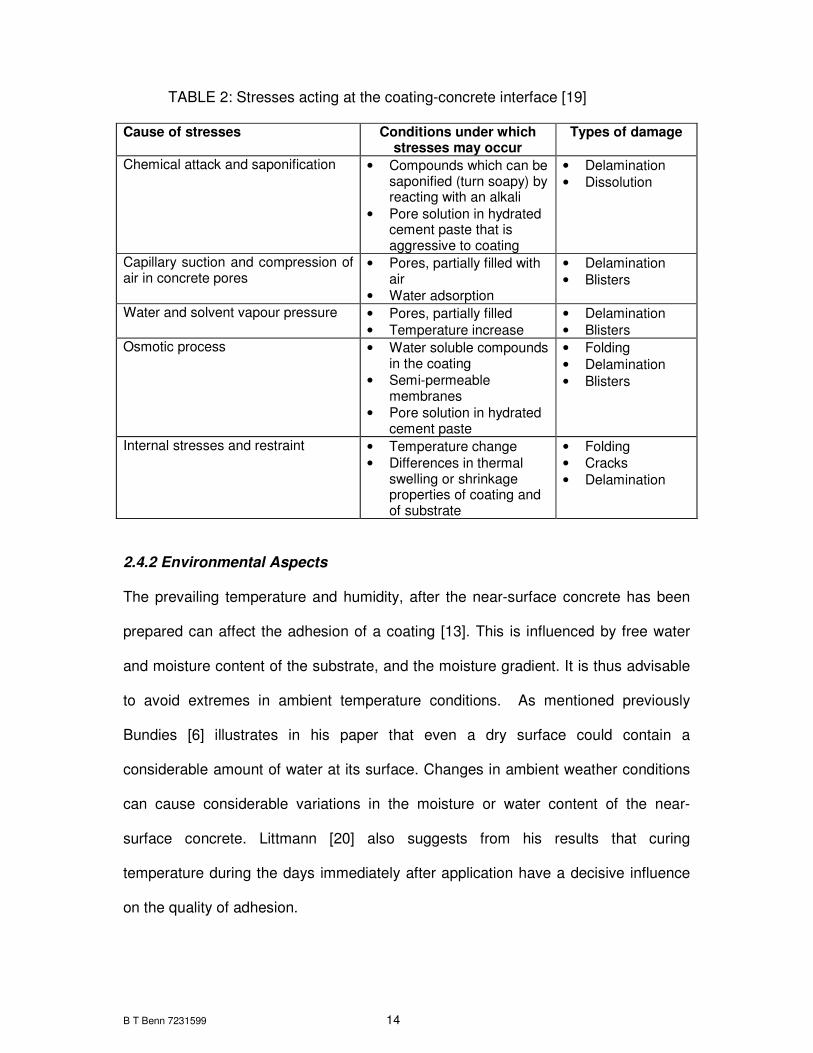
expected stresses. Table 2 summaries the various mechanisms leading to stress
development together with the type of damage and the conditions under which they
are likely to occur. The adhesion of a coating to a concrete surface, may be affected
by the age of the concrete, concrete strength, aggregate grading and the salt content
of the near-surface concrete [13].
B T Benn 7231599 14
TABLE 2: Stresses acting at the coating-concrete interface [19]
Cause of stresses Conditions under which stresses may occur
Types of damage
Chemical attack and saponification • Compounds which can be saponified (turn soapy) by reacting with an alkali
• Pore solution in hydrated cement paste that is aggressive to coating
• Delamination
• Dissolution
Capillary suction and compression of air in concrete pores
• Pores, partially filled with air
• Water adsorption
• Delamination
• Blisters
Water and solvent vapour pressure • Pores, partially filled
• Temperature increase
• Delamination
• Blisters
Osmotic process • Water soluble compounds in the coating
• Semi-permeable membranes
• Pore solution in hydrated cement paste
• Folding
• Delamination
• Blisters
Internal stresses and restraint • Temperature change
• Differences in thermal swelling or shrinkage properties of coating and of substrate
• Folding
• Cracks
• Delamination
2.4.2 Environmental Aspects
The prevailing temperature and humidity, after the near-surface concrete has been
prepared can affect the adhesion of a coating [13]. This is influenced by free water
and moisture content of the substrate, and the moisture gradient. It is thus advisable
to avoid extremes in ambient temperature conditions. As mentioned previously
Bundies [6] illustrates in his paper that even a dry surface could contain a
considerable amount of water at its surface. Changes in ambient weather conditions
can cause considerable variations in the moisture or water content of the near-
surface concrete. Littmann [20] also suggests from his results that curing
temperature during the days immediately after application have a decisive influence
on the quality of adhesion.

B T Benn 7231599 15
2.4.3 Physical Effects Affecting Bond
To obtain a good bond it is necessary to consider the uniformity of the surface, the
cleanness (dust, oil), release agents, curing compounds and cracks. These aspects
are important because release agents migrate to surface during casting, while curing
membranes based on waxes and resins are film formers that need to be
mechanically removed. Cracks that are greater than 2 mm in width need to be
investigated to ascertain if they are still active then treated appropriately.
Dimensional behaviour of a coating will be affected by drying shrinkage, modulus of
elasticity, and restrained shrinkage. Drying shrinkage of protective coatings and
repair mortars will occur and the rate of shrinkage depends on:
• Ambient temperature.
• Rate of evaporation of any volatile material.
• Thickness of the coating.
• Ambient relative humidity.
• Relative humidity of the substrate.
Any restraint to shrinkage that occurs when a coating is applied to a concrete surface
will produce tensile stress in the coating, which is not easily measured but must be
considered because of the possibility of cracking or tearing of the coating which then
negates the desired protection. Durability of a coating will also be affected by
permeability, water vapour transmission, weather conditions and compatibility with
the near-surface concrete. The permeability of the coating to chlorides and
atmospheric carbon dioxide (CO2) will dictate the suitability of the coating for certain
applications as these two chemicals are largely responsible for the onset of corrosion
of the steel reinforcing in structural concrete. Also, for dimensional compatibility, the
B T Benn 7231599 16
modulus of elasticity and thermal coefficient of a coating that is to be applied to a
structural member should be similar to that of the substrate and for a non-structural
application the modulus of elasticity of the coating should be lower than that of the
substrate [18].
Both hot and cold weather can affect the bond strength but hot weather also has an
adverse affect on the drying shrinkage and surface finish. The bond at the interface
between a coating and the concrete substrate can be influenced by micro cracks,
roughness, surface preparation, pre-wetting, other treatments (curing membranes,
de-icing salts, etc.) and the surface moisture at the time of coating [13]. In the work
reported by Littmann [20] the characteristic strength of the concrete did not influence
the adhesion as much as the type of cement did and it appeared that blast furnace
slag cement was more appropriate for concrete in a humid environment.
2.5 Adhesion of Thin Coatings to Concrete
2.5.1 Repair Mortars
Cleland et al. [21] evaluated repair mortars on three different surface preparations by
measuring the tensile and shear bond strengths. They noted that it was important to
understand and follow the manufacturer’s instructions in order to achieve the
properties expected from pre-packed proprietary products. They also found that a
brushed or lightly sand-blasted surface gave a sound rough surface that resulted in
better bond strength, due to the increase in bond area and mechanical keying
effects. To achieve this, it was important to prevent air voids by trapping air around
the protrusions during application. Chiselling or bush hammering the surface can
induce large stresses that can leave the aggregates and some matrix particles loose.

B T Benn 7231599 17
If the strength of this weakened layer is lower than the bond strength between itself
and the repair material failure can occur along this weak plane.
2.5.2 Thin Coatings
During the process of rehabilitating concrete structures, proper surface preparation of
the substrate and bonding of the protective coating materials, are both important
factors affecting the success of the repair [22]. Similarly, the successful application of
a thin coating, whether protective or aesthetic, over a patch repair depends on the
attention paid to the following factors that affect the strength of adhesion between the
repair material and the substrate [21]:
• Characteristics of the original concrete, the surface condition and its preparation.
• Characteristics of the coating material.
• Workmanship.
• Environmental conditions.
2.6 Available Test Procedures
Various sample methods and test techniques have been suggested or described in
the following referenced literature:
• The ASTM - D4263-83 [23] describes the test for indicating moisture in concrete
by using the plastic sheet method.
• Dusty surfaces can be identified by wiping the concrete with a dark cloth. If a
layer of whitish powder is found on the cloth, the surface is too dusty [2].
• Oily surfaces can be identified by sprinkling water onto the dried surface. If water
beads and does not spread out immediately, the surface is probably
contaminated [2].
B T Benn 7231599 18
• Excessive laitance is considered to be present if a quantity of loose powdery
material is observed or easily removed from the surface when the concrete is
scraped with putty knife [2].
• The RILEM document AAC15.1 details how to determine the adhesion of mortars
and other surface coatings [24].
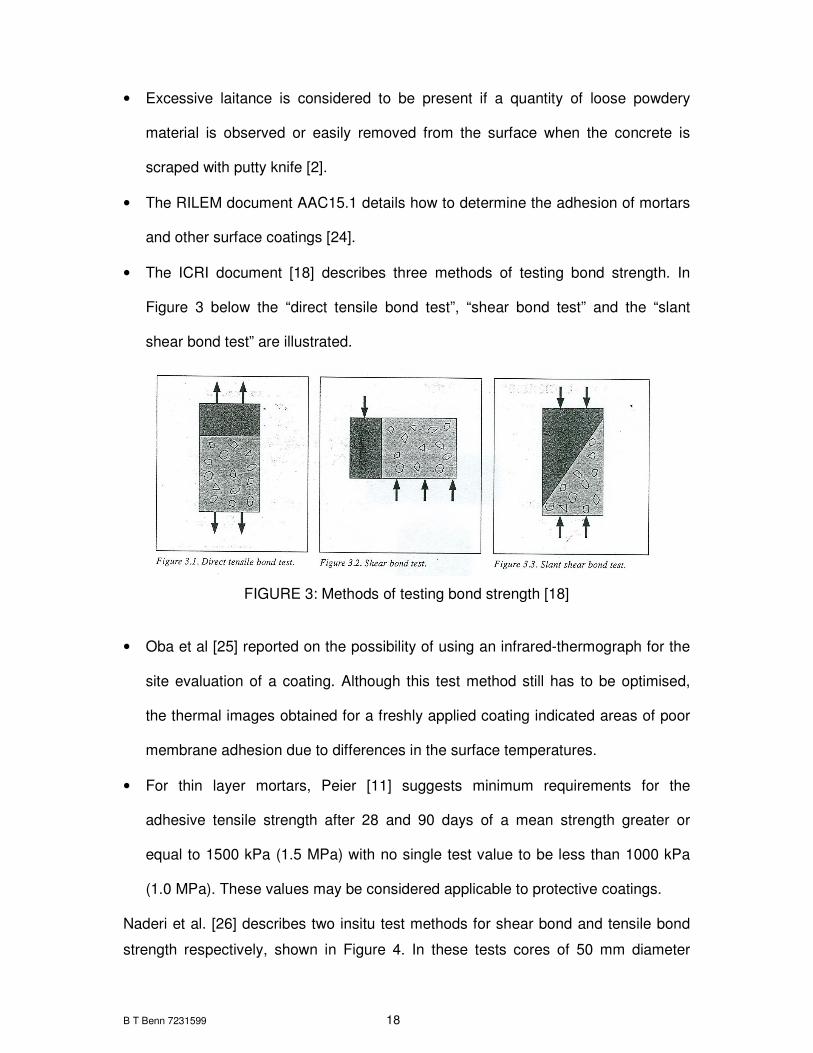
• The ICRI document [18] describes three methods of testing bond strength. In
Figure 3 below the “direct tensile bond test”, “shear bond test” and the “slant
shear bond test” are illustrated.
FIGURE 3: Methods of testing bond strength [18]
• Oba et al [25] reported on the possibility of using an infrared-thermograph for the
site evaluation of a coating. Although this test method still has to be optimised,
the thermal images obtained for a freshly applied coating indicated areas of poor
membrane adhesion due to differences in the surface temperatures.
• For thin layer mortars, Peier [11] suggests minimum requirements for the
adhesive tensile strength after 28 and 90 days of a mean strength greater or
equal to 1500 kPa (1.5 MPa) with no single test value to be less than 1000 kPa
(1.0 MPa). These values may be considered applicable to protective coatings.
Naderi et al. [26] describes two insitu test methods for shear bond and tensile bond
strength respectively, shown in Figure 4. In these tests cores of 50 mm diameter

B T Benn 7231599 19
were drilled through the repair material and extended about 5 mm into the substrate
concrete.
FIGURE 4: In situ bond strength test arrangement [26]
For the tensile test, a stud was glued to the top of the core and a tensile force applied
until failure occurred. For the shear test a special apparatus is fitted on top of the
core and is clamped to it, a torque is applied through a handle until failure.
Although the pull-off test has been generally accepted as a suitable method to
determine the adhesion strength because of its easy use on site, Gűnter [15]
suggests that the blister-test would be more suitable for studying bond properties.
Briefly, the blister-test involves setting up artificial defects at the interface of a
concrete surface and the coating material. These defects are created at points where
steel tubes, plugged with wax at the one end, have been inserted through the
concrete. A circular area of the concrete surface and the end of the steel tubes are
coated with a thin layer of beeswax and paraffin approximately 2ao in diameter, see
Figure 5. After the application and hardening of the protective coating, that is to be
tested, the wax is removed from the end of the steel tube and air pressure is applied
to the lower side of the coating at a controlled rate of 8.5 bar/min. This area is
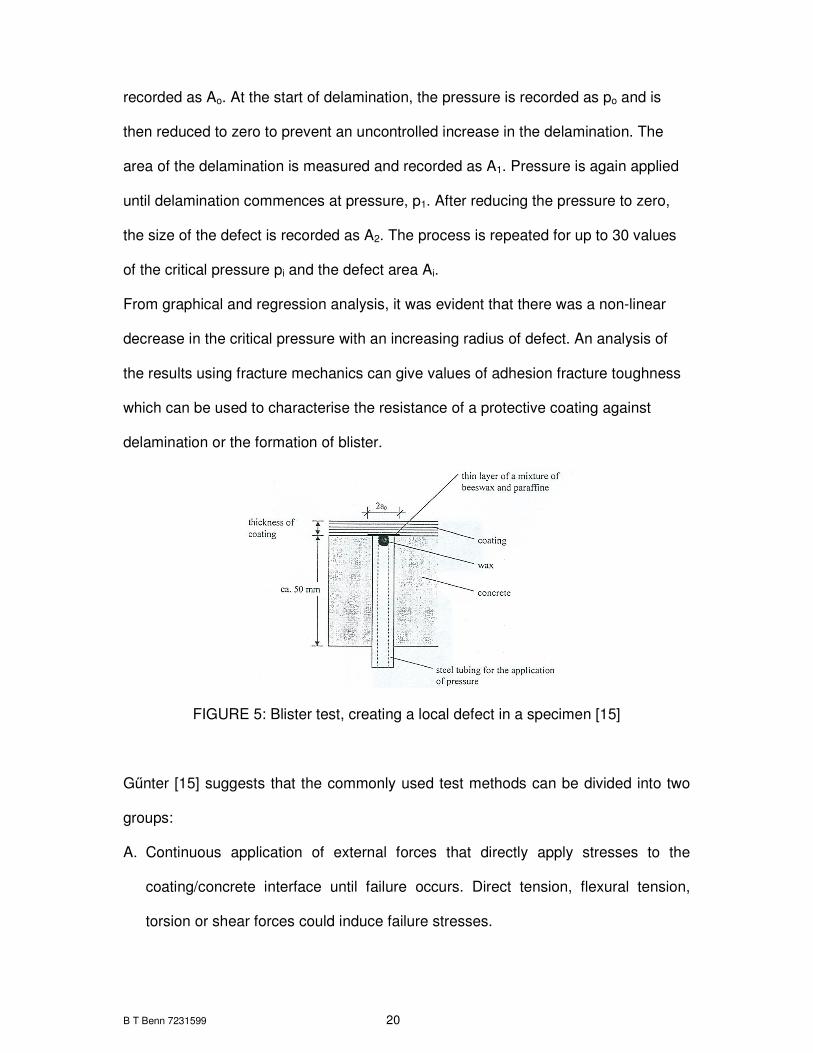
B T Benn 7231599 20
recorded as Ao. At the start of delamination, the pressure is recorded as po and is
then reduced to zero to prevent an uncontrolled increase in the delamination. The
area of the delamination is measured and recorded as A1. Pressure is again applied
until delamination commences at pressure, p1. After reducing the pressure to zero,
the size of the defect is recorded as A2. The process is repeated for up to 30 values
of the critical pressure pi and the defect area Ai.
From graphical and regression analysis, it was evident that there was a non-linear
decrease in the critical pressure with an increasing radius of defect. An analysis of
the results using fracture mechanics can give values of adhesion fracture toughness
which can be used to characterise the resistance of a protective coating against
delamination or the formation of blister.
FIGURE 5: Blister test, creating a local defect in a specimen [15]
Gűnter [15] suggests that the commonly used test methods can be divided into two
groups:
A. Continuous application of external forces that directly apply stresses to the
coating/concrete interface until failure occurs. Direct tension, flexural tension,
torsion or shear forces could induce failure stresses.
B T Benn 7231599 21
B. Long term exposure of the coating/concrete interface to conditions that may
cause changes to the physical or chemical properties at the interface region. The
changes in the bond strength due to these exposures may be measured using the
experimental methods mentioned before.
Various researchers [11, 15, 25, 26] have shown that there are a number of different
test methods that can be used to determine the bond strength between a coating or
repair material and a concrete substrate. In this investigation testing was limited to
direct pull-off tests on concrete specimens stored indoors without exposure to
outdoor environmental conditions. Although environmental factors may influence the
bond strength of different coatings when applied to different surface characteristics,
they are not considered particularly important in ranking the effectiveness of different
methods of surface preparation.
2.7 Preferred Properties
A number of published papers and some technical committee reports have made
suggestions regarding the preferred properties of coatings and repair systems. The
following section sets out those properties of more relevance to coatings. For epoxy
repair mortars, the ACI Committee 503 stipulates a minimum pull-off strength of 100
psi (0.69 MPa) [27]. In order to ensure the best possible long-term adhesion the
following are of equal importance:
• The condition of the substrate at its surface.
• The environmental conditions when the primer or coating is applied.
• The chemical reaction inside any two-part coating.
• The chemical reaction of the coating with substrate.
B T Benn 7231599 22
Bordado [28] lists the advantages of the thermosetting type materials that are also
desirable in other types of coating systems:
• Very low shrinkage.
• High resistance to acids and alkalis.
• Barrier properties against water, salt, and gases.
• Good durability under varied service conditions.
• Excellent adhesion, even under damp conditions.
Sasse and Stenner [29] highlighted some important sections of a new series of CEN
standards, EN 1504 series Parts 1 to 10 [30]. In particular, ENV 1504–9, 1996, Table
3 “Principles and Method Related to Defects in Concrete” indicates that coatings can
be used for the following reasons:
• Protection against ingress of aggressive agents.
• Controlling the moisture content of concrete.
• Increasing the resistance of concrete surface to chemical attack.
• Increasing the electrical resistivity of concrete.
• Creating conditions for cathodic control.
An extract from Table 1: of EN 1504–2: “Surface Protection Systems for Concrete
Structures” [30] indicates that it is mandatory to carry out a pull-off test to determine
the adhesion of the coating relevant to protection against the ingress of aggressive
agents, moisture control of the concrete, physical resistance of the concrete to
mechanical attack and resistance to chemicals.
The new EN 1504 Parts 1 to 10 [30] might become an important reference document
when repairing and coating concrete structures.

B T Benn 7231599 23
2.8 Surface Preparation
ASTM D 5295–92 [2] recommends that if grinding techniques are utilised, it is
important to avoid polishing the surface as this can affect the adhesion. It also
suggests that it is important to avoid sanding, as this drives dust particles into the
pores creating a de-bonding layer. For acid etching, ASTM D 5295 suggests that a
10% or 20% solution of hydrochloric acid at a coverage rate of 1ℓ/m2 may be used
with surface pre-dampening to obtain a more even etch. However, where the use of
chlorides is inadvisable (due to the long-term effect on reinforcing steel), a 15%
phosphoric acid solution could be considered.
Hindo [22] examined two different methods of preparing a concrete surface for repair
and concluded that hydro-demolition (water blasting) might be preferred over jack
hammering because the latter causes a “bruised” concrete layer, that contains micro
cracking, up to about 9 mm deep. The advantages of the water blasting technique
were:
• Lack of the “bruised” layer.
• Irregular wavy surface profile.
• Increased number of micro-pores.
• Greater surface area for adhesion.
Undoubtedly, an important property for the structure is durability and if it is accepted
that the coating is effective, then durability aspects become easier to handle, at least
as regards the following principles [14]:

B T Benn 7231599 24
• Mechanical and thermo-mechanical behaviour: this relates to the resistance of a
composite system against creep under load, and its fatigue life within the service
temperature range.
• Physico-chemical behaviour: this includes the wet strength of coatings in the pH-
range occurring at the interfacial zone, as well as chemical ageing during service
and under fire conditions.
Often there is an implicit acceptance that concrete will provide sufficient protection for
reinforcing steel and thus its durability will be acceptable. It is accepted that this
concrete should be of an appropriate strength grade, is well proportioned to facilitate
full compaction and is properly cured. These properties are also important when it is
necessary to repair and apply protective coatings. From literature, it is evident that
adhesion of a coating to concrete is affected by concrete strength [13] both
compressive and tensile, which is directly related to w/c ratio and curing. In addition,
compaction and curing influence the porosity and permeability of the near-surface
concrete.
B T Benn 7231599 25
Chapter 3: EXPERIMENTAL DETAILS
3.1 Introduction
This chapter contains details on the materials used in concrete mixes and how the
fresh and hardened concretes were tested. Curing regimes used to achieve different
near-surface concrete qualities are explained. Surface preparation methods and the
coating application are detailed as are the test methods used.
3.2 Concrete Materials
3.2.1 Cementitious Material
The cement used was a factory blend of Portland cement and siliceous fly ash (FA)
at a nominal ratio of 65/35%. The cement satisfied the MC22.5 X category of SABS
ENV 413-1:1996 (now SANS 50413-1:2004) [31, 32]. It was obtained from Alpha
Cement (now AfriSam) factory in Roodepoort, and at the time when the specimens
were made was sold to the construction industry as “Multi Purpose Cement”. The
relatively high FA cement (approximately 35%) was selected, so that poor early-age
curing can be used to produce a lower quality concrete particularly at the surface.
Four 50 kg bags of cement were used to manufacture specimens. To reduce the
possibility of variation within the cement, all bags were collected from the same pallet
to ensure that the cement came from the same production run.
3.2.2 Aggregates
The aggregates used were not specially selected but were all collected from the
laboratory stockpile on the same day then stored in lab conditions until used. Both
coarse and fine aggregates were representative of the quarry material and the type
B T Benn 7231599 26
of materials that would normally be supplied to the ready-mix and construction
industries. The coarse aggregate was a Meta–Mela Andesite of the Ventersdorp
Supergroup from the Eikenhof quarry near Johannesburg. The fine aggregate was
decomposed Halfway House granite from the Jukskei quarry.
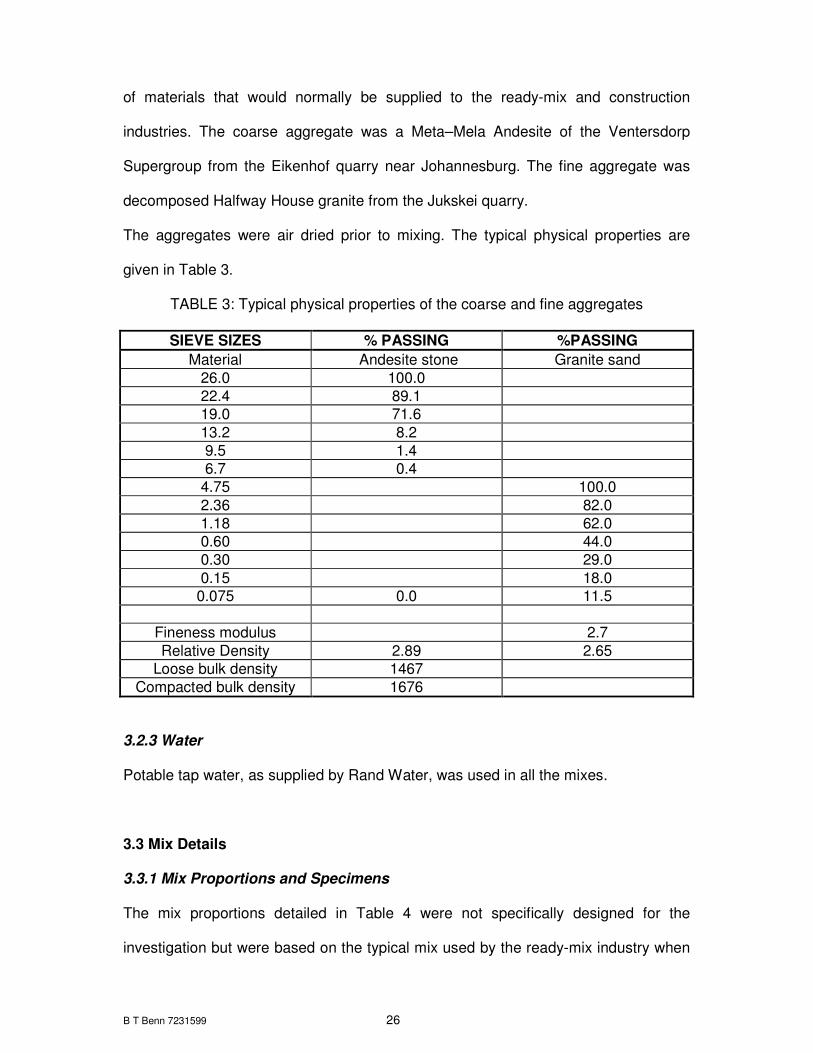
The aggregates were air dried prior to mixing. The typical physical properties are
given in Table 3.
TABLE 3: Typical physical properties of the coarse and fine aggregates
SIEVE SIZES % PASSING %PASSING
Material Andesite stone Granite sand
26.0 100.0
22.4 89.1
19.0 71.6
13.2 8.2
9.5 1.4
6.7 0.4
4.75 100.0
2.36 82.0
1.18 62.0
0.60 44.0
0.30 29.0
0.15 18.0
0.075 0.0 11.5
Fineness modulus 2.7
Relative Density 2.89 2.65
Loose bulk density 1467
Compacted bulk density 1676
3.2.3 Water
Potable tap water, as supplied by Rand Water, was used in all the mixes.
3.3 Mix Details
3.3.1 Mix Proportions and Specimens
The mix proportions detailed in Table 4 were not specifically designed for the
investigation but were based on the typical mix used by the ready-mix industry when
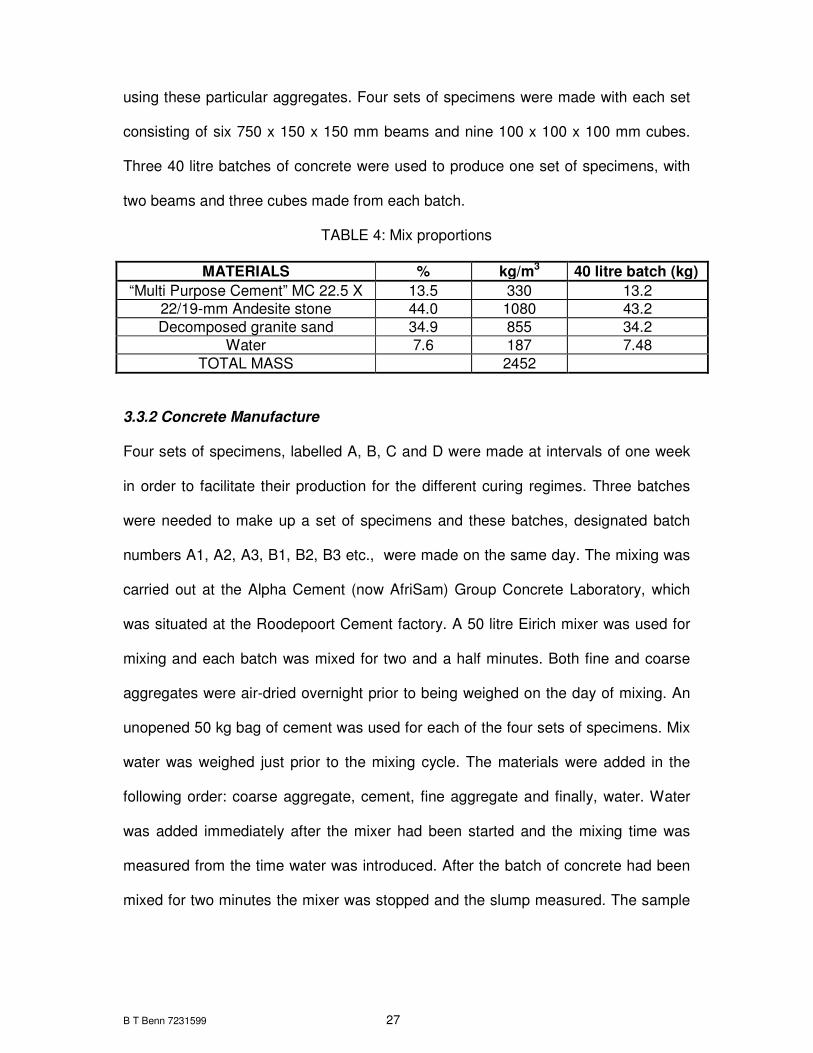
B T Benn 7231599 27
using these particular aggregates. Four sets of specimens were made with each set
consisting of six 750 x 150 x 150 mm beams and nine 100 x 100 x 100 mm cubes.
Three 40 litre batches of concrete were used to produce one set of specimens, with
two beams and three cubes made from each batch.
TABLE 4: Mix proportions
MATERIALS % kg/m3 40 litre batch (kg)
“Multi Purpose Cement” MC 22.5 X 13.5 330 13.2
22/19-mm Andesite stone 44.0 1080 43.2
Decomposed granite sand 34.9 855 34.2
Water 7.6 187 7.48
TOTAL MASS 2452
3.3.2 Concrete Manufacture
Four sets of specimens, labelled A, B, C and D were made at intervals of one week
in order to facilitate their production for the different curing regimes. Three batches
were needed to make up a set of specimens and these batches, designated batch
numbers A1, A2, A3, B1, B2, B3 etc., were made on the same day. The mixing was
carried out at the Alpha Cement (now AfriSam) Group Concrete Laboratory, which
was situated at the Roodepoort Cement factory. A 50 litre Eirich mixer was used for
mixing and each batch was mixed for two and a half minutes. Both fine and coarse
aggregates were air-dried overnight prior to being weighed on the day of mixing. An
unopened 50 kg bag of cement was used for each of the four sets of specimens. Mix
water was weighed just prior to the mixing cycle. The materials were added in the
following order: coarse aggregate, cement, fine aggregate and finally, water. Water
was added immediately after the mixer had been started and the mixing time was
measured from the time water was introduced. After the batch of concrete had been
mixed for two minutes the mixer was stopped and the slump measured. The sample
B T Benn 7231599 28
of concrete used for the slump was returned to the mixer and the concrete mixed for
a further 30 seconds then two beams and three cube specimens made.
3.4 Testing of Concrete
3.4.1 Introduction
The physical properties of each batch of concrete were measured in order to ensure
the mixes were consistent across the twelve batches needed for the four sets of
specimens. The physical properties measured were fresh wet density (FWD), slump
and unconfined compressive strength.
3.4.2 Fresh Concrete
The tests that were carried out on the fresh concrete were:
• FWD in accordance with SABS Method 1245:1994 [33] except that a 100mm
cube mould was used as the measuring vessel.
• Slump in accordance with SABS Method 862-1:1994 [34].
The fresh wet density was used as a control measure of control for batching, while
the slump was used to ensure that similar workability was obtained for each of the
three mixes that made up a single set of specimens bearing in mind that the quantity
of water added to each batch was kept constant.
3.4.3 Hardened Concrete
Three cube specimens were made from each batch, then cured and tested in
accordance with SABS Method 863:1994 [35]. The cubes were placed in the curing
room maintained at a temperature of 22 to 25 °C and a relative humidity of 90% to

B T Benn 7231599 29
95% for the first 24 hours. After demoulding, the cubes were stored under water in
the curing room at 22 to 25 °C until crushed on a 3000 kN Amsler compression
testing machine in the Roodepoort laboratory. The 7-day and 28-day compressive
strengths of each set of specimens were determined by crushing one randomly
selected cube from each batch that made up a particular set. The compressive
strengths of these four sets of specimens were compared to confirm that the wet
cured concretes were of a similar strength grade at 28 days. The remaining three
cubes from each set of mixes were crushed at one day (set B), three days (set A),
56-days (set C) and 90-days (set D).
3.5 Curing Regime for the Beams
During the first 24 hours, each set of six beams was handled in the same manner as
the cubes. Immediately after casting, the beams were placed in the curing room
maintained at a temperature of 22 to 25 °C and with a relative humidity of 90% to
95%.
The beams were removed from the moulds after 24 hours and then subjected to the
following curing regimes:
• Set A: Stored underwater for 27 days at a temperature of 22 to 25 °C. After
removing the beams from the curing tank, they were placed outdoors where they
were exposed to the prevailing weather conditions for one year
• Set B: After 6 days in the curing tank, the beams were placed outdoors
• Set C: After 2 days in the curing tank, the beams were placed outdoors
• Set D: After demoulding at 24 hours, the beams were immediately placed
outdoors

B T Benn 7231599 30
The outdoor weather conditions had a daily average winter to summer temperature
range of 0 to 20 °C and an average relative humidity range of 10% to 60% during the
12 months before the specimens were cut and prepared for coating application.
3.6 Specimen Preparation
3.6.1 Climatic Exposure
The prepared sections were exposed to ambient weather conditions for 12 months
prior to being cut and coated as per the schedule set out in Table 5. Before the
prepared surfaces were coated, they were stored inside the laboratory for six months
to allow them to dry out.
3.6.2 Cutting the Beams
Columns one to three of Table 5 detail how each beam was cut into sections, using a
wet-blade diamond saw, to the following approximate sizes, (also shown in Figure 6):
• 50x150x150 mm: two samples; for optical microscopy and water-sorptivity tests
• 150x150x150 mm: four samples; for surface preparation and coating tests.
“top trowelled” surface “vertical cast & prepared” surface
50 150 150 150 50 150____
FIGURE 6: Sketch of the beam sections (not to scale)
The procedure involved cutting a 50 mm section off the end of the beam prior to
preparing the surface. Once the surface preparation was complete, another 50 mm
B T Benn 7231599 31
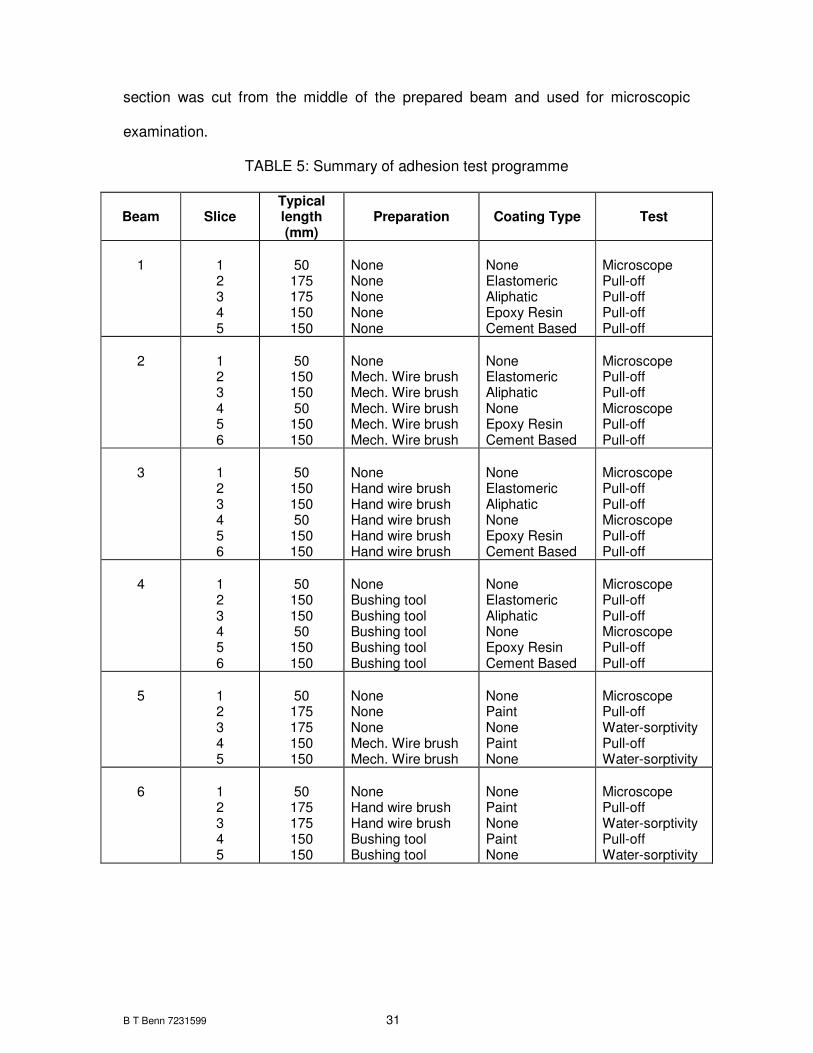
section was cut from the middle of the prepared beam and used for microscopic
examination.
TABLE 5: Summary of adhesion test programme
Beam Slice Typical length (mm)
Preparation Coating Type Test
1
1 2 3 4 5
50
175 175 150 150
None None None None None
None Elastomeric Aliphatic Epoxy Resin Cement Based
Microscope Pull-off Pull-off Pull-off Pull-off
2
1 2 3 4 5 6
50
150 150 50
150 150
None Mech. Wire brush Mech. Wire brush Mech. Wire brush Mech. Wire brush Mech. Wire brush
None Elastomeric Aliphatic None Epoxy Resin Cement Based
Microscope Pull-off Pull-off Microscope Pull-off Pull-off
3
1 2 3 4 5 6
50
150 150 50
150 150
None Hand wire brush Hand wire brush Hand wire brush Hand wire brush Hand wire brush
None Elastomeric Aliphatic None Epoxy Resin Cement Based
Microscope Pull-off Pull-off Microscope Pull-off Pull-off
4
1 2 3 4 5 6
50
150 150 50
150 150
None Bushing tool Bushing tool Bushing tool Bushing tool Bushing tool
None Elastomeric Aliphatic None Epoxy Resin Cement Based
Microscope Pull-off Pull-off Microscope Pull-off Pull-off
5
1 2 3 4 5
50
175 175 150 150
None None None Mech. Wire brush Mech. Wire brush
None Paint None Paint None
Microscope Pull-off Water-sorptivity Pull-off Water-sorptivity
6
1 2 3 4 5
50
175 175 150 150
None Hand wire brush Hand wire brush Bushing tool Bushing tool
None Paint None Paint None
Microscope Pull-off Water-sorptivity Pull-off Water-sorptivity
B T Benn 7231599 32
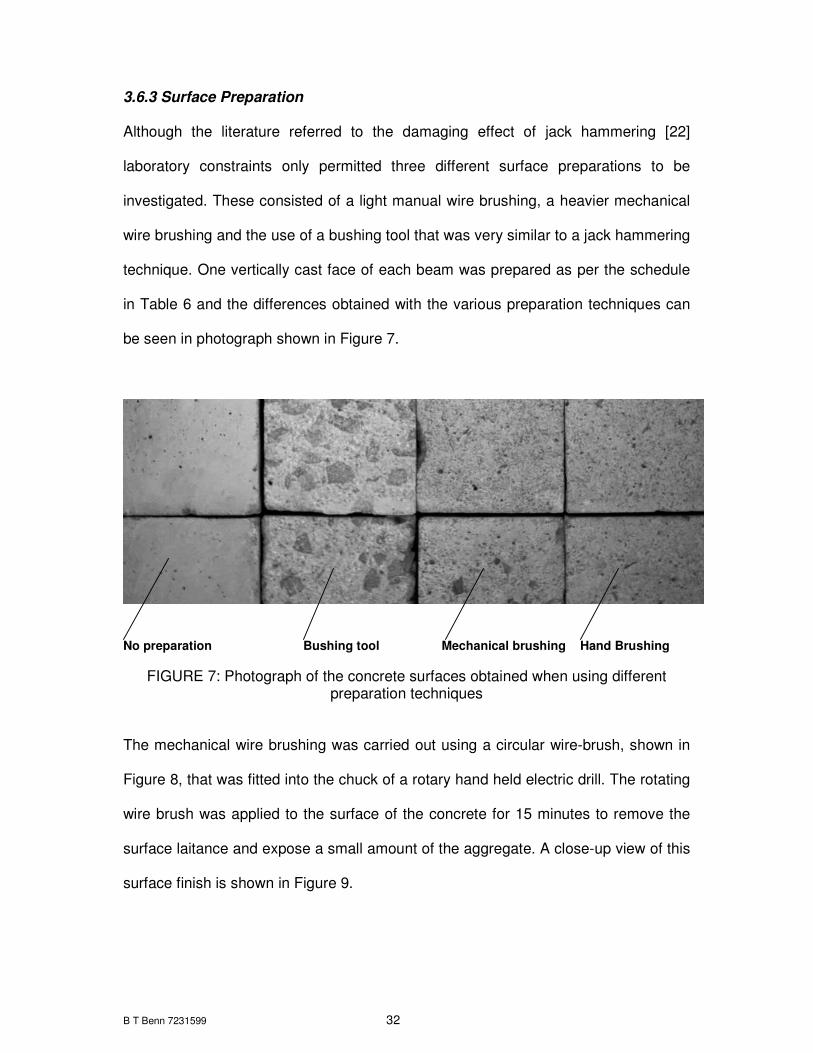
3.6.3 Surface Preparation
Although the literature referred to the damaging effect of jack hammering [22]
laboratory constraints only permitted three different surface preparations to be
investigated. These consisted of a light manual wire brushing, a heavier mechanical
wire brushing and the use of a bushing tool that was very similar to a jack hammering
technique. One vertically cast face of each beam was prepared as per the schedule
in Table 6 and the differences obtained with the various preparation techniques can
be seen in photograph shown in Figure 7.
No preparation Bushing tool Mechanical brushing Hand Brushing
FIGURE 7: Photograph of the concrete surfaces obtained when using different preparation techniques
The mechanical wire brushing was carried out using a circular wire-brush, shown in
Figure 8, that was fitted into the chuck of a rotary hand held electric drill. The rotating
wire brush was applied to the surface of the concrete for 15 minutes to remove the
surface laitance and expose a small amount of the aggregate. A close-up view of this
surface finish is shown in Figure 9.
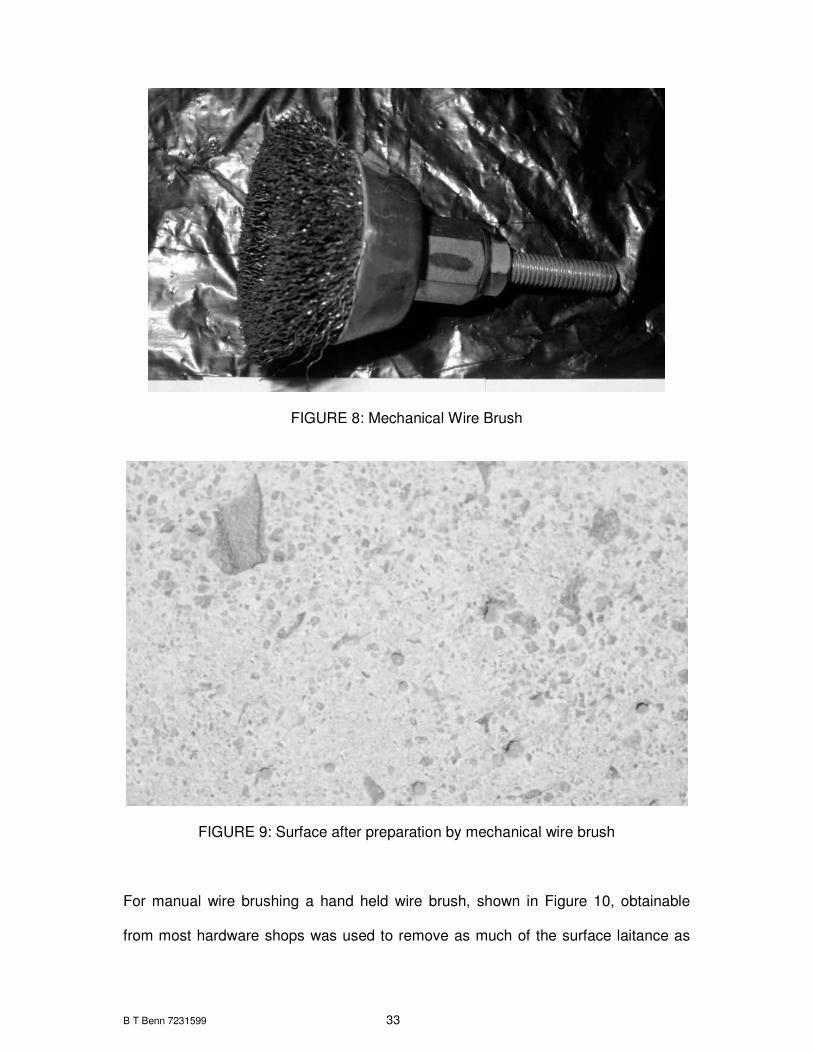
B T Benn 7231599 33
FIGURE 8: Mechanical Wire Brush
FIGURE 9: Surface after preparation by mechanical wire brush
For manual wire brushing a hand held wire brush, shown in Figure 10, obtainable
from most hardware shops was used to remove as much of the surface laitance as

B T Benn 7231599 34
possible. The manual brushing was applied for 15 to 20 minutes, which, as seen in
Figure 11, exposed very little of the coarse aggregate.
FIGURE 10: Hand held Wire Brush
FIGURE 11: Surface after preparation by hand held wire brushing technique
B T Benn 7231599 35
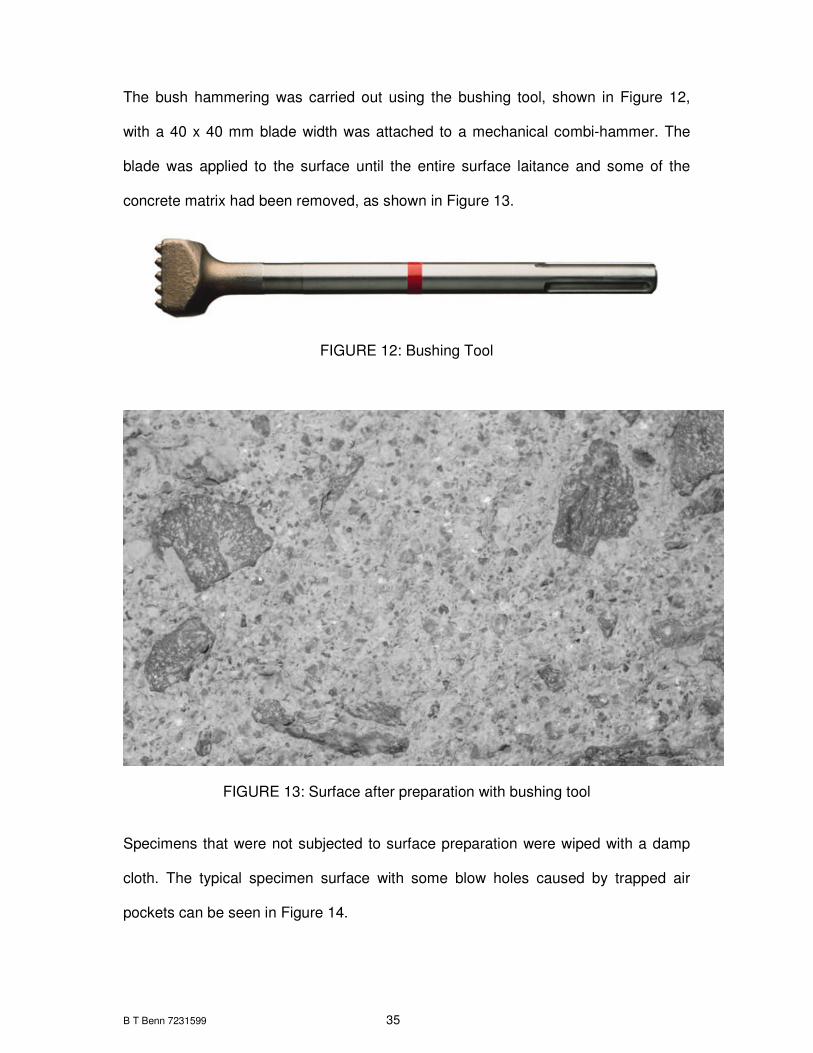
The bush hammering was carried out using the bushing tool, shown in Figure 12,
with a 40 x 40 mm blade width was attached to a mechanical combi-hammer. The
blade was applied to the surface until the entire surface laitance and some of the
concrete matrix had been removed, as shown in Figure 13.
FIGURE 12: Bushing Tool
FIGURE 13: Surface after preparation with bushing tool
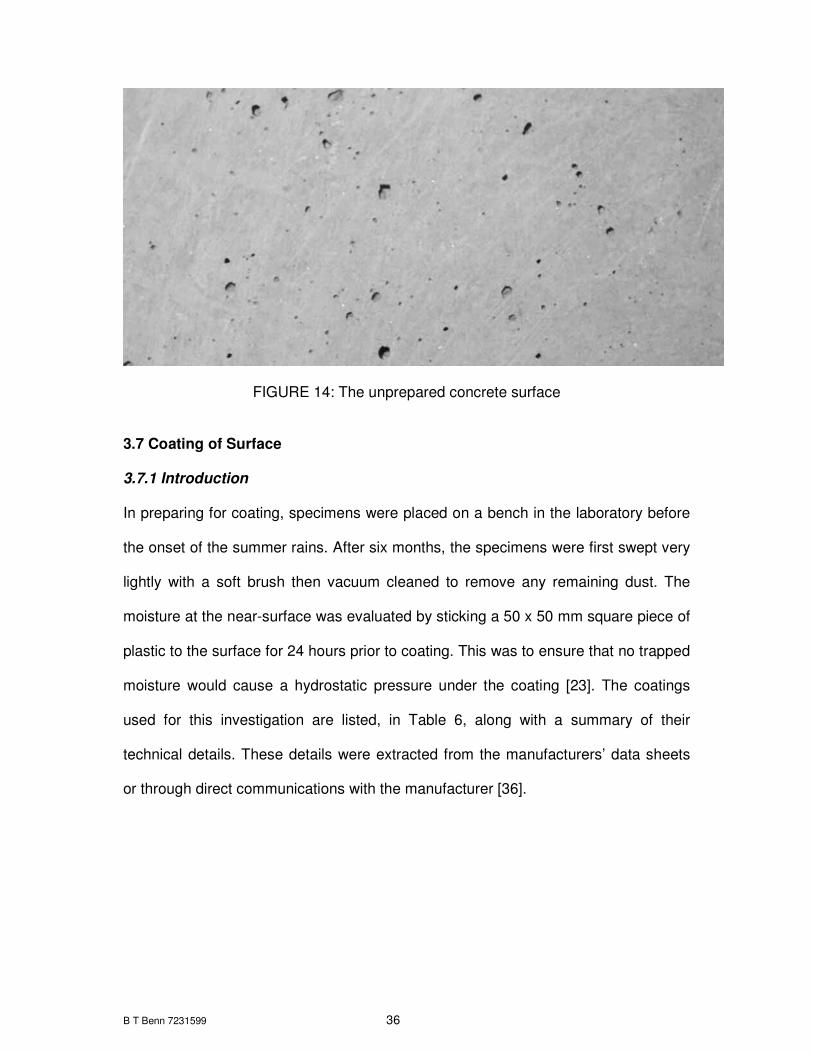
Specimens that were not subjected to surface preparation were wiped with a damp
cloth. The typical specimen surface with some blow holes caused by trapped air
pockets can be seen in Figure 14.
B T Benn 7231599 36
FIGURE 14: The unprepared concrete surface
3.7 Coating of Surface
3.7.1 Introduction
In preparing for coating, specimens were placed on a bench in the laboratory before
the onset of the summer rains. After six months, the specimens were first swept very
lightly with a soft brush then vacuum cleaned to remove any remaining dust. The
moisture at the near-surface was evaluated by sticking a 50 x 50 mm square piece of
plastic to the surface for 24 hours prior to coating. This was to ensure that no trapped
moisture would cause a hydrostatic pressure under the coating [23]. The coatings
used for this investigation are listed, in Table 6, along with a summary of their
technical details. These details were extracted from the manufacturers’ data sheets
or through direct communications with the manufacturer [36].

B T Benn 7231599 37
TABLE 6: Summary of coatings and technical details
Type Elastomeric Aliphatic Epoxy Resin
Cement Based
Paint [36]
Number of components Primer requirements Number of coats Minimum thickness per coat Suggested final thickness Over-coating time Coverage rate Curing time Minimum concrete temperature Application Type
One Yes, solvent 2 Not stated Not stated 8 hours min. 3-5 m²/ℓ Not stated 5 °C Brush/spray
One Yes, silane 2 150 µm 300 µm min. 6 hours 3 m²/ℓ Not stated 2 °C Brush
Two No 2 175 µm 350 µm min. 24 hours 5.5-7 m²/ℓ 7 days 5 °C Brush/spray
Two Yes, water 2 Not stated 2mm max. 2-6 hours 2 kg/ m²/mm 28 days 5 °C Brush/spray
One No 2 Not stated Not stated 4 hours 6 m²/ℓ 24 hours Not stated Brush
3.7.2 Coating Application Procedure
Where required by the manufacturer, the recommended primer was applied and
where allowed to cure as necessary before the coatings were applied. The coatings
were all brush applied in accordance with the manufacturers’ instructions. The
thickness of each coating, as detailed in Table 7, was also in accordance with the
recommendations given on the manufacturers’ instructions. The thickness was
measured as a wet film thickness using a “Wet Film Thickness Gauge” obtained from

B T Benn 7231599 38
Fosroc International Ltd. The coated specimens were kept indoors on the laboratory
bench out of any drafts and not exposed to the sun while the coating was curing. The
test specimens were small compared to an actual structure and in order to prevent
the coating from being damaged by the penetration of moisture through the uncoated
sides of the specimens or by frost the specimens were kept inside the laboratory for
the duration of the testing.
TABLE 7: Wet film thickness and over-coating time
Coating Wet Film Thickness (micron)
Over-coating time (hours)
Elastomeric 400 48 Aliphatic 175 48
Epoxy resin 175 72 Cementitious 1000 24
Masonry paint 175 24
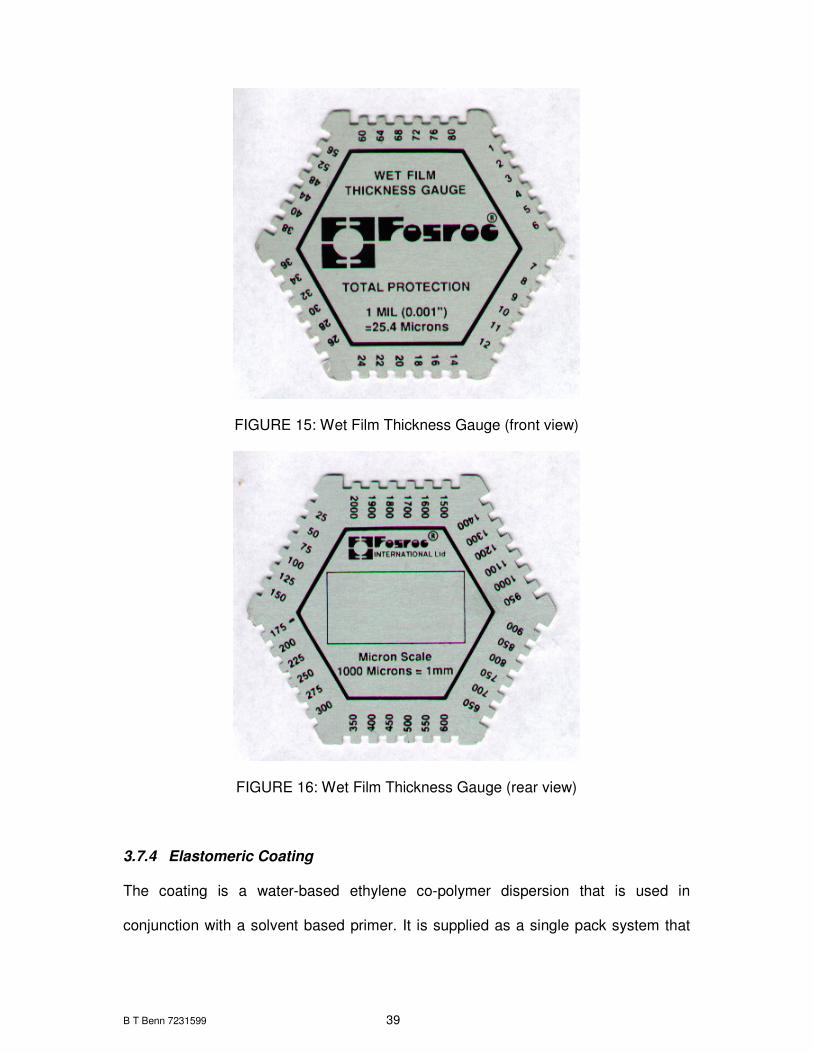
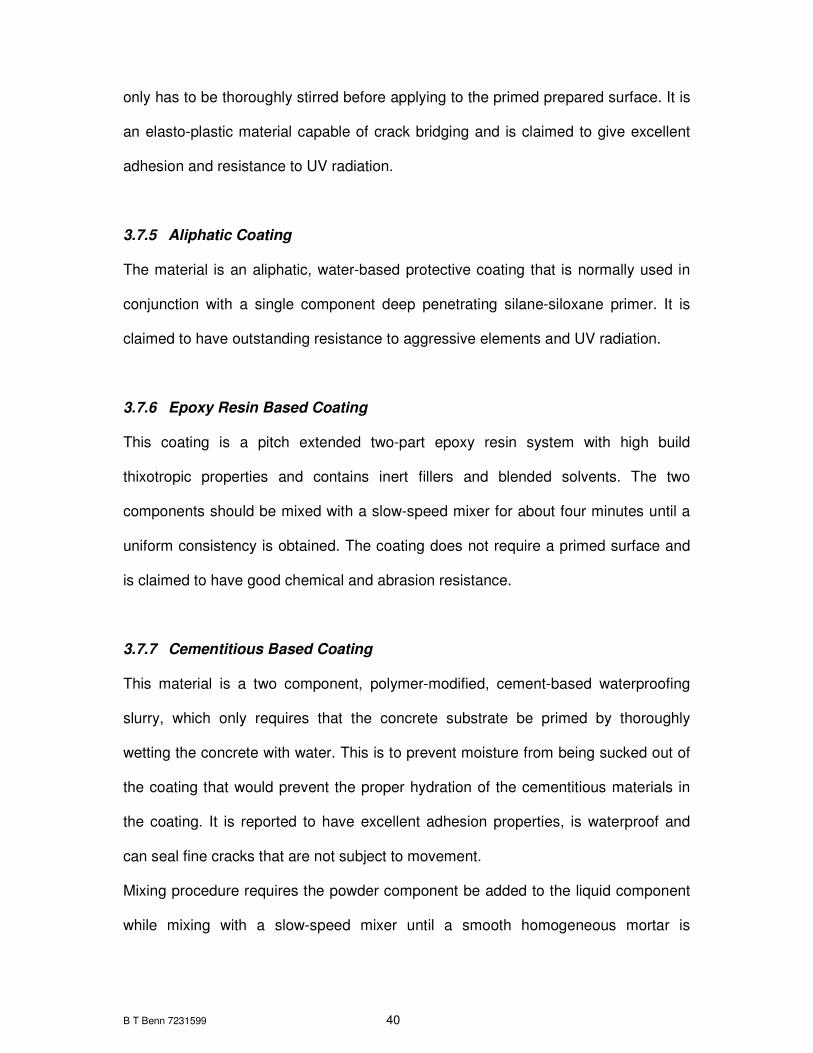
3.7.3 Controlling Film Thickness The Wet Film Thickness Gauge used consists of a hexagonal aluminium plate (see
Figure 15 and Figure 16), which is 1 mm thick with a series of six spigots cut into
each side between the corners. The spigots are manufactured such that each will
leave a predetermined gap between the surface and the end of the spigot when the
corners are pressed firmly onto the surface.
The gap size varies from a minimum of 25 microns to a maximum of 2 000 microns.
The gauge is used, by pressing the corners firmly into the wet coating until they rest
against the substrate. The thickness of the coating is determined by removing the
disc and visually inspecting the spigots to determine which one has been covered
with the coating. For example: if the 175 micron and 200 micron spigots are coated
but the 225 micron spigot is not, then the wet film thickness is recorded as 200
microns.
B T Benn 7231599 39
FIGURE 15: Wet Film Thickness Gauge (front view)
FIGURE 16: Wet Film Thickness Gauge (rear view)
3.7.4 Elastomeric Coating
The coating is a water-based ethylene co-polymer dispersion that is used in
conjunction with a solvent based primer. It is supplied as a single pack system that
B T Benn 7231599 40
only has to be thoroughly stirred before applying to the primed prepared surface. It is
an elasto-plastic material capable of crack bridging and is claimed to give excellent
adhesion and resistance to UV radiation.
3.7.5 Aliphatic Coating
The material is an aliphatic, water-based protective coating that is normally used in
conjunction with a single component deep penetrating silane-siloxane primer. It is
claimed to have outstanding resistance to aggressive elements and UV radiation.
3.7.6 Epoxy Resin Based Coating
This coating is a pitch extended two-part epoxy resin system with high build
thixotropic properties and contains inert fillers and blended solvents. The two
components should be mixed with a slow-speed mixer for about four minutes until a
uniform consistency is obtained. The coating does not require a primed surface and
is claimed to have good chemical and abrasion resistance.
3.7.7 Cementitious Based Coating
This material is a two component, polymer-modified, cement-based waterproofing
slurry, which only requires that the concrete substrate be primed by thoroughly
wetting the concrete with water. This is to prevent moisture from being sucked out of
the coating that would prevent the proper hydration of the cementitious materials in
the coating. It is reported to have excellent adhesion properties, is waterproof and
can seal fine cracks that are not subject to movement.
Mixing procedure requires the powder component be added to the liquid component
while mixing with a slow-speed mixer until a smooth homogeneous mortar is

B T Benn 7231599 41
obtained. When brush applied, the second coat is applied at 90 degrees to the
direction of application of the first coat.
3.7.8 Masonry Paint
The acrylic, water-based paint was readily available from most hardware stores, was
advertised as having good adhesion properties and does not require a primer.
3.8 Water Sorptivity Test
In order to assess the near-surface concrete the specimens were made Multi
Purpose Cement (MC 22.5 X) containing a approximately 35% percentage fly ash
and were subjected to different curing regimes to influence both the compressive
strength and the quality of the near-surface concrete. The water sorptivity test was
used to characterise the quality of surface concrete before and after preparation of
the surfaces. The results were also used to provide a basis for comparison of the
pull-off strengths in relation to the initial surface quality. Tests, using samples 68 mm
diameter by 25 mm thick, were carried out as per the method statement set out in
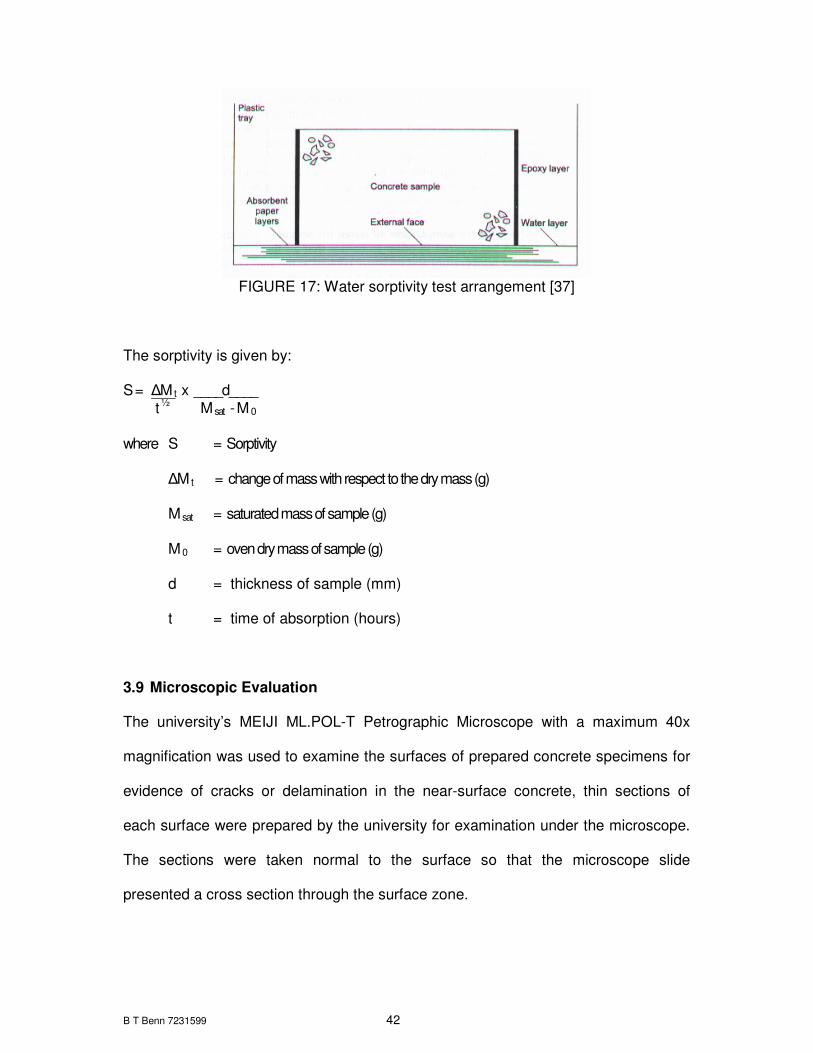
Alexander M.G. et al. [37] "Concrete durability index testing manual". Figure 17
shows a sketch of the test arrangement. The test method consists of measuring the
mass of water absorbed over time through the surface of a sample, having sealed
the sides of the sample before commencing the test.
B T Benn 7231599 42
FIGURE 17: Water sorptivity test arrangement [37]
The sorptivity is given by:
S = ∆M t x ____d____ t ½ M sat - M 0 where S = Sorptivity
∆M t = change of mass with respect to the dry mass (g)
M sat = saturated mass of sample (g)
M 0 = oven dry mass of sample (g)
d = thickness of sample (mm)
t = time of absorption (hours)
3.9 Microscopic Evaluation The university’s MEIJI ML.POL-T Petrographic Microscope with a maximum 40x
magnification was used to examine the surfaces of prepared concrete specimens for
evidence of cracks or delamination in the near-surface concrete, thin sections of
each surface were prepared by the university for examination under the microscope.
The sections were taken normal to the surface so that the microscope slide
presented a cross section through the surface zone.

B T Benn 7231599 43
3.10 Adhesion Testing 3.10.1 Adhesion Tester The adhesion tests were carried out using an Elcometer 106 Adhesion Tester, which
consists of aluminium studs and adhesion tester.
The aluminium studs, 20 mm in diameter and 14 mm high are shown in a schematic
diagram, Figure 18.
FIGURE 18: Adhesion stud [38]
The Elcometer adhesion tester, shown in Figure 19, consists of a truncated cone with
three adjustable feet at the larger end of the cone. The upper smaller end of the cone
consists of a barrel that houses a spring arrangement. The spring applies a lifting
force to the stud when the hand-operated circular disc is turned clockwise at a
loading rate of 1 N/mm2 per minute. Between the feet is a slotted jaw that is
engineered to precisely slide over the stud ensuring axial loading. The testers are
available with different scale ranges engraved onto the barrel in N/mm2. The
maximum force that could be recorded on the Elcometer used in this investigation
was 7 N/mm2.
3.10.2 Method of Operation
A two-part Pratley Quickset Clear Glue was selected because the tensile strength
was stronger than both the substrate and the coating. This glue has rapid setting

B T Benn 7231599 44
characteristics, gelling within three minutes and reaching final set in approximately
eight minutes at 23 °C. Full tensile strength is obtained in about one hour and the
glue is sufficiently cured in 24 hours.
FIGURE 19: Elcometer Adhesion Tester [5]
FIGURE 20: Test Studs attached to coating before testing
The studs were glued to the coatings as shown in Figures 18 and 20. After 24 hours
the tester was positioned such that each stud was pushed hard up against the back
of the jaw; this ensured that the pull-off load was applied axially through the stud. The
B T Benn 7231599 45
handle was then turned clockwise to apply a tensile load to the stud. As load is
applied, the barrel is forced downwards and the indicator needle upwards until the
adhesion between the coating and the near-surface concrete fails. When the coating
fails, the force is released allowing the barrel to spring upwards leaving needle to
indicate the force applied at the time of failure. The reusable studs were visually
inspected to record the mode of failure, described below, before they were cleaned of
the glue and any coating.
Adhesion failure at the interface of the coating and the substrate may include a clean
break with no substrate attached to the coating or a small amount (< 30% of the stud
area) of the substrate may be attached to the coating. Cohesive failure occurs if
between 30% and 60% of the stud area has pieces of the substrate attached to the
coating. Substrate failure occurs when more than 70% of the coating is covered with
substrate.

B T Benn 7231599 46
Chapter 4: RESULTS AND DISCUSSION
4.1 Introduction
The results of the different tests conducted, together with a discussion of these
results, are reported in this chapter. The batch weights, concrete test results and the
statistical calculations on the test results are detailed in Table A1 and Table B1 in the
Appendix. As a limited number of samples were tested in this investigation the mean,
standard deviation and coefficient of variation were used to assess if there were
significant difference between the sample sets.
4.2 Fresh Concrete
4.2.1 Fresh Wet Density
The average FWD of the 12 batches was 2446 ± 27.6 kg/m3, detailed in Table 9 and
Table B1 in the appendix, which indicated that the mixes had been consistently
weighed, as the FWD measure did not differ by more than 50 kg/m3 from the
theoretical batch mass. The average FWD of Set D was lower than the other three
sets and the slump of this set of mixes was similar to Set A and Set B therefore
additional water was probably not the reason for the lower density but most likely this
was due to less compaction effort when making the cubes. To a lesser extent, a
change in the particle shape and the combined grading of the coarse aggregate and
sand caused by segregation during weighing in the laboratory may also have
contributed to the difference in FWD between Set D and the other sets of results.

B T Benn 7231599 47
4.2.2 Slump
The consistence, as measured by the slump test, for each of the 12 mixes was within
±10 mm of the target slump of 90 mm (target range was 80 mm to 100 mm), as seen
in Table 9. This was within the suggested tolerance of 25 mm or ±⅓ of specified
slump [39] for representative samples so no adjustments were made to the mixes.
The average slump of Set C was different to the other average slump values. As due
care was taken in batching mix materials it is unlikely that an error was made in the
measuring of the water and based on Figure B1 extracted from Concrete
Technology, A South African Handbook [40] a change in slump from 85 mm to 95
mm would require between 40 ml/batch (1ℓ/m3) and 80 ml/batch (2 ℓ/m3), a quantity
that was unlike to have gone unnoticed. The fresh wet density and masses of the
cubes also indicate that additional water was not the probable cause. However it was
possible that there was sufficient slurry left in the mixer after the first mix to have
impacted on the slump of the subsequent mixes. It is also possible that a larger
proportion of material greater than 13.2 mm in size was included during the weighing
of the coarse aggregate. This may have been the result of segregation caused during
the handling of the material in the laboratory. An increase in the amount of the larger
fraction could have reduced the surface area of the aggregates just enough to affect
the slump.
4.3 Hardened Concrete
4.3.1 Long-term Exposure Conditions
Concrete beams were left outside the laboratory where they were exposed to typical
Highveld conditions. Based on monthly averages, shown in Table 8, as reported by
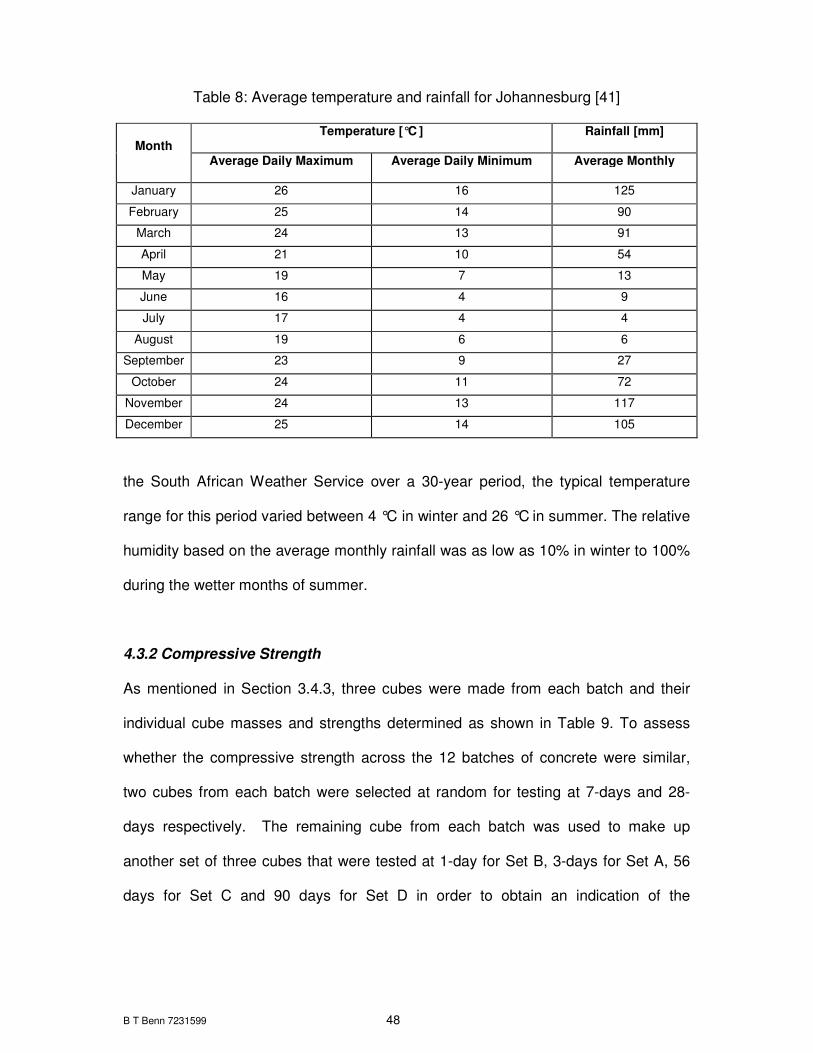
B T Benn 7231599 48
Table 8: Average temperature and rainfall for Johannesburg [41]
Month Temperature [°C
] Rainfall [mm]
Average Daily Maximum Average Daily Minimum Average Monthly
January 26 16 125
February 25 14 90
March 24 13 91
April 21 10 54
May 19 7 13
June 16 4 9
July 17 4 4
August 19 6 6
September 23 9 27
October 24 11 72
November 24 13 117
December 25 14 105
the South African Weather Service over a 30-year period, the typical temperature
range for this period varied between 4 °C in winter and 26 °C in summer. The relative
humidity based on the average monthly rainfall was as low as 10% in winter to 100%
during the wetter months of summer.
4.3.2 Compressive Strength
As mentioned in Section 3.4.3, three cubes were made from each batch and their
individual cube masses and strengths determined as shown in Table 9. To assess
whether the compressive strength across the 12 batches of concrete were similar,
two cubes from each batch were selected at random for testing at 7-days and 28-
days respectively. The remaining cube from each batch was used to make up
another set of three cubes that were tested at 1-day for Set B, 3-days for Set A, 56
days for Set C and 90 days for Set D in order to obtain an indication of the

B T Benn 7231599 49
compressive strength development of well cured concrete containing a high fly ash
content up to three months after casting.
Unfortunately due to an administrative error only two cubes of Set C were crushed at
56 days and the other was crushed at 90 days. This result was combined with the
results of the three cubes from Set D to indicate the 90 day strength. At each age,
the three tested cubes satisfied the 15% acceptance requirement of SABS Method
863:1994 [35]. The compressive strength at 28 days of each batch of concrete
exceeded the target strength of 20 MPa but a comparison of the results indicated that
both Set C and Set D have lower strengths than Set A and Set B. The lower strength
obtained in Set C, Table 9, coincided with a higher slump but the FWD and the
masses of the cubes were similar to both Set A and Set B. As discussed in Section
4.2.2 the quantity of water required to change the slump was unlikely to have gone
unnoticed, which tends to indicate that neither the water content nor aggregate
content changed. If the 15% acceptance requirement [35] is applied to the nine
cubes of Set A, Set B and Set C then the values obtained in Set C are valid and the
results can be considered as part of the overall set, with the difference probably due
to testing variation during crushing.
The lower strengths in Set D, Table 9, failed the 15% acceptance requirement [35]
when all 12 cubes were considered as part of the same set. These lower strengths
could well be related to the lower FWD and lower cube masses, which indicates that
either the water content or combined aggregate grading changed, or that the cubes
were not properly compacted. As the slump of Set D was not significantly different it
is unlikely that the water content or combined grading was the cause but the most
probable reason for the lower strengths was inadequate compaction of the cubes,
which were generally lower in mass than all the other seven and 28 day cubes.

B T Benn 7231599 50
The average compressive strength and standard deviation for 7-day and 28-day
tests, based on 12 samples (see Appendix, Table C1) taken across the batches,
were 14.5±1.0 MPa and 23.5±1.5 MPa respectively. The average compressive
strength of the four sets exceeded 30 MPa after 56 days and 35 MPa after 90 days.
Table 9 also shows the mass of each individual cube and these masses compared
favourably with the FWD obtained at the time of mixing.
TABLE 9: Physical properties of concrete as measured for each batch
Set A B C D
Batch 1 2 3 1 2 3 1 2 3 1 2 3
Property Unit Fresh Concrete Tests
Slump mm 80 85 80 85 85 80 90 95 95 85 90 85
FWD kg/m3 2468 2464 2473 2458 2437 2480 2412 2443 2473 2433 2397 2414
Cube Masses and Compressive Strength Tests (100 mm cubes)
1-day kg 2444 2443 2449
MPa 4.5 5.0 5.0
3-day kg 2467 2394 2429
MPa 10.5 10.5 10.5
7-day kg 2464 2452 2470 2446 2471 2463 2441 2445 2436 2416 2397 2413
MPa 15.0 15.0 15.0 15.0 15.5 15.5 13.0 13.0 13.5 13.5 14.0 13.0
28-day kg 2394 2451 2446 2449 2488 2459 2412 2449 2434 2387 2422 2414
MPa 25.5 24.5 24.0 25.0 24.0 25.0 23.5 22.5 23.0 22.0 21.0 21.5
56-day kg 2440 2466
MPa 30.0 32.0
90-day kg 2434 2432 2446 2441
MPa 40.0 36.0 38.5 37.0
The strength development curve shown in Figure 21 indicates that with sustained
moist curing, fly ash contributes significantly to strength development after 28 days.
By wet curing the cubes, strength increased from 23.5 MPa at 28 days to 38 MPa
(increase of ±61%) at 90 days. This substantiates the premise that by varying the
moist curing of the concrete beams, concrete of differing quality would be produced.
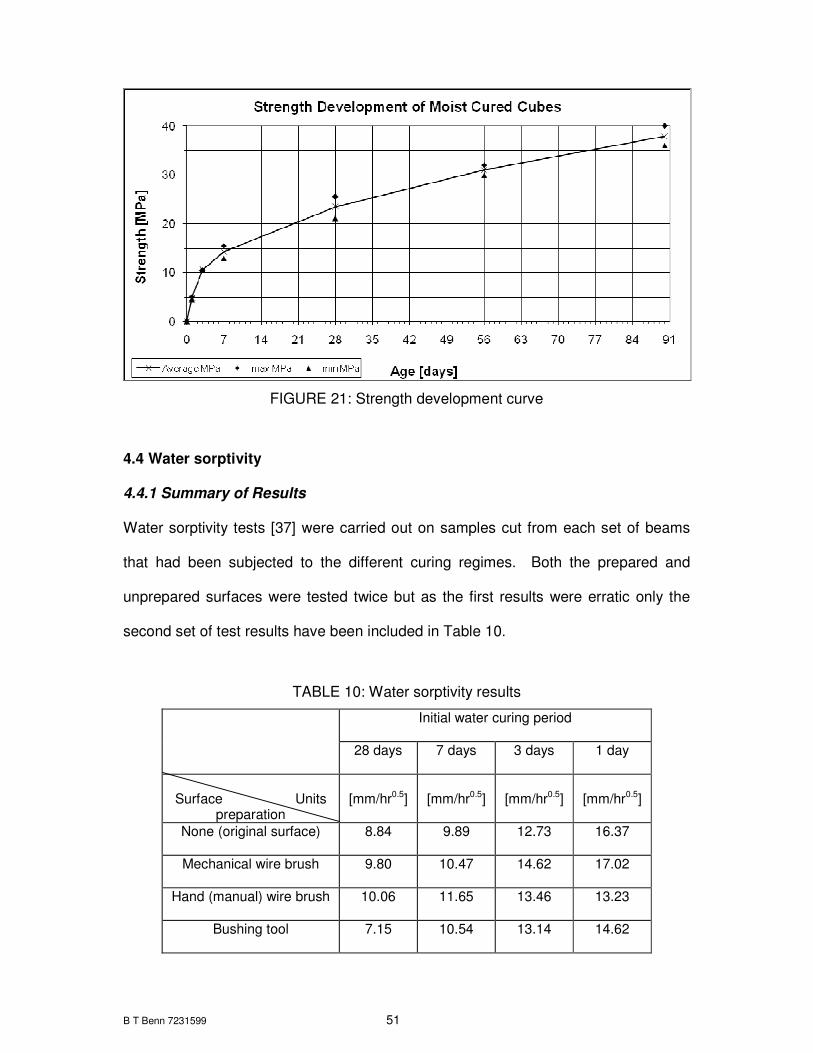
B T Benn 7231599 51
FIGURE 21: Strength development curve
4.4 Water sorptivity
4.4.1 Summary of Results
Water sorptivity tests [37] were carried out on samples cut from each set of beams
that had been subjected to the different curing regimes. Both the prepared and
unprepared surfaces were tested twice but as the first results were erratic only the
second set of test results have been included in Table 10.
TABLE 10: Water sorptivity results
Initial water curing period
28 days 7 days 3 days 1 day
Surface Units
preparation [mm/hr0.5] [mm/hr0.5] [mm/hr0.5] [mm/hr0.5]
None (original surface) 8.84 9.89 12.73 16.37
Mechanical wire brush 9.80 10.47 14.62 17.02
Hand (manual) wire brush 10.06 11.65 13.46 13.23
Bushing tool 7.15 10.54 13.14 14.62

B T Benn 7231599 52
Table 10 gives details of results obtained with the second test and are arranged from
left to right in order of decreasing curing time and from top to bottom in order of
increasing mechanical effort in surface preparation.
4.4.2 Analysis of Results
The results shown in Figure 22 indicate that, there was little or no correlation
between the wet curing period and the method of surface preparation at a particular
age after curing. It would have been expected that the “no preparation” sample would
show the highest sorptivity due to the weak layer of surface concrete while the hand
brushing and mechanical wire brushing would give lower sorptivities as the poor
near-surface concrete was removed. The bushing tool could be expected to give
variable results as shown due to the possibility of concrete “bruising” as mentioned in
various papers [12, 16].
FIGURE 22: Chart of Sorptivity and Curing Time
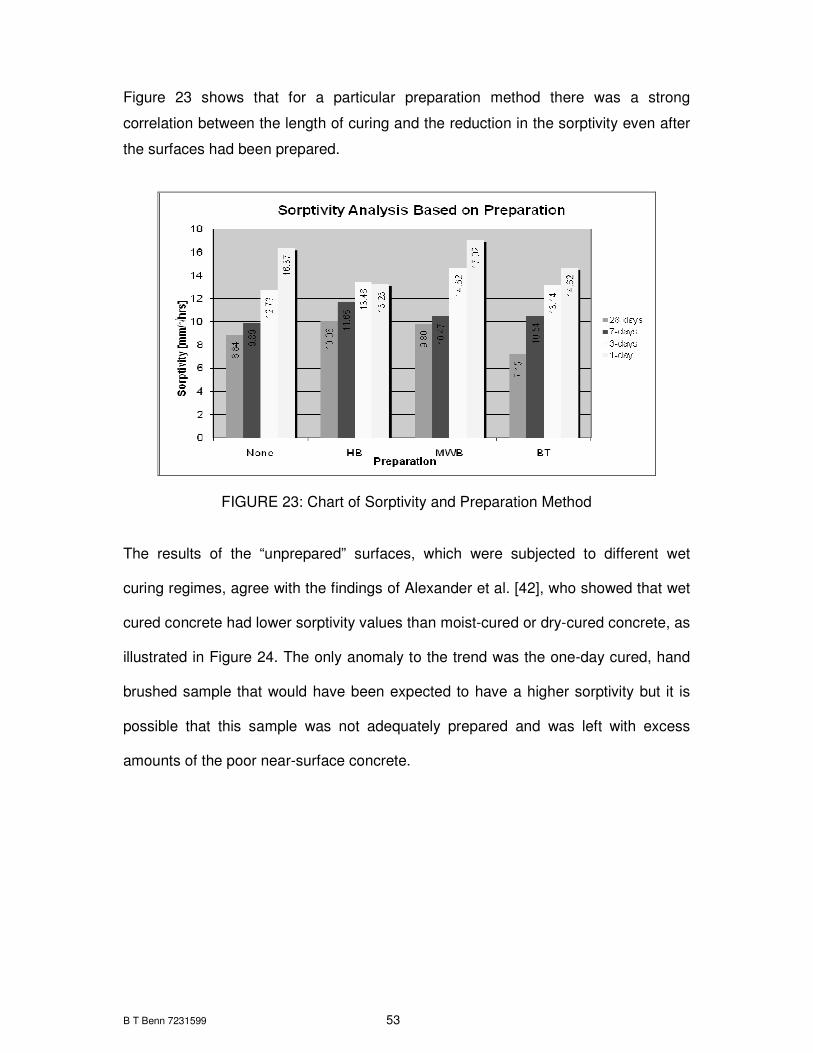
B T Benn 7231599 53
Figure 23 shows that for a particular preparation method there was a strong
correlation between the length of curing and the reduction in the sorptivity even after
the surfaces had been prepared.
FIGURE 23: Chart of Sorptivity and Preparation Method
The results of the “unprepared” surfaces, which were subjected to different wet
curing regimes, agree with the findings of Alexander et al. [42], who showed that wet
cured concrete had lower sorptivity values than moist-cured or dry-cured concrete, as
illustrated in Figure 24. The only anomaly to the trend was the one-day cured, hand
brushed sample that would have been expected to have a higher sorptivity but it is
possible that this sample was not adequately prepared and was left with excess
amounts of the poor near-surface concrete.

B T Benn 7231599 54
FIGURE 24: Water sorptivity of OPC concretes with different curing regimes [42]
Calculations of the water sorptivity values and their correlation coefficient for the
linear regression are detailed in the Appendices. The correlation coefficient of linear
regression analysis on the water sorptivity results was greater than 95% for all results
as detailed in Table 11.
The results of the tests on the unprepared surfaces that had been subjected to
different wet curing regimes, together with previous work carried out by
Alexander.M.G et al. [42] strongly suggest the water sorptivity test can be used to
index the quality of the surface concrete of a structure.
TABLE 11: Correlation coefficient for water sorptivity test results
Surface Preparation
Wet Curing
None Mechanical Wire Brush
Hand Wire Brushing
Bushing tool
28 days 0.988 0.995 0.990 1.000
7 days 0.994 0.993 0.992 0.969
3 days 0.987 0.996 0.978 0.990
1 day 0.984 0.977 0.976 0.995

B T Benn 7231599 55
4.5 Application of Coatings
4.5.1 General Assessment
Based on the assessments made during application of the coatings, the following
was noted:
• The more viscous the material, the more difficult it was to ensure an even
thickness of coating.
• On an uneven surface, it was very difficult to apply an even thickness of coating.
• If coatings are to be applied effectively and in particular over a large surface area,
a spray application may be preferable.
5.5.2 Elastomeric Coating
The elastomeric coating on different surfaces is shown in Figure 25 with the bushing
tool preparation on the left, mechanical wire brushed surface in the centre and hand
wire brushed surfaces on the right. Spraying this material would not pose a problem
if the appropriate equipment (recommended by the supplier) were used.
Bushing tool Mechanical brushing Hand Brushing
FIGURE 25: Specimens coated with elastomeric coating

B T Benn 7231599 56
4.5.3 Aliphatic coating
No preparation Bushing tool Mechanical brushing Hand Brushing
FIGURE 26: Specimens coated with aliphatic coating
In Figure 26, the unprepared surface is shown on the left followed by the bushing tool
preparation, mechanical wire brushing and hand wire brushing on the right. This
material tended to dry more quickly than the elastomeric coating but was easy to
apply with a brush and will also spray without difficulty.
4.5.4 Epoxy Resin Based Coating
This two-part system was difficult to mix, as the pack had to be split for economic
reasons and the viscous nature of the materials required considerable effort even
with a mechanical mixer. Application by brush was not difficult, although it was
necessary to work quickly as the mixed material exhibited a short pot-life. However,
spraying on site may be a problem unless specialised equipment was available. In
Figure 27 coated surfaces are shown with unprepared surface on the left followed by
the bushing tool preparation, mechanical wire brushing, and hand wire brushing on
the right.

B T Benn 7231599 57
No preparation Bushing tool Mechanical brushing Hand Brushing
FIGURE 27: Specimens coated with epoxy resin based coating
4.5.5 Cementitious Based Coating
This two-part material was much easier to mix than the epoxy resin based material
and was also easier to apply by brush to the recommended thickness. The two coats
resulted in a thick coating that tended to bridge the gaps between specimens as can
be seen in Figure 28. Spraying with suitable equipment should not pose a significant
problem.
FIGURE 28: Specimens coated with cementitious based coating
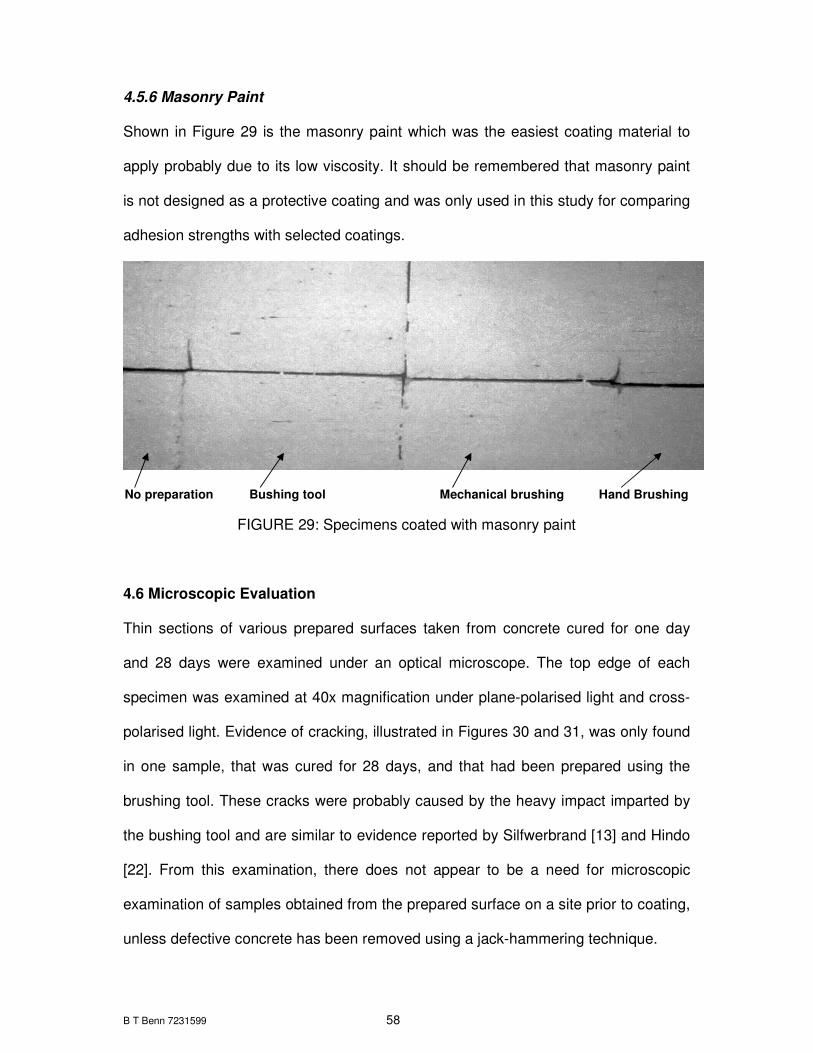
B T Benn 7231599 58
4.5.6 Masonry Paint
Shown in Figure 29 is the masonry paint which was the easiest coating material to
apply probably due to its low viscosity. It should be remembered that masonry paint
is not designed as a protective coating and was only used in this study for comparing
adhesion strengths with selected coatings.
No preparation Bushing tool Mechanical brushing Hand Brushing
FIGURE 29: Specimens coated with masonry paint
4.6 Microscopic Evaluation
Thin sections of various prepared surfaces taken from concrete cured for one day
and 28 days were examined under an optical microscope. The top edge of each
specimen was examined at 40x magnification under plane-polarised light and cross-
polarised light. Evidence of cracking, illustrated in Figures 30 and 31, was only found
in one sample, that was cured for 28 days, and that had been prepared using the
brushing tool. These cracks were probably caused by the heavy impact imparted by
the bushing tool and are similar to evidence reported by Silfwerbrand [13] and Hindo
[22]. From this examination, there does not appear to be a need for microscopic
examination of samples obtained from the prepared surface on a site prior to coating,
unless defective concrete has been removed using a jack-hammering technique.

B T Benn 7231599 59
FIGURE 30: Cracking in the aggregate of concrete prepared with the bushing tool
FIGURE 31: Cracking near the surface of concrete prepared with the bushing tool
4.7 Adhesion Tests
4.7.1 Introduction Analyses of the mode of failure and tensile strengths obtained at four weeks and
sixteen weeks after application of the coatings are detailed in the subsequent
sections while the individual results are presented in the Appendices. The 4-week
cracks in aggregate
surface of concrete
cracks in concrete
surface of concrete
B T Benn 7231599 60
results were based on an average of two tests and the 16-week results on an
average of three tests. The ambient temperature and humidity conditions in the
laboratory were not controlled and, between January and July, the period during
which the application and testing was carried out, these were monitored indoors and
varied from 20 to 27 °C during the day and between 10 to 18 °C at night, while the
relative humidity varied from 55% to 65%. The relative humidity in the laboratory
tended to be higher than the outside ambient conditions due to the curing tanks in the
laboratory.
As mentioned in Section 3.7.2 the coated samples were cured inside the laboratory
on a bench away from any drafts and direct sunlight. The first series of pull-off tests
were carried out after four weeks to allow for a full cure of the cementitious coating.
The second series of pull-off tests were carried out three months after the first tests,
which was sixteen weeks after the application of the coating. A second set of tests
was carried out to establish if there was any change in the adhesion of the coating to
the concrete with time.
4.7.2 Mode of Failure
An assessment of the mode of failure, summarised in Table 12, indicates that where
the concrete was wet-cured for at least 7 days, the mode of failure tends to be at the
interface (33 of 200 results) whereas with the concrete wet-cured for three days or
less there was a greater tendency (85 out of 200) for the failure to be in the substrate
or partly in the substrate. The former is probably due to a higher tensile strength in
the near-surface concrete obtained by well-hydrated cement in this area as opposed
to only partial hydration caused by the premature loss of moisture from the near-
surface concrete when the curing time is reduced.
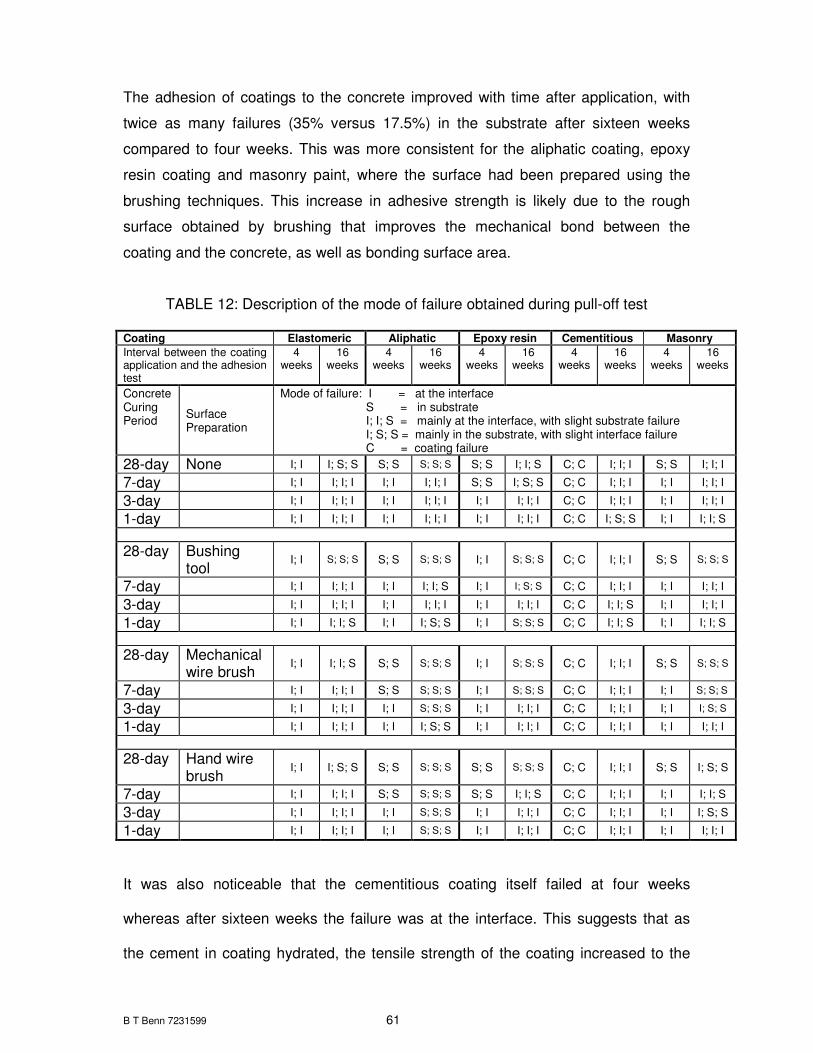
B T Benn 7231599 61
The adhesion of coatings to the concrete improved with time after application, with
twice as many failures (35% versus 17.5%) in the substrate after sixteen weeks
compared to four weeks. This was more consistent for the aliphatic coating, epoxy
resin coating and masonry paint, where the surface had been prepared using the
brushing techniques. This increase in adhesive strength is likely due to the rough
surface obtained by brushing that improves the mechanical bond between the
coating and the concrete, as well as bonding surface area.
TABLE 12: Description of the mode of failure obtained during pull-off test Coating Elastomeric Aliphatic Epoxy resin Cementitious Masonry
Interval between the coating application and the adhesion test
4 weeks
16 weeks
4 weeks
16 weeks
4 weeks
16 weeks
4 weeks
16 weeks
4 weeks
16 weeks
Concrete Curing Period
Surface Preparation
Mode of failure: I = at the interface S = in substrate I; I; S = mainly at the interface, with slight substrate failure I; S; S = mainly in the substrate, with slight interface failure C = coating failure
28-day None I; I I; S; S S; S S; S; S S; S I; I; S C; C I; I; I S; S I; I; I
7-day I; I I; I; I I; I I; I; I S; S I; S; S C; C I; I; I I; I I; I; I
3-day I; I I; I; I I; I I; I; I I; I I; I; I C; C I; I; I I; I I; I; I
1-day I; I I; I; I I; I I; I; I I; I I; I; I C; C I; S; S I; I I; I; S
28-day Bushing tool
I; I S; S; S S; S S; S; S I; I S; S; S C; C I; I; I S; S S; S; S
7-day I; I I; I; I I; I I; I; S I; I I; S; S C; C I; I; I I; I I; I; I
3-day I; I I; I; I I; I I; I; I I; I I; I; I C; C I; I; S I; I I; I; I
1-day I; I I; I; S I; I I; S; S I; I S; S; S C; C I; I; S I; I I; I; S
28-day Mechanical wire brush
I; I I; I; S S; S S; S; S I; I S; S; S C; C I; I; I S; S S; S; S
7-day I; I I; I; I S; S S; S; S I; I S; S; S C; C I; I; I I; I S; S; S
3-day I; I I; I; I I; I S; S; S I; I I; I; I C; C I; I; I I; I I; S; S
1-day I; I I; I; I I; I I; S; S I; I I; I; I C; C I; I; I I; I I; I; I
28-day Hand wire brush
I; I I; S; S S; S S; S; S S; S S; S; S C; C I; I; I S; S I; S; S
7-day I; I I; I; I S; S S; S; S S; S I; I; S C; C I; I; I I; I I; I; S
3-day I; I I; I; I I; I S; S; S I; I I; I; I C; C I; I; I I; I I; S; S
1-day I; I I; I; I I; I S; S; S I; I I; I; I C; C I; I; I I; I I; I; I
It was also noticeable that the cementitious coating itself failed at four weeks
whereas after sixteen weeks the failure was at the interface. This suggests that as
the cement in coating hydrated, the tensile strength of the coating increased to the
B T Benn 7231599 62
extent where it exceeded the adhesive strength between the coating and the
concrete surface.
4.7.3 Test Results
Each coating type has been analysed individually in the following sections along with
an overall assessment of the effect of the surface preparation on the different
coatings.
4.7.3.1 Elastomeric Coating
The results shown in Figure 32 indicate that in general, the bond strength increases
with time after application and as the moist curing period of the concrete was
extended. Where no preparation was applied, the bond strength of the elastomeric
coating to concrete substrates tends to plateau after 7 days of moist curing. This may
indicate that the quality of the laitance did not improve significantly after 7 days of
moist curing.
Where the bushing tool was used for preparing the surfaces there was a greater
increase in the adhesion strength with concrete that was moist cured for longer than
7 days. The wire brushing techniques generally tend to give the highest bond
strength, which may be the effect of removing near-surface laitance. The results
indicate that 60% of the bond strengths measured after four weeks and 80%
measured after sixteen weeks were equal to or greater than the 1500 kPa (1.5MPa).
However, the increase in adhesion strength at sixteen weeks was significantly
greater for the concrete that was subjected to less curing. This may have been
caused by the mechanical surface preparation more easily removing the “weaker”
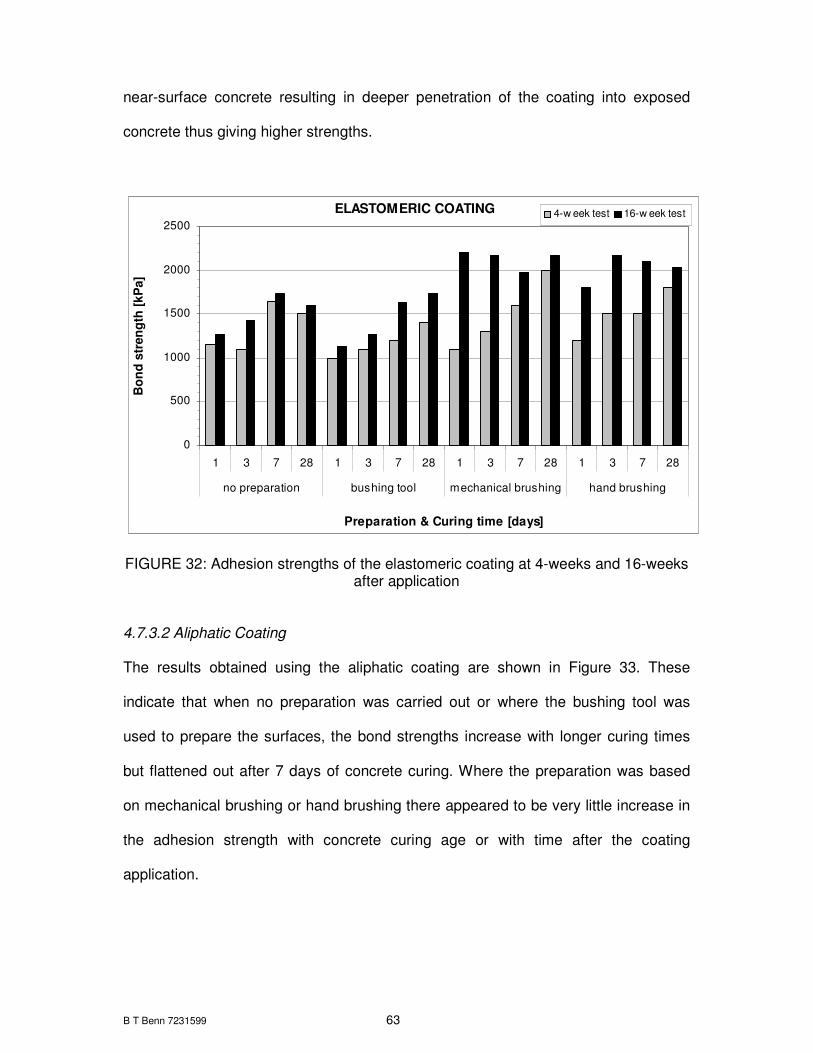
B T Benn 7231599 63
near-surface concrete resulting in deeper penetration of the coating into exposed
concrete thus giving higher strengths.
ELASTOMERIC COATING
0
500
1000
1500
2000
2500
1 3 7 28 1 3 7 28 1 3 7 28 1 3 7 28
no preparation bushing tool mechanical brushing hand brushing
Preparation & Curing time [days]
Bo
nd
str
en
gth
[kP
a]
4-w eek test 16-w eek test
FIGURE 32: Adhesion strengths of the elastomeric coating at 4-weeks and 16-weeks
after application
4.7.3.2 Aliphatic Coating
The results obtained using the aliphatic coating are shown in Figure 33. These
indicate that when no preparation was carried out or where the bushing tool was
used to prepare the surfaces, the bond strengths increase with longer curing times
but flattened out after 7 days of concrete curing. Where the preparation was based
on mechanical brushing or hand brushing there appeared to be very little increase in
the adhesion strength with concrete curing age or with time after the coating
application.
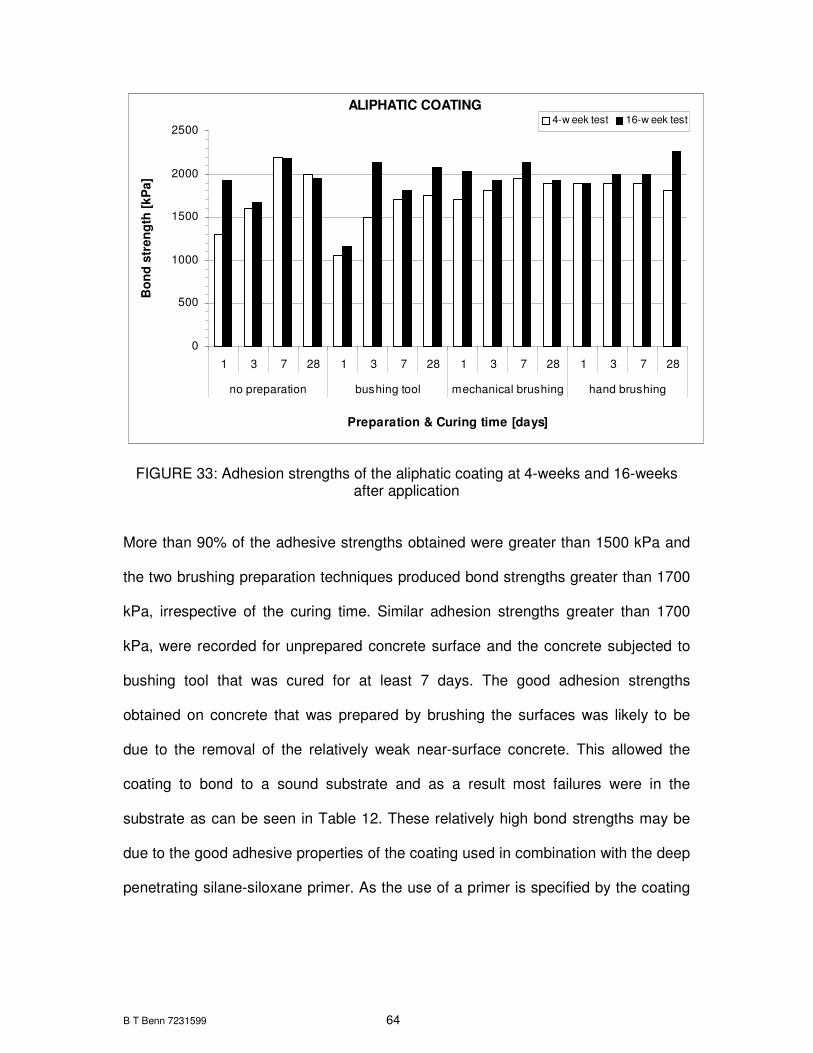
B T Benn 7231599 64
ALIPHATIC COATING
0
500
1000
1500
2000
2500
1 3 7 28 1 3 7 28 1 3 7 28 1 3 7 28
no preparation bushing tool mechanical brushing hand brushing
Preparation & Curing time [days]
Bo
nd
str
en
gth
[k
Pa
]
4-w eek test 16-w eek test
FIGURE 33: Adhesion strengths of the aliphatic coating at 4-weeks and 16-weeks
after application
More than 90% of the adhesive strengths obtained were greater than 1500 kPa and
the two brushing preparation techniques produced bond strengths greater than 1700
kPa, irrespective of the curing time. Similar adhesion strengths greater than 1700
kPa, were recorded for unprepared concrete surface and the concrete subjected to
bushing tool that was cured for at least 7 days. The good adhesion strengths
obtained on concrete that was prepared by brushing the surfaces was likely to be
due to the removal of the relatively weak near-surface concrete. This allowed the
coating to bond to a sound substrate and as a result most failures were in the
substrate as can be seen in Table 12. These relatively high bond strengths may be
due to the good adhesive properties of the coating used in combination with the deep
penetrating silane-siloxane primer. As the use of a primer is specified by the coating

B T Benn 7231599 65
manufacturer the adhesion strength of the coating without a primer was not
considered as part of this study.
4.7.3.3 Epoxy Resin Based Coating
The adhesion strengths of the epoxy resin coating are depicted in Figure 34 and
show that when measured four weeks after application, the strengths did not
increase with moist curing time and showed no obvious trend. However after sixteen
weeks the bond strength improved with increasing curing time although sometimes, it
was lower on the specimen cured for 28 days. This may be related to easier
penetration of the coating into the pores of the concrete cured for 7 days or less
compared to tighter pore structure of 28 day concrete. When tested at four weeks,
the bond strengths between the epoxy resin and the concrete surface prepared with
the bushing tool were similar regardless of the curing time.
EPOXY RESIN COATING
0
500
1000
1500
2000
2500
3000
1 3 7 28 1 3 7 28 1 3 7 28 1 3 7 28
no preparation bushing tool mechanical brushing hand brushing
Preparation & Curing time [days]
Bo
nd
str
en
gth
[kP
a]
4-w eek test 16-w eek test
FIGURE 34: Adhesion strengths of the epoxy resin based coating at 4-weeks and 16-weeks after application

B T Benn 7231599 66
However, the strengths tend to increase linearly when tested at sixteen weeks. The
results obtained from samples prepared by both mechanical and hand wire brushing
did not show a clear trend of increase in bond strength with curing time of concrete.
The 16-week results were higher than the 4-week results, except for the hand
brushed sample moist cured for 1-day. The erratic results may be due to
inconsistencies in the preparation that may have removed varying amounts of the
near-surface concrete. In general, bond strengths greater than 1500 kPa were
obtained sixteen weeks after application for all ages of concrete and with all the
different surface preparations. This is due to the slow but good adhesion properties
of the epoxy type materials.
4.7.3.4 Cementitious Based Coating
The thickness of this coating was considerably greater than the other coating
materials and it was evident that this had an affect on the mode of failure of the test
results four weeks after application as all the failures occurred within the coating
itself. Table 12 does indicate that after sixteen weeks however, the failure tended to
occur at the interface between concrete and the coating. The bond strengths
obtained after four weeks, shown in Figure 35, were within a fairly narrow range of
1350 kPa to 1850 kPa for all methods of preparation. One sample prepared by hand
brushing the surface reached a strength of 2600 kPa. However, this result appears
anomalous as the 16-week result was not correspondingly higher.
At sixteen weeks after application, the adhesive strengths are generally higher than
the 4-week strengths indicating that the internal tensile strength of the coating had
increased such that it exceeded the bond strength. The adhesion of the coating to

B T Benn 7231599 67
those surfaces prepared with the bushing tool were lower at sixteen weeks than at
four weeks, the reason was not clear as the mode of failure was at the interface and
did not appear to be related to a substrate failure. Neither the surface preparation nor
the curing regime had a significant effect on the results, with 84% of the results
exceeding 1500 kPa, it could be argued these aspects might not be that critical when
using a cementitious based coating. Based on the results obtained with this material,
it may have been better to test this coating using the techniques describe by
Silwerbrand [13] and Hindo [22] but this was outside the scope of the investigation.
The technique involves drilling a core through the repair mortar into the substrate to a
depth of about 50 mm. A steel plate of the same diameter as the core is then glued to
the mortar. Once the epoxy glue has cured an adjustable loading device is placed
and levelled over the test area and an axial tensile force is applied until failure
occurs. The stress is calculated and the mode of failure recorded.
CEMENTITIOUS COATING
0
500
1000
1500
2000
2500
3000
1 3 7 28 1 3 7 28 1 3 7 28 1 3 7 28
no preparation bushing tool mechanical brushing hand brushing
Preparation & Curing time [days]
Bo
nd
str
en
gth
[k
Pa
]
4-w eek test 16-w eek test
FIGURE 35: Adhesion strengths of the cementitious based coating at 4-weeks and
16-weeks after application

B T Benn 7231599 68
4.7.3.5 Masonry Paint
Results obtained when using the ordinary paint are shown in Figure 36. The results
indicate that the adhesion to the wire brushed surfaces was better than that on the
other surfaces at both test ages. More than 75% of the bond strengths were greater
than 1500 kPa on the brushed surfaces compared to 50% or less for the other
surface preparations. The bond strengths increased with moist curing when tested at
four weeks and sixteen weeks, however the 16-week result for one 28-day moist
cured sample, was marginally lower than the 4-week test result. This may indicate
inconsistent preparation as both failures occurred at the interface. The surfaces
prepared with the bushing tool were actually too rough to obtain an even coating or
good seating of the adhesion stud.
MASONRY PAINT
0
500
1000
1500
2000
2500
1 3 7 28 1 3 7 28 1 3 7 28 1 3 7 28
no preparation bushing tool mechanical brushing hand brushing
Preparation & Curing time [days]
Bo
nd
str
en
gth
[k
Pa
]
4-w eek test 16-w eek test
FIGURE 36: Adhesion strengths of the masonry paint at 4-weeks and 16-weeks after
application

B T Benn 7231599 69
However, when no preparation was carried out and where a very rough finish was
obtained with the bushing tool, the moist curing time did not significantly affect the
bond strength. In general, when using the masonry paint, the duration of the moist
curing did not appear to affect the strength of adhesion but the bond strength is
generally less than when using propriety protective coating materials. Not
withstanding the latter, the bond strength did improve with the age after the
application of the coating and it was evident that the greatest improvement was
where there was no surface preparation.
4.7.4 Effect of Surface Preparation
To assess the effect of the surface preparation on the adhesion of the various
coatings the minimum adhesion strength of 1500 kPa (1.5 MPa) as suggested by
Peier [11] was used to establish which coating performed best irrespective of the
preparation technique employed. In addition, a more conservative but arbitrarily
selected minimum bond strength of 1750 kPa was also used to assess the coating
performance. As can be deduced from Table 13, the aliphatic, cementitious based
and epoxy resin based coatings performed better than the other two coatings when
the minimum was set at 1500 kPa and the tests were carried out at four weeks.
When the testing was carried out at sixteen weeks, all of the coatings gave
satisfactory bond strengths. If the more conservative approach were to be adopted,
with a minimum requirement of 1750 kPa, the aliphatic coating was better than the
other coating materials at four weeks. There was no significant difference between
the aliphatic coating, the epoxy resin and the cementitious-based coating when
tested at sixteen weeks but these materials performed better than the elastomeric
coating and the masonry paint.
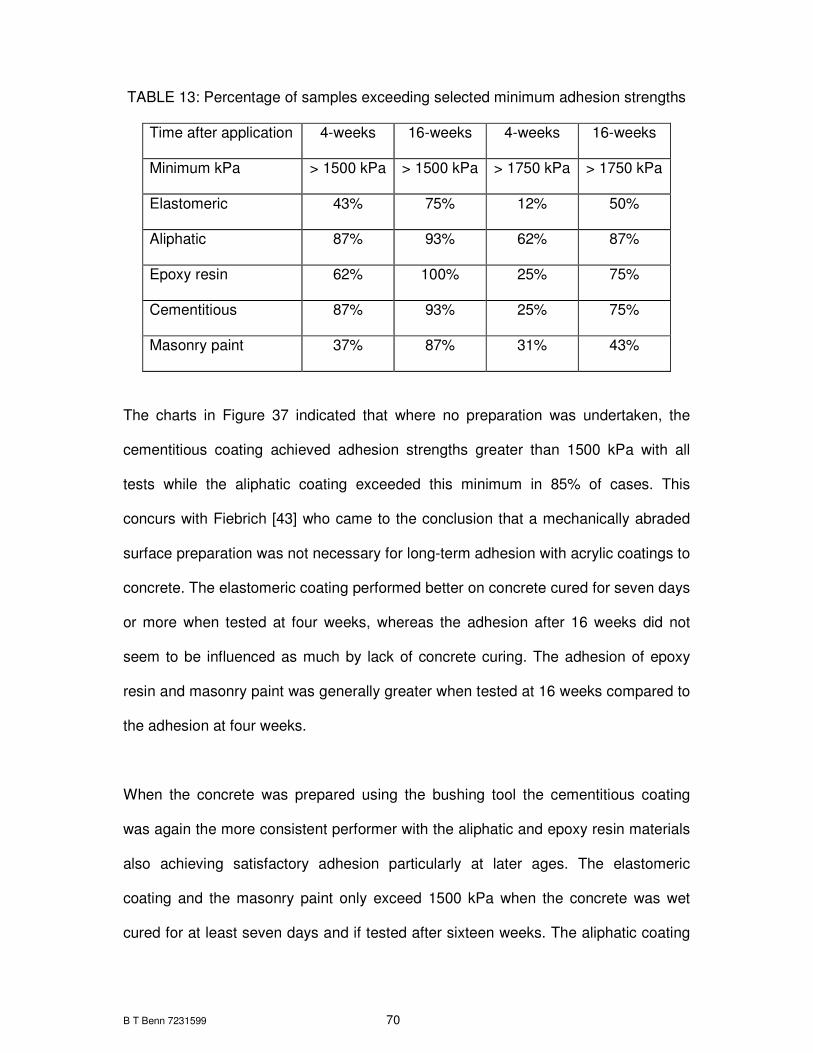
B T Benn 7231599 70
TABLE 13: Percentage of samples exceeding selected minimum adhesion strengths
Time after application 4-weeks 16-weeks 4-weeks 16-weeks
Minimum kPa > 1500 kPa > 1500 kPa > 1750 kPa > 1750 kPa
Elastomeric 43% 75% 12% 50%
Aliphatic 87% 93% 62% 87%
Epoxy resin 62% 100% 25% 75%
Cementitious 87% 93% 25% 75%
Masonry paint 37% 87% 31% 43%
The charts in Figure 37 indicated that where no preparation was undertaken, the
cementitious coating achieved adhesion strengths greater than 1500 kPa with all
tests while the aliphatic coating exceeded this minimum in 85% of cases. This
concurs with Fiebrich [43] who came to the conclusion that a mechanically abraded
surface preparation was not necessary for long-term adhesion with acrylic coatings to
concrete. The elastomeric coating performed better on concrete cured for seven days
or more when tested at four weeks, whereas the adhesion after 16 weeks did not
seem to be influenced as much by lack of concrete curing. The adhesion of epoxy
resin and masonry paint was generally greater when tested at 16 weeks compared to
the adhesion at four weeks.
When the concrete was prepared using the bushing tool the cementitious coating
was again the more consistent performer with the aliphatic and epoxy resin materials
also achieving satisfactory adhesion particularly at later ages. The elastomeric
coating and the masonry paint only exceed 1500 kPa when the concrete was wet
cured for at least seven days and if tested after sixteen weeks. The aliphatic coating
B T Benn 7231599 71
exceeded the minimum of 1500 kPa irrespective of the moist curing period if the
surface was prepared by means of mechanical brushing. With this preparation
technique the cementitious based coating and the epoxy resin material also achieved
bond strengths in excess of 1500 kPa in more than 85% of cases. The elastomeric
coating and masonry paint only exceeded the 1500 kPa requirement when applied to
concrete moist cured for at least seven days or when tested sixteen weeks after
application. By applying a light preparation, using the hand brushing technique on the
surfaces, all the coating materials exceeded 1500 kPa when tested sixteen weeks
after application.
The aliphatic and epoxy resin materials performed well when tested at four weeks
while the elastomeric coating and masonry paint achieved satisfactory strengths
when used on concrete cured for at least three days. The adhesion strengths of the
cementitious based coating were difficult to assess when tested at four weeks.
Although the results were all of the order of 1500 kPa, the failures had occurred in
the coating itself. In some respects, this could be considered to be an advantage as
despite being damaged, there was still coating material adhering to the concrete
surface that would provide some degree of protection.

B T Benn 7231599 72
FIGURE 37: Graphical comparison of surface preparations and bond strengths
NO PREPARATION
0
500
1000
1500
2000
2500
4 16 4 16 4 16 4 16 4 16
Elastomeric A liphatic Epoxy tar Cementitious Masonry paint
Coating & Adhe s ion tim e [w e e k s ]
Bo
nd
str
en
gth
[kP
a]
1-day 3-days 7-days 28-days
BUSHING TOOL
0
500
1000
1500
2000
2500
4 16 4 16 4 16 4 16 4 16
Elastomeric A liphatic Epoxy tar Cementitious Masonry paint
Coating & Adhe s ion tim e [w e e k s ]
Bo
nd
str
en
gth
[kP
a]
1-day 3-days 7-days 28-days
MECHANICAL BRUSHING
0
500
1000
1500
2000
2500
4 16 4 16 4 16 4 16 4 16
Elastomeric A liphatic Epoxy tar Cementitious Masonry paint
Coating & Adhe s ion tim e [w e e k s ]
Bo
nd
str
en
gth
[kP
a]
1-day 3-days 7-days 28-days
HAND BRUSHING
0
500
1000
1500
2000
2500
3000
4 16 4 16 4 16 4 16 4 16
Elastomeric A liphatic Epoxy tar Cementitious Masonry paint
Coating & Adhe s ion tim e [w e e k s ]
Bo
nd
str
en
gth
[kP
a]
1-day 3-days 7-days 28-days
B T Benn 7231599 73
4.8 General Discussion
While being mindful of the small range of coatings assessed in this investigation, the
following comments relate to the relative performance of the coatings:
• On unprepared surfaces or where the preparation produced a very uneven
surface, the aliphatic, cementitious and epoxy resin materials gave the best
adhesion irrespective of the quality of the near-surface concrete induced by the
curing regime. This indicated that even on poor quality concrete surfaces induced
by only one day of moist curing these coating could still be considered
appropriate when long term protection is required.
• Preparation based on the wire brush techniques, consistently gave a better bond
strength irrespective of the type of coating material used.
• With coatings applied in conjunction with specified primers the coating and primer
act as a monolithic material. Any adhesion failures will take place at the
concrete/primer interface because the chemical bond between the primer and
coating is stronger than the physical bond between the substrate and the
monolithic primer/coating material.
A failure will occur at the weakest section of the coating/concrete interface and in the
literature review three type of failure [10] were described:
1. If an interface failure is obtained the bond strength can be defined as the failure
strength,
2. If the failure is in the substrate then the bond strength is greater than the tensile
strength of that section of the substrate,
3. If the failure is partly in the interface and partly in the substrate, it is more difficult
to interpret, with the bond strength likely to be greater than the strength obtained
with interface failure but less than the strength achieved with substrate failure.
B T Benn 7231599 74
Chapter 5: CONCLUSIONS AND RECOMMENDATIONS
• Coating adhesion strength generally improves with improved quality of the host
concrete surface. This is best achieved through good quality curing of the
concrete although there is only a marginal improvement in adhesion strength if
the concrete is cured for longer than seven days.
• Mechanical brushing and manual brushing gave a surface texture, which resulted
in the best coating adhesion for all the coatings used. This was mainly due to the
even but rough surface that was obtained once the surface laitance had been
removed.
• A microscopic examination of samples obtained from the prepared surfaces
showed that heavy impact preparation causes microstructural damage in the
prepared near-surface and this affects applied coatings.
• The aliphatic coating, cementitious based coating and epoxy resin type coating
showed the best adhesion properties even to poor quality concrete surfaces. The
cementitious material failed within the coating itself when tested four weeks after
application and at the interface at sixteen weeks.
• The bond strengths obtained during this investigation, in conjunction with results
reported in published literature, indicate that minimum strength of 1500 kPa is
appropriate in most situations.

B T Benn 7231599 75
RECOMMENDATIONS FOR FURTHER WORK
• More extensive comparative testing using the water-sorptivity test should be
carried on actual structures.
• Tests using the Elcometer Adhesion Tester should be carried out on actual
structures during the rehabilitation of such structures.
• Research on the quality of surface preparation is essential to be able to specify
quantitatively the expected performance.
B T Benn 7231599 76
REFERENCES
1. Concrete Society. Guide to surface treatments for protection and
enhancements of concrete. Technical Report No.50. The Concrete Society,
UK, 1997.
2. ASTM, D5295-92, Standard Guide for Preparation of Concrete Surfaces for
Adhered (Bonded) Membrane Waterproofing Systems, Annual Book of ASTM
Standards, Vol. 04.04, Philadelphia, 1992.
3. Smith G., Private Communications, abe-Fosroc (Pty) Ltd, 1998.
4. Wylde M., Private Communications, Sika (Pty) Ltd., 1998
5. Judge A.I. Cheriton L.W. Lamb R.W., Bonding systems for concrete repair –
an assessment of commonly used materials, RILEM: International Symposium
on Adhesion between Polymers and Concrete, Paris, 1986, pp 661 - 681.
6. Bundies F.J., Adhesion of modern barrier coats on concrete motorway bridges
and troughs under tarmac. RILEM: International Symposium on Adhesion
between Polymers and Concrete, Paris, 1986, pp 144 - 151.
7. ISAP 86, Adhesion between polymers and concrete, Proceedings of
International RILEM symposium, Aix-en-Provence, 1986, edited by H.R.
Sasse, Chapman and Hall, London, 1986.
8. ISAP 99 Adhesion between polymers and concrete, Proceedings of the
Second International RILEM Symposium, Dresden, Germany, 1999, edited by
Y. Ohama and M. Puterman, RILEM Publications, France.
9. Gaul, Robert W., Preparing concrete surfaces for coating, Concrete
International: Design & Construction, Vol. 6, No. 7, July 1984, pp 17 - 22.

B T Benn 7231599 77
10. Cardon A.H. and Hiel C.C., Durability analysis of adhesive joints, RILEM:
International Symposium on Adhesion between polymers and concrete, Paris,
1986, pp 3 - 7.
11. Peier W.H., Adhesion testing of polymer modified cement mortars, RILEM:
International Symposium on Adhesion between polymers and concrete, Paris,
1986, pp 730 - 740.
12. Ohama Y., Demura K., Nagao H, Ogi T., Adhesion of polymer-modified
mortars to ordinary cement mortars by different test methods, RILEM:
International Symposium on Adhesion between polymers and concrete, Paris,
1986, pp 719 - 729.
13. Silfwerbrand J., Improving Concrete Bond in Repaired Bridge Decks, Concrete
International, Volume 12, Issue 9, September 1990, pp 61 – 66.
14. Mouton Yves, Some thoughts about gluing and its applications in construction.
RILEM: Second International Symposium on Adhesion between polymers and
concrete, Dresden, 1999, pp 5 - 7.
15. Gűnter M., The blister-test to determine the bond strength between polymer
coatings and concrete. RILEM: Second International Symposium on Adhesion
between polymers and concrete, Dresden, 1999, pp 21 - 33.
16. Courard L., How to analyse thermodynamic properties of solids and liquids in
relation with adhesion. RILEM: Second International Symposium on Adhesion
between polymers and concrete, Dresden, 1999, pp 9 - 19.
17. Bundies F.J., 2-Component coatings on concrete: Some physical and
chemical aspects of adhesion. RILEM: Second International Symposium on
Adhesion between polymers and concrete, Dresden, 1999, pp 181 - 192.

B T Benn 7231599 78
18. International Concrete Repair Institute, No. 03733 Guide for Selecting and
Specifying Concrete Repair Materials, Illinois, 1997.
19. Gunter M. and Hilsdorf H.K., Stresses due to physical and chemical actions in
polymer coatings on a concrete substrate, RILEM: International Symposium
on Adhesion between polymers and concrete, Paris, 1986, pp 8 - 21.
20. Littmann K., Influences on the adhesion quality of epoxy coatings on concrete.
RILEM: Second International Symposium on Adhesion between polymers and
concrete, Dresden, 1999, pp 193 - 202.
21. Cleland D.J., Naderi M., Long A.E., Bond strength of patch repair mortars for
concrete, RILEM: International Symposium on Adhesion between polymers
and concrete, Paris, 1986, pp 235 - 241.
22. Hindo, Kal R., In-Place Bond Testing and Surface Preparation of Concrete,
Concrete International, Volume 12, Issue 4, April 1990, pp 46 – 48.
23. ASTM, D4263-83 (93); Test Method for Indicating Moisture in Concrete by
Plastic Sheet Method, Annual Book of ASTM Standards, Vol. 06.02,
Philadelphia, 1993.
24. AAC15.1 Determination of the Adhesion of Mortars and other Surface
Coatings, RILEM: Technical recommendations for the Testing and use of
Construction Materials, 1992.
25. Oba K., Partl M.N., Hean S., In-situ testing of adhesion between polymer-
modified bituminous waterproofing membranes and concrete. RILEM: Second
International Symposium on Adhesion between polymers and concrete,
Dresden, 1999, pp 185 - 197.
B T Benn 7231599 79
26. Naderi M., Cleland D., Long A.E., Insitu test methods for repaired concrete
structures, RILEM: International Symposium on Adhesion between polymers
and concrete, Paris, 1986, pp 707 - 718.
27. ACI Committee 503, Standard Specification for Repairing Concrete with Epoxy
Mortar, (ACI 503.4 – 79), American Concrete Institute, Detroit, 1979.
28. Bordado J., Adhesion versus impregnation - binding to concrete. RILEM:
Second International Symposium on Adhesion between polymers and
concrete, Dresden, 1999, pp 205 - 210.
29. Sasse H.R., Stenner R., Adhesion and the new series of European standards
on protection and repair of concrete structures. RILEM: Second International
Symposium on Adhesion between polymers and concrete, Dresden, 1999,
pp 485 - 494.
30. ENV 1504, Parts 1 to 10, Products and Systems for the Protection and Repair
of Concrete Structures, 1997 to 2000.
31. Cement: Standards and Selection, Cement & Concrete Institute, Midrand,
1996.
32. New Cement Products, Concor Group Laboratory, Concor Construction Ltd,
Crown Industria, Johannesburg, August 1997.
33. SABS Method 1245:1994, Concrete tests – density of compacted freshly-
mixed concrete, Pretoria: South African Bureau of Standards, 1994.
34. SABS Method 862-1:1994, Concrete tests – consistency of freshly-mixed
concrete - slump test, Pretoria: South African Bureau of Standards, 1994.
35. SABS Method 863:1994, Compressive strength of concrete (including making
and curing of the test cubes), Pretoria: South African Bureau of Standards,
1994.
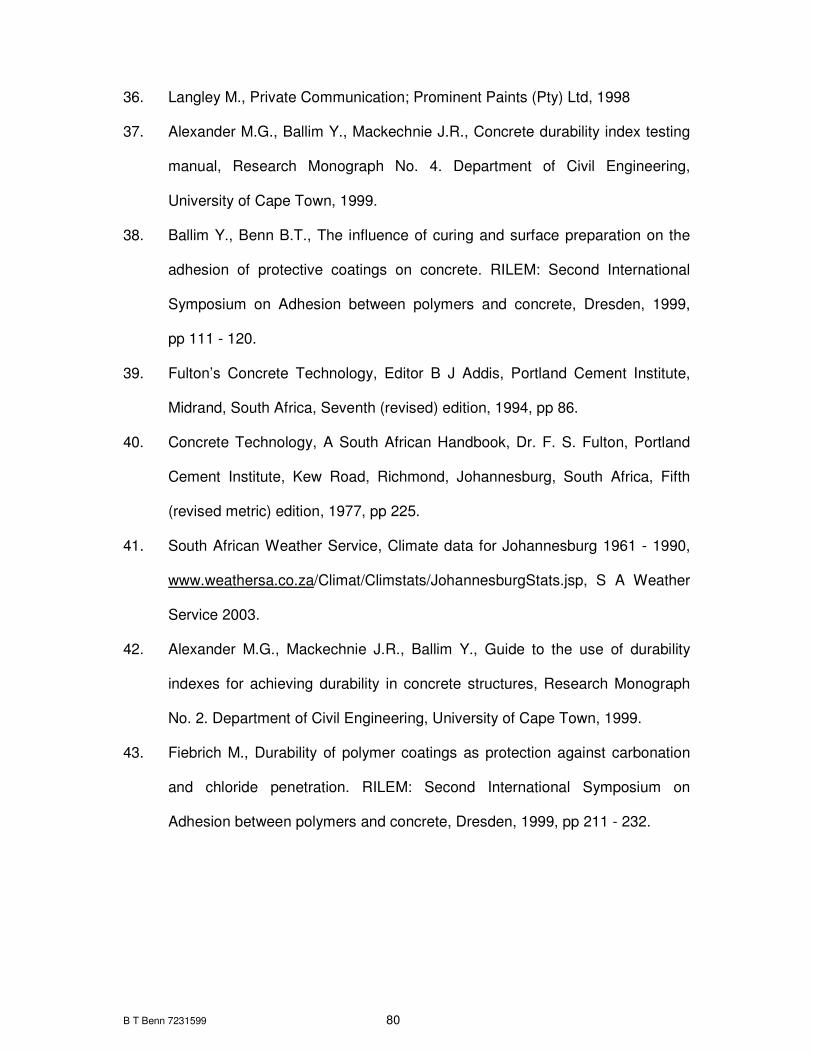
B T Benn 7231599 80
36. Langley M., Private Communication; Prominent Paints (Pty) Ltd, 1998
37. Alexander M.G., Ballim Y., Mackechnie J.R., Concrete durability index testing
manual, Research Monograph No. 4. Department of Civil Engineering,
University of Cape Town, 1999.
38. Ballim Y., Benn B.T., The influence of curing and surface preparation on the
adhesion of protective coatings on concrete. RILEM: Second International
Symposium on Adhesion between polymers and concrete, Dresden, 1999,
pp 111 - 120.
39. Fulton’s Concrete Technology, Editor B J Addis, Portland Cement Institute,
Midrand, South Africa, Seventh (revised) edition, 1994, pp 86.
40. Concrete Technology, A South African Handbook, Dr. F. S. Fulton, Portland
Cement Institute, Kew Road, Richmond, Johannesburg, South Africa, Fifth
(revised metric) edition, 1977, pp 225.
41. South African Weather Service, Climate data for Johannesburg 1961 - 1990,
www.weathersa.co.za/Climat/Climstats/JohannesburgStats.jsp, S A Weather
Service 2003.
42. Alexander M.G., Mackechnie J.R., Ballim Y., Guide to the use of durability
indexes for achieving durability in concrete structures, Research Monograph
No. 2. Department of Civil Engineering, University of Cape Town, 1999.
43. Fiebrich M., Durability of polymer coatings as protection against carbonation
and chloride penetration. RILEM: Second International Symposium on
Adhesion between polymers and concrete, Dresden, 1999, pp 211 - 232.

B T Benn 7231599 81
BIBLIOGRAPHY
1. ISAP 86. Adhesion between Polymers and Concrete, bonding · protection · repair,
Proceedings of an international symposium organized by RILEM Technical
Committee 52-Resin Adherence to Concrete and Laboratorie Central des Ponts
et Chaussées, Paris September 16 – 19 1986. Editor H.R. Sasse. Chapman and
Hall, London, 1986.
2. PRO 9. Adhesion between Polymers and Concrete. Proceedings of the Second
International RILEM Symposium, Dresden, Germany, 14 - 17 September 1999,
edited by Y. Ohama and M. Puterman, (RILEM publications, France, 2002).
3. Concrete Society Technical Report 50, Guide to surface treatments for the
protection and enhancement of concrete. Report of a Concrete Society Working
Party, Concrete Society, Slough, 1997.
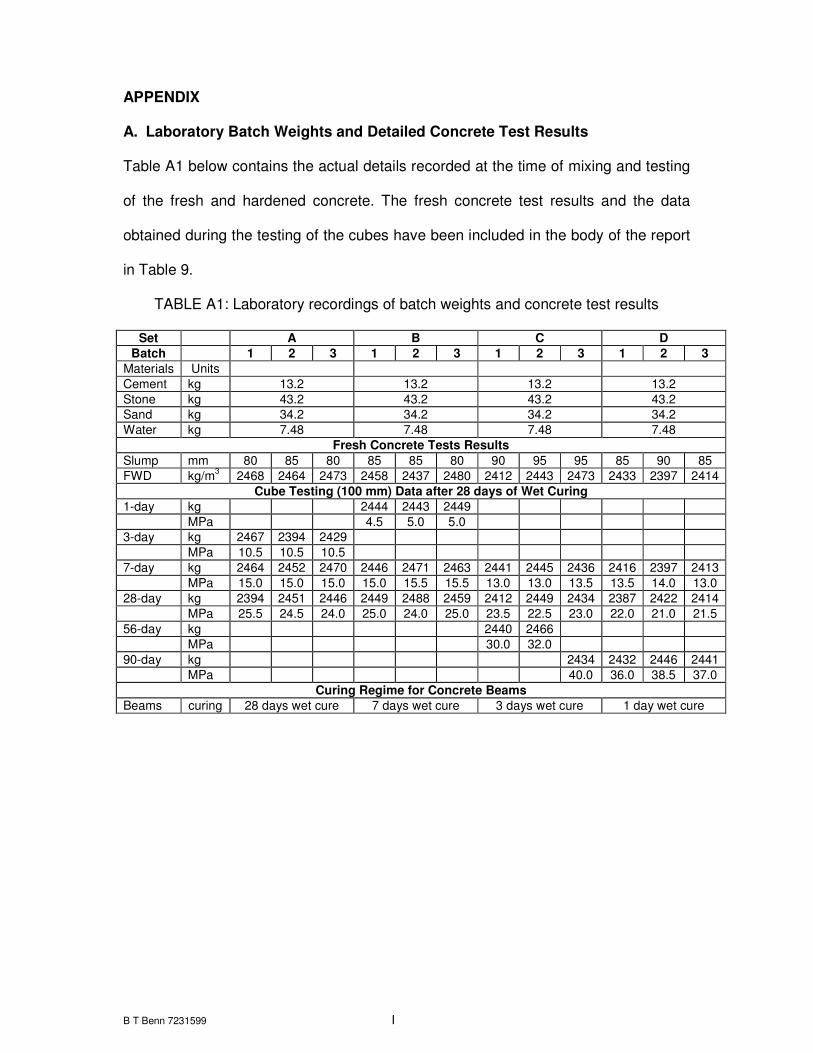
B T Benn 7231599 I
APPENDIX
A. Laboratory Batch Weights and Detailed Concrete Test Results
Table A1 below contains the actual details recorded at the time of mixing and testing
of the fresh and hardened concrete. The fresh concrete test results and the data
obtained during the testing of the cubes have been included in the body of the report
in Table 9.
TABLE A1: Laboratory recordings of batch weights and concrete test results
Set A B C D
Batch 1 2 3 1 2 3 1 2 3 1 2 3
Materials Units
Cement kg 13.2 13.2 13.2 13.2
Stone kg 43.2 43.2 43.2 43.2
Sand kg 34.2 34.2 34.2 34.2
Water kg 7.48 7.48 7.48 7.48
Fresh Concrete Tests Results
Slump mm 80 85 80 85 85 80 90 95 95 85 90 85
FWD kg/m3 2468 2464 2473 2458 2437 2480 2412 2443 2473 2433 2397 2414
Cube Testing (100 mm) Data after 28 days of Wet Curing
1-day kg 2444 2443 2449
MPa 4.5 5.0 5.0
3-day kg 2467 2394 2429
MPa 10.5 10.5 10.5
7-day kg 2464 2452 2470 2446 2471 2463 2441 2445 2436 2416 2397 2413
MPa 15.0 15.0 15.0 15.0 15.5 15.5 13.0 13.0 13.5 13.5 14.0 13.0
28-day kg 2394 2451 2446 2449 2488 2459 2412 2449 2434 2387 2422 2414
MPa 25.5 24.5 24.0 25.0 24.0 25.0 23.5 22.5 23.0 22.0 21.0 21.5
56-day kg 2440 2466
MPa 30.0 32.0
90-day kg 2434 2432 2446 2441
MPa 40.0 36.0 38.5 37.0
Curing Regime for Concrete Beams
Beams curing 28 days wet cure 7 days wet cure 3 days wet cure 1 day wet cure

B T Benn 7231599 II
B. Analysis of slump difference
Figure B1 below was used to assess if the average slump of Set C was possibly due
to additional water added by mistake to the concrete during mixing. The interpolation
at the intersection of the dotted lines indicates how much additional water would
possibly be required to alter the slump from 85 mm to 95 mm. As explained in more
detail in the body of the report, Section 4.2.2, this does not seem to be the reason for
the increase in slump.
Figure B1: Change in water content required to change the slump [40]
95
85
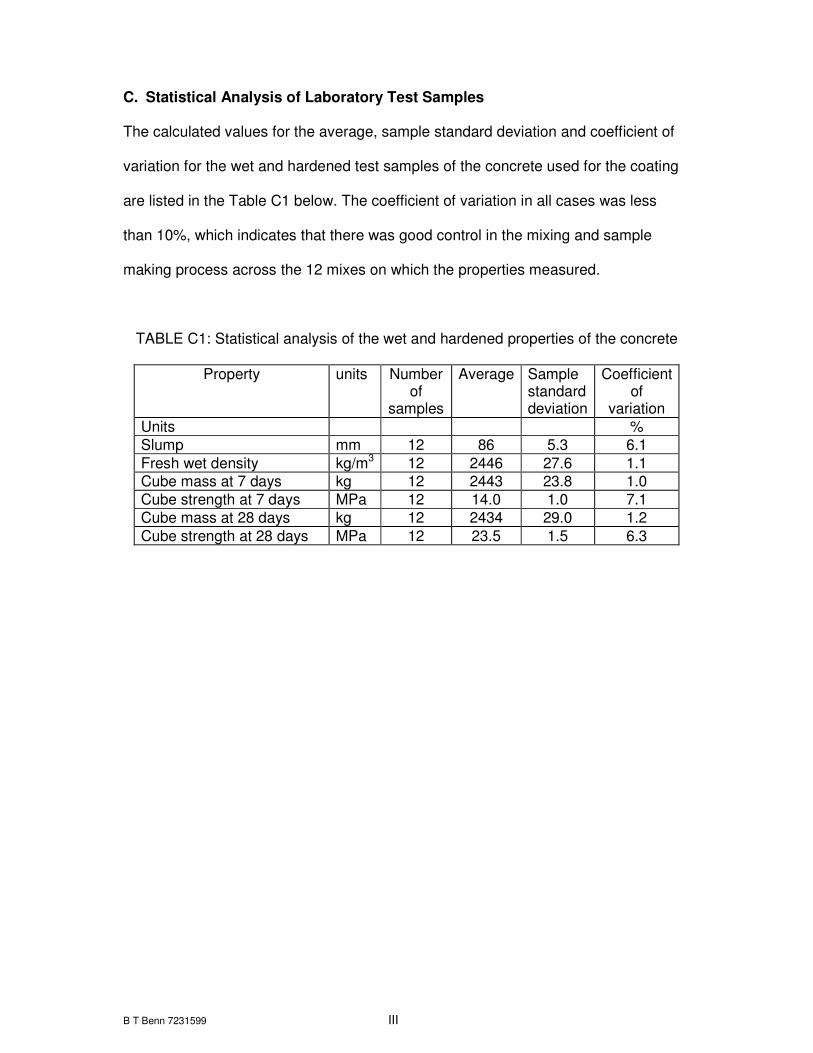
B T Benn 7231599 III
C. Statistical Analysis of Laboratory Test Samples
The calculated values for the average, sample standard deviation and coefficient of
variation for the wet and hardened test samples of the concrete used for the coating
are listed in the Table C1 below. The coefficient of variation in all cases was less
than 10%, which indicates that there was good control in the mixing and sample
making process across the 12 mixes on which the properties measured.
TABLE C1: Statistical analysis of the wet and hardened properties of the concrete
Property units Number of
samples
Average Sample standard deviation
Coefficient of
variation
Units %
Slump mm 12 86 5.3 6.1
Fresh wet density kg/m3 12 2446 27.6 1.1
Cube mass at 7 days kg 12 2443 23.8 1.0
Cube strength at 7 days MPa 12 14.0 1.0 7.1
Cube mass at 28 days kg 12 2434 29.0 1.2
Cube strength at 28 days MPa 12 23.5 1.5 6.3

B T Benn 7231599 IV
D. Water Sorptivity Calculations
The calculations and regression analysis of the water-sorptivity results are detailed
below from Page V to Page XX inclusive. These pages indicate the calculated
sorptivity values as well as the correlation coefficient [R2]. These values have been
calculated at both t12 and t20 time intervals and the sorptivity value used to assess the
quality of the near surface concrete is the value that had the highest [R2] as in some
case it was evident from the chart that some of the samples had partial saturation by
the end of the test. The Charts show typical graphs of the regression analysis and
the sorptivity curves are plotted as “square root of time” against “water absorption” for
calculated values with the highest [R2] value. The abbreviations used in these tables
are:
• None = no preparation was carried out
• MWB = Mechanical wire brush preparation
• HB = Hand brush preparation
• BT = Bushing tool preparation

B T Benn 7231599 V
Sorptivity Calculations
Water – Sorptivity calculations on concrete cured for 28 days
Preparation none
Test date 12.04.99
Sample ID 1.3.3
Sample thickness [mm] d = 24.6
24.3
24.4
24.7
Average thickness [mm] d = 24.5
Oven dry mass [g] Mo = 527.67
Sat. wet mass [g] Msv = 555.31
Time [min] Mass [g] Time [hrs] Mass [g] Time [hrs] Mass [g]
t = Mst = √t = Mwt = √t = Mwt =
0 527.79
1 530.34 0.1 2.55 0.1 2.55
6 532.35 0.3 4.56 0.3 4.56
12 533.48 0.4 5.69 0.4 5.69
20 534.35 0.6 6.56
Slope [g/√hrs] F = 9.00 9.93
Sorptivity [mm/√hrs] S = 8.01 8.84
Correlation coefficient R2 = 0.988 0.996
where Mwt = Mst - Mso
where F = Mwt/√t
where S = (F.d)/(Msv - Mso)

B T Benn 7231599 VI
Water – Sorptivity calculations on concrete cured for 28 days
Preparation Mechanical Wire Brush
Test date 12.04.99
Sample ID 1.3.6
Sample thickness [mm] d = 25.5
25.3
25.2
25.3
Average thickness [mm] d = 25.3
Oven dry mass [g] Mo = 517.02
Sat. wet mass [g] Msv = 542.01
Time [min] Mass [g] Time [hrs] Mass [g] Time [hrs] Mass [g]
t = Mst = √t = Mwt = √t = Mwt =
0 517.15
1 519.48 0.1 2.33 0.1 2.33
6 521.45 0.3 4.30 0.3 4.30
12 522.52 0.4 5.37 0.4 5.37
20 523.46 0.6 6.31
Slope [g/√hrs] F = 8.89 9.62
Sorptivity [mm/√hrs] S = 9.06 9.80
Correlation coefficient R2 = 0.992 0.995
where Mwt = Mst - Mso
where F = Mwt/√t
where S = (F.d)/(Msv - Mso)

B T Benn 7231599 VII
Water – Sorptivity calculations on concrete cured for 28 days
Preparation Hand (Manual) Wire Brush
Test date 12.04.99
Sample ID 1.5.3
Sample thickness [mm] d = 23.9
25.3
24.7
24.6
Average thickness [mm] d = 24.6
Oven dry mass [g] Mo = 513.70
Sat. wet mass [g] Msv = 539.21
Time [min] Mass [g] Time [hrs] Mass [g] Time [hrs] Mass [g]
t = Mst = √t = Mwt = √t = Mwt =
0 513.79
1 516.10 0.1 2.31 0.1 2.31
6 518.32 0.3 4.53 0.3 4.53
12 519.37 0.4 5.58 0.4 5.58
20 520.24 0.6 6.45
Slope [g/√hrs] F = 9.25 10.39
Sorptivity [mm/√hrs] S = 8.96 10.06
Correlation coefficient R2 = 0.981 0.989
where Mwt = Mst - Mso
where F = Mwt/√t
where S = (F.d)/(Msv - Mso)
B T Benn 7231599 VIII
Water – Sorptivity calculations on concrete cured for 28 days
Preparation Bushing Tool
Test date 13.04.99
Sample ID 1.5.6
Sample thickness [mm] d = 25.4
25.5
24.4
25.1
Average thickness [mm] d = 25.1
Oven dry mass [g] Mo = 504.42
Sat. wet mass [g] Msv = 529.52
Time [min] Mass [g] Time [hrs] Mass [g] Time [hrs] Mass [g]
t = Mst = √t = Mwt = √t = Mwt =
0 504.48
1 507.35 0.1 2.87 0.1 2.87
6 508.68 0.3 4.20 0.3 4.20
12 509.62 0.4 5.14 0.4 5.14
20 510.22 0.6 5.74
Slope [g/√hrs] F = 6.51 7.13
Sorptivity [mm/√hrs] S = 6.53 7.15
Correlation coefficient R2 = 0.992 1.000
where Mwt = Mst - Mso
where F = Mwt/√t
where S = (F.d)/(Msv - Mso)
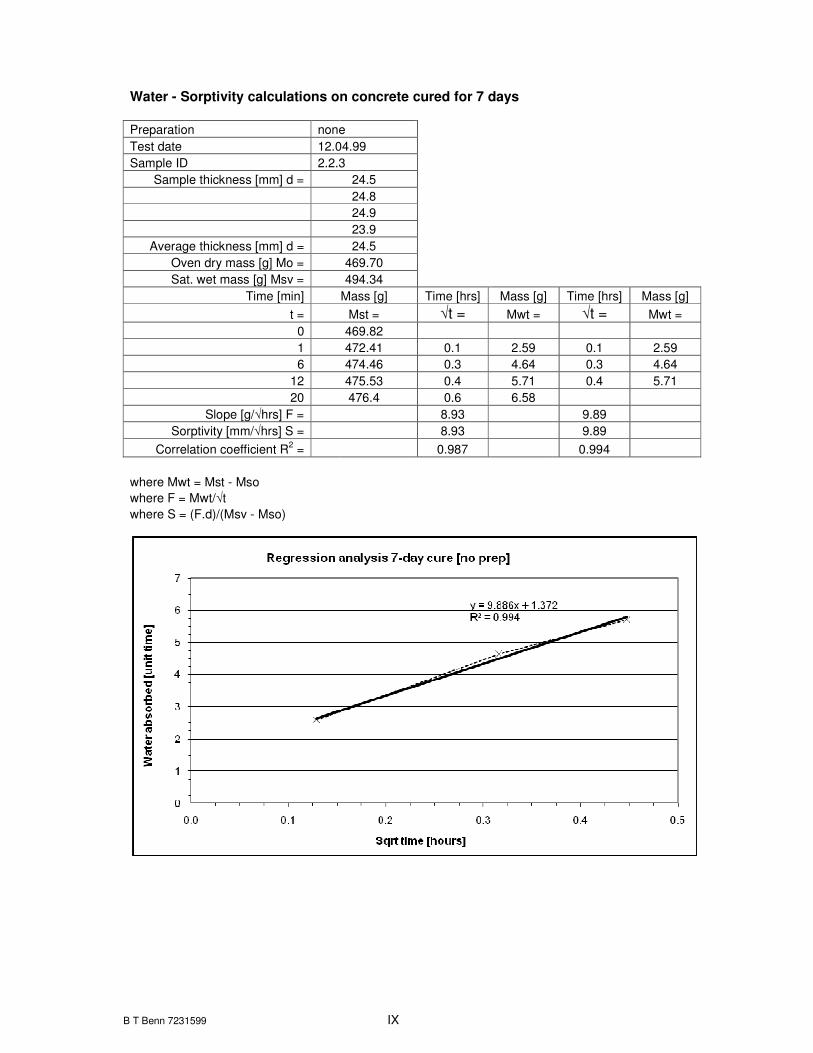
B T Benn 7231599 IX
Water - Sorptivity calculations on concrete cured for 7 days
Preparation none
Test date 12.04.99
Sample ID 2.2.3
Sample thickness [mm] d = 24.5
24.8
24.9
23.9
Average thickness [mm] d = 24.5
Oven dry mass [g] Mo = 469.70
Sat. wet mass [g] Msv = 494.34
Time [min] Mass [g] Time [hrs] Mass [g] Time [hrs] Mass [g]
t = Mst = √t = Mwt = √t = Mwt =
0 469.82
1 472.41 0.1 2.59 0.1 2.59
6 474.46 0.3 4.64 0.3 4.64
12 475.53 0.4 5.71 0.4 5.71
20 476.4 0.6 6.58
Slope [g/√hrs] F = 8.93 9.89
Sorptivity [mm/√hrs] S = 8.93 9.89
Correlation coefficient R2 = 0.987 0.994
where Mwt = Mst - Mso
where F = Mwt/√t
where S = (F.d)/(Msv - Mso)
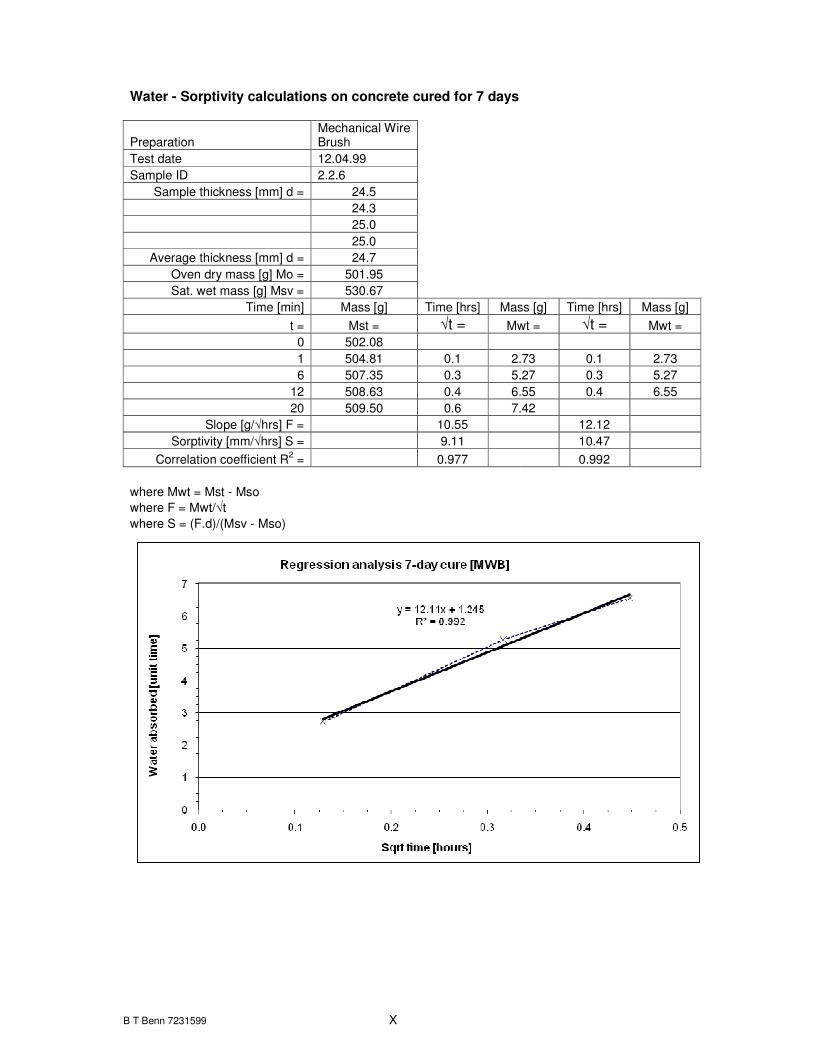
B T Benn 7231599 X
Water - Sorptivity calculations on concrete cured for 7 days
Preparation Mechanical Wire Brush
Test date 12.04.99
Sample ID 2.2.6
Sample thickness [mm] d = 24.5
24.3
25.0
25.0
Average thickness [mm] d = 24.7
Oven dry mass [g] Mo = 501.95
Sat. wet mass [g] Msv = 530.67
Time [min] Mass [g] Time [hrs] Mass [g] Time [hrs] Mass [g]
t = Mst = √t = Mwt = √t = Mwt =
0 502.08
1 504.81 0.1 2.73 0.1 2.73
6 507.35 0.3 5.27 0.3 5.27
12 508.63 0.4 6.55 0.4 6.55
20 509.50 0.6 7.42
Slope [g/√hrs] F = 10.55 12.12
Sorptivity [mm/√hrs] S = 9.11 10.47
Correlation coefficient R2 = 0.977 0.992
where Mwt = Mst - Mso
where F = Mwt/√t
where S = (F.d)/(Msv - Mso)

B T Benn 7231599 XI
Water - Sorptivity calculations on concrete cured for 7 days
Preparation Hand (Manual) Wire Brush
Test date 13.04.99
Sample ID 2.6.3
Sample thickness [mm] d = 25.1
25.1
24.8
25.1
Average thickness [mm] d = 25.0
Oven dry mass [g] Mo = 537.30
Sat. wet mass [g] Msv = 563.49
Time [min] Mass [g] Time [hrs] Mass [g] Time [hrs] Mass [g]
t = Mst = √t = Mwt = √t = Mwt =
0 537.41
1 541.18 0.1 3.77 0.1 3.77
6 543.72 0.3 6.31 0.3 6.31
12 545.01 0.4 7.60 0.4 7.60
20 545.82 0.6 8.41
Slope [g/√hrs] F = 10.46 12.14
Sorptivity [mm/√hrs] S = 10.04 11.65
Correlation coefficient R2 = 0.974 0.992
where Mwt = Mst - Mso
where F = Mwt/√t
where S = (F.d)/(Msv - Mso)
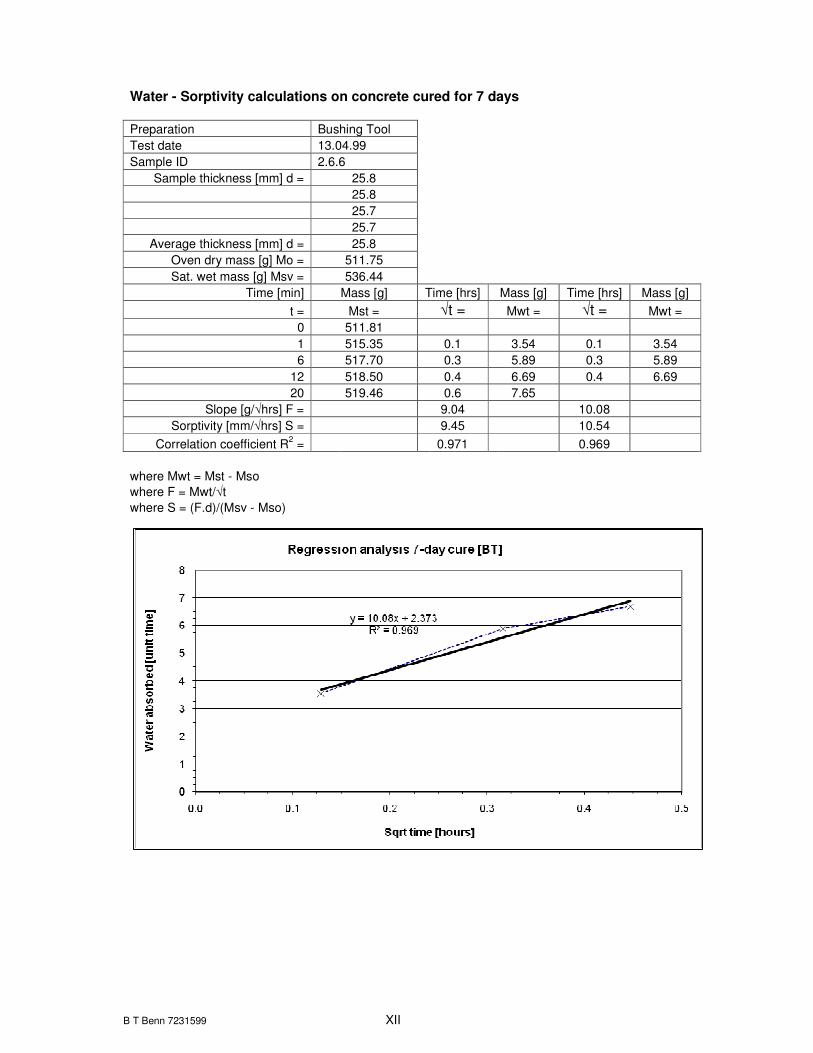
B T Benn 7231599 XII
Water - Sorptivity calculations on concrete cured for 7 days
Preparation Bushing Tool
Test date 13.04.99
Sample ID 2.6.6
Sample thickness [mm] d = 25.8
25.8
25.7
25.7
Average thickness [mm] d = 25.8
Oven dry mass [g] Mo = 511.75
Sat. wet mass [g] Msv = 536.44
Time [min] Mass [g] Time [hrs] Mass [g] Time [hrs] Mass [g]
t = Mst = √t = Mwt = √t = Mwt =
0 511.81
1 515.35 0.1 3.54 0.1 3.54
6 517.70 0.3 5.89 0.3 5.89
12 518.50 0.4 6.69 0.4 6.69
20 519.46 0.6 7.65
Slope [g/√hrs] F = 9.04 10.08
Sorptivity [mm/√hrs] S = 9.45 10.54
Correlation coefficient R2 = 0.971 0.969
where Mwt = Mst - Mso
where F = Mwt/√t
where S = (F.d)/(Msv - Mso)

B T Benn 7231599 XIII
Water - Sorptivity calculations on concrete cured for 3 days
Preparation none
Test date 12.04.99
Sample ID 3.3.3
Sample thickness [mm] d = 24.1
24.7
24.3
24.5
Average thickness [mm] d = 24.4
Oven dry mass [g] Mo = 506.30
Sat. wet mass [g] Msv = 533.33
Time [min] Mass [g] Time [hrs] Mass [g] Time [hrs] Mass [g]
t = Mst = √t = Mwt = √t = Mwt =
0 506.45
1 510.02 0.1 3.57 0.1 3.57
6 513.06 0.3 6.61 0.3 6.61
12 514.43 0.4 7.98 0.4 7.98
20 515.14 0.6 8.69
Slope [g/√hrs] F = 11.56 14.03
Sorptivity [mm/√hrs] S = 10.50 12.73
Correlation coefficient R2 = 0.954 0.987
where Mwt = Mst - Mso
where F = Mwt/√t
where S = (F.d)/(Msv - Mso)

B T Benn 7231599 XIV
Water - Sorptivity calculations on concrete cured for 3 days
Preparation Mechanical Wire Brush
Test date 12.04.99
Sample ID 3.3.6
Sample thickness [mm] d = 25.1
25.0
25.3
25.2
Average thickness [mm] d = 25.2
Oven dry mass [g] Mo = 501.09
Sat. wet mass [g] Msv = 527.98
Time [min] Mass [g] Time [hrs] Mass [g] Time [hrs] Mass [g]
t = Mst = √t = Mwt = √t = Mwt =
0 501.16
1 505.04 0.1 3.88 0.1 3.88
6 508.32 0.3 7.16 0.3 7.16
12 510.04 0.4 8.88 0.4 8.88
20 512.10 0.6 10.94
Slope [g/√hrs] F = 15.59 15.84
Sorptivity [mm/√hrs] S = 14.62 14.86
Correlation coefficient R2 = 0.996 0.994
where Mwt = Mst - Mso
where F = Mwt/√t
where S = (F.d)/(Msv - Mso)

B T Benn 7231599 XV
Water - Sorptivity calculations on concrete cured for 3 days
Preparation Hand (Manual) Wire Brush
Test date 13.04.99
Sample ID 3.4.3
Sample thickness [mm] d = 25.4
25.1
25.1
25.3
Average thickness [mm] d = 25.2
Oven dry mass [g] Mo = 496.64
Sat. wet mass [g] Msv = 521.21
Time [min] Mass [g] Time [hrs] Mass [g] Time [hrs] Mass [g]
t = Mst = √t = Mwt = √t = Mwt =
0 496.74
1 500.75 0.1 4.01 0.1 4.01
6 503.70 0.3 6.96 0.3 6.96
12 504.84 0.4 8.10 0.4 8.10
20 505.06 0.6 8.32
Slope [g/√hrs] F = 9.83 13.06
Sorptivity [mm/√hrs] S = 10.13 13.46
Correlation coefficient R2 = 0.899 0.978
where Mwt = Mst - Mso
where F = Mwt/√t
where S = (F.d)/(Msv - Mso)

B T Benn 7231599 XVI
Water - Sorptivity calculations on concrete cured for 3 days
Preparation Bushing Tool
Test date 13.04.99
Sample ID 3.4.6
Sample thickness [mm] d = 25.6
25.7
25.2
25.4
Average thickness [mm] d = 25.5
Oven dry mass [g] Mo = 488.61
Sat. wet mass [g] Msv = 516.56
Time [min] Mass [g] Time [hrs] Mass [g] Time [hrs] Mass [g]
t = Mst = √t = Mwt = √t = Mwt =
0 488.68
1 491.94 0.1 3.26 0.1 3.26
6 495.00 0.3 6.32 0.3 6.32
12 496.47 0.4 7.79 0.4 7.79
20 497.25 0.6 8.57
Slope [g/√hrs] F = 12.01 14.38
Sorptivity [mm/√hrs] S = 10.97 13.14
Correlation coefficient R2 = 0.961 0.990
where Mwt = Mst - Mso
where F = Mwt/√t
where S = (F.d)/(Msv - Mso)
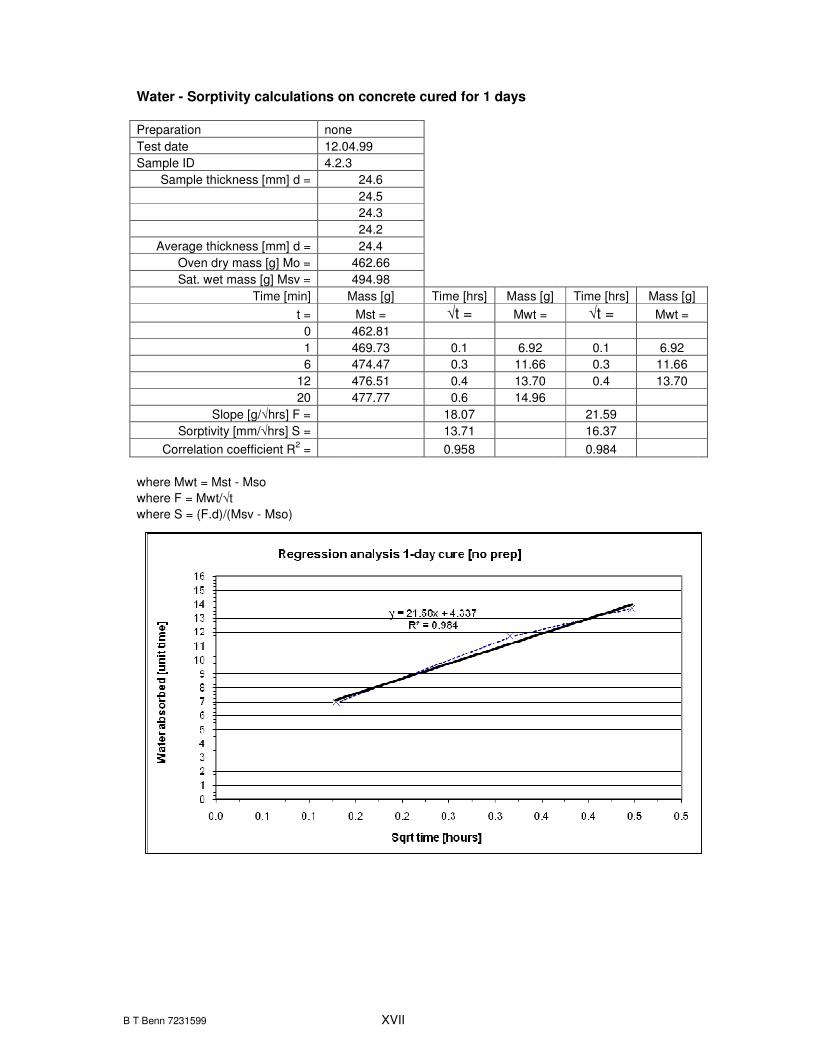
B T Benn 7231599 XVII
Water - Sorptivity calculations on concrete cured for 1 days
Preparation none
Test date 12.04.99
Sample ID 4.2.3
Sample thickness [mm] d = 24.6
24.5
24.3
24.2
Average thickness [mm] d = 24.4
Oven dry mass [g] Mo = 462.66
Sat. wet mass [g] Msv = 494.98
Time [min] Mass [g] Time [hrs] Mass [g] Time [hrs] Mass [g]
t = Mst = √t = Mwt = √t = Mwt =
0 462.81
1 469.73 0.1 6.92 0.1 6.92
6 474.47 0.3 11.66 0.3 11.66
12 476.51 0.4 13.70 0.4 13.70
20 477.77 0.6 14.96
Slope [g/√hrs] F = 18.07 21.59
Sorptivity [mm/√hrs] S = 13.71 16.37
Correlation coefficient R2 = 0.958 0.984
where Mwt = Mst - Mso
where F = Mwt/√t
where S = (F.d)/(Msv - Mso)

B T Benn 7231599 XVIII
Water - Sorptivity calculations on concrete cured for 1 days
Preparation Mechanical Wire Brush
Test date 12.04.99
Sample ID 4.2.5
Sample thickness [mm] d = 25.8
25.6
24.3
24.3
Average thickness [mm] d = 25.0
Oven dry mass [g] Mo = 641.24
Sat. wet mass [g] Msv = 678.59
Time [min] Mass [g] Time [hrs] Mass [g] Time [hrs] Mass [g]
t = Mst = √t = Mwt = √t = Mwt =
0 641.34
1 647.56 0.1 6.22 0.1 6.22
6 653.31 0.3 11.97 0.3 11.97
12 655.50 0.4 14.16 0.4 14.16
20 656.31 0.6 14.97
Slope [g/√hrs] F = 19.80 25.35
Sorptivity [mm/√hrs] S = 13.29 17.02
Correlation coefficient R2 = 0.921 0.977
where Mwt = Mst - Mso
where F = Mwt/√t
where S = (F.d)/(Msv - Mso)

B T Benn 7231599 XIX
Water - Sorptivity calculations on concrete cured for 1 days
Preparation Hand (Manual) Wire Brush
Test date 13.04.99
Sample ID 4.6.3
Sample thickness [mm] d = 25.3
25.2
25.4
24.7
Average thickness [mm] d = 25.2
Oven dry mass [g] Mo = 485.08
Sat. wet mass [g] Msv = 513.25
Time [min] Mass [g] Time [hrs] Mass [g] Time [hrs] Mass [g]
t = Mst = √t = Mwt = √t = Mwt =
0 485.19
1 490.21 0.1 5.02 0.1 5.02
6 493.57 0.3 8.38 0.3 8.38
12 494.83 0.4 9.64 0.4 9.64
20 495.56 0.6 10.37
Slope [g/√hrs] F = 12.01 14.76
Sorptivity [mm/√hrs] S = 10.76 13.23
Correlation coefficient R2 = 0.941 0.976
where Mwt = Mst - Mso
where F = Mwt/√t
where S = (F.d)/(Msv - Mso)
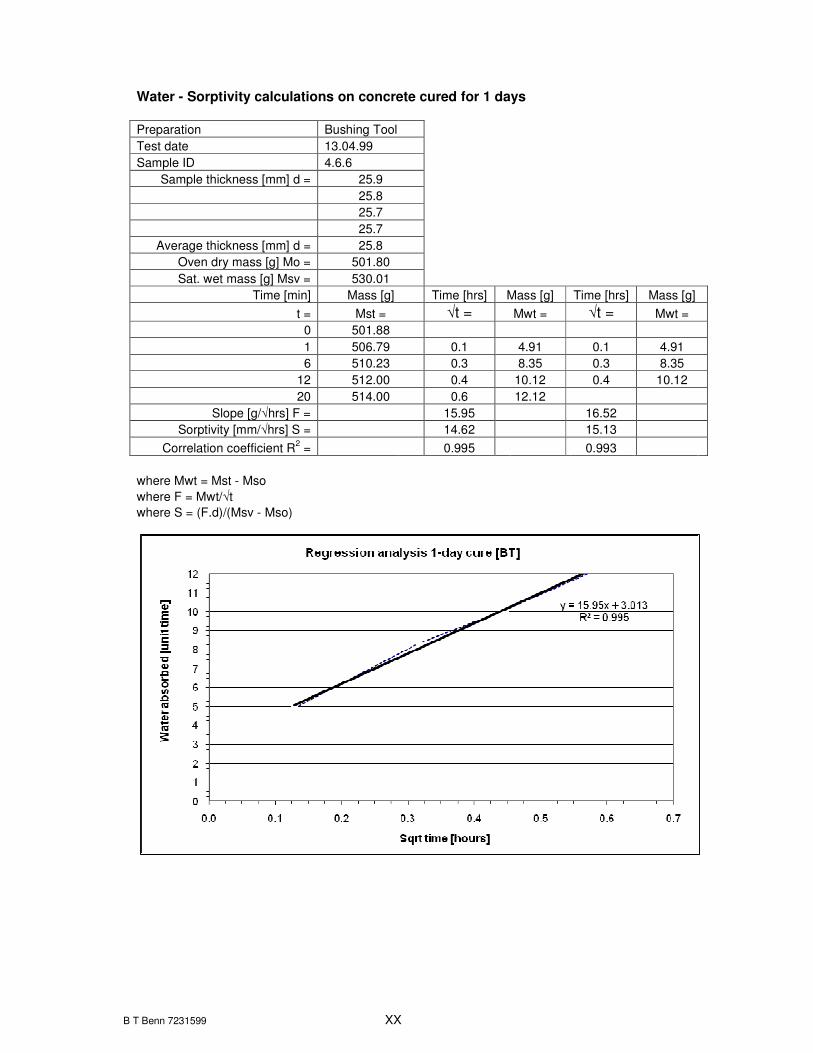
B T Benn 7231599 XX
Water - Sorptivity calculations on concrete cured for 1 days
Preparation Bushing Tool
Test date 13.04.99
Sample ID 4.6.6
Sample thickness [mm] d = 25.9
25.8
25.7
25.7
Average thickness [mm] d = 25.8
Oven dry mass [g] Mo = 501.80
Sat. wet mass [g] Msv = 530.01
Time [min] Mass [g] Time [hrs] Mass [g] Time [hrs] Mass [g]
t = Mst = √t = Mwt = √t = Mwt =
0 501.88
1 506.79 0.1 4.91 0.1 4.91
6 510.23 0.3 8.35 0.3 8.35
12 512.00 0.4 10.12 0.4 10.12
20 514.00 0.6 12.12
Slope [g/√hrs] F = 15.95 16.52
Sorptivity [mm/√hrs] S = 14.62 15.13
Correlation coefficient R2 = 0.995 0.993
where Mwt = Mst - Mso
where F = Mwt/√t
where S = (F.d)/(Msv - Mso)
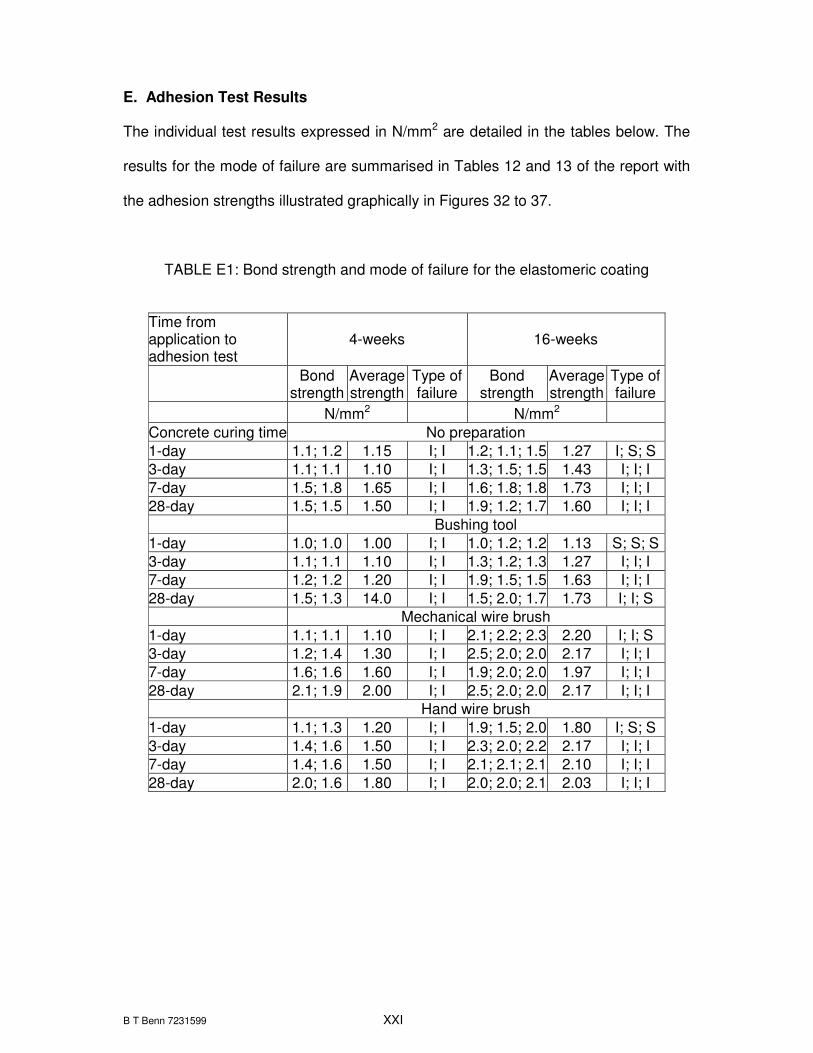
B T Benn 7231599 XXI
E. Adhesion Test Results
The individual test results expressed in N/mm2 are detailed in the tables below. The
results for the mode of failure are summarised in Tables 12 and 13 of the report with
the adhesion strengths illustrated graphically in Figures 32 to 37.
TABLE E1: Bond strength and mode of failure for the elastomeric coating
Time from application to adhesion test
4-weeks 16-weeks
Bond
strength Average strength
Type of failure
Bond strength
Average strength
Type of failure
N/mm2 N/mm2
Concrete curing time No preparation
1-day 1.1; 1.2 1.15 I; I 1.2; 1.1; 1.5 1.27 I; S; S
3-day 1.1; 1.1 1.10 I; I 1.3; 1.5; 1.5 1.43 I; I; I
7-day 1.5; 1.8 1.65 I; I 1.6; 1.8; 1.8 1.73 I; I; I
28-day 1.5; 1.5 1.50 I; I 1.9; 1.2; 1.7 1.60 I; I; I
Bushing tool
1-day 1.0; 1.0 1.00 I; I 1.0; 1.2; 1.2 1.13 S; S; S
3-day 1.1; 1.1 1.10 I; I 1.3; 1.2; 1.3 1.27 I; I; I
7-day 1.2; 1.2 1.20 I; I 1.9; 1.5; 1.5 1.63 I; I; I
28-day 1.5; 1.3 14.0 I; I 1.5; 2.0; 1.7 1.73 I; I; S
Mechanical wire brush
1-day 1.1; 1.1 1.10 I; I 2.1; 2.2; 2.3 2.20 I; I; S
3-day 1.2; 1.4 1.30 I; I 2.5; 2.0; 2.0 2.17 I; I; I
7-day 1.6; 1.6 1.60 I; I 1.9; 2.0; 2.0 1.97 I; I; I
28-day 2.1; 1.9 2.00 I; I 2.5; 2.0; 2.0 2.17 I; I; I
Hand wire brush
1-day 1.1; 1.3 1.20 I; I 1.9; 1.5; 2.0 1.80 I; S; S
3-day 1.4; 1.6 1.50 I; I 2.3; 2.0; 2.2 2.17 I; I; I
7-day 1.4; 1.6 1.50 I; I 2.1; 2.1; 2.1 2.10 I; I; I
28-day 2.0; 1.6 1.80 I; I 2.0; 2.0; 2.1 2.03 I; I; I
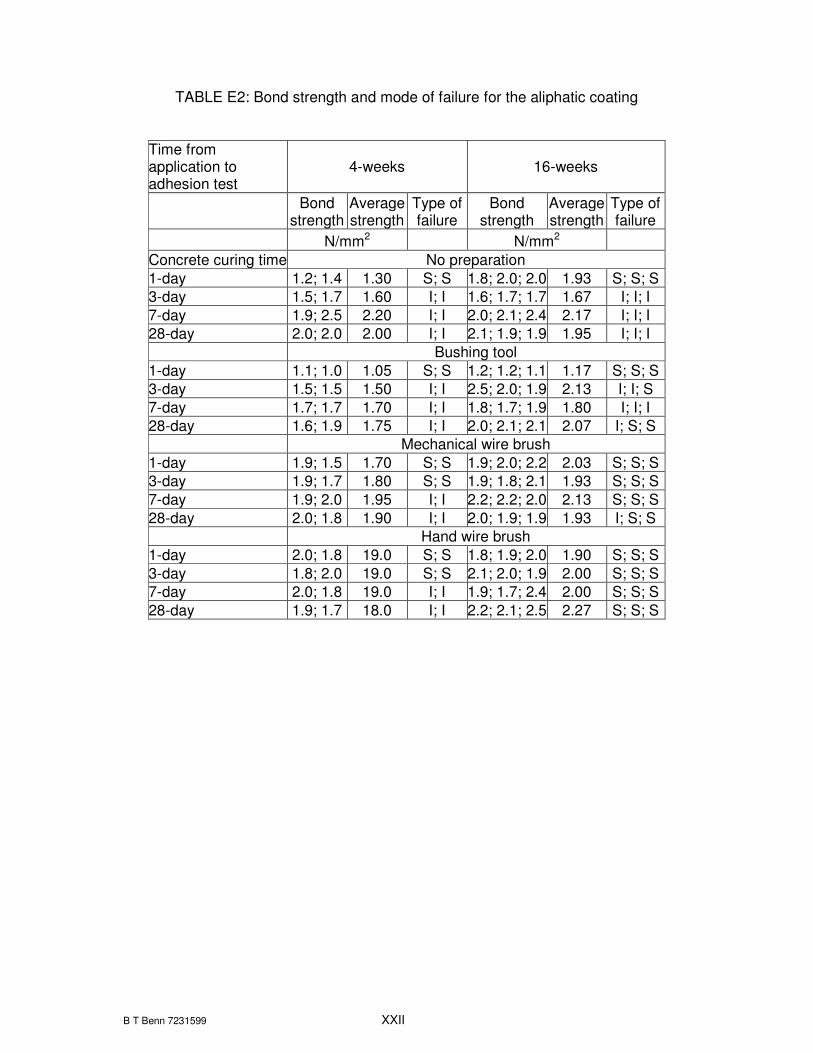
B T Benn 7231599 XXII
TABLE E2: Bond strength and mode of failure for the aliphatic coating
Time from application to adhesion test
4-weeks 16-weeks
Bond
strength Average strength
Type of failure
Bond strength
Average strength
Type of failure
N/mm2 N/mm2
Concrete curing time No preparation
1-day 1.2; 1.4 1.30 S; S 1.8; 2.0; 2.0 1.93 S; S; S
3-day 1.5; 1.7 1.60 I; I 1.6; 1.7; 1.7 1.67 I; I; I
7-day 1.9; 2.5 2.20 I; I 2.0; 2.1; 2.4 2.17 I; I; I
28-day 2.0; 2.0 2.00 I; I 2.1; 1.9; 1.9 1.95 I; I; I
Bushing tool
1-day 1.1; 1.0 1.05 S; S 1.2; 1.2; 1.1 1.17 S; S; S
3-day 1.5; 1.5 1.50 I; I 2.5; 2.0; 1.9 2.13 I; I; S
7-day 1.7; 1.7 1.70 I; I 1.8; 1.7; 1.9 1.80 I; I; I
28-day 1.6; 1.9 1.75 I; I 2.0; 2.1; 2.1 2.07 I; S; S
Mechanical wire brush
1-day 1.9; 1.5 1.70 S; S 1.9; 2.0; 2.2 2.03 S; S; S
3-day 1.9; 1.7 1.80 S; S 1.9; 1.8; 2.1 1.93 S; S; S
7-day 1.9; 2.0 1.95 I; I 2.2; 2.2; 2.0 2.13 S; S; S
28-day 2.0; 1.8 1.90 I; I 2.0; 1.9; 1.9 1.93 I; S; S
Hand wire brush
1-day 2.0; 1.8 19.0 S; S 1.8; 1.9; 2.0 1.90 S; S; S
3-day 1.8; 2.0 19.0 S; S 2.1; 2.0; 1.9 2.00 S; S; S
7-day 2.0; 1.8 19.0 I; I 1.9; 1.7; 2.4 2.00 S; S; S
28-day 1.9; 1.7 18.0 I; I 2.2; 2.1; 2.5 2.27 S; S; S

B T Benn 7231599 XXIII
TABLE E3: Bond strength and mode of failure for the epoxy resin based coating
Time from application to adhesion test
4-weeks 16-weeks
Bond
strength Average strength
Type of failure
Bond strength
Average strength
Type of failure
N/mm2 N/mm2
Concrete curing time No preparation
1-day 1.1; 1.2 1.15 S; S 1.9; 1.7;1.5 1.70 I; I S
3-day 1.3; 1.5 1.40 S; S 2.0; 2.0; 1.7 1.90 I; S; S
7-day 1.4; 1.4 1.40 I; I 2.0; 2.1; 2.0 2.03 I; I; I
28-day 1.3; 1.3 1.30 I; I 1.6; 1.4; 1.5 1.50 I; I; I
Bushing tool
1-day 2.0; 1.1 1.55 I; I 1.7; 1.8; 1.5 1.67 S; S; S
3-day 1.1; 2.0 1.55 I; I 1.7; 2.0; 1.8 1.83 I; S; S
7-day 1.5; 1.3 1.40 I; I 2.0; 2.0; 2.0 2.00 I; I; I
28-day 1.4; 1.9 1.65 I; I 2.4; 2.0; 1.9 2.10 S; S; S
Mechanical wire brush
1-day 1.5; 1.9 1.70 I; I 1.7; 1.8; 1.7 1.73 S; S; S
3-day 1.8; 1.9 1.70 I; I 2.0; 2.1; 2.0 2.03 S; S; S
7-day 1.4; 1.4 1.40 I; I 1.7; 2.2; 1.9 1.93 I; I; I
28-day 1.7; 1.9 1.80 I; I 2.4; 2.0; 2.2 2.20 I; I; I
Hand wire brush
1-day 2.2; 2.0 2.10 S; S 2.0; 1.6; 1.8 1.80 S; S; S
3-day 2.0; 1.5 1.75 S; S 1.9; 2.0; 1.8 1.90 I; I; S
7-day 1.5; 1.5 1.50 I; I 2.8; 2.7; 2.9 2.80 I; I; I
28-day 2.0; 1.8 1.90 I; I 2.1; 2.0; 2.0 2.03 I; I; I

B T Benn 7231599 XXIV
TABLE E4: Bond strength and mode of failure for the cementitious based coating
Time from application to adhesion test
4-weeks 16-weeks
Bond
strength Average strength
Type of failure
Bond strength
Average strength
Type of failure
N/mm2 N/mm2
Concrete curing time No preparation
1-day 1.6; 1.5 1.55 C; C 1.7; 1.9; 1.5 1.70 I; I; I
3-day 1.5; 1.7 1.60 C; C 1.6; 2.5 2.1 2.07 I; I; I
7-day 1.8; 1.8 1.80 C; C 2.1; 1.7; 2.1 1.97 I; I; I
28-day 1.7; 1.7 1.70 C; C 2.1; 1.9; 2.1 2.03 I; S; S
Bushing tool
1-day 1.9; 1.7 1.80 C; C 1.7; 1.8; 2.0 1.87 I; I; I
3-day 2.0; 1.4 1.70 C; C 1.4; 1.5; 1.4 1.43 I; I; I
7-day 1.4; 2.0 1.70 C; C 1.4; 1.7; 1.5 1.53 I; I; S
28-day 1.9; 1.8 1.85 C; C 1.4; 1.6; 1.5 1.50 I; I; S
Mechanical wire brush
1-day 1.3; 1.5 1.40 C; C 2.1; 2.0; 2.0 2.03 I; I; I
3-day 1.5; 1.7 1.60 C; C 2.2; 1.9; 2.0 2.03 I; I; I
7-day 1.5; 1.6 1.55 C; C 2.0; 2.4; 2.0 2.13 I; I; I
28-day 1.8; 1.9 1.85 C; C 2.0; 2.0; 2.0 2.00 I; I; I
Hand wire brush
1-day 1.8; 1.2 1.50 C; C 2.0; 2.5; 2.3 2.27 I; I; I
3-day 1.2; 2.0 1.60 C; C 2.3; 2.3; 2.1 2.23 I; I; I
7-day 1.2; 1.9 1.55 C; C 1.8; 2.6 2.2 1.87 I; I; I
28-day 1.2; 1.5 1.35 C; C 2.0; 2.1; 2.7 2.27 I; I; I
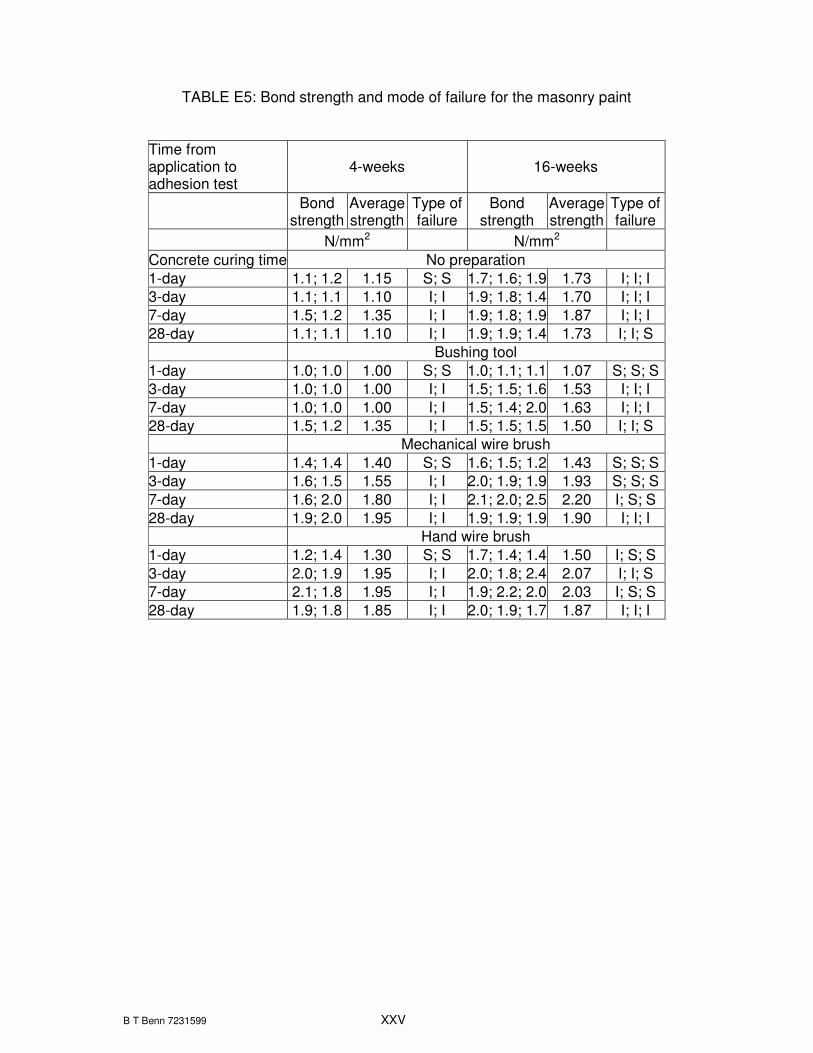
B T Benn 7231599 XXV
TABLE E5: Bond strength and mode of failure for the masonry paint
Time from application to adhesion test
4-weeks 16-weeks
Bond
strength Average strength
Type of failure
Bond strength
Average strength
Type of failure
N/mm2 N/mm2
Concrete curing time No preparation
1-day 1.1; 1.2 1.15 S; S 1.7; 1.6; 1.9 1.73 I; I; I
3-day 1.1; 1.1 1.10 I; I 1.9; 1.8; 1.4 1.70 I; I; I
7-day 1.5; 1.2 1.35 I; I 1.9; 1.8; 1.9 1.87 I; I; I
28-day 1.1; 1.1 1.10 I; I 1.9; 1.9; 1.4 1.73 I; I; S
Bushing tool
1-day 1.0; 1.0 1.00 S; S 1.0; 1.1; 1.1 1.07 S; S; S
3-day 1.0; 1.0 1.00 I; I 1.5; 1.5; 1.6 1.53 I; I; I
7-day 1.0; 1.0 1.00 I; I 1.5; 1.4; 2.0 1.63 I; I; I
28-day 1.5; 1.2 1.35 I; I 1.5; 1.5; 1.5 1.50 I; I; S
Mechanical wire brush
1-day 1.4; 1.4 1.40 S; S 1.6; 1.5; 1.2 1.43 S; S; S
3-day 1.6; 1.5 1.55 I; I 2.0; 1.9; 1.9 1.93 S; S; S
7-day 1.6; 2.0 1.80 I; I 2.1; 2.0; 2.5 2.20 I; S; S
28-day 1.9; 2.0 1.95 I; I 1.9; 1.9; 1.9 1.90 I; I; I
Hand wire brush
1-day 1.2; 1.4 1.30 S; S 1.7; 1.4; 1.4 1.50 I; S; S
3-day 2.0; 1.9 1.95 I; I 2.0; 1.8; 2.4 2.07 I; I; S
7-day 2.1; 1.8 1.95 I; I 1.9; 2.2; 2.0 2.03 I; S; S
28-day 1.9; 1.8 1.85 I; I 2.0; 1.9; 1.7 1.87 I; I; I