The Influence of Chocolate and Wafer on customers ...461178/FULLTEXT01.pdf · An Application of...
117
The Influence of Chocolate and Wafer on The Influence of Chocolate and Wafer on The Influence of Chocolate and Wafer on The Influence of Chocolate and Wafer on customers customers customers customers – An Application of Kansei Engineering An Application of Kansei Engineering An Application of Kansei Engineering An Application of Kansei Engineering By Dominik Grzechnik Arvind Prithiviraj Division IEI June 2010 Supervisors: Simon Schütte. IKP LiTH Emma Raaschou, Cloetta AB Degree Project Department of Management and Engineering LIU-IEI-TEK-A--10/00815--SE
Transcript of The Influence of Chocolate and Wafer on customers ...461178/FULLTEXT01.pdf · An Application of...

The Influence of Chocolate and Wafer on The Influence of Chocolate and Wafer on The Influence of Chocolate and Wafer on The Influence of Chocolate and Wafer on customers customers customers customers
–––– An Application of Kansei EngineeringAn Application of Kansei EngineeringAn Application of Kansei EngineeringAn Application of Kansei Engineering
By Dominik Grzechnik Arvind Prithiviraj
Division
IEI
June 2010
Supervisors: Simon Schütte. IKP LiTH
Emma Raaschou, Cloetta AB
Degree Project Department of Management and Engineering
LIU-IEI-TEK-A--10/00815--SE

1


i
Abstract This project has been assigned for the thesis group by one of the leading Swedish confectionery company Cloetta AB, and the main goal of this work has been to investigate “What feelings trigger more chocolate in wafer-based chocolates” with chocolate consumers. The Kansei Engineering study was used to achieve this and should deliver useful information for the market research and the development department at Cloetta AB. The Kansei Engineering methodology origins in Japan and is about gathering and analyzing information from the customer impressions and feelings about a certain product. Gathered results considering the physical properties and customer’s impressions are analyzed in relation to each other through various statistical methods. In practice this project has been executed through planning and performing surveys on chocolate consumers and the gathered data has later been analyzed accordingly to the Kansei Engineering Methodology. Statistical methods such as factor analysis using the statistical software SPSS and regression analysis using QTI through KESo software have been utilized for the analysis. In the factor analysis the so-called Kansei-words, which describe impressions of the wafer-based chocolates, were reduced from twenty to five words; preferable, lifestyle, disadvantage, rewarding and quality. These words were connected with the properties given from Cloetta AB; number of wafers and amount of chocolate; and used in the final survey. The factor analysis also included benchmarking of several competing products within wafer-based chocolates. The final survey resulted in nine varieties of chocolate samples, all with varieties in the number of wafers and the amount of chocolate. Input data from this survey was handled within KESo software and analyzed with the QTI method. The results were comprehended and interpreted in text format and delivered to Cloetta AB. From the QTI results it may be concluded that feelings which trigger more chocolate amount in wafer-based chocolates are preferable, rewarding and quality.

ii

iii
Acknowledgements The backbone of this thesis work was our supervisor Simon Schütte. Without his guidance and valuable feedbacks this work would not be possible and that’s the reason why we owe our deepest gratitude to him. We would like to thank Emma Raaschou, our supervisor at Cloetta AB, for her valuable advices and information needed during this thesis project. We would also like to pay great gratitude for the product developers; Anna-Karin Järdemar and Kerstin Edstam-Gabrielsson as well as the production employees at Cloetta AB for helping us with making the product samples desired, which was essential for our final study. Lastly, we would like to offer our best regards and blessings to all of those who supported us in every respect during the completion of the project; family, girlfriends, participants in the survey with many others. Without all of you mentioned and unmentioned this work would not be possible. Thank you! Linköping, 15th June 2010 Arvind Prithiviraj & Dominik Grzechnik

iv

v
Table of Contents Abstract ....................................................................................................................................... i Acknowledgements ................................................................................................................... iii Table of Contents ....................................................................................................................... v List of Figures .......................................................................................................................... vii List of Tables ............................................................................................................................. ix 1. Introduction ........................................................................................................................ 1
1.1 Background Cloetta AB ................................................................................................... 1 1.2 Aim ................................................................................................................................... 1 1.3 Objective .......................................................................................................................... 1 1.4 Problem definition ............................................................................................................ 1 1.5 Confidentiality .................................................................................................................. 1 Because of the strategic purpose of this study the company’s data and other sensitive information will not be presented in any part of this work. ................................................... 1
2. Theoretical framework ....................................................................................................... 3 2.1 Kansei Engineering .......................................................................................................... 3
2.1.1 Background ............................................................................................................... 3 2.2 The model for Kansei Engineering methodology ............................................................ 4
2.2.1 Choice of domain ...................................................................................................... 4 2.2.2 Span the semantic space ............................................................................................ 4
2.2.2.1 Affinity diagram ................................................................................................. 5 2.2.3 Span the space of properties ...................................................................................... 6 2.2.4 Synthesis .................................................................................................................... 7 2.2.5 Test of validity ........................................................................................................... 7 2.2.6 Model building .......................................................................................................... 7
2.3 Types of Kansei Engineering ........................................................................................... 7 2.3.1 Kansei Engineering System ....................................................................................... 8
2.4 KESo (Kansei Engineering Software) .............................................................................. 9 2.4.1 Survey part ................................................................................................................ 9 2.4.2 Creating survey ........................................................................................................ 10 2.4.3.Pros and Cons of KESO .......................................................................................... 11 2.4.4 Analyzing part ......................................................................................................... 11
2.4.4.1 QTI / Linear method ......................................................................................... 12 2.4.3.2 RSA / non linear method .................................................................................. 13 2.4.3.3 Radar chart ....................................................................................................... 13
2.5 Factor analysis ................................................................................................................ 14 2.6 Understanding factor analysis using SPSS ..................................................................... 14
2.6.1 Correlation Matrix ................................................................................................... 14 2.6.2 Factors represented in graphs .................................................................................. 14 2.6.3 Factors represented in equation ............................................................................... 14 2.6.4 Communality ........................................................................................................... 14 2.6.5 Principle Component Analysis ................................................................................ 15 2.6.6 Factor selection ........................................................................................................ 16 2.6.7 Factor rotation ......................................................................................................... 16 2.6.8 Factor loading selection ........................................................................................... 17
2.7 Running the Factor analysis using SPSS ........................................................................ 18 3. Method and results ........................................................................................................... 19
3.1 Defining the choice of domain ....................................................................................... 19

vi
3.2 Spanning the semantic space .......................................................................................... 19 3.2.1 Collection of Kansei words ..................................................................................... 19 3.2.2 Creating the initial survey ....................................................................................... 20 3.2.3 Survey execution/procedure .................................................................................... 21
3.3 Analyzing the survey results .......................................................................................... 22 3.3.1 Radar chart for Kansei words .................................................................................. 22 3.3.2 Interpretation of Radar chart for Kansei Words ...................................................... 23 3.3.3 Comparison of all products or Benchmarking ........................................................ 23 3.3.4 Mean Value Charts for Kansei words ..................................................................... 24
3.4 SPSS Factor Analysis ..................................................................................................... 25 3.5 Interpreting the factor analysis from SPSS .................................................................... 25
3.5.1 Sample Size ............................................................................................................. 25 3.5.2 Factor Selection ....................................................................................................... 26
3.5.2.1 Kaiser’s criterion .............................................................................................. 26 3.5.2.2 Scree Plots ........................................................................................................ 26
3.5.3 Communalities ......................................................................................................... 26 3.5.4 Factor Rotation and Factor Loading Selection ........................................................ 26 3.5.5 Variable grouping in a Factor .................................................................................. 27 3.5.6 Interpretation and evaluation of the rotated component matrix .............................. 27
3.6 Spanning the space of properties .................................................................................... 31 3.6.1 Additional improvement study ................................................................................ 31
3.7 Synthesis ......................................................................................................................... 34 3.7.1 Concept design – the proposal ................................................................................. 34 3.7.2 Chocolate thickness variety ..................................................................................... 34 3.7.3 Wafer variety ........................................................................................................... 35 3.7.4 Summary ................................................................................................................. 36
3.8 Chocolate concept building ............................................................................................ 36 3.9 Final survey .................................................................................................................... 39
3.9.1 Feedbacks about the survey ..................................................................................... 39 3.9.2 Feedbacks about the Kansei words used ................................................................. 39 3.9.3 Feedbacks about the chocolates samples ................................................................. 39
3.10 KESo results ................................................................................................................. 41 3.10.1 QT-I Linear Regression ......................................................................................... 41 3.10.2 Radar Chart ............................................................................................................ 43
3.11 Test of validity .............................................................................................................. 44 3.12 Model building ............................................................................................................. 44
4. Conclusions ...................................................................................................................... 45 5. References ........................................................................................................................ 47

vii
List of Figures Figure 1: Principle of a Kansei Engineering (Nagamachi, 1989) .............................................. 3 Figure 2: A proposed model on Kansei Engineering (Schütte, 2002)........................................ 4 Figure 3: Spanning the space of properties (Schütte 2005) ........................................................ 6 Figure 4: Principle of a Kansei Engineering System (Nagamachi, 1997) .................................. 8 Figure 5: Example of the survey manager in KESo ................................................................. 10 Figure 6: Example of a radar chart ........................................................................................... 13 Figure 7: An example of scree plot .......................................................................................... 16 Figure 8: Radar chart with Kansei words. ................................................................................ 22 Figure 9: Histogram of the mean value for product A1. .......................................................... 24 Figure 10: Histogram of the mean value for product A2. ........................................................ 24 Figure 11: Histogram of the mean value for product B. .......................................................... 25 Figure 12: Histogram of the mean value for product C. .......................................................... 25 Figure 13: Radar chart showing the importance of each property. .......................................... 32 Figure 14: Histogram showing the properties vs. the mean value. .......................................... 33 Figure 15: Transformation of product A2. ............................................................................... 34 Figure 16: Product proposal after transformation. ................................................................... 35 Figure 17: Wafer blocks. .......................................................................................................... 38 Figure 18: Manual cutting area. ............................................................................................... 38 Figure 19: Cutting away the edges. .......................................................................................... 38 Figure 20: A proposed model on Kansei Engineering ............................................................. 41

viii

ix
List of Tables Table 1: Example QTI results Schütte and Eklund (2005) ...................................................... 12 Table 2: An example of communality table ............................................................................. 15 Table 3: An example of rotated component matrix .................................................................. 17 Table 4: Rotated Component Matrix example for product A2. ............................................... 27 Table 5: Factor analysis for product A1 ................................................................................... 28 Table 6: Factor analysis for product A2 ................................................................................... 29 Table 7: Factor analysis for product B ..................................................................................... 29 Table 8: Factor analysis for product C ..................................................................................... 30 Table 9: Proposed chocolate coating thickness in each variety. .............................................. 35 Table 10: Proposed number of wafers in each variety ............................................................. 35 Table 11: Summary table of the amount of chocolate and wafer variety ................................. 36 Table 12: Summary of the QT-I analysis ................................................................................. 42 Table 13: Summary of the radar chart for the nine products .................................................... 43

x

1. Introduction 1.1 Background Cloetta AB Cloetta AB was established by two Swiss brothers with the same name in 1862 in Copenhagen, Denmark, and is today one of the largest manufacturer of confectioneries in the Nordic countries. Their products and brands are well established in Sweden, such as KexChoklad, Center, Plopp, Polly and others. The company has two manufacturing sites, one in Ljungsbro and a second one in Alingsås. Just to mention an example about the company’s production efficiency; between the 1st of September 2008 and the 31st of August 2009 Cloetta manufactured a sum of 20 000 tons of confectionery. The company has a sum of 450 employees. Cloetta vision is to be the leading confection company of the Nordic countries. 1.2 Aim The aim of this study is to see whether an application of the Kansei Engineering methodology is useful for wafer-based chocolates. 1.3 Objective The objective is to investigate what feelings trigger the amount of chocolate and the amount of wafers. The number of wafers and the amount of chocolate covering differs between the products used as basis for this study. 1.4 Problem definition The study is based on the company’s two main wafer-based chocolates, called A1 and A2 in the project due to confidential matters. The two products make basis for this study. A1 is a well-known product in Sweden and stands for the majority of the company’s revenue. Product A2 is not going very well although it has been out on the market for almost equal amount of time compared to product A1. 1.5 Confidentiality Because of the strategic purpose of this study the company’s data and other sensitive information will not be presented in any part of this work.

Introduction
2

2. Theoretical framework 2.1 Kansei Engineering 2.1.1 Background Kansei is a Japanese word which means sensitivity or sensibility of a sensory organ where perception or sensation takes place as a result of the subjective impression from the external world. In the 1970s Nagamachi introduced an effective product development method called ‘Emotional Engineering’ (Schütte 2005), but the term Kansei Engineering came into popular use after Mazda Motor Company’s manager K. Yamamoto delivered the term in his speech in the 1980s, (Nagasawa, 2002). Kansei Engineering has two features, firstly to transfer the customer’s feelings, impressions and demands on existing products to design parameters and secondly, how Kansei is transferred into design (Schütte 2005). There may be a question raised from the reader, how this is done? This can be illustrated with the figure below where the Kansei is measured and put into a system or in a simpler format, i.e. a mathematical regression model which then provides recommendations for design solutions.
Figure 1: Principle of a Kansei Engineering (Nagamachi, 1989) However when studying a person it does not mean that a true Kansei is captured for a certain product it may have been influenced by the time and the situation. So the greater the number of respondents the better is the picture of Kansei for the product. (Schütte 2005) based on his literature review proposed a model for the Kansei Engineering methodology which is displayed and discussed in the following context.

Theoretical framework
4
2.2 The model for Kansei Engineering methodology The model in the figure below was used as basis to carry out our study in this thesis work. These phases are discussed briefly in the following paragraphs.
Figure 2: A proposed model on Kansei Engineering (Schütte, 2002) 2.2.1 Choice of domain In this phase the domain is explained thoroughly. A domain is the selection of the target group, market position by benchmarking and specification of a product which can be both an existing design and a non existing design. 2.2.2 Span the semantic space In this phase all the possible Kansei words are found using the various sources such as magazines, experts, focus group etc. There are three levels of Kansei words; low level Kansei, high level Kansei and the general Kansei (Schütte 2005). Low level Kansei words are considered simple words and are a result of spontaneous expressions of feelings. Generally these words have a unique meaning and don’t make a direct relation with other words. Words such as beautiful, nice can represent low level Kanseis. Low
The influence of chocolate and wafer on customers – An application of Kansei Engineering
5
level Kanseis come from different individuals who have different ways of expressing similar feelings under similar situations. High level Kansei words result from a group of low level Kansei words. One may take some time to come up with high level Kansei words. They represent the overall experience of a situation, for example the word luxury is a high level Kansei word representing the low level Kansei words such as reward, smell, unique etc. General Kansei words are created by high level Kansei words or a group of high level Kansei words. It is the highest grade in the Kansei word hierarchy and according to Japanese experts these words represent the aspects of quality and social status of a product owner. There has not been enough research carried out in general Kansei in the European sector. Words such as quality and disadvantage can be termed as general Kansei words. Generally high level Kansei words or the general Kansei words are used in the synthesis phase of the study to achieve required results. It is experienced by the thesis group that during the extraction process of the Kansei words some members of the focus group and expert group were able to provide a general Kansei word and/or a high level Kansei word directly. According to Schütte this study can be carried out with nearly 120 low level Kansei words which can be later reduced to around 20 high level Kansei words using the affinity diagram and factor analysis. Keeping the number of Kansei Engineering words less in a survey may influence the participants to provide accurate results and reduce confusion. It is important to convert the ideas and visions into Kansei words in order to make the Kansei Engineering a creative and innovative product development tool so that the non existing design can also be considered (Schütte 2005).
2.2.2.1 Affinity diagram Affinity diagram is a tool used for identifying the higher grade Kansei (Schütte 2004) and kind of shows the associations with a product than a logical connection, why it is suitable for finding higher grade Kansei. This method may also be referred to as Card System or the KJ-method dependent on which author is referred to. For the procedure of an affinity diagram it’s preferable to include 6 to 8 persons who are familiar with the products and have some knowledge about the method of Kansei Engineering. According to Bergman and Klefsjö (1994) and with some modification with consultation with the group’s supervisor Schütte, there are three steps that can be used as a template for this kind of procedure:
• Firstly the conductors of the procedure have to define the subject that will be the basis for collection of all the words, meaning that the product domain has to be explained for the participants.
• Secondly, the group has to brainstorm and come up with words which will be recorded on for example post-its. The sources of the words might be to do a small market research, looking up information from different sources, i.e. the internet, magazine etc.

Theoretical framework
6
• The main and most vital step of the affinity diagram is to organize all the post-its in groups and at the end find headings that best describe the groups. This should be done by the group’s intuition and why direct interaction from the conductors is prohibited. Discussion between the participants is emphasized while the conductors observe by taking notes in silence.
It has to be noted that the participants chosen for the affinity diagram procedure need to be experienced to avoid mistakes or biased results because of personal preferences. 2.2.3 Span the space of properties A good selection of the product properties is important even though there is no proper way of developing the relevant properties. In order to choose the relevant properties for the study according to the importance given by the customer, expert group & company, the properties are given a rate of importance and make this a criterion for selection (Schütte 2005). (Schütte 2005) proposed a model in the figure below which can be used in the process for selection of relevant properties.
Figure 3: Spanning the space of properties (Schütte 2005) The model in the figure above consists of three steps.
• Firstly in the collection step all the potential properties are identified from various sources following the same way as in the semantic space.

The influence of chocolate and wafer on customers – An application of Kansei Engineering
7
• Secondly in the selection step an importance level is created for all the properties by customers, expert group and company. The Pareto diagram can be used to identify the important properties.
• Finally in the compiling step all the selected properties are listed together as the product properties from which the sample representing these properties are identified for the synthesis step.
2.2.4 Synthesis In this phase the semantic space and the space of properties are connected together. For each Kansei word there a number of properties are found. Osgood used the semantic differential scales in the surveys which are a type of rating scales. In Kansei Engineering these scales are used in the Kansei survey to evaluate the samples with respect to the Kansei words (Lindberg 2004). The next step is to analyze the Kansei survey using a number of tools available such as the manual methods and statistical methods which include Regression analysis, General Linear Model etc. 2.2.5 Test of validity In this phase, validation is carried out to check for any defects or weaknesses in the design and required measures are taken in order to fix it otherwise the final result will be useless. 2.2.6 Model building In this phase a mathematical or non mathematical model is built from the synthesis after it is validated. The model shows various functions predicting how different product properties will affect the perceived level for each Kansei word. 2.3 Types of Kansei Engineering According to Nagamachi (1997a), there are six different types of Kansei Engineering. They are briefly explained below.
i. Category Classification: the Kansei’s are found for a product strategy and a market segment and are connected manually to product properties.
ii. Kansei Engineering System: the Kansei’s are connected using mathematical statistical tools to product properties. It’s often a computer database system and also called the Forward Kansei Engineering.
iii. Hybrid Kansei Engineering System: similar to the previous type and has the feature of not only suggesting product properties to Kansei but also the vice versa. They are also called Backward Kansei Engineering.
iv. Kansei Engineering Modeling: focuses on building mathematical prediction models. v. Virtual Kansei Engineering: uses virtual reality techniques with standard data
collection systems. vi. Collaborative Kansei Engineering Designing: here Kansei database is accessible
through internet.

Theoretical framework
8
2.3.1 Kansei Engineering System The type of Kansei Engineering used by the thesis group is Kansei Engineering System (ii), abbreviated KES. It is a computer database system where the Kansei’s are connected to the product properties using mathematical statistical tools. The principle of the Kansei Engineering System is described in the figure below.
Figure 4: Principle of a Kansei Engineering System (Nagamachi, 1997) From the figure it is seen that there are four databases; the Kansei words, the examined product’s images, design and color and the knowledge about the relation between different data’s. When a Kansei word enters the KES, the interface engine links the Kansei word with a product image through the help of the Knowledge database, and its design and color is identified. Finally it provides the user with the design elements for the Kansei word. To carry out such a system, information about the target group, pilot studies, benchmarking are conducted. A procedure with 11 steps which is created by Nagamachi (2001) is referred.
• Definition of a Product Domain
• Collection of Kansei Words • Collecting Product Sample in the same field
• Evaluation of Product Samples on Semantic Differential Scales • Factor Analysis of Kansei Words • Construction of a Kansei word database
• Analysis of the data using statistical tools • Construction of a Knowledge base
• Construction of a Sketch and Color Database • Software construction

The influence of chocolate and wafer on customers – An application of Kansei Engineering
9
• Review of the KES
Firstly the product domain is explained in which detailed information regarding the focus groups and the product of interest is mentioned. Now the Kansei words are found for the given domain with the help of various sources such as focus groups, experts, magazines. Similar product samples are collected which has to be used in the study. A KESo analysis is used to evaluate these product samples with the help of volunteers who participate in the survey study. The results from this survey can be feed into the SPSS software to carry out the factor analysis to reduce the amount of Kansei words. After naming the factors for the Kansei word database they are evaluated with the new product samples, statistical analysis is done and the results are viewed. All these activities are carried out in KESo. Finally a review is done to see the effectiveness of the result and any changes or improvements should be done accordingly. 2.4 KESo (Kansei Engineering Software) KESo is a web based version of KESoft. It’s software that was created as a project in the course Software Engineering at Linköping University, Sweden. In order to use the KESo, it requires an account to be created by the user (which has limitations such as number of survey and Kansei words) which can be converted to a premium account by the approval of the administrator who is based in the Linköping University. The tool can be divided into two parts;
• Survey part • Analyzing part
In the survey part the product is examined while in the analyzing part the results from the survey are analyzed. A broader view of the survey and analyzing part are discussed in the following topics. It is to be noted that the user should have a registered KESo account in order to download the analyzing software. 2.4.1 Survey part Once the user is logged into the account he/she can choose the background color, text color, logo, welcome and end text which can appear in the surveys under the user settings. The user can also change his username and password under this section. It also allows the user to request for a premium account if he needs it for his/her survey. In the survey manager, the user can create and have an overview for all the surveys created before. It also provides functionality to handle all of the surveys. An example of how the survey manager page will look like is shown below in the figure. The various functionalities will be discussed with the help of this figure.

Theoretical framework
10
Figure 5: Example of the survey manager in KESo
• The tab Create survey shown on the left top corner of the figure is used in creating surveys which will be discussed in detail in the following paragraphs.
• Download analyzing software downloads the software into the user’s computer to analyze the survey data.
• Download user manual will provide the guidance material for the user in using this KESo
• Survey shows the name of the surveys available. This name is hyperlinked and when clicked will provide a brief survey contents.
• Created gives the date when the survey was created. • Description gives the explanation of the survey which and is given by the user. • Status shows the present activity of this survey. There are three status markers they
are, Incomplete means the survey needs to be edited and finalized. Active means that it has been posted and Inactive means that the survey is closed by the user. It can be made active and posted again.
• Answers show the number of participants who have attended the current survey. • Actions has a drop down menu which contains the following actions:
- Close survey – Shuts down the survey so that the input data can be
analyzed. - Post survey – Sends the survey through e-mail to participants. - Remove survey – Removes the survey from the survey manager. - Download survey data – Downloads all the input data to be analyzed. (only
possible with at least one answered survey) It has to be noted that add buttons are linked to the enter key in the keyboard in order to create the survey quicker. 2.4.2 Creating survey Creating a survey is carried out in seven steps which are explained below.
1. Name and description: The survey can be given a name and a description here. These will be displayed in the survey manager and also in the first page of the survey along with the welcoming message.
2. Demographic questions: It is possible to use demographic questions in order to, i.e. age groups, hometown etc. It has three types of questions; ranged questions, multiple

The influence of chocolate and wafer on customers – An application of Kansei Engineering
11
choice questions and free text questions. A requirement of at least one demographic question is needed in order to continue creating the survey.
3. Kansei words: Here, the user may input all the Kansei words needed for the survey. These are the questions to be answered by the participants. These words relate to the products created in step 5. These words will also be displayed in the analysis as a distribution of the result.
4. Kansei items and categories: They represent the structure and properties of the product. Under each item a property is entered and under the category to this item the types of properties are entered.
5. Kansei products: Here the user creates the product based on the items and categories keyed in the previous step. The user may have two products with the same item but it requires some editing in step 6.
6. Product validation: An alert is given to the user that some products will be ignored and needs editing. A duplicate product requires editing as the software ignores the duplicate product if it is not edited before proceeding. The software also shows the missing combinations of products so that the user may give a name and add it. All these options are available when the edit tab is clicked in the product validation page.
7. Customize products: Provides a finishing touch to each product and this step is optional. The user may provide a description; upload images, video URL and audio URL. When the finish button is pressed editing the survey will not be possible.
It has to be noted once again that add buttons are linked to the enter key in the keyboard in order to create the survey quicker. 2.4.3.Pros and Cons of KESO KESO is very simple and requires no special skills to use it. It’s a web based program meaning that it can be created and edited from any computer with an internet connection. A completed survey which is ready for posting can’t be edited further by the user for any changes. If the survey is long, for example more Kansei words are used; its compatibility is limited only to the Firefox browser while with other browsers it is not possible to scroll the page. During execution of the survey it’s not possible to go back one page, though the software resets all the previous made input data from the participant. If the server is down for this program then neither the user nor the participants will be able to access the surveys. 2.4.4 Analyzing part The data collected from the survey are analyzed in KESo using two algorithms; the QT-I (Quantification Theory Type I) algorithm, which is a linear method, and RSA (Rough Set Analysis) algorithm, which is a non linear method. The analyzing part has a number of display methods to present the analyzed data. It is possible to test the products for results with the help of a generated code if the user doesn’t have any survey data. If the user has collected data through the web survey it can be analyzed by first downloading the data and then by importing it to the analyzing software, as described in the Survey part section. When this is done the software highlights the information of the number of participants & demographic information in a window. Here, the user can filter the demographic group by checking the box next to the name. The collected

Theoretical framework
12
data can also be viewed graphically without doing an analysis with the help of the radar chart option to visually compare the mean product scores. To make the analysis of the survey data first the desired algorithm is selected, a name is selected for the result and then analysis is carried out. Once an analysis is done, the name will be displayed in the result window. The result is viewed by selecting the name and choosing the desired display method. When viewing the result, the buttons may be disabled if the display method is not supported.
2.4.4.1 QTI / Linear method QTI determines the correlation between the general Kansei word ranking and the different product properties and calculates a regression function which predicts the Kansei rating value for the future products and the influence of each product property. As an example taken from the Design of Rocker Switches for Work Vehicles (2005) study three general Kansei words were mentioned; robustness, precision and cheap/stiff. These words were ranked accordingly with the properties; formation, zero-position, contact position and surface with relating categories. The calculated regression function which predicts the Kansei rating value (robustness) for the future products and the influence of each product property is seen below.
Table 1: Example QTI results Schütte and Eklund (2005)
To be noted from this figure is the high PCC rating (0.84) which means that zero-position is the most important for the subjective impression of robustness. The highest CS value in zero-position is “side” which indicates that the robustness impression is increased here. To summarize this one can conclude that rocker switches with zero position at a side is to be considered as most robust. These interpretations should be made for all the properties.

The influence of chocolate and wafer on customers – An application of Kansei Engineering
13
2.4.3.2 RSA / non linear method The connections between the data which are linked together by association are found in the Rough Set Analysis (RSA). Its purpose is to find precise data from imprecise or vague data sets. Pawlak (1997), who introduced RSA theory, states that these vague data sets can be precised from lower and upper boundary lines (in two directions). In Kansei engineering, Mori (1998, 2002) played an important role of introducing RSA. The RSA converts the floating point values of scores in the survey into discrete values. The user gives the number of values for using the interval in it and can change the values of the interval within the maximum and minimum range and the values should be in the increasing order. The intervals are by default equally large. According to Schütte, if the sample size is less or equal to 20 then the RSA method is not feasible.
2.4.3.3 Radar chart The radar chart looks like a wheel with a center point with various spokes. The numbers of these spokes (axis) represent the number of variables available and there are no limitations for these numbers.
Figure 6: Example of a radar chart The radar charts are also called spider charts because of its similarity to a spider web. To scale these charts the center point is represented with a 0 or the low rating and the highest point in the spokes have the high rating, in the presented chart above the value is 10. These charts show the strengths and weaknesses of the variables for a particular product. When there is a data series for each variable, a relationship is generated and a comparison is made for multiple categories.

Theoretical framework
14
2.5 Factor analysis Suppose there are a large number of variables and one needs to reduce this to a considerably small number of variables while maintaining its original information, for this factor analysis can be used. This analysis can be carried out in a few seconds with the help of the SPSS (Statistical Package for the Social Sciences) software. 2.6 Understanding factor analysis using SPSS 2.6.1 Correlation Matrix When a large amount of variables are measured, the correlations between each pair of variables are put into a matrix called the R-matrix or correlation matrix. This matrix contains the correlation coefficients between the variables. All the significant correlation coefficients between the variables are identified and made into groups of interrelation variables or factors in a meaningful way. This is carried out by finding variables which has a high correlation with the group of other variables (Field 2009). 2.6.2 Factors represented in graphs A graphical representation of the factors can be carried out in which the factors represent the axis of the graph and the variables are plotted along the coordinates of the axis. The variables are plotted in the axis by considering the extent to which they represent the particular factor which is called the factor loading and the factors are in the scale of -1 to 1. It should be noted that for two factors a 2D graph can be used and for more than two factors a 3D graph representation is required (Field 2009). 2.6.3 Factors represented in equation A factor can be represented in the form of an equation as follows: Factori = b1Variable1i + b2Variable2i + ... + bnVariableni + ei (1) Where bn in the equation is the factor loading and the Variableni is the high level Kansei word. If these values of the factor loading are put into a matrix they are called the factor matrix or component matrix. The equation above can also be computed to find the weighted average if one knows the values for the variables. The weighted average can also be computed using the regression and other methods. There are two purposes in which we find these weighted average; when a large variable set needs to be reduced to a small set and to solve the co-linearity problems in regression (Field 2009). 2.6.4 Communality When the total variance of a variable is shared with another variable it is called the common variance. Communality is described as the amount of the common variance present in a variable. So when a variable has no random variance it is said to have a communality of 1. Random variance is described as a variance which is specific to one variable but not actually it is. When a variable doesn’t share any of its variance with any other variable, it is said to have a communality of 0 (Field 2009).

The influence of chocolate and wafer on customers – An application of Kansei Engineering
15
The common variance for a variable is of interest in the study for the factor analyses. In order to find the common variance for a variable there are two types of methods; the principal component analysis and the squared multiple correlation of each variable with all other (Field 2009). Given below is an example of the communality table. In the table it shows that the word “Kvalitet” has 81.1% of its variance is common variance compared to the other words.
Table 2: An example of communality table
2.6.5 Principle Component Analysis (Field 2009) says “Principle Component Analysis decomposes the original data into a set of linear varieties”. Of all the data, principle component analysis looks for the linear components within and shows with these components how a particular variable can act. Principle component analysis is a preferred method because it is less complex, similar to discriminant analysis and is a good procedure to use for psychological variables (Field 2009). In Principle Component Analysis, a correlation matrix is used and its varieties are calculated by determining the eigenvalues of the matrix. Since there is no group of observations, the measured number of variables equals the number of varieties calculated. The varieties are the factor loadings which were discussed in the previous session, “factors represented in equation”. The eigenvalues are used to calculate the eigenvectors, which provides the loading details bn of a particular variable on a particular factor. The factors with high eigenvalues are retained while those with small eigenvalues are ignored (Field 2009).

Theoretical framework
16
2.6.6 Factor selection There are three methods for factor selection; scree plots, Kaiser’s criterion with eigenvalues greater than 1 and the Kaiser’s criterion with eigenvalues greater than 0.7 (Field 2009). Scree plot is created by plotting the eigenvalues (y-axis) against the factor (x-axis) as seen in figure below.
Figure 7: An example of scree plot A cut off point has to be made in this plot in order to identify the number of factors selected. This cut off point is made by firstly drawing a straight line which summarizes the vertical and the same is followed for the horizontal part of the plot and finally the point where these two lines intersect is marked as the cutoff point. The number of points to the left of the cutoff point is the number of factors selected. Note that the cutoff point is not included in the factor selection. Scree plots are good in using for sample size more than 200 (Field 2009). Kaiser argues that all factors with eigenvalue greater than 1, as this show a good amount of variation, should be selected and this is called the Kaiser’s criterion. However Jolliffe argues that Kaiser’s criterion is too strict and suggests that all factors with eigenvalue greater than 0.7 should be selected. These shows a dramatic increase in number of factors compared to the scree plots. Kaiser’s criterion overestimates the number of factors and is good in using for sample size below 30 with average communality greater or equal to 0.7 and also for sample size above 250 with average communality greater or equal to 0.6. So scree plots are recommended for any other circumstances with sample size more than 200 (Field 2009). 2.6.7 Factor rotation Most variables have high loadings on the important factors while small loadings on the other factors and this make the interpretation difficult. So factor rotation is done to improve the interpretation. This is done by loading the variables intensively on only one factor by rotating the factor axis. There are two types of rotation; orthogonal rotation and oblique rotation (Field 2009).

The influence of chocolate and wafer on customers – An application of Kansei Engineering
17
All factors are independent before rotation. In orthogonal rotation the factors are kept unrelated and independent while rotating factor axis. In oblique rotation the factors are allowed to correlate while rotating factor axis (Field 2009). In SPSS there are choices for selecting the methods in the rotation types. There are three methods in the orthogonal rotation and two methods in the oblique rotation. The varimax method belonging to the orthogonal rotation is a recommended method and type respectively as it has a general approach to simplify the interpretation of factors and also considering the fact that factor is needed to be independent (Field 2009). Comments: The varimax method is used on the rounds for non psychological analysis, and in our case, as there are variables representing the human feelings. According to Schütte, this method is still considered for this thesis work as the factors are needed to be independent and there have been previous accepted studies. Given below is an example of the rotated component matrix table. The missing values in the table are the ones which are neglected as the cut off limit for a non significant factor loading is less than or equal to 0.5 in this case.
Table 3: An example of rotated component matrix
2.6.8 Factor loading selection Based on the factor loading it is important to find which variables are active with the factors. Generally loadings of absolute value greater than 0.3 is interesting but (Stevens 2002) say that the significance of the factor loading depends on the sample size. Steven summarized that for

Theoretical framework
18
sample size 50 a loading of 0.7; for 100 a loading > 0.5; for 200 a loading > 0.36; for 300 a loading > 0.29; for 600 a loading > 0.2 and for 1000 a loading > 0.16 can be significant and these are based on the alpha level of 0.01 (two tailed) (Field 2009). 2.7 Running the Factor analysis using SPSS The following steps are carried out in the SPSS Software:
• The excel data generated by the KESo analyzing software is inputted in the Data View of SPSS Statistics package. The high level Kansei words or variables are labeled and the other parameters are set such as the measure � scale and decimals � 0.
• Now the factor analysis is chosen by following the menu path, analyze � data reduction � factor.
• Now all the variables are selected and transferred, they will be displayed under the
variables box when they are selected. Now the following options are followed as below to achieve the required results in the main dialog box.
• The descriptive tab is selected and opened. The coefficients check box is clicked in
order to get the R-matrix and continue tab is clicked to return to main menu.
• The extraction tab is selected and opened. In this the method chosen is principal components, correlation matrix under analyze is selected, both the display options are clicked and in the extract session eigenvalue over is selected and the number is keyed as 1. The continue tab is clicked to return to main menu.
• The rotation tab is selected and opened. Varimax method is chosen and both the display options are clicked. The continue tab is clicked to return to main menu.
• The options tab is selected and opened. The suppress values below is selected and the
value is entered in the box as 0.5. Continue tab is clicked to return to main menu and ok tab in the main menu is clicked which finally gives the results of the factor analyses.

3. Method and results 3.1 Defining the choice of domain Through the request of Cloetta, the main purpose of this study is set to be based on wafer-based chocolates. This can be further reviewed in section 1.2, problem definition. 3.2 Spanning the semantic space 3.2.1 Collection of Kansei words The collection of Kansei words starts with finding the most basic, so called low level Kansei words. To be able to collect these words it’s important to map out possible sources. With help of the thesis group’s supervisor Schütte the following sources could be stated:
• Company’s homepage • Data from the company • Internet
• Advertisements • Previous costumer surveys
• Consultation with fellow students
The word collection resulted in 75 lower Kansei words, which can be reviewed in Appendix 1. The next task was to group these words. In order to do this there are several methods to choose from. The thesis group decided to use two fellow students in this procedure, both of female gender and with a great appetite for chocolate. This procedure was based on the affinity diagram; refer to the step-by-step method in the theoretical framework section for the instructions used. All the words were written down on post-its and put in a mixed manner on a table. Besides the post-its there were eight A3-papers placed in order for the test group to place and group the post-its. The thesis group members made it clear for the test group about the procedure and while executing the grouping of the lower order Kansei words the thesis group acted as observers, only taking notes from the test group’s discussions, not interfering with the test group except from answering questions and uncertainties that were occurring. It was important for the thesis group not to interfere and communicate with the test group in order to get proper and unbiased results. At the end of the procedure the test group was asked to name the resulting groups. These names could either be new ones or existing words taken from the group. The results of grouping of the lower Kansei words can be reviewed in Appendix 1. The group also took some notes of the direct thoughts from the test group during a small sample-testing of product A1, which can be reviewed in Appendix 5.

Method and results
20
3.2.2 Creating the initial survey Cloetta requested a benchmarking of their products A1 and A2. The thesis group was also told to include two of the most competitive products on the market, according to the company. This statement created two purposes of the survey, one for the thesis group as well as one for the company. The purpose for the thesis group was to get an overview on how Cloetta products were perceived by customers, in this case students, and at the same time it was a part of the process of reducing the number of words to achieve the high level Kansei words which were to be used in the synthesis part of the work. The company’s purpose of the work results was to get a strategic overview on how the different wafer-based chocolates were standing against each other, i.e. where improvements could be made in their own products in order to compete with others. After finding and grouping all the low-level Kansei words the thesis group had to reduce these in order to proceed with the future final survey in the synthesis part of the work. After consulting with the thesis group’s supervisor a selection of the most important and relevant words were made associated with wafer-based chocolates, by the thesis group itself. These words can be found in Appendix 2. Secondly the group was to put all these words in the KESo software. These words were to be evaluated in a one to ten scale based on their importance level with the four different products. Due to certain confidential agreements with the company the products will in this report be referred to as A1, A2, B and C, where A1 and A2 are products of the company and B and C are the competitive products. Three demographic questions were used in the survey; gender (male/female), age (free text question) and hometown (big city/rural). The arguments for why we chose these questions were as follows:
• Gender (male/female) – It is widely known that there are some differences in genders considering chocolate products. Females might have different preferences than males of choosing their kind of chocolate, i.e. some females prefer darker chocolate and vice versa. The thesis group thinks that this might result in valuable analysis results.
• Age (free text question) – The survey study was made at the university with students having an age span between 20- to 26 years (accordingly to Linköping University webpage) but there may always be exceptions why the free text version was chosen, i.e. the participant had to put his/her age manually.
• Hometown (big city/rural) – Previous studies have shown that depending on where people come from have significant differences in data, that’s why the group chose to include this question in the study.
The survey finally consisted of seven pages, three of them consisting of the demographic questions and the remaining ones consisted of the twenty words chosen by the group itself, i.e. one page consisted of 20 words to evaluate one product etc. The chosen words can be viewed in Appendix 2. Now the study was to be carried out in Linköping University,
The influence of chocolate and wafer on customers – An application of Kansei Engineering
21
Campus Valla among students. This decision was based on the following assumptions/criterions: • Students are usually normal or high chocolate consumers, why there shouldn’t be any
significant difference in choosing the profession or area in the survey execution.
• Because it’s a “start-up” benchmarking, mainly in favor for the company, a comparison between four different products due to how people percept these and in our case reducing the number of low level Kansei words, this factor is not so important for the survey.
3.2.3 Survey execution/procedure The survey was carried out at Campus Valla at Linköping’s University in different sections of the university, i.e. LinTEK department and FilFak department, in order to get some variety. The equipment used in the survey procedure was a laptop, 20 chocolate samples of the four different products, disposable plastic cups and water. According to a previous study, (Zhao 2009) water is important to drink in between the test samples to get rid of the old taste. This would emphasize more accurate results in the study. The thesis group members basically went out in the Campus searching and asking students if they wanted to be a part of the survey. The aim was to gather a sum of 20 data inputs from students, divided equally between the genders. Each participant of the study was given clear instructions before starting the survey. When starting with the first sample the participants were given the actual product showed on the page, unaware of what the next product would be. This was important so the participants didn’t get biased and took a side of one product before trying another one, which might have resulted in inaccurate results. Problems which occurred during the survey that can be useful as guidelines for future studies of this kind are mentioned as follows:
• Prepare accurate information for the case study participants in order to eliminate misunderstandings and uncertainty. In the beginning of this case study both thesis group members were confused and diverse about what information to tell the survey participants. The thesis group suggests making a pilot study with one or two persons before starting the actual one to get feedbacks and tips on what could be improved.
• Make sure the participants get the information right in order to solve the task properly. The first couple of participants of the study weren’t sure about how to answer this type of study, because it’s quite new and rare. Some participants were also unsure about some words that were given to evaluate. It’s important for the group members to be present during the whole study with the participants and make it clear for them that you are there for their disposal and to answer questions. The presence of the case study holders might on the other hand disturb the participants’ involvement in the study and some might feel stressed and pressured and therefore misinterpret the questions. In this case the thesis group suggest to try to talk “outside the box” in the beginning to get to
Method and results
22
know the participants more on other bounds and in that way increase a feeling of comfortability.
• Don’t be too optimistic about time. All these factors mentioned above play a great role in achieving qualitative results. In the thesis group’s survey study, the time was underestimated (spent 4 days instead of 2). Every step in a project should have some kind of deadline, but when it comes to open surveys patience is more important and time should be taken with a pinch of salt.
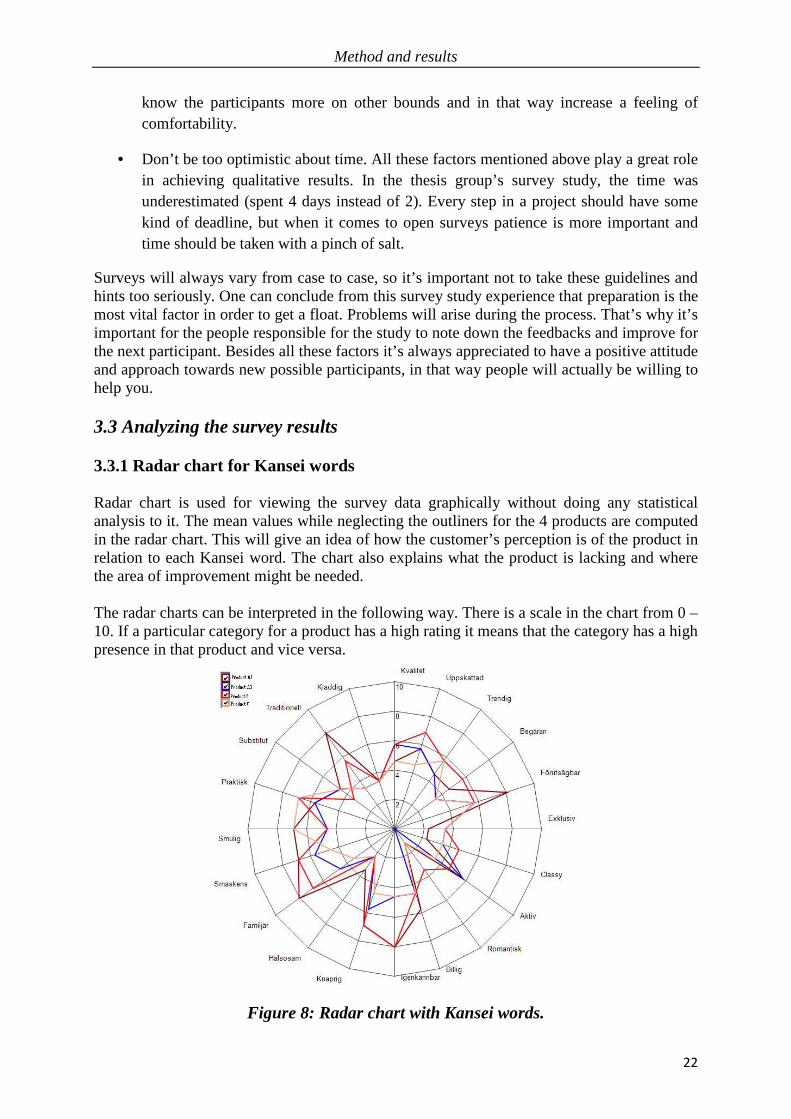
Surveys will always vary from case to case, so it’s important not to take these guidelines and hints too seriously. One can conclude from this survey study experience that preparation is the most vital factor in order to get a float. Problems will arise during the process. That’s why it’s important for the people responsible for the study to note down the feedbacks and improve for the next participant. Besides all these factors it’s always appreciated to have a positive attitude and approach towards new possible participants, in that way people will actually be willing to help you. 3.3 Analyzing the survey results 3.3.1 Radar chart for Kansei words Radar chart is used for viewing the survey data graphically without doing any statistical analysis to it. The mean values while neglecting the outliners for the 4 products are computed in the radar chart. This will give an idea of how the customer’s perception is of the product in relation to each Kansei word. The chart also explains what the product is lacking and where the area of improvement might be needed. The radar charts can be interpreted in the following way. There is a scale in the chart from 0 – 10. If a particular category for a product has a high rating it means that the category has a high presence in that product and vice versa.
Figure 8: Radar chart with Kansei words.

The influence of chocolate and wafer on customers – An application of Kansei Engineering
23
3.3.2 Interpretation of Radar chart for Kansei Words The following comments are made based on the interpretation of the above radar chart for the Kansei words. Product A1: The strengths of this product are Traditional, Predictable, Recognizable and Familiar. The weak words are Exclusive, Classy and Romantic. This shows that the product is very common among people, easy to find in the shops but this is not a luxury product, something which can’t be gifted or can’t be shared with your partner. Product A2: The strongest words of this product are Active, Quality and Appreciated. The weak words are Romantic, Healthy and Desire. This shows that the product creates a first impression on the buyer either from its name or packaging but didn’t satisfy its purpose. It might also be considered to be consumed occasionally. Product B: The strongest words of this product are Recognizable, Appreciated, Familiar, Yummy and Practical. The weak words are Healthy, Sticky, and Substitute. This shows that the product is very common, most preferred but it may cause some inconvenience to the consumers in the usage aspect. Product C: The strongest words of this product are Crumble and Practical, The weak words are Romantic and Healthy. Overall it shows that the product is not that popular even though it has some likeness from the consumers in the practical aspect and of its taste. 3.3.3 Comparison of all products or Benchmarking By doing an overall comparison it can be seen that Product A1 and Product B have been dominating in the majority of the category whereas Product A2 and Product C are less effective within the category. An improvement to the particular category of the product can be done by comparing with another product which has a better standing in that category and taking the qualities of that product. For example, it is seen that all the products except Product B did not get a good rating for Romantic. It has been analysed that wafer-based chocolates doesn’t trigger a romantic feeling, however the packaging colour of Product B played a big role in this category.

Method and results
24
3.3.4 Mean Value Charts for Kansei words These charts provide a better importance level for the Kansei words compared to the radar charts above. The charts for the four products are as follows.
Figure 9: Histogram of the mean value for product A1.
Figure 10: Histogram of the mean value for product A2.

The influence of chocolate and wafer on customers – An application of Kansei Engineering
25
Figure 11: Histogram of the mean value for product B.
Figure 12: Histogram of the mean value for product C. 3.4 SPSS Factor Analysis All the gathered data from the KESo software was put in excel files which can be seen in Appendix 3. These data were analyzed in the statistical software program SPSS. The extended results can be reviewed in Appendix 4. 3.5 Interpreting the factor analysis from SPSS 3.5.1 Sample Size Sample size is an important aspect as it gives the reliability to factor analysis. The sample size we chose to be tested on was 20 people. This is a satisfying amount of sample size as the accepted number to run the factor analysis is between 10 to 15 people (Field 2009). In general a recommended minimum sample size is 300 in order to have an effective factor analysis as it is discussed by many researchers because the correlation coefficients fluctuates with small sample size but if the communalities of the variables are above 0.6 then a sample

Method and results
26
size (normally below 100) is acceptable. In our case the communalities of all the variables in the 4 products which were analyzed are above the value of 0.6, see Appendix 4. 3.5.2 Factor Selection
3.5.2.1 Kaiser’s criterion Kaiser’s criterion for factor with eigenvalues greater than 1 is used to make the number of factor selection. This method is chosen mainly because of our low sample size and because the average communality value is greater than or equal to 0.7, see Appendix 4. The factor selection is viewed in the table called Total Variance Explained, in Appendix 4, which basically has three categories; factor before extraction, after extraction and after rotation. The interesting category to view is the factor after rotation were else the others are just displayed to give the reader a comparison and idea of information from SPSS and is irrelevant for this study. In the session Extraction Sum of Squared Loadings it is seen that the displayed eigenvalues and its variance percentage are generally very high for the first few factors, and comparing this to the Rotation Sum of Squared Loadings the eigenvalues and its variance structure are optimized and it is more equalized, see Appendix 4.
3.5.2.2 Scree Plots Scree plots are also generated in order to have a comparison with Kaiser’s criterion but this method is invalid because of our low sample size. 3.5.3 Communalities The table of communalities shows before and after extraction of each variable. Note that the principal component analysis assumes that all the variance is common so for the case before extraction the communalities are all 1. After extraction would give the amount of common variance that a variable can have with all the other variables. To carry out the factor selection using Kaiser’s criterion with eigenvalues greater than 1 it is a requirement that the average communality value is greater than 0.7, and for the sample size which are below 100 to be used in factor analyses it is a requirement that the communalities of all the variables are above 0.6, see Appendix 4. 3.5.4 Factor Rotation and Factor Loading Selection Orthogonal rotation with the varimax method is chosen for this case to keep the factors independent. A cut off point to hide the factor loading less than or equal to 0.5 is keyed as recommended by Schütte. This is because the values are a too low significant taking into account of the study’s low sample size. In the picture below, a Rotation Component Matrix is presented. Sometimes a variable can have two or more significant factor loadings because the interval between these can be very low, and one therefore has to take the higher values into account which are highlighted below.
The influence of chocolate and wafer on customers – An application of Kansei Engineering
27
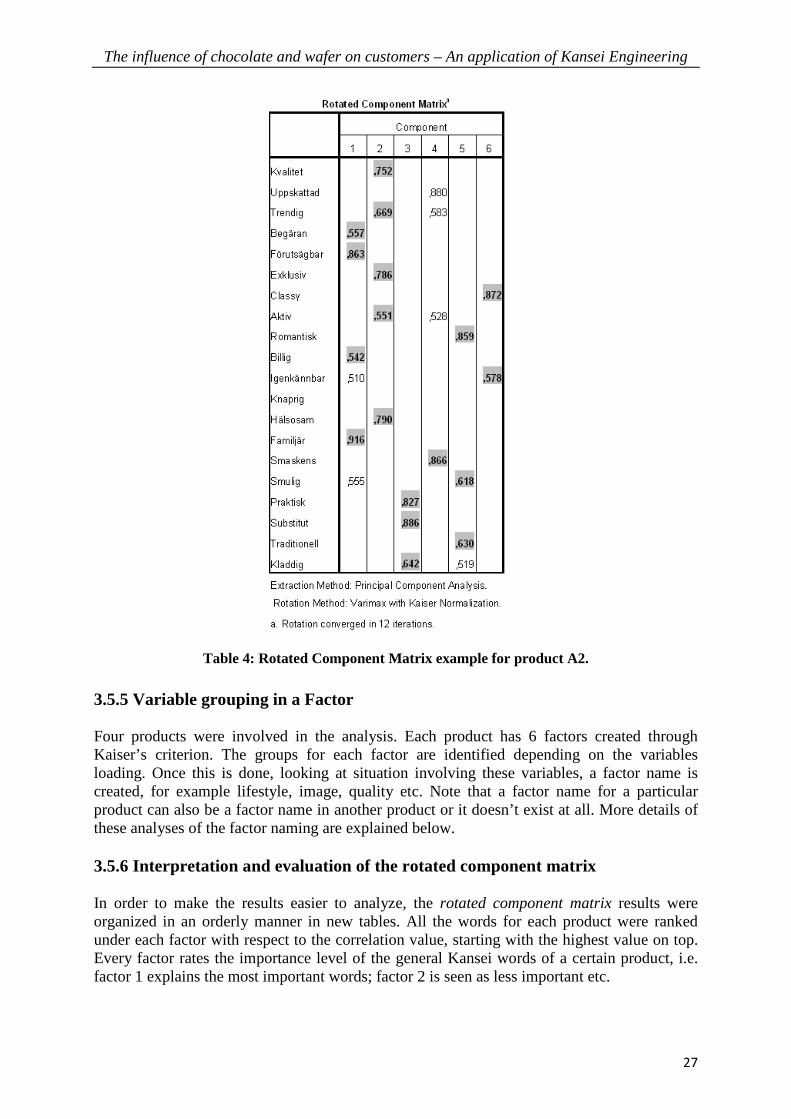
Table 4: Rotated Component Matrix example for product A2.
3.5.5 Variable grouping in a Factor Four products were involved in the analysis. Each product has 6 factors created through Kaiser’s criterion. The groups for each factor are identified depending on the variables loading. Once this is done, looking at situation involving these variables, a factor name is created, for example lifestyle, image, quality etc. Note that a factor name for a particular product can also be a factor name in another product or it doesn’t exist at all. More details of these analyses of the factor naming are explained below. 3.5.6 Interpretation and evaluation of the rotated component matrix In order to make the results easier to analyze, the rotated component matrix results were organized in an orderly manner in new tables. All the words for each product were ranked under each factor with respect to the correlation value, starting with the highest value on top. Every factor rates the importance level of the general Kansei words of a certain product, i.e. factor 1 explains the most important words; factor 2 is seen as less important etc.

Method and results
28
Next step was to increase the level of the Kansei words, which is giving a name for each factor. All the tables for each product with the corresponding names are presented below. Tables 1 to 4 are showing the new tables created for each product in the way mentioned above. The words with square brackets are words repeating among the factors but have the lower value. The chosen names for the factors are placed below the arrows. In some of these factors there were several names considered and why the final word is underlined. These Kansei words are considered as the highest level words or general Kansei words and are essential for further work in this study. 1 2 3 4 5 6 Begäran (0.939) Trendig (0.91) Smaskens (0.75) Uppskattad (0.705) Classy (0.655) Exklusiv (0.602) Knaprig (0.560) [Romantisk (0.524)]
Aktiv (0.769) Igenkännbar (0.732) Romantisk (0.719) Kvalitet (0.679) Kladdig (0.661)
Substitut (0.924) Förutsägbar (0.892) Hälsosam (0.623) [Smulig (0.554)]
Praktisk (0.872) Billig (0.663)
Familjär (0.909) Smulig (0.649) [Billig (0.538)]
Traditionell (0.845) [Exklusiv (0.556)]
Lifestyle Preferable /
Favorable / Appearance
Instant / On-the-go
Cost-effective (Complexity)
Disadvantage Occasional / Uniqueness
Table 5: Factor analysis for product A1
Product A1 characteristics: lifestyle, appearance, instant, complexity, disadvantage and uniqueness. From the table and the chosen general Kansei words below one may interpret and describe the values of the products by him/her. Because this material is to be handed in for the company and the general Kansei words may be revised again, the group does not consider any more work to be done here. However an example of an interpretation/conclusion made for product A1, made by the thesis group itself, may look as following: Conclusion: Product A1 is a well-known product and highly considered as a part of the target groups’ lifestyle. Its active appearance and low complexity may mainly suit consumers who are on-the-go. The test group was familiar with the high crumbliness which can be seen as a disadvantage and to be considered for the manufacturer.

The influence of chocolate and wafer on customers – An application of Kansei Engineering
29
1 2 3 4 5 6 Familjär (0.916) Förutsägbar (0.863) Begäran (0.557) Billig (0.542) [Smulig (0.555)] [Igenkännbar (0.510)]
Hälsosam (0.790) Exklusiv (0.786) Kvalitet (0.752) Trendig (0.669) Aktiv (0.551)
Substitut (0.886) Praktisk (0.827) Kladdig (0.642)
Uppskattad (0.880) Smaskens (0.866) [Trendig (0.583)] [Aktiv (0.528)]
Romantisk (0.859) Traditionell (0.630) Smulig (0.618) [Kladdig (0.519)]
Classy (0.872) Igenkännbar (0.578)
Appearance Lifestyle Instant / On-
the-go Rewarding Occasional Uniqueness
Table 6: Factor analysis for product A2
Product A2 characteristics: appearance, lifestyle, instant, rewarding, occasional and uniqueness. 1 2 3 4 5 6 Hälsosam (0.854) Kvalitet (0.852) Classy (0.781) Smaskens (0.775) Begäran (0.690) Exklusiv (0.686) Knaprig (0.663) Förutsägbar (0.525) [Romantisk (0.601)]
Substitut (0.843) Igenkännbar (0.743) Aktiv (0.543) [Begäran (0.524)] [Praktisk (0.513)] [Förutsägbar (0.506)]
Billig (0.846) Kladdig (0.640) Smulig (0.597) Familjär (0.536)
Uppskattad (0.797) Romantisk (0.668) [Kladdig (0.548)]
Traditionell (0.874) Praktisk (0.587)
Trendig (0.865)
Appearance (Presentable)
Instant / On-the-go
Disadvantage Rewarding Uniqueness Lifestyle
Table 7: Factor analysis for product B
Product B characteristics: appearance, instant, disadvantage, rewarding, uniqueness and lifestyle.

Method and results
30
1 2 3 4 5 6 Exklusiv (0.880) Classy (0.842) Kvalitet (0.669) Smulig (0.667) Trendig (0.569)
Praktisk (0.767) Substitut (0.750) Begäran (0.730) Igenkännbar (0.659) [Smaskens (0.541)]
Hälsosam (0.834) Romantisk (0.794) Uppskattad (0.755) Smaskens (0.557) [Aktiv (0.572)] [Kvalitet (0.556)]
Billig (0.903) Familjär (0.746) Aktiv (0.589) [Smulig (0.574)] [Trendig (0.503)]
Traditionell (0.865) Kladdig (0.771)
Förutsägbar (0.950) Knaprig (0.879)
Lifestyle / Quality
Instant / On-the-go
Presentable
Preferable / favorable
Uniqueness
Rewarding
Table 8: Factor analysis for product C
Product C characteristics: lifestyle/quality, instant, presentable, preferable, uniqueness and rewarding.
• Lifestyle • Appearance • Instant • Complexity • Disadvantage • Preferable
• Uniqueness • Rewarding • Occasional • Quality • Presentable
These words were further reduced because of their close relation to each other. The explanations for these reductions are given further below in the chosen described words. The general Kansei words which are chosen to be used for the synthesis step are listed below.
• Preferable • Lifestyle • Disadvantage • Rewarding • Quality
The above five words mostly represent the highest factors in the factor analysis of the wafer based chocolate products. Preferable: It shows the worthiness of a specific product. Preferable can be closely related with other general Kansei words such as Appearance and Presentable. Some of the low level Kansei words which are associated with Preferable are Handy, Desire and Sufficient etc. Lifestyle: It relates the specific product with a broad category that represents the mode of living. This category can be habits, attitudes, tastes, economic level etc. Lifestyle can be

The influence of chocolate and wafer on customers – An application of Kansei Engineering
31
closely related with other general Kansei words such as Instant, Complexity and Uniqueness. Some of the low level Kansei words which can be related to Lifestyle are Trendy, Exclusive and Classy etc. Disadvantage: It represents all unfavorable aspects for the specific product. It is the result of a negative feedback. Some of the low level Kansei words which are associated with Disadvantage are Sticky, Boring and Melting etc. Rewarding: It shows the satisfaction achieved from the specific product. Some of the low level Kansei words which can be related to Rewarding are Happiness, Yummy and Desire etc. Quality: It shows the superiority and excellence of a specific product. Some of the low level Kansei words which are associated with Quality are Healthy, Substitute and Tasty etc. 3.6 Spanning the space of properties The proposed model “spanning the space of properties”, by Schütte, is a general guideline to be used and may be neglected if the project already has specific properties. Because of the general question asked from the company in the beginning; “What kind of feelings trigger more chocolate with customers considering the two wafer-based chocolates?”; the thesis group along with Schütte and the supervisor at Cloetta, Emma Raaschou, decided to put special emphasize on the number of wafers and on the amount of chocolate, because these are the main parts contributing to the whole of a wafer-based chocolate and will therefore be considered as properties in this thesis work. 3.6.1 Additional improvement study During the first survey execution, the thesis group included an additional survey which consisted of different properties concerning wafer-based chocolates. The purpose behind this additional study was to get a basic overview of what people thought was important to them when it comes to wafer-based chocolates. The words were collected in collaboration with fellow students and by looking up information on all kinds of wafer-based chocolates in the market. The collection of the property words can be seen in Appendix 6. This survey resulted in 17 participant answers (10 females and 7 males) and can be seen below in the radar chart created by KESo.

Method and results
32
Figure 13: Radar chart showing the importance of each property. While doing this analysis the group created a column diagram with the mean value in relation to the property words. Taking the mean values gives a better view of how it really looks like, compared with the radar chart which is also based on mean values while omitting the outliners, giving high fluctuation, and might therefore give more valuable interpretations in this case. A histogram of the mean value vs. the property words is presented below.
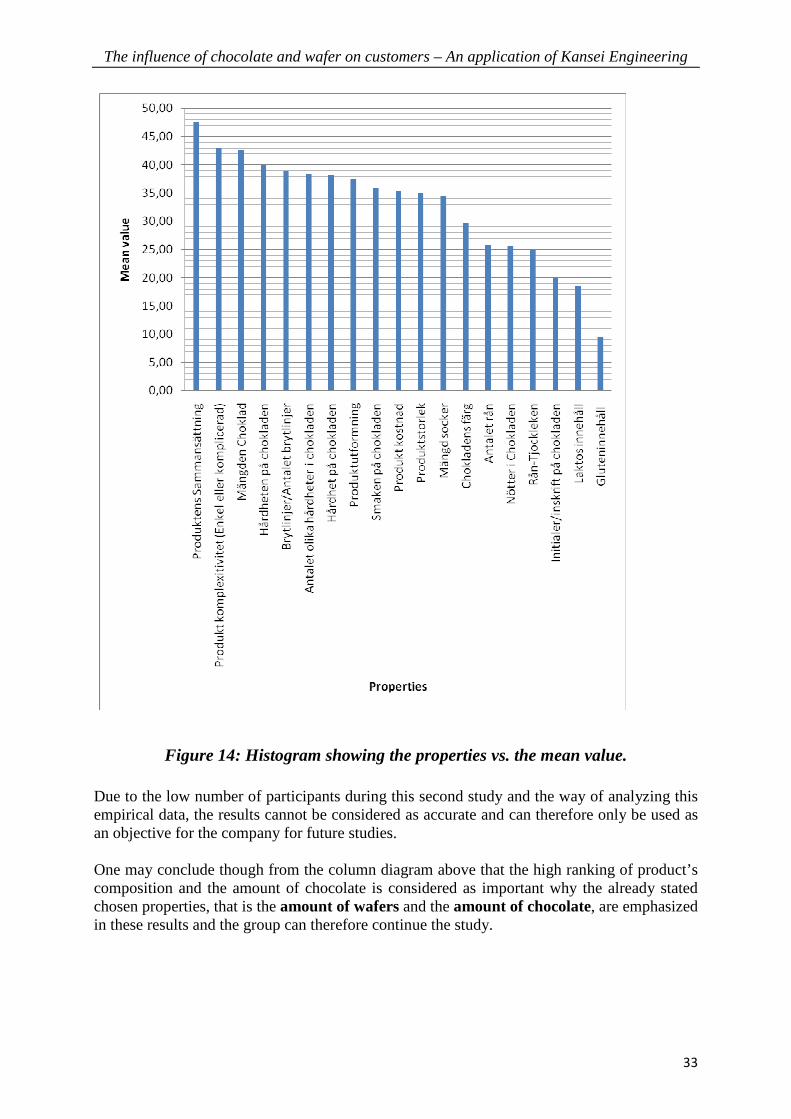
The influence of chocolate and wafer on customers – An application of Kansei Engineering
33
Figure 14: Histogram showing the properties vs. the mean value. Due to the low number of participants during this second study and the way of analyzing this empirical data, the results cannot be considered as accurate and can therefore only be used as an objective for the company for future studies. One may conclude though from the column diagram above that the high ranking of product’s composition and the amount of chocolate is considered as important why the already stated chosen properties, that is the amount of wafers and the amount of chocolate, are emphasized in these results and the group can therefore continue the study.

Method and results
34
3.7 Synthesis 3.7.1 Concept design – the proposal As mentioned before, the aim of the study is to get an understanding what feelings trigger different amount of chocolate and wafers in wafer-based chocolates, mainly to get an idea how the company’s products A1 and A2 stand against each other. In this part the thesis group was to design new chocolate concept samples to be made for the final study. The proposal and design made for the company is described below. 3.7.2 Chocolate thickness variety To decide the amount of chocolate in each variety we used products A1 and A2 as guidelines, considering the chocolate coating thickness. This assumption was made because product A2 is overall perceived as more “chunky” and product A1 is kind of “airy”, why the thesis group decided to use A1 as the lighter version of chocolate amount and vice versa. To make the new product concepts, the group wanted to keep the same structure of each sample. Because the product A2 has a cross-section similar to a trapezoid, the next step was to measure the amount of chocolate in order to state what the equally distributed chocolate thickness was. The transformation is seen below. The main idea of this transformation was to get an easy-to-make product while still keeping the same amount of chocolate coating in the cross-section.
Figure 15: Transformation of product A2.
Wafers with contents
Transformation
Product A2 New concept
Chocolate coating Chocolate covering (with
equally distributed thickness)

The influence of chocolate and wafer on customers – An application of Kansei Engineering
35
The measurement results gave an overall cross-sectional chocolate covering area of . While implementing the area to the rectangular new concept seen below the group faced difficulties in stating the width of the new cross-section, because it was showing decimals. After small changes and some assumptions the group concluded that the large chocolate coating thickness would give an equally distributed chocolate covering of 3 mm. (It gives a total chocolate coating of ). 3.7.3 Wafer variety The group considered that the”wafer with contents” size doesn’t matter (Up to the engineers at the factory to decide). The amount of wafers is important though, and the group chose after consultation with Schütte that the number 3, 4 and 5 should be relatively good varieties to include in this test, though less number of wafers would be considered as too less. A very simple proposal on how the cross-sectional area with the product piece, in this example product A2 after transformation, would look like is shown below:
Figure 16: Product proposal after transformation. The varieties in chocolate coating thickness and number of wafers are shown in the following tables:
Less Medium Large
1 2 3
Table 9: Proposed chocolate coating thickness in each variety.
Less Medium More
3 4 5
Table 10: Proposed number of wafers in each variety
Chocolate covering (with equally distributed
thickness)
Wafers with contents
26
20
15

Method and results
36
3.7.4 Summary The group came up with 9 models of chocolate concept samples of which two represented the existing product A1 and A2 and the remaining seven models were new products. The table below shows all the varieties that would be used in the final study. Because of the large amount of chocolate in product A2 and the number of wafers (3) one may position A2 as a product with Large amount of chocolate with the Less amount of wafers (seen as product 7 in the table below). For product A1 however, the number of wafers (3) and less chocolate covering (approx 1 mm thickness) one may position A1 as a product with Less amount of chocolate and with the Less amount of wafers (seen as product 1 in the table).
Table 11: Summary table of the amount of chocolate and wafer variety
Though the aim was to have a number of 20 participants in the final survey study, 20 samples from each product would be needed with a total request for 20x9 = 180 products. 3.8 Chocolate concept building From the beginning of this thesis work the group had to work from the university since the company was not able to provide working space and also considering the traveling distance from Linköping to Ljungsbro. The company was very supportive in helping the group to answer questions, arranging meetings and providing test samples in time. The group requested the company to get the samples proposed and as well create the new product designs to be used in the final survey study to see how they will be perceived by the study participants. Due to the work load of the product developers in the company, they asked whether the thesis group could make the prototypes on their own in the premises of the company and with the support of a product developer. The group took this opportunity as a valuable experience. It was one of the most interesting parts of this thesis work.

The influence of chocolate and wafer on customers – An application of Kansei Engineering
37
The group spent one complete day in the company. The group was introduced to the product developers as well as with the process engineers and was taken to the new and old production line for product A1 where the production people were introduced. The following procedure steps for making a typical wafer-based chocolate (A1) can be simply summarized as follows:
• First the wafer bathers are mixed, baked into wafers, moisturized to make them more stiff and fixed to each other through a chocolate layer in between (product A1 and A2 used three layers of wafer).
• The wafers are later cut down into the required size.
• Thirdly the wafer blocks are covered with chocolate and then cooled down in a cooling tunnel.
• Finally the finished chocolate blocks are wrapped and arranged in cartons for shipment.
The whole production line is automated using state of the art machines and the whole manufacturing process time is noted to be really fast and precise. The process engineer helped the group in making the 4 and 5 wafer blocks and the production line made the 3 wafer blocks by default. The 4 and 5 wafer blocks were manually cut by the group in the product developer’s lab to a required sample size using knife and stapler.

Method and results
38
Figure 17: Wafer blocks.
Figure 18: Manual cutting area.
Figure 19: Cutting away the edges.
These manually cut wafers were later taken into the production line for the chocolate coating and the procedure went as follows:
• For the combination of 3 wafer blocks the ones with 1 mm of chocolate covering was already made (default product A1). To get the 2 and 3 mm thicknesses of chocolate covering the default product was put into the chocolate covering one and two times respectively. It has to be noted that the chocolate prototypes with 3 mm of chocolate thickness was to be cooled down one more time because of the large amount of chocolate.
• For the combination of 4 and 5 wafer blocks the procedure went down as mentioned, but in order to get all 3 kinds of thicknesses, the group had to put the chocolate prototypes one more time into chocolate covering procedure (because of the manually created plane wafer-blocks used).

The influence of chocolate and wafer on customers – An application of Kansei Engineering
39
All the samples were picked up after the cooling process and packed into plastic containers with their respective specifications. The final survey study with the new chocolate samples was now able to be carried out. 3.9 Final survey The second and final survey was constructed in the same way as the first one, except with less number of words (described at the end of section Interpretation and evaluation of the rotated component matrix) and more numbers of chocolate samples (9). The survey covered a number of 20 participants; 10 males and 10 females, and was carried on with students of Linköping’s University in batches of four participants at a time. After every finalized batch, the participants were questioned to give feedbacks about the survey, the Kansei words used and the overall impression of the chocolate samples. 3.9.1 Feedbacks about the survey The KESo survey was several times experienced as complicated to follow; the large amount of chocolate samples (9) the participants had to taste made some confusion because they wanted to compare them with the previous ones tasted etc. Most of the suggestions on how the participants would like the survey to look like were to make the survey into 5 pages; to evaluate each nine products with one word at a time. This would make the comparison between the products much easier. On the other hand one have to have in mind that there were 9 products to evaluate, and therefore there might have been too much chocolate for the participants to consume at the end, i.e. the participant would be overfilled with chocolate and may therefore not complete the survey. A general explanation why the thesis group used the chosen survey is that the survey is based on Kansei methodology, which means that the participant should not be able to go back and compare answers but choose his/her answers by feeling and make first impression judgments. 3.9.2 Feedbacks about the Kansei words used The Kansei words were explained to the survey participants before initiation and examples on how the words could be interpreted were given. Despite this, due to the complex words chosen, there occurred some confusion and questions from participants at times. The word “Lifestyle” was specifically questioned. This was because as some participants quoted; “Lifestyle can vary a lot and some chocolate samples may be more appropriate to certain situations than others”. 3.9.3 Feedbacks about the chocolates samples After each survey questions were asked to the participants about their experiences and impressions from eating the given chocolate samples. The most repeating feedbacks were noted down as follows:
• Most repeated feedback no.1: The thickest samples were experienced too thick (too filling). Also the taste was experienced to differ among the different samples

Method and results
40
which might have to do with the amount of chocolate coating. The favorite chocolate samples were the ones with middle size (this was recognized by most of the participants). The regular product A1 was sometimes considered as a favorite due to its neutral amount of wafers and small amount of chocolate.
• Most repeated feedback no.2: Some females preferred the thicker samples; “Thicker samples are experienced as more luxury and more filling than the thin ones”. Some of the males preferred the smaller samples; “The thick samples were experienced as too big, chunky and unhealthy”.
• Most repeated feedback no.3: Commented that he never buys product A1 because of it crumbliness and cheap appearance. On the other hand some people noted that the thicker chocolate samples could be more suitable for special occasions, i.e. “fika” and coffee.

The influence of chocolate and wafer on customers – An application of Kansei Engineering
41
3.10 KESo results 3.10.1 QT-I Linear Regression
Figure 20: A proposed model on Kansei Engineering

Method and results
42
Kansei Words
MCC MCC2 PCC Category Score (CS)
W C No. of Wafers Amount of Chocolate
3 4 5 1 2 3 Preferable 0.87 0.76 0.86 0.56 0.19 0.23 -0.42 -0.17 0.09 0.08 Rewarding 0.76 0.58 0.70 0.54 -0.02 0.29 -0.27 -0.18 -0.02 0.19 Quality 0.91 0.83 0.87 0.82 0.15 0.23 -0.38 -0.27 -0.01 0.27 Disadvantage 0.71 0.50 0.50 0.64 0.04 -0.22 0.18 0.16 0.17 -0.33 Lifestyle 0.92 0.85 0.91 0.72 0.38 0.09 -0.47 -0.12 0.24 -0.11
Table 12: Summary of the QT-I analysis
Where MCC – Multiple Correlation Coefficients, MCC2 – Squared Multiple Correlation Coefficients, PCC – Partial Correlation Coefficient, CS – Category Score, W – Wafers, C – Chocolates. The MCC values are one of the most important information; it measures the overall accuracy of the regression equation. The value falls from the range of zero to one in which zero indicates no correspondence and one indicates a perfect fit. The MCC value represents the R-value in regression analysis. Nishino states that the MCC2 values greater than 0.5 is satisfactory for the Kansei engineering study. In this case the values of MCC2 for all the Kansei words except Disadvantage are greater than 0.5, but because of the low amount of words used in this study, this statement can be neglected according to Schütte. The PCC values give the relative importance of an item for the certain factor. The CS values show the direction and to what extend the Kansei word is affected by a certain category. The following conclusion can be drawn based on the PCC and CS values presented in the table above:
• To have a strong preferable impression, 4 number of wafer with 2 mm/3 mm thickness chocolate is chosen according to the PCC and CS values presented in the table above.
• To have a strong rewarding impression, 4 number of wafer with 3 mm thickness chocolate is chosen.
• To have a strong quality impression, 4 number of wafer with 3 mm thickness chocolate is chosen.
• To have a strong lifestyle impression, 3 number of wafer with 2 mm thickness chocolate is chosen.
• To have a strong disadvantage impression, 5 number of wafer with 2 mm thickness chocolate is chosen.
It is seen that for all the Kansei words the wafer property is more important than the chocolate property as the PCC values are greater for the wafer compared to the chocolates. On the other

The influence of chocolate and wafer on customers – An application of Kansei Engineering
43
hand, a strong disadvantage impression triggers when the wafer amount is much more than the chocolate amount. From the above point’s one may conclude that a possible future product can have 4 number of wafer with 3 mm thickness chocolate which will trigger the impression preferable, rewarding and quality and 3 number of wafer with 2mm thickness chocolate will trigger the impression lifestyle. The other method called RSA, which was described in the theoretical framework, is not feasible in this study because the sample size (20) is too low. 3.10.2 Radar Chart The summary of the radar chart for the nine products are given in the table below. For more detailed view of the radar chart see Appendix 8 Product No (Wafer size & Choco amt.)
Preferable Rewarding Lifestyle Disadvantage Quality
Prod 1 (3 layer & 1mm)
5.8 5.8 5.7 4.8 7
Prod 2 (4 layer & 1mm)
5.8 7 5.7 3.6 7
Prod 3 (5 layer & 1mm)
5.8 5.8 4.8 4.8 5.8
Prod 4 (3 layer & 2mm)
7 7 5.8 4.6 7
Prod 5 (4 layer & 2mm)
7 5.8 5.8 4.6 7
Prod 6 (5 layer & 2mm)
5.8 5.8 4.6 4.6 5.8
Prod 7 (3 layer & 3mm)
5.8 6.8 5.8 4.6 6.8
Prod 8 (4 layer & 3mm)
5.8 7 4.6 3.4 7
Prod 9 (5 layer & 3mm)
5.8 5.8 4.8 3.4 7
Table 13: Summary of the radar chart for the nine products
The following conclusions can be drawn by looking at the table above.
• It is seen that the moderate amount of chocolate triggers the preferable impression while the number of wafer layer vary between less and moderate.
• A moderate number of wafer layers triggers the rewarding and lifestyle impression while the amount of chocolate is not of much importance here.
• The disadvantage impression is less for the products with large amount of chocolate and more wafer layers.
• For a quality impression, there is no specific influence on the amount of chocolate or number of wafer layer. Its strength is evenly distribution over the variety of products.

Method and results
44
Therefore, the results from the radar chart closely matches the results of QT1 regression analysis that the most preferable product by the customers have moderate number of wafer layers (4 layers) and a large to moderate amount of chocolate (3 mm thickness). 3.11 Test of validity One can conclude from the feedbacks discussed above in the section 3.9 Final Survey, that most individuals have a significant variety in choosing their chocolate in sense of the chocolate amount and the amount of the wafers. The selection of chocolate is also highly dependent on the situation the actual individual is in. When the participants were asked what chocolate sample they would choose, the majority answered that the middle sized product was preferred. This product was recognized with 4 number of wafer with 3 mm thickness chocolate by the thesis group.
3.12 Model building The recommendations from the study are presented to the company and it is the company’s decision to carry out the production of this new product development.

4. Conclusions The first survey of the study gave a clear explanation of how the product A1 and product A2 are perceived by the chocolate consumers. The resulting radar chart described the strength and the weaknesses of these two products in question and also with other competing products. However most of the feelings are not perceived in the same way as different individuals have different preferences of choosing their favorite wafer-based chocolates. From the QT1 analysis the feelings which trigger more chocolates and moderate layers of wafer in the wafer based chocolates are preferable, rewarding and quality. The emotional experience between the products with more amount of chocolate and less number of wafers is perceived as a lifestyle where else with less amount of chocolate and large number of wafers is perceived as a disadvantage. There haven’t been many Kansei Engineering studies in the food industry field yet. That’s why much planning and consultation efforts in every new step and closure phase have been made in the project. The Kansei words, mainly adjectives, which were developed in the early stage of this work and later reduced, might also be questioned. Increasing the level of Kansei words should be seen as an iterative process for constant improvement. In Factor Analysis one has to be aware of its background information in choosing the method in order to carry out the evaluations such as the technique, factor extraction method and significant factor level. There is a need for understanding the analysis method and its limitations in order to achieve satisfying results. The low sample size of 20 participants for the survey studies has been argued. Generally a sample size of 300 is recommended for statistical studies however according to Field (2005) a low sample size is acceptable if it the variables are above 0.6 in the communality. The decision to choose a low sample size was based on limitations of the company to offer product samples and because of the thesis group’s time limits.

Conclusions
46

5. References Bergman, B. and Klefsjö, B. (1994), “Quality” Studentlitteratur, Lund. Field, A. (2005), “Discovering Statistics using SPSS” (2nd ed.) Sage Publications Ltd, London Field, A. (2009), “Discovering Statistics using SPSS” (3rd ed.) Sage Publications Ltd, London Linköping University webpage providing details for demographic session: www.ida.liu.se/~732G81/B6.docx Stevens, J. P. (2002), “Applied multivariate statistics for the social sciences” (4th ed.). Hillsdale, NJ: Erlbaum. Jolliffe, I. T. (1986), “Principle component analysis” New York: Springer Lindberg, A. (2004), “First Impressions Last – A Kansei Engineering Study on Laminate Flooring at Pergo” Linköpings Universitet, Linköping Mori, N. (1998), “Chain-like Structure which appear in Casual Reasoning concerned with Human “Kansei” words – Study on Basic Framework of Design Assist System using “Kansei” Engineering” Report Tokyo Institute of polytechnics, Department of Design, Faculty of arts, Tokyo. Mori, N. (2002). Rough Set Approach to product Design Solution for the Purposed “Kansei”. The Science of Design Bulletin of the Japanese Society of Kansei Engineering, vol. 48, p. Nagamachi, M. (1989). “Kansei Engineering” Kaibundo, Tokyo. Nagamachi, M. (1997a). Kansei Engineering: The Framework and Methods. Kansei Engineering 1, Nagamachi, M. (ed.), Kaibundo Publishing Co. Ltd., Kure, pp. 1-9. Nagamachi, M. (2001), Workshop 2 on Kansei Engineering, Proceedings of International Conference on Affective Human Factors Design, Singapore, 2001, p. Nagasawa, S. y. (2002). Kansei and Business. Kansei Engineering International- International Journal of Kansei Engineering, vol. 3, p. 2-12. Pawlak, Z. (1997). Rough Sets. Rough Sets and Data Mining, Lin, T.Y. and Cerone, N. (ed.), Kluwer Academic Publishers, Boston, pp. PUM-Grupp 6, “KESo user manual” Linköpings Universitet, Linköping Schütte, S.T.W. (2002). Designing Feeling into Products-Integrating Kansei Engineering Methodology in Product Development. Institute of Technology, Linköping, Linköpings university. Schütte, S. (2005), “Engineering Emotional Values in Product Design – Kansei Engineering in Development” Linköpings Universitet, Linköping

References
48
Schütte, S and Eklund, J. (2005), “Design of Rocker Switches for Work-Vehicles – An Application of Kansei Engineering” Applied Ergonomics Zhao, Y. (2009), “Developing a wafer with customer amenity – An application of Kansei Engineering” Linköpings Universitet, Linköping

Appendix Appendix 1: The gathered Low Order Kansei words in English (Swedish) .............................. 2 Appendix 2 – List of words chosen for the first survey ............................................................. 4 Appendix 3 – KESo Analysis – Results of Product A1, A2, B and C ....................................... 5 Appendix 4 – Factor analysis results for Product A1, A2, B and C ........................................... 9 Appendix 5 - Some direct thoughts from the test group during sample-testing of product A. 49 Appendix 6 – KESo Analysis – Results of Properties ............................................................. 50 Appendix 7 – List of property words chosen for the first survey (additional) ......................... 51 Appendix 8: Radar charts for the prototypes used in the final survey ..................................... 52
Appendix
2
Appendix 1: The gathered Low Order Kansei words in English (Swedish)
The bold-marked words are the ones used in the first survey.
Memories, (Minnen) On-the-go, (På gång) Luxury feeling, (Känsla av Lyx)
• Finger-licking (Slicka fingrarna)
• Yummy (Smaskens) • Familiar (Familjär) • Joy (Glädje) • Appreciated
(Uppskattad) • Revitalizing (Upplivande) • Desire (Begäran) • Funny (Rolig) • Mouth watering (Vattnas i
munnen) • Craving (Begäran/Åtrå) • Predictable, Positive
(Förutsägbar) • Traditional (Traditionell) • Retro • Well-known (Välkänd) • Recognizable
(Igenkännbar)
• On-the-go (På gång) • Handy (Praktisk) • Desire (Begäran) • Cheap (Billig) • Fast (Snabb) • Effective (Effektiv) • Size (Storlek) • Uncomplicated
(Okomplicerad) • Simple (Enkel) • Healthy (Hälsosam) • Mobile (Transportabel) • Bity (Bitig) • Active (Aktiv) • Nourishes (Ger näring)
• Exclusive (Exklusiv) • Natural (Naturlig) • Unique (Unik) • Dark (Mörk) • Famous (Känd) • Smell (Lukt) • Scent (Doft) • Tender (Fin) • Aroma (Arom) • Lingering taste
(Kvarvarande smak) • Happy (Glad) • Reward (Belöning) • Quality (Kvalitet)
Immediate associations (First impression when thinking of wafer-based chocolate), (Omedelbar association (Första intrycket man får när man tanker på rånbaserad choklad))
Future, (Framtid) When wafer-based chocolate is Boring (Negative), (När rånbaserad choklad är tråkig (Negativt))
• Soft (Mjuk) • Satisfying
(Tillfredsställande) • Tasty (Smaklig) • Handy (Praktisk, enkel) • Sweet (Söt) • Mouth watering (Vattnas i
munnen) • Happiness (Lycka) • Good (God) • Crispy (Knaprig) • Substitute (Substitut,
ersättare) • Desire (Begäran) • Friend (Vän)
• Fancy • Classy (Moderiktig,
fräsig) • Romantic (Romantisk) • Fashionable (Trendig)
• Boring (Tråkig) • Dry (Torr) • Crumble (Smular) • Short-lived (Kortlivad) • Displeasure (obehag) • Melting (Smälter) • Predictable, negative
(Förutsägbar) • Sticky (Kladdig, kletig)

The influence of chocolate and wafer on customers – An application of Kansei Engineering
3
Leftover words *NO GROUP*, (Resterande ord *INGEN GRUPP*)
• Nice (Tilltalande, skön) • Patriotic (Patriotisk) • Permeating (Sprider sig) • Chunky (Kraftig) • Colorfull (Färgrik) • Energetic (Energisk) • Wet (Våt) • Bulky (Massiv, klumpig) • Sufficient (Tillräcklig)

Appendix
4
Appendix 2 – List of words chosen for the first survey
• Yummy (Smaskens) • Familiar (Familjär) • Appreciated (Uppskattad) • Desire (Begäran) • Predictable, Positive (Förutsägbar) • Traditional (Traditionell) • Recognizable (Igenkännbar) • Cheap (Billig) • Healthy (Hälsosam) • Active (Aktiv) • Exclusive (Exklusiv) • Quality (Kvalitet) • Satisfying (Tillfredsställande) • Crispy (Knaprig) • Substitute (Substitut, ersättare)
• Fashionable (Trendig) • Crumble (Smular) • Sticky (Kladdig, kletig) Example of the survey questionnaire with some of the words:
• Classy (Moderiktig, fräsig) • Romantic (Romantisk)

Th
e in
fluen
ce o
f cho
cola
te a
nd
wa
fer o
n cu
stom
ers –
An
ap
plica
tion
of K
anse
i En
gin
eerin
g
5
Appendix 3 – K
ES
o Analysis – R
esults of Product A
1, A
2, B and C
User No.
Gender
Location
Kvalitet
Uppskattad
Trendig
Begäran
Förutsägbar
Exklusiv
Classy
Aktiv
Romantisk
Billig
Igenkännbar
Knaprig
Hälsosam
Familjär
Smaskens
Smulig
Praktisk
Substitut
Traditionell
Kladdig
No 1
K
S
6
6
3
2
7
4
2
6
2
25
9
6
1
7
6
7
6
4
7
9
No 2
M
S
6
8
7
7
9
8
4
9
3
7
10
8
4
6
10
7
8
8
4
1
No 3
M
S
68
69
29
57
73
13
2
3
0
79
10
67
0
10
83
8
71
23
10
28
No 4
K
S
64
73
42
57
5
46
4
61
43
38
97
61
55
8
55
8
55
5
95
4
No 5
K
S
24
6
8
1
85
1
5
37
0
10
9
91
2
69
14
85
8
22
66
35
No 6
K
L
62
62
5
7
84
28
33
69
25
5
95
68
3
9
67
69
37
55
95
39
No 7
K
S
38
28
5
3
10
32
5
64
33
65
96
41
2
92
4
85
35
4
10
32
No 8
K
S
4
3
4
3
6
2
1
1
0
9
4
8
3
94
4
6
2
6
8
1
No 9
K
L
6
9
4
7
9
4
6
5
3
4
10
4
3
9
7
6
5
5
8
4
No 10
K
L
6
76
97
65
10
79
26
38
0
62
10
95
2
92
81
10
56
3
96
7
No 11
M
S
5
65
34
34
83
25
33
8
12
66
10
61
33
95
61
81
26
71
89
2
No 12
M
S
5
83
36
55
89
0
17
57
33
9
94
65
63
9
57
61
5
56
88
43
No 13
M
L
15
0
0
22
79
0
0
78
0
10
89
78
21
10
61
10
67
57
26
10
No 14
K
S
39
69
81
64
61
21
39
38
23
26
73
69
65
72
74
66
41
39
8
64
No 15
K
L
0
7
9
8
8
0
2
9
1
2
10
10
1
8
8
9
10
8
10
0
No 16
M
S
78
62
54
85
8
46
53
76
73
13
0
99
5
0
87
0
26
5
19
10
No 17
M
S
58
76
6
6
42
3
8
67
2
71
69
58
67
66
58
87
61
57
51
44
No 18
M
L
9
7
7
5
1
2
0
1
2
1
1
8
3
1
8
1
9
4
9
4
No 19
M
L
75
0
29
36
42
2
33
67
29
67
77
67
39
10
10
59
76
6
10
87
No 20
M
S
18
73
65
61
92
0
3
59
15
83
10
63
58
74
59
67
8
67
9
33
Legend: M
– Man; K
– Kvinna; L – La
ndsbygd; S
– Sto
rstadsregion
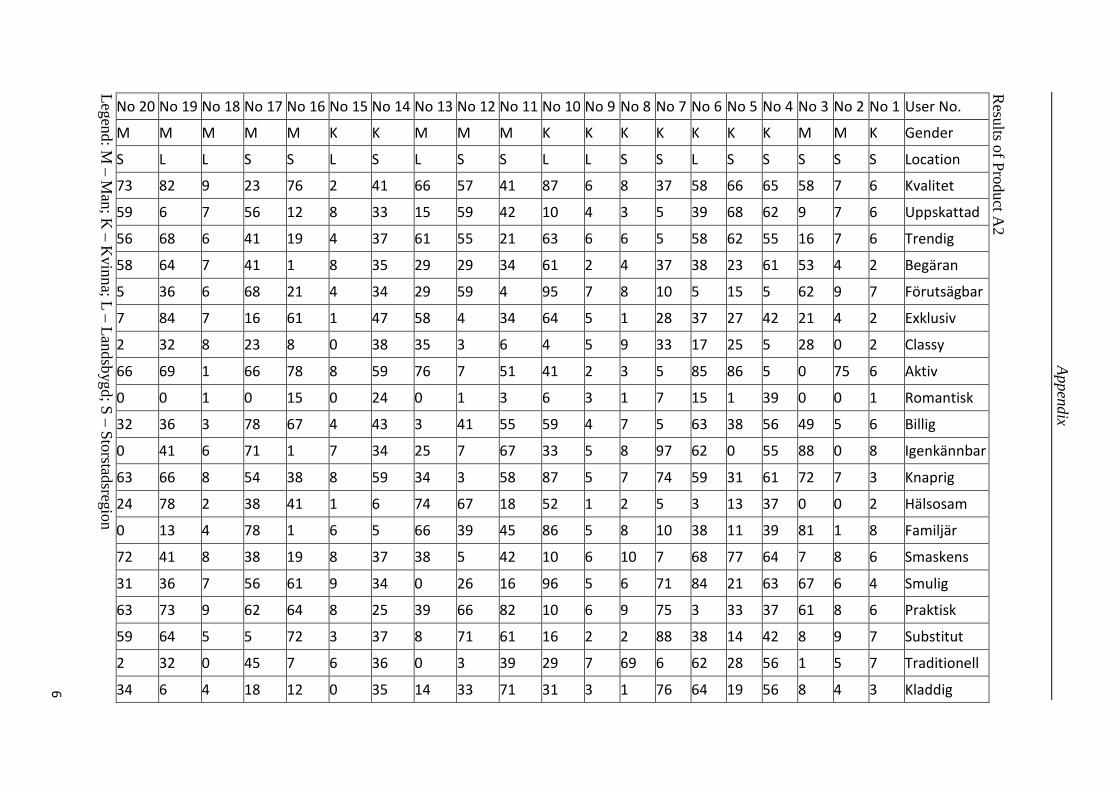
Ap
pen
dix
6
Results of P
roduct A2
User No.
Gender
Location
Kvalitet
Uppskattad
Trendig
Begäran
Förutsägbar
Exklusiv
Classy
Aktiv
Romantisk
Billig
Igenkännbar
Knaprig
Hälsosam
Familjär
Smaskens
Smulig
Praktisk
Substitut
Traditionell
Kladdig
No 1
K
S
6
6
6
2
7
2
2
6
1
6
8
3
2
8
6
4
6
7
7
3
No 2
M
S
7
7
7
4
9
4
0
75
0
5
0
7
0
1
8
6
8
9
5
4
No 3
M
S
58
9
16
53
62
21
28
0
0
49
88
72
0
81
7
67
61
8
1
8
No 4
K
S
65
62
55
61
5
42
5
5
39
56
55
61
37
39
64
63
37
42
56
56
No 5
K
S
66
68
62
23
15
27
25
86
1
38
0
31
13
11
77
21
33
14
28
19
No 6
K
L
58
39
58
38
5
37
17
85
15
63
62
59
3
38
68
84
3
38
62
64
No 7
K
S
37
5
5
37
10
28
33
5
7
5
97
74
5
10
7
71
75
88
6
76
No 8
K
S
8
3
6
4
8
1
9
3
1
7
8
7
2
8
10
6
9
2
69
1
No 9
K
L
6
4
6
2
7
5
5
2
3
4
5
5
1
5
6
5
6
2
7
3
No 10
K
L
87
10
63
61
95
64
4
41
6
59
33
87
52
86
10
96
10
16
29
31
No 11
M
S
41
42
21
34
4
34
6
51
3
55
67
58
18
45
42
16
82
61
39
71
No 12
M
S
57
59
55
29
59
4
3
7
1
41
7
3
67
39
5
26
66
71
3
33
No 13
M
L
66
15
61
29
29
58
35
76
0
3
25
34
74
66
38
0
39
8
0
14
No 14
K
S
41
33
37
35
34
47
38
59
24
43
34
59
6
5
37
34
25
37
36
35
No 15
K
L
2
8
4
8
4
1
0
8
0
4
7
8
1
6
8
9
8
3
6
0
No 16
M
S
76
12
19
1
21
61
8
78
15
67
1
38
41
1
19
61
64
72
7
12
No 17
M
S
23
56
41
41
68
16
23
66
0
78
71
54
38
78
38
56
62
5
45
18
No 18
M
L
9
7
6
7
6
7
8
1
1
3
6
8
2
4
8
7
9
5
0
4
No 19
M
L
82
6
68
64
36
84
32
69
0
36
41
66
78
13
41
36
73
64
32
6
No 20
M
S
73
59
56
58
5
7
2
66
0
32
0
63
24
0
72
31
63
59
2
34
Legend: M
– Man; K
– Kvinna; L – La
ndsbygd; S
– Sto
rstadsregion

Th
e in
fluen
ce o
f cho
cola
te a
nd
wa
fer o
n cu
stom
ers –
An
ap
plica
tion
of K
anse
i En
gin
eerin
g
7
Results of P
roduct B
User No.
Gender
Location
Kvalitet
Uppskattad
Trendig
Begäran
Förutsägbar
Exklusiv
Classy
Aktiv
Romantisk
Billig
Igenkännbar
Knaprig
Hälsosam
Familjär
Smaskens
Smulig
Praktisk
Substitut
Traditionell
Kladdig
No 1
K
S
6
7
3
6
4
6
1
7
2
1
7
7
2
6
6
3
6
7
4
4
No 2
M
S
6
7
3
7
2
0
2
79
0
3
8
8
1
2
8
3
6
7
6
2
No 3
M
S
6
35
23
29
31
24
34
0
0
72
79
33
0
73
66
6
73
3
67
37
No 4
K
S
59
6
55
38
32
5
43
6
64
53
5
58
36
41
58
52
62
5
36
43
No 5
K
S
69
76
21
33
9
24
36
61
0
62
92
94
13
7
35
14
78
22
61
27
No 6
K
L
65
5
78
28
5
2
23
79
26
5
8
84
34
7
5
24
74
2
43
21
No 7
K
S
7
81
5
71
72
23
6
62
22
5
81
8
2
81
10
37
83
72
5
35
No 8
K
S
6
3
7
6
8
3
1
3
8
7
7
7
2
8
6
6
3
3
8
6
No 9
K
L
3
6
5
5
6
4
5
5
5
6
7
4
2
9
4
4
6
3
6
4
No 10
K
L
88
10
10
73
98
81
86
37
0
41
94
96
27
82
96
69
10
26
9
7
No 11
M
S
68
57
59
6
58
72
68
38
23
3
8
65
33
76
5
16
74
37
32
25
No 12
M
S
7
73
74
6
82
32
51
3
31
57
10
66
1
34
7
42
9
6
5
54
No 13
M
L
74
89
63
82
92
64
69
71
87
19
82
72
63
7
64
0
67
0
0
6
No 14
K
S
35
6
33
29
35
38
36
32
21
31
5
69
33
5
71
5
66
36
32
35
No 15
K
L
2
6
2
3
2
0
0
6
2
4
9
8
2
8
6
8
8
7
10
0
No 16
M
S
73
93
6
87
41
35
69
44
81
19
98
55
38
93
73
10
93
1
67
37
No 17
M
S
31
25
45
25
59
61
61
38
35
77
74
75
28
58
21
41
25
39
3
65
No 18
M
L
8
8
0
3
1
7
2
4
2
5
1
5
2
9
8
4
3
5
1
6
No 19
M
L
84
83
10
77
69
77
81
63
85
29
10
69
75
10
99
41
85
3
62
56
No 20
M
S
8
8
66
57
84
61
6
64
3
39
89
62
11
5
75
39
98
67
6
6
Legend: M
– Man; K
– Kvinna; L – La
ndsbygd; S
– Sto
rstadsregion

Ap
pen
dix
8
Results of P
roduct C
User No.
Gender
Location
Kvalitet
Uppskattad
Trendig
Begäran
Förutsägbar
Exklusiv
Classy
Aktiv
Romantisk
Billig
Igenkännbar
Knaprig
Hälsosam
Familjär
Smaskens
Smulig
Praktisk
Substitut
Traditionell
Kladdig
No 1
K
S
7
75
1
2
78
1
2
1
26
1
5
62
22
7
6
7
38
59
8
3
No 2
M
S
2
3
0
2
7
0
0
2
0
9
3
6
7
0
1
10
6
9
6
0
No 3
M
S
7
6
61
57
67
61
23
0
0
28
84
65
0
29
62
39
78
59
0
29
No 4
K
S
58
62
55
43
46
5
38
57
39
43
5
61
44
69
57
56
44
53
62
51
No 5
K
S
69
27
69
23
6
69
65
62
1
63
64
31
19
36
5
84
81
31
17
14
No 6
K
L
64
62
78
22
43
24
25
66
26
62
58
8
35
35
74
57
29
6
27
6
No 7
K
S
33
33
38
34
61
35
4
27
33
33
33
56
17
32
69
37
75
25
32
68
No 8
K
S
8
98
10
5
8
10
10
1
0
8
0
4
1
8
7
6
7
3
17
2
No 9
K
L
5
6
5
5
6
4
5
5
5
5
6
2
2
7
6
4
7
5
5
4
No 10
K
L
3
6
31
21
83
5
11
6
0
85
3
62
13
26
7
79
13
0
28
9
No 11
M
S
4
34
2
28
41
37
34
25
14
61
5
18
24
4
38
58
82
27
31
42
No 12
M
S
55
57
64
53
3
53
11
59
7
1
14
6
46
24
56
19
94
57
1
3
No 13
M
L
84
7
82
71
34
85
83
23
4
17
19
34
19
29
6
79
36
64
85
99
No 14
K
S
29
36
36
32
38
23
31
3
22
36
54
61
36
33
59
8
24
27
34
66
No 15
K
L
2
6
2
2
10
0
0
8
1
4
7
2
0
38
2
9
66
10
2
1
No 16
M
S
71
34
57
8
74
67
61
48
84
21
3
62
55
18
41
91
10
4
33
52
No 17
M
S
22
39
58
39
8
1
5
67
9
89
78
36
54
65
35
67
61
57
37
42
No 18
M
L
7
5
0
7
6
8
9
7
3
4
6
1
3
0
4
8
8
3
0
2
No 19
M
L
83
71
10
29
7
9
28
35
59
3
71
9
64
0
56
45
75
56
34
39
No 20
M
S
35
54
61
28
62
25
22
61
11
39
17
52
43
32
54
37
10
64
5
19
Legend: M
– Man; K
– Kvinna; L – La
ndsbygd; S
– Sto
rstadsregion

The influence of chocolate and wafer on customers – An application of Kansei Engineering
9
Appendix 4 – Factor analysis results for Product A1, A2, B and C
Results of Product A1
Correlation Matrix
Kvalitet Uppskattad Trendig Begäran Förutsägbar
Correlation Kvalitet 1,000 ,348 ,140 ,373 ,100
Uppskattad ,348 1,000 ,661 ,693 ,369
Trendig ,140 ,661 1,000 ,866 ,124
Begäran ,373 ,693 ,866 1,000 ,206
Förutsägbar ,100 ,369 ,124 ,206 1,000
Exklusiv ,265 ,507 ,620 ,515 -,265
Classy ,442 ,421 ,542 ,556 ,160
Aktiv ,570 ,356 ,213 ,347 ,317
Romantisk ,600 ,394 ,332 ,568 -,051
Billig ,347 ,474 ,400 ,354 ,235
Igenkännbar ,404 ,249 -,046 ,047 ,278
Knaprig ,515 ,567 ,571 ,649 ,547
Hälsosam ,209 ,557 ,392 ,415 ,411
Familjär -,214 ,234 ,316 ,002 ,158
Smaskens ,417 ,830 ,651 ,774 ,463
Smulig ,188 ,320 ,045 -,083 ,616
Praktisk ,655 ,284 ,235 ,335 ,167
Substitut -,021 ,485 ,096 ,144 ,851
Traditionell ,067 ,559 ,254 ,204 ,340
Kladdig ,526 ,199 ,202 ,187 ,471
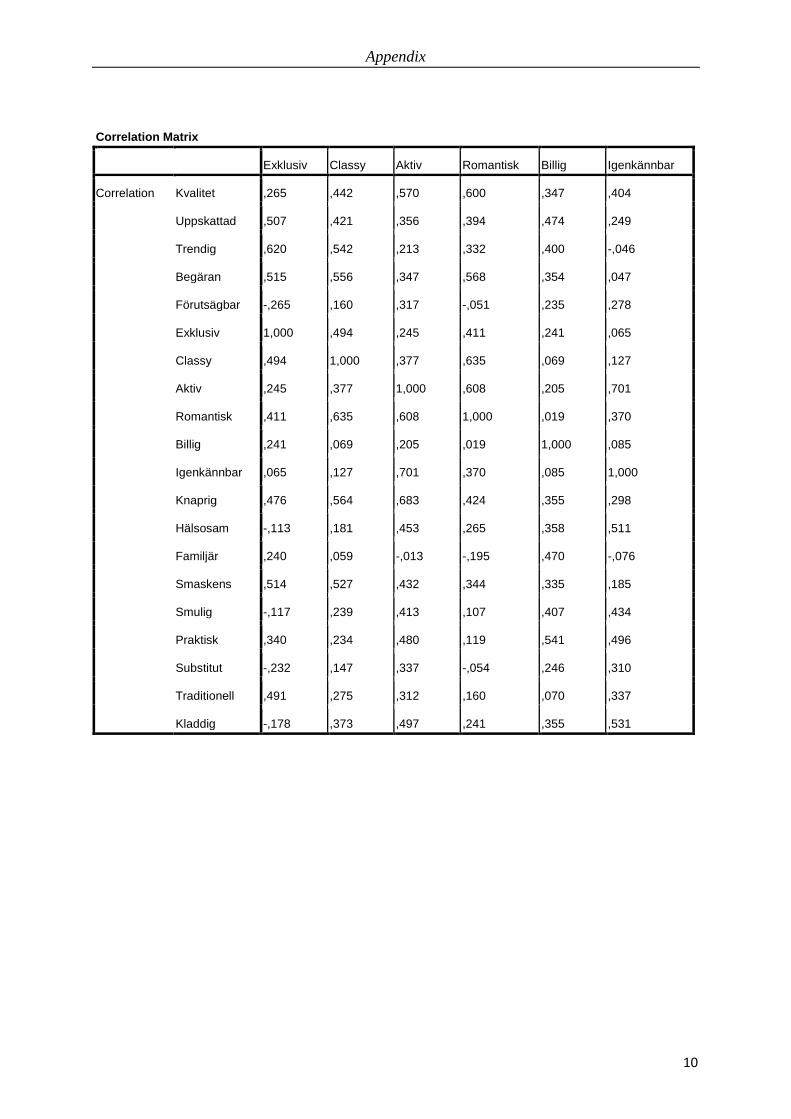
Appendix
10
Correlation Matrix
Exklusiv Classy Aktiv Romantisk Billig Igenkännbar
Correlation Kvalitet ,265 ,442 ,570 ,600 ,347 ,404
Uppskattad ,507 ,421 ,356 ,394 ,474 ,249
Trendig ,620 ,542 ,213 ,332 ,400 -,046
Begäran ,515 ,556 ,347 ,568 ,354 ,047
Förutsägbar -,265 ,160 ,317 -,051 ,235 ,278
Exklusiv 1,000 ,494 ,245 ,411 ,241 ,065
Classy ,494 1,000 ,377 ,635 ,069 ,127
Aktiv ,245 ,377 1,000 ,608 ,205 ,701
Romantisk ,411 ,635 ,608 1,000 ,019 ,370
Billig ,241 ,069 ,205 ,019 1,000 ,085
Igenkännbar ,065 ,127 ,701 ,370 ,085 1,000
Knaprig ,476 ,564 ,683 ,424 ,355 ,298
Hälsosam -,113 ,181 ,453 ,265 ,358 ,511
Familjär ,240 ,059 -,013 -,195 ,470 -,076
Smaskens ,514 ,527 ,432 ,344 ,335 ,185
Smulig -,117 ,239 ,413 ,107 ,407 ,434
Praktisk ,340 ,234 ,480 ,119 ,541 ,496
Substitut -,232 ,147 ,337 -,054 ,246 ,310
Traditionell ,491 ,275 ,312 ,160 ,070 ,337
Kladdig -,178 ,373 ,497 ,241 ,355 ,531

The influence of chocolate and wafer on customers – An application of Kansei Engineering
11
Correlation Matrix
Knaprig Hälsosam Familjär Smaskens Smulig Praktisk
Correlation Kvalitet ,515 ,209 -,214 ,417 ,188 ,655
Uppskattad ,567 ,557 ,234 ,830 ,320 ,284
Trendig ,571 ,392 ,316 ,651 ,045 ,235
Begäran ,649 ,415 ,002 ,774 -,083 ,335
Förutsägbar ,547 ,411 ,158 ,463 ,616 ,167
Exklusiv ,476 -,113 ,240 ,514 -,117 ,340
Classy ,564 ,181 ,059 ,527 ,239 ,234
Aktiv ,683 ,453 -,013 ,432 ,413 ,480
Romantisk ,424 ,265 -,195 ,344 ,107 ,119
Billig ,355 ,358 ,470 ,335 ,407 ,541
Igenkännbar ,298 ,511 -,076 ,185 ,434 ,496
Knaprig 1,000 ,307 ,203 ,760 ,374 ,549
Hälsosam ,307 1,000 ,162 ,373 ,484 ,248
Familjär ,203 ,162 1,000 ,072 ,528 -,018
Smaskens ,760 ,373 ,072 1,000 ,097 ,492
Smulig ,374 ,484 ,528 ,097 1,000 ,101
Praktisk ,549 ,248 -,018 ,492 ,101 1,000
Substitut ,378 ,578 ,236 ,508 ,599 ,109
Traditionell ,517 ,245 ,172 ,455 ,318 ,183
Kladdig ,415 ,514 ,082 ,140 ,648 ,421

Appendix
12
Correlation Matrix
Substitut Traditionell Kladdig
Correlation Kvalitet -,021 ,067 ,526
Uppskattad ,485 ,559 ,199
Trendig ,096 ,254 ,202
Begäran ,144 ,204 ,187
Förutsägbar ,851 ,340 ,471
Exklusiv -,232 ,491 -,178
Classy ,147 ,275 ,373
Aktiv ,337 ,312 ,497
Romantisk -,054 ,160 ,241
Billig ,246 ,070 ,355
Igenkännbar ,310 ,337 ,531
Knaprig ,378 ,517 ,415
Hälsosam ,578 ,245 ,514
Familjär ,236 ,172 ,082
Smaskens ,508 ,455 ,140
Smulig ,599 ,318 ,648
Praktisk ,109 ,183 ,421
Substitut 1,000 ,366 ,273
Traditionell ,366 1,000 -,015
Kladdig ,273 -,015 1,000
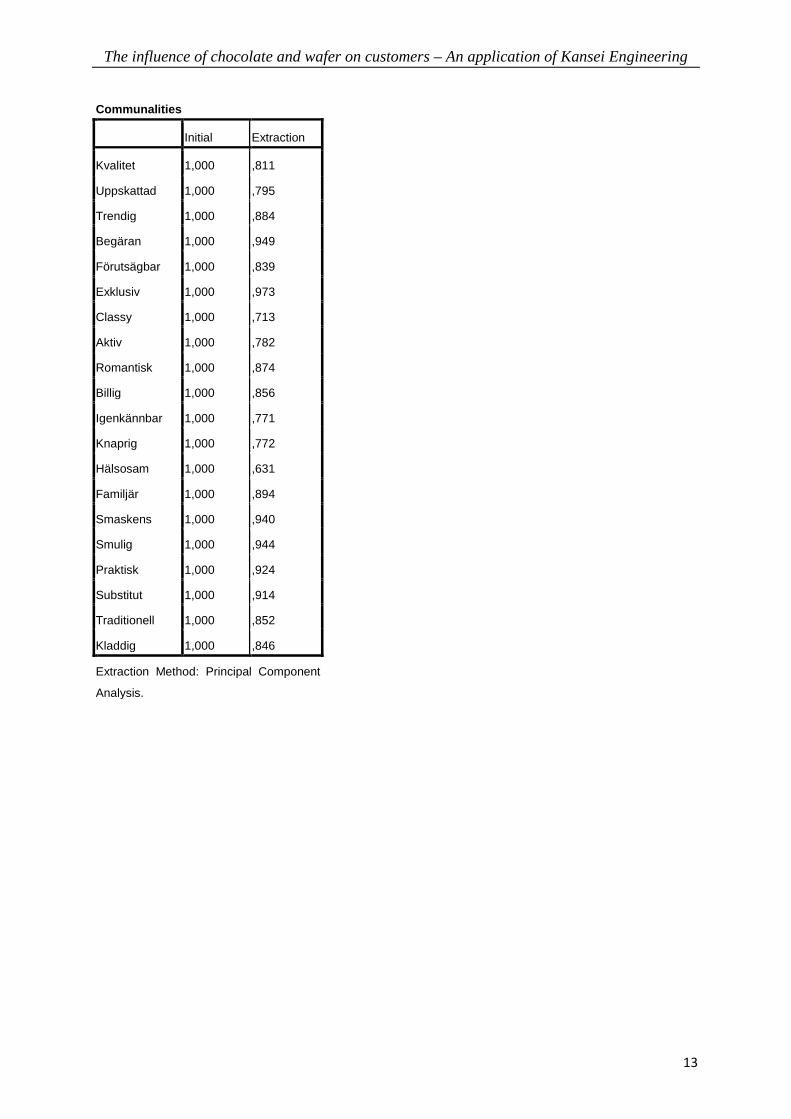
The influence of chocolate and wafer on customers – An application of Kansei Engineering
13
Communalities
Initial Extraction
Kvalitet 1,000 ,811
Uppskattad 1,000 ,795
Trendig 1,000 ,884
Begäran 1,000 ,949
Förutsägbar 1,000 ,839
Exklusiv 1,000 ,973
Classy 1,000 ,713
Aktiv 1,000 ,782
Romantisk 1,000 ,874
Billig 1,000 ,856
Igenkännbar 1,000 ,771
Knaprig 1,000 ,772
Hälsosam 1,000 ,631
Familjär 1,000 ,894
Smaskens 1,000 ,940
Smulig 1,000 ,944
Praktisk 1,000 ,924
Substitut 1,000 ,914
Traditionell 1,000 ,852
Kladdig 1,000 ,846
Extraction Method: Principal Component
Analysis.

Appendix
14
Total Variance Explained
Compo
nent
Initial Eigenvalues
Total % of Variance Cumulative %
1 7,499 37,497
2 3,124 15,618
3 2,337 11,684
4 1,528 7,640
5 1,277 6,386
6 1,197 5,983
7 ,937 4,687 89,496
8 ,564 2,821 92,317
9 ,495 2,473 94,790
10 ,356 1,781 96,572
11 ,226 1,129 97,700
12 ,208 1,041 98,741
13 ,149 ,744 99,486
14 ,047 ,236 99,722
15 ,044 ,220 99,942
16 ,008 ,038 99,980
17 ,003 ,015 99,995
18 ,001 ,005 100,000
19 2,661E-6 1,330E-5 100,000
20 1,923E-17 9,616E-17 100,000
Extraction Method: Principal Component Analysis.
Total Variance Explained
Compo
nent
Initial
Eigenvalues Extraction Sums of Squared Loadings
Cumulative % Total % of Variance Cumulative %
1 37,497 7,499 37,497 37,497
2 53,115 3,124 15,618 53,115
3 64,799 2,337 11,684 64,799
4 72,439 1,528 7,640 72,439
5 78,826 1,277 6,386 78,826
6 84,809 1,197 5,983 84,809
Extraction Method: Principal Component Analysis.

The influence of chocolate and wafer on customers – An application of Kansei Engineering
15
Total Variance Explained
Compo
nent
Rotation Sums of Squared Loadings
Total % of Variance Cumulative %
1 4,548 22,739 22,739
2 3,456 17,278 40,016
3 3,348 16,738 56,754
4 1,983 9,914 66,668
5 1,872 9,362 76,030
6 1,756 8,779 84,809
Extraction Method: Principal Component Analysis.

Appendix
16
Component Matrixa
Component
1 2 3 4 5 6
Kvalitet ,598 -,610
Uppskattad ,805
Trendig ,655
Begäran ,725
Förutsägbar ,531 ,617
Exklusiv -,711
Classy ,635
Aktiv ,717
Romantisk ,552
Billig ,520 ,703
Igenkännbar ,508 -,511
Knaprig ,862
Hälsosam ,620
Familjär ,610
Smaskens ,817
Smulig ,502 ,693
Praktisk ,588 -,533
Substitut ,513 ,625
Traditionell ,518 ,588
Kladdig ,555
Extraction Method: Principal Component Analysis.
a. 6 components extracted.

The influence of chocolate and wafer on customers – An application of Kansei Engineering
17
Rotated Component Matrixa
Component
1 2 3 4 5 6
Kvalitet ,679
Uppskattad ,705
Trendig ,901
Begäran ,939
Förutsägbar ,892
Exklusiv ,602 ,556
Classy ,655
Aktiv ,769
Romantisk ,524 ,719
Billig ,663 ,538
Igenkännbar ,732
Knaprig ,560
Hälsosam ,623
Familjär ,909
Smaskens ,750
Smulig ,554 ,649
Praktisk ,872
Substitut ,924
Traditionell ,845
Kladdig ,661
Extraction Method: Principal Component Analysis.
Rotation Method: Varimax with Kaiser Normalization.
a. Rotation converged in 24 iterations.

Appendix
18
Component Transformation Matrix
Compo
nent 1 2 3 4 5 6
1 ,638 ,499 ,396 ,318 ,172 ,238
2 -,592 ,143 ,734 ,000 ,271 -,132
3 ,297 -,753 ,265 -,158 ,443 ,231
4 -,063 -,049 -,332 ,607 ,588 -,411
5 -,358 ,185 -,304 ,030 ,332 ,796
6 ,150 ,356 -,178 -,710 ,495 -,263
Extraction Method: Principal Component Analysis.
Rotation Method: Varimax with Kaiser Normalization.

The influence of chocolate and wafer on customers – An application of Kansei Engineering
19
Results of Product A2
Correlation Matrix
Kvalitet Uppskattad Trendig Begäran Förutsägbar
Correlation Kvalitet 1,000 ,368 ,807 ,714 ,420
Uppskattad ,368 1,000 ,600 ,400 ,052
Trendig ,807 ,600 1,000 ,701 ,405
Begäran ,714 ,400 ,701 1,000 ,468
Förutsägbar ,420 ,052 ,405 ,468 1,000
Exklusiv ,757 -,037 ,585 ,523 ,333
Classy ,306 -,012 ,289 ,350 ,236
Aktiv ,468 ,323 ,547 ,173 ,055
Romantisk ,269 ,297 ,208 ,265 -,134
Billig ,593 ,558 ,520 ,541 ,492
Igenkännbar ,198 ,062 ,068 ,581 ,260
Knaprig ,688 ,204 ,482 ,857 ,405
Hälsosam ,666 ,212 ,711 ,461 ,505
Familjär ,375 ,178 ,402 ,542 ,740
Smaskens ,513 ,739 ,688 ,483 -,213
Smulig ,586 ,159 ,365 ,628 ,491
Praktisk ,491 ,329 ,246 ,477 ,217
Substitut ,521 ,260 ,254 ,366 -,058
Traditionell ,084 ,309 ,286 ,261 -,020
Kladdig ,350 ,453 ,276 ,482 -,092

Appendix
20
Correlation Matrix
Exklusiv Classy Aktiv Romantisk Billig Igenkännbar
Correlation Kvalitet ,757 ,306 ,468 ,269 ,593 ,198
Uppskattad -,037 -,012 ,323 ,297 ,558 ,062
Trendig ,585 ,289 ,547 ,208 ,520 ,068
Begäran ,523 ,350 ,173 ,265 ,541 ,581
Förutsägbar ,333 ,236 ,055 -,134 ,492 ,260
Exklusiv 1,000 ,504 ,494 ,361 ,452 ,292
Classy ,504 1,000 ,295 ,063 ,104 ,512
Aktiv ,494 ,295 1,000 -,003 ,406 -,085
Romantisk ,361 ,063 -,003 1,000 ,400 ,231
Billig ,452 ,104 ,406 ,400 1,000 ,406
Igenkännbar ,292 ,512 -,085 ,231 ,406 1,000
Knaprig ,647 ,464 ,289 ,337 ,609 ,714
Hälsosam ,628 ,191 ,313 ,004 ,321 -,008
Familjär ,290 ,216 ,036 -,026 ,520 ,560
Smaskens ,316 ,231 ,618 ,349 ,447 ,099
Smulig ,478 ,208 ,129 ,439 ,703 ,615
Praktisk ,321 ,338 ,162 -,055 ,408 ,460
Substitut ,385 ,131 ,161 ,286 ,316 ,276
Traditionell ,219 ,096 ,168 ,448 ,459 ,295
Kladdig ,239 ,147 ,105 ,479 ,396 ,610

The influence of chocolate and wafer on customers – An application of Kansei Engineering
21
Correlation Matrix
Knaprig Hälsosam Familjär Smaskens Smulig Praktisk
Correlation Kvalitet ,688 ,666 ,375 ,513 ,586 ,491
Uppskattad ,204 ,212 ,178 ,739 ,159 ,329
Trendig ,482 ,711 ,402 ,688 ,365 ,246
Begäran ,857 ,461 ,542 ,483 ,628 ,477
Förutsägbar ,405 ,505 ,740 -,213 ,491 ,217
Exklusiv ,647 ,628 ,290 ,316 ,478 ,321
Classy ,464 ,191 ,216 ,231 ,208 ,338
Aktiv ,289 ,313 ,036 ,618 ,129 ,162
Romantisk ,337 ,004 -,026 ,349 ,439 -,055
Billig ,609 ,321 ,520 ,447 ,703 ,408
Igenkännbar ,714 -,008 ,560 ,099 ,615 ,460
Knaprig 1,000 ,252 ,489 ,413 ,791 ,480
Hälsosam ,252 1,000 ,398 ,172 ,160 ,465
Familjär ,489 ,398 1,000 ,030 ,486 ,213
Smaskens ,413 ,172 ,030 1,000 ,185 ,198
Smulig ,791 ,160 ,486 ,185 1,000 ,242
Praktisk ,480 ,465 ,213 ,198 ,242 1,000
Substitut ,425 ,352 -,173 ,213 ,371 ,717
Traditionell ,275 -,019 ,170 ,446 ,298 -,121
Kladdig ,588 ,024 ,191 ,416 ,517 ,390

Appendix
22
Correlation Matrix
Substitut Traditionell Kladdig
Correlation Kvalitet ,521 ,084 ,350
Uppskattad ,260 ,309 ,453
Trendig ,254 ,286 ,276
Begäran ,366 ,261 ,482
Förutsägbar -,058 -,020 -,092
Exklusiv ,385 ,219 ,239
Classy ,131 ,096 ,147
Aktiv ,161 ,168 ,105
Romantisk ,286 ,448 ,479
Billig ,316 ,459 ,396
Igenkännbar ,276 ,295 ,610
Knaprig ,425 ,275 ,588
Hälsosam ,352 -,019 ,024
Familjär -,173 ,170 ,191
Smaskens ,213 ,446 ,416
Smulig ,371 ,298 ,517
Praktisk ,717 -,121 ,390
Substitut 1,000 -,021 ,647
Traditionell -,021 1,000 ,337
Kladdig ,647 ,337 1,000

The influence of chocolate and wafer on customers – An application of Kansei Engineering
23
Communalities
Initial Extraction
Kvalitet 1,000 ,897
Uppskattad 1,000 ,932
Trendig 1,000 ,905
Begäran 1,000 ,773
Förutsägbar 1,000 ,898
Exklusiv 1,000 ,943
Classy 1,000 ,829
Aktiv 1,000 ,703
Romantisk 1,000 ,788
Billig 1,000 ,762
Igenkännbar 1,000 ,956
Knaprig 1,000 ,880
Hälsosam 1,000 ,816
Familjär 1,000 ,880
Smaskens 1,000 ,947
Smulig 1,000 ,830
Praktisk 1,000 ,878
Substitut 1,000 ,948
Traditionell 1,000 ,669
Kladdig 1,000 ,819
Extraction Method: Principal Component
Analysis.

Appendix
24
Total Variance Explained
Compo
nent
Initial Eigenvalues
Total % of Variance Cumulative %
1 7,938 39,688
2 2,503 12,513
3 2,303 11,516
4 1,816 9,079
5 1,351 6,755
6 1,144 5,720
7 ,735 3,677 88,948
8 ,645 3,227 92,175
9 ,476 2,382 94,557
10 ,384 1,918 96,475
11 ,315 1,575 98,050
12 ,158 ,791 98,841
13 ,118 ,588 99,429
14 ,056 ,278 99,707
15 ,041 ,207 99,914
16 ,015 ,075 99,989
17 ,001 ,007 99,996
18 ,001 ,004 99,999
19 ,000 ,001 100,000
20 -5,723E-17 -2,861E-16 100,000
Extraction Method: Principal Component Analysis.
Total Variance Explained
Compo
nent
Initial
Eigenvalues Extraction Sums of Squared Loadings
Cumulative % Total % of Variance Cumulative %
1 39,688 7,938 39,688 39,688
2 52,201 2,503 12,513 52,201
3 63,717 2,303 11,516 63,717
4 72,796 1,816 9,079 72,796
5 79,551 1,351 6,755 79,551
6 85,271 1,144 5,720 85,271
Extraction Method: Principal Component Analysis.

The influence of chocolate and wafer on customers – An application of Kansei Engineering
25
Total Variance Explained
Compo
nent
Rotation Sums of Squared Loadings
Total % of Variance Cumulative %
1 3,458 17,292 17,292
2 3,307 16,536 33,828
3 2,846 14,231 48,060
4 2,818 14,092 62,152
5 2,729 13,645 75,798
6 1,895 9,473 85,271
Extraction Method: Principal Component Analysis.

Appendix
26
Component Matrixa
Component
1 2 3 4 5 6
Kvalitet ,852
Uppskattad ,506 ,535 -,519
Trendig ,774 -,507
Begäran ,858
Förutsägbar -,729
Exklusiv ,724 ,511
Classy ,577
Aktiv -,531
Romantisk
Billig ,782
Igenkännbar ,577 ,671
Knaprig ,866
Hälsosam ,562 -,588
Familjär ,549 -,565
Smaskens ,586 ,663
Smulig ,738
Praktisk ,571 -,624
Substitut ,527 -,725
Traditionell ,536
Kladdig ,605 ,504
Extraction Method: Principal Component Analysis.
a. 6 components extracted.
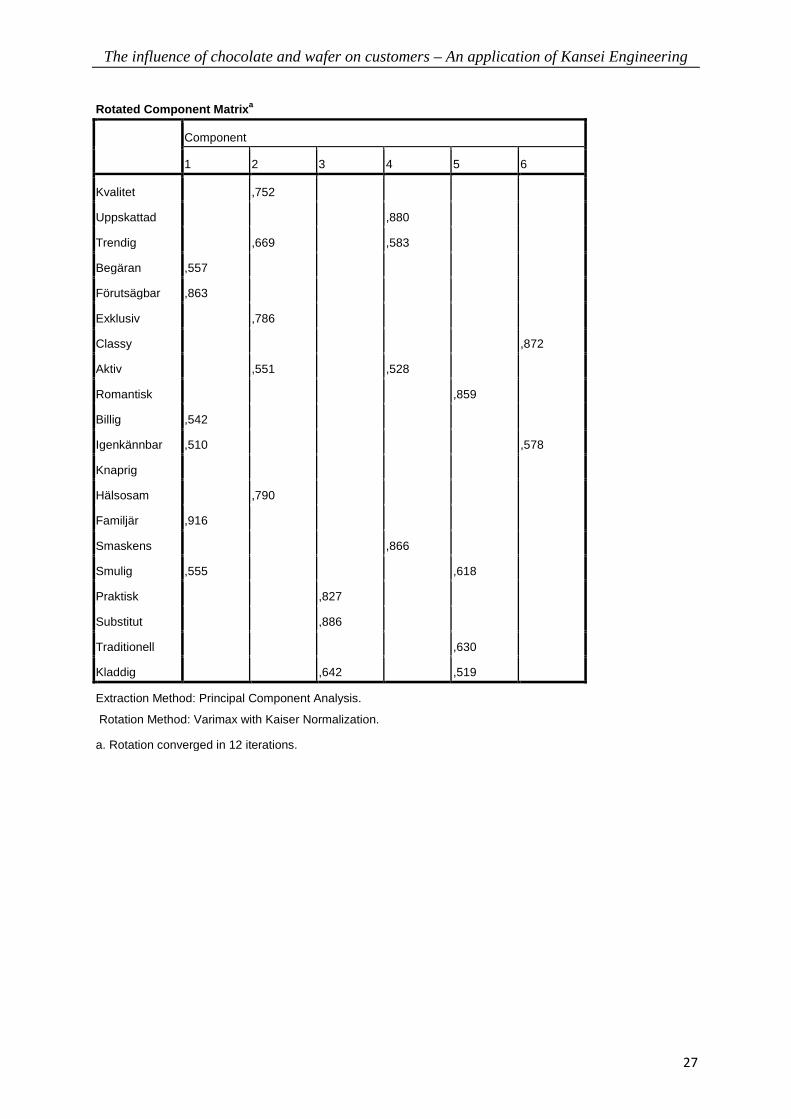
The influence of chocolate and wafer on customers – An application of Kansei Engineering
27
Rotated Component Matrixa
Component
1 2 3 4 5 6
Kvalitet ,752
Uppskattad ,880
Trendig ,669 ,583
Begäran ,557
Förutsägbar ,863
Exklusiv ,786
Classy ,872
Aktiv ,551 ,528
Romantisk ,859
Billig ,542
Igenkännbar ,510 ,578
Knaprig
Hälsosam ,790
Familjär ,916
Smaskens ,866
Smulig ,555 ,618
Praktisk ,827
Substitut ,886
Traditionell ,630
Kladdig ,642 ,519
Extraction Method: Principal Component Analysis.
Rotation Method: Varimax with Kaiser Normalization.
a. Rotation converged in 12 iterations.

Appendix
28
Component Transformation Matrix
Compo
nent 1 2 3 4 5 6
1 ,480 ,478 ,415 ,377 ,380 ,287
2 -,651 -,112 ,082 ,625 ,374 -,161
3 ,139 -,698 ,283 -,293 ,541 ,186
4 ,427 -,160 -,770 ,306 ,297 -,129
5 -,370 ,276 -,383 -,263 ,267 ,707
6 ,082 -,414 ,022 ,467 -,513 ,584
Extraction Method: Principal Component Analysis.
Rotation Method: Varimax with Kaiser Normalization.

The influence of chocolate and wafer on customers – An application of Kansei Engineering
29
Results of Product B
Correlation Matrix
Kvalitet Uppskattad Trendig Begäran Förutsägbar
Correlation Kvalitet 1,000 ,433 ,256 ,615 ,385
Uppskattad ,433 1,000 ,103 ,570 ,492
Trendig ,256 ,103 1,000 ,055 ,420
Begäran ,615 ,570 ,055 1,000 ,659
Förutsägbar ,385 ,492 ,420 ,659 1,000
Exklusiv ,584 ,439 ,300 ,584 ,845
Classy ,821 ,550 ,312 ,571 ,662
Aktiv ,467 ,355 ,239 ,541 ,297
Romantisk ,598 ,609 ,285 ,625 ,420
Billig ,162 ,162 ,338 ,175 ,360
Igenkännbar ,289 ,453 ,028 ,689 ,521
Knaprig ,783 ,323 ,614 ,467 ,543
Hälsosam ,835 ,430 ,322 ,638 ,451
Familjär ,267 ,374 -,025 ,381 ,443
Smaskens ,570 ,246 ,051 ,769 ,553
Smulig ,353 ,054 ,298 ,398 ,629
Praktisk ,484 ,528 ,372 ,647 ,360
Substitut -,115 ,050 ,150 ,229 ,453
Traditionell ,508 ,376 ,010 ,310 -,113
Kladdig ,267 ,464 ,307 ,239 ,353
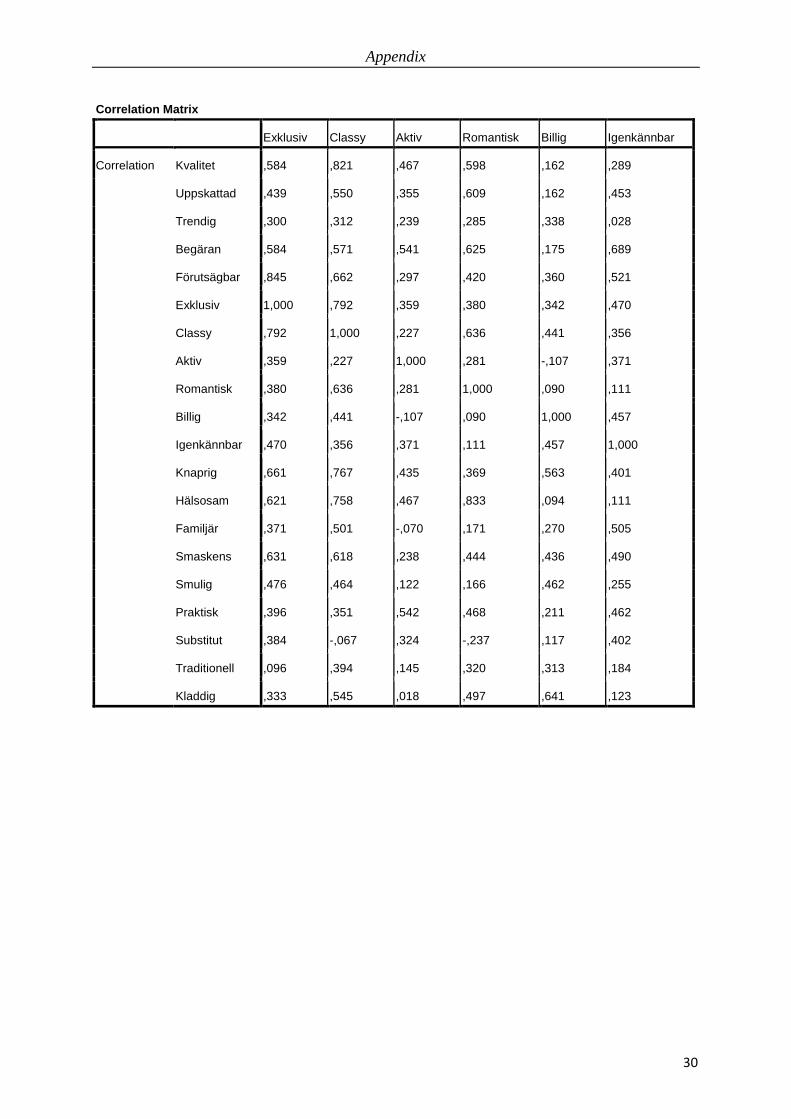
Appendix
30
Correlation Matrix
Exklusiv Classy Aktiv Romantisk Billig Igenkännbar
Correlation Kvalitet ,584 ,821 ,467 ,598 ,162 ,289
Uppskattad ,439 ,550 ,355 ,609 ,162 ,453
Trendig ,300 ,312 ,239 ,285 ,338 ,028
Begäran ,584 ,571 ,541 ,625 ,175 ,689
Förutsägbar ,845 ,662 ,297 ,420 ,360 ,521
Exklusiv 1,000 ,792 ,359 ,380 ,342 ,470
Classy ,792 1,000 ,227 ,636 ,441 ,356
Aktiv ,359 ,227 1,000 ,281 -,107 ,371
Romantisk ,380 ,636 ,281 1,000 ,090 ,111
Billig ,342 ,441 -,107 ,090 1,000 ,457
Igenkännbar ,470 ,356 ,371 ,111 ,457 1,000
Knaprig ,661 ,767 ,435 ,369 ,563 ,401
Hälsosam ,621 ,758 ,467 ,833 ,094 ,111
Familjär ,371 ,501 -,070 ,171 ,270 ,505
Smaskens ,631 ,618 ,238 ,444 ,436 ,490
Smulig ,476 ,464 ,122 ,166 ,462 ,255
Praktisk ,396 ,351 ,542 ,468 ,211 ,462
Substitut ,384 -,067 ,324 -,237 ,117 ,402
Traditionell ,096 ,394 ,145 ,320 ,313 ,184
Kladdig ,333 ,545 ,018 ,497 ,641 ,123

The influence of chocolate and wafer on customers – An application of Kansei Engineering
31
Correlation Matrix
Knaprig Hälsosam Familjär Smaskens Smulig Praktisk
Correlation Kvalitet ,783 ,835 ,267 ,570 ,353 ,484
Uppskattad ,323 ,430 ,374 ,246 ,054 ,528
Trendig ,614 ,322 -,025 ,051 ,298 ,372
Begäran ,467 ,638 ,381 ,769 ,398 ,647
Förutsägbar ,543 ,451 ,443 ,553 ,629 ,360
Exklusiv ,661 ,621 ,371 ,631 ,476 ,396
Classy ,767 ,758 ,501 ,618 ,464 ,351
Aktiv ,435 ,467 -,070 ,238 ,122 ,542
Romantisk ,369 ,833 ,171 ,444 ,166 ,468
Billig ,563 ,094 ,270 ,436 ,462 ,211
Igenkännbar ,401 ,111 ,505 ,490 ,255 ,462
Knaprig 1,000 ,628 ,191 ,548 ,518 ,486
Hälsosam ,628 1,000 ,058 ,612 ,239 ,521
Familjär ,191 ,058 1,000 ,220 ,403 ,264
Smaskens ,548 ,612 ,220 1,000 ,387 ,517
Smulig ,518 ,239 ,403 ,387 1,000 ,135
Praktisk ,486 ,521 ,264 ,517 ,135 1,000
Substitut ,141 -,126 ,276 ,069 ,375 ,366
Traditionell ,393 ,383 ,255 ,449 -,022 ,644
Kladdig ,446 ,368 ,417 ,250 ,446 ,383
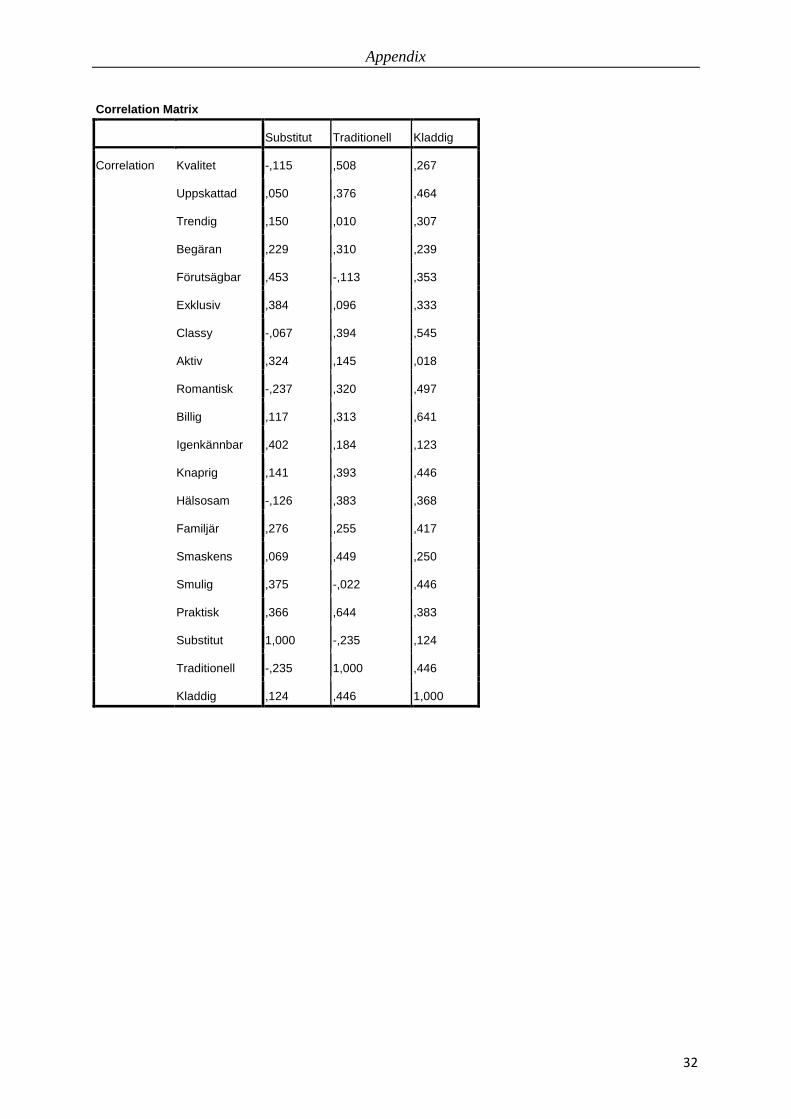
Appendix
32
Correlation Matrix
Substitut Traditionell Kladdig
Correlation Kvalitet -,115 ,508 ,267
Uppskattad ,050 ,376 ,464
Trendig ,150 ,010 ,307
Begäran ,229 ,310 ,239
Förutsägbar ,453 -,113 ,353
Exklusiv ,384 ,096 ,333
Classy -,067 ,394 ,545
Aktiv ,324 ,145 ,018
Romantisk -,237 ,320 ,497
Billig ,117 ,313 ,641
Igenkännbar ,402 ,184 ,123
Knaprig ,141 ,393 ,446
Hälsosam -,126 ,383 ,368
Familjär ,276 ,255 ,417
Smaskens ,069 ,449 ,250
Smulig ,375 -,022 ,446
Praktisk ,366 ,644 ,383
Substitut 1,000 -,235 ,124
Traditionell -,235 1,000 ,446
Kladdig ,124 ,446 1,000

The influence of chocolate and wafer on customers – An application of Kansei Engineering
33
Communalities
Initial Extraction
Kvalitet 1,000 ,841
Uppskattad 1,000 ,813
Trendig 1,000 ,830
Begäran 1,000 ,898
Förutsägbar 1,000 ,930
Exklusiv 1,000 ,816
Classy 1,000 ,932
Aktiv 1,000 ,798
Romantisk 1,000 ,869
Billig 1,000 ,847
Igenkännbar 1,000 ,804
Knaprig 1,000 ,906
Hälsosam 1,000 ,940
Familjär 1,000 ,731
Smaskens 1,000 ,834
Smulig 1,000 ,686
Praktisk 1,000 ,899
Substitut 1,000 ,842
Traditionell 1,000 ,926
Kladdig 1,000 ,857
Extraction Method: Principal Component
Analysis.

Appendix
34
Total Variance Explained
Compo
nent
Initial Eigenvalues
Total % of Variance Cumulative %
1 8,525 42,623
2 2,417 12,087
3 1,894 9,472
4 1,660 8,300
5 1,354 6,768
6 1,146 5,732
7 ,729 3,647 88,628
8 ,716 3,578 92,206
9 ,517 2,586 94,792
10 ,487 2,437 97,228
11 ,251 1,253 98,481
12 ,168 ,842 99,323
13 ,066 ,332 99,655
14 ,041 ,205 99,861
15 ,020 ,100 99,961
16 ,005 ,025 99,986
17 ,002 ,010 99,996
18 ,001 ,003 100,000
19 5,559E-5 ,000 100,000
20 4,156E-17 2,078E-16 100,000
Extraction Method: Principal Component Analysis.
Total Variance Explained
Compo
nent
Initial
Eigenvalues Extraction Sums of Squared Loadings
Cumulative % Total % of Variance Cumulative %
1 42,623 8,525 42,623 42,623
2 54,709 2,417 12,087 54,709
3 64,181 1,894 9,472 64,181
4 72,482 1,660 8,300 72,482
5 79,249 1,354 6,768 79,249
6 84,981 1,146 5,732 84,981
Extraction Method: Principal Component Analysis.

The influence of chocolate and wafer on customers – An application of Kansei Engineering
35
Total Variance Explained
Compo
nent
Rotation Sums of Squared Loadings
Total % of Variance Cumulative %
1 5,379 26,893 26,893
2 2,917 14,584 41,477
3 2,739 13,693 55,169
4 2,300 11,501 66,671
5 1,883 9,415 76,085
6 1,779 8,896 84,981
Extraction Method: Principal Component Analysis.

Appendix
36
Component Matrixa
Component
1 2 3 4 5 6
Kvalitet ,792
Uppskattad ,636 ,502
Trendig -,574
Begäran ,816
Förutsägbar ,763
Exklusiv ,806
Classy ,874
Aktiv -,620
Romantisk ,673
Billig ,590
Igenkännbar ,581
Knaprig ,812
Hälsosam ,776
Familjär ,510
Smaskens ,744
Smulig ,542
Praktisk ,695 ,520
Substitut ,744
Traditionell ,512
Kladdig ,576 ,560
Extraction Method: Principal Component Analysis.
a. 6 components extracted.

The influence of chocolate and wafer on customers – An application of Kansei Engineering
37
Rotated Component Matrixa
Component
1 2 3 4 5 6
Kvalitet ,852
Uppskattad ,797
Trendig ,865
Begäran ,690 ,524
Förutsägbar ,525 ,506
Exklusiv ,686
Classy ,781
Aktiv ,543
Romantisk ,601 ,668
Billig ,846
Igenkännbar ,743
Knaprig ,663
Hälsosam ,854
Familjär ,536
Smaskens ,775
Smulig ,597
Praktisk ,513 ,587
Substitut ,843
Traditionell ,874
Kladdig ,640 ,548
Extraction Method: Principal Component Analysis.
Rotation Method: Varimax with Kaiser Normalization.
a. Rotation converged in 14 iterations.

Appendix
38
Component Transformation Matrix
Compo
nent 1 2 3 4 5 6
1 ,739 ,360 ,332 ,376 ,181 ,197
2 -,309 ,624 ,507 -,210 -,463 -,009
3 -,094 -,625 ,753 ,005 ,040 ,178
4 -,284 ,159 ,228 ,309 ,526 -,685
5 -,376 ,255 -,016 -,117 ,617 ,631
6 -,356 -,025 -,113 ,840 -,305 ,249
Extraction Method: Principal Component Analysis.
Rotation Method: Varimax with Kaiser Normalization.

The influence of chocolate and wafer on customers – An application of Kansei Engineering
39
Results of Product C
Correlation Matrix
Kvalitet Uppskattad Trendig Begäran Förutsägbar
Correlation Kvalitet 1,000 ,282 ,664 ,471 -,033
Uppskattad ,282 1,000 ,053 -,044 ,027
Trendig ,664 ,053 1,000 ,700 ,228
Begäran ,471 -,044 ,700 1,000 ,110
Förutsägbar -,033 ,027 ,228 ,110 1,000
Exklusiv ,562 -,169 ,665 ,584 ,177
Classy ,735 -,056 ,592 ,460 ,134
Aktiv ,664 ,337 ,685 ,339 -,065
Romantisk ,549 ,366 ,105 -,059 ,339
Billig ,031 -,070 ,427 ,238 ,282
Igenkännbar ,314 ,038 ,442 ,441 -,095
Knaprig ,088 ,012 ,382 ,316 ,831
Hälsosam ,660 ,485 ,412 ,304 ,087
Familjär ,257 ,039 ,641 ,468 ,127
Smaskens ,393 ,358 ,477 ,490 ,302
Smulig ,574 -,098 ,634 ,405 ,342
Praktisk ,230 ,070 ,206 ,501 -,143
Substitut ,361 ,267 ,416 ,696 ,111
Traditionell ,578 ,082 ,422 ,533 ,168
Kladdig ,496 -,075 ,422 ,640 ,265

Appendix
40
Correlation Matrix
Exklusiv Classy Aktiv Romantisk Billig Igenkännbar
Correlation Kvalitet ,562 ,735 ,664 ,549 ,031 ,314
Uppskattad -,169 -,056 ,337 ,366 -,070 ,038
Trendig ,665 ,592 ,685 ,105 ,427 ,442
Begäran ,584 ,460 ,339 -,059 ,238 ,441
Förutsägbar ,177 ,134 -,065 ,339 ,282 -,095
Exklusiv 1,000 ,777 ,276 ,113 ,039 ,222
Classy ,777 1,000 ,351 ,304 ,167 ,154
Aktiv ,276 ,351 1,000 ,322 ,445 ,310
Romantisk ,113 ,304 ,322 1,000 -,093 ,048
Billig ,039 ,167 ,445 -,093 1,000 ,361
Igenkännbar ,222 ,154 ,310 ,048 ,361 1,000
Knaprig ,239 ,259 ,047 ,320 ,364 ,151
Hälsosam ,103 ,294 ,725 ,684 ,231 ,301
Familjär ,066 ,172 ,557 ,000 ,565 ,343
Smaskens ,202 ,073 ,481 ,473 ,219 ,484
Smulig ,538 ,701 ,565 ,328 ,656 ,257
Praktisk ,335 ,089 ,308 ,002 ,120 ,477
Substitut ,273 ,233 ,346 ,047 -,003 ,388
Traditionell ,295 ,649 ,262 ,333 ,311 ,073
Kladdig ,490 ,618 ,151 ,389 ,179 ,235

The influence of chocolate and wafer on customers – An application of Kansei Engineering
41
Correlation Matrix
Knaprig Hälsosam Familjär Smaskens Smulig Praktisk
Correlation Kvalitet ,088 ,660 ,257 ,393 ,574 ,230
Uppskattad ,012 ,485 ,039 ,358 -,098 ,070
Trendig ,382 ,412 ,641 ,477 ,634 ,206
Begäran ,316 ,304 ,468 ,490 ,405 ,501
Förutsägbar ,831 ,087 ,127 ,302 ,342 -,143
Exklusiv ,239 ,103 ,066 ,202 ,538 ,335
Classy ,259 ,294 ,172 ,073 ,701 ,089
Aktiv ,047 ,725 ,557 ,481 ,565 ,308
Romantisk ,320 ,684 ,000 ,473 ,328 ,002
Billig ,364 ,231 ,565 ,219 ,656 ,120
Igenkännbar ,151 ,301 ,343 ,484 ,257 ,477
Knaprig 1,000 ,234 ,422 ,328 ,389 -,007
Hälsosam ,234 1,000 ,313 ,583 ,422 ,204
Familjär ,422 ,313 1,000 ,356 ,396 ,253
Smaskens ,328 ,583 ,356 1,000 ,165 ,358
Smulig ,389 ,422 ,396 ,165 1,000 ,190
Praktisk -,007 ,204 ,253 ,358 ,190 1,000
Substitut ,350 ,455 ,339 ,348 ,143 ,493
Traditionell ,307 ,380 ,405 ,162 ,597 ,030
Kladdig ,479 ,361 ,335 ,365 ,467 ,182
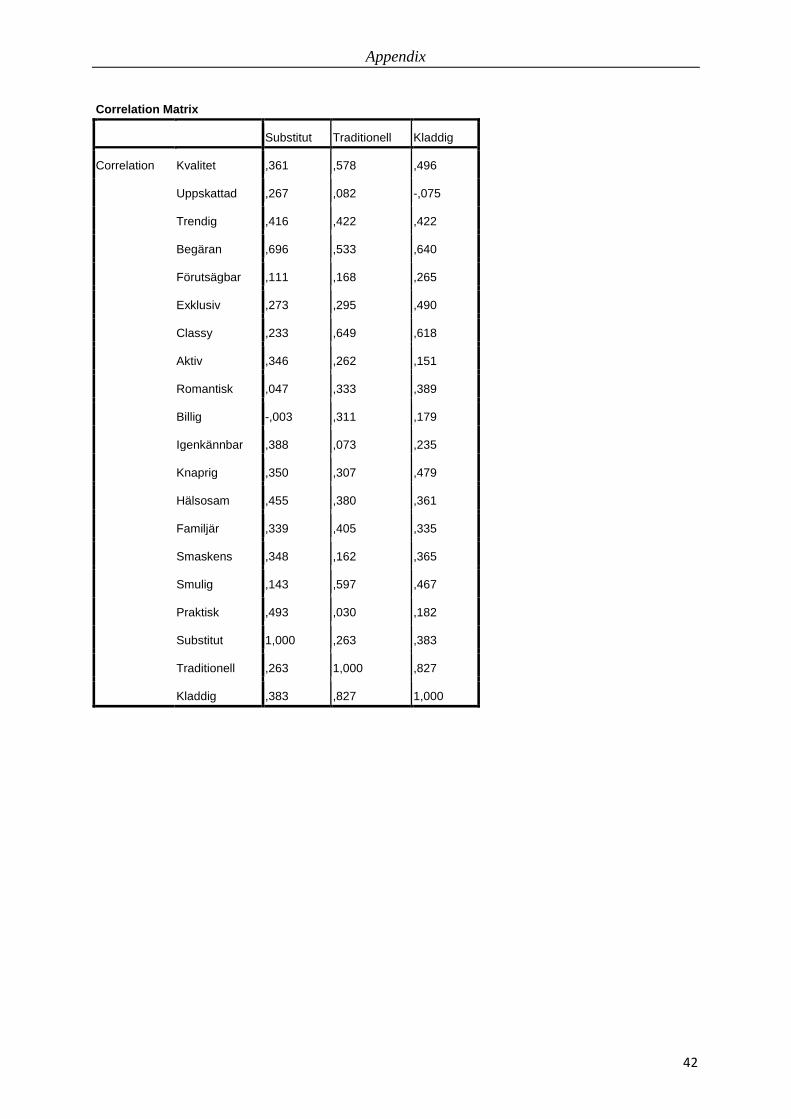
Appendix
42
Correlation Matrix
Substitut Traditionell Kladdig
Correlation Kvalitet ,361 ,578 ,496
Uppskattad ,267 ,082 -,075
Trendig ,416 ,422 ,422
Begäran ,696 ,533 ,640
Förutsägbar ,111 ,168 ,265
Exklusiv ,273 ,295 ,490
Classy ,233 ,649 ,618
Aktiv ,346 ,262 ,151
Romantisk ,047 ,333 ,389
Billig -,003 ,311 ,179
Igenkännbar ,388 ,073 ,235
Knaprig ,350 ,307 ,479
Hälsosam ,455 ,380 ,361
Familjär ,339 ,405 ,335
Smaskens ,348 ,162 ,365
Smulig ,143 ,597 ,467
Praktisk ,493 ,030 ,182
Substitut 1,000 ,263 ,383
Traditionell ,263 1,000 ,827
Kladdig ,383 ,827 1,000

The influence of chocolate and wafer on customers – An application of Kansei Engineering
43
Communalities
Initial Extraction
Kvalitet 1,000 ,924
Uppskattad 1,000 ,638
Trendig 1,000 ,816
Begäran 1,000 ,900
Förutsägbar 1,000 ,931
Exklusiv 1,000 ,939
Classy 1,000 ,902
Aktiv 1,000 ,899
Romantisk 1,000 ,863
Billig 1,000 ,871
Igenkännbar 1,000 ,572
Knaprig 1,000 ,907
Hälsosam 1,000 ,862
Familjär 1,000 ,787
Smaskens 1,000 ,744
Smulig 1,000 ,875
Praktisk 1,000 ,626
Substitut 1,000 ,746
Traditionell 1,000 ,945
Kladdig 1,000 ,867
Extraction Method: Principal Component
Analysis.

Appendix
44
Total Variance Explained
Compo
nent
Initial Eigenvalues
Total % of Variance Cumulative %
1 7,446 37,228
2 2,365 11,824
3 2,163 10,815
4 1,982 9,909
5 1,598 7,988
6 1,060 5,302
7 ,857 4,286 87,350
8 ,654 3,272 90,622
9 ,520 2,598 93,220
10 ,484 2,418 95,638
11 ,376 1,879 97,517
12 ,190 ,952 98,469
13 ,101 ,503 98,972
14 ,088 ,441 99,413
15 ,061 ,305 99,718
16 ,039 ,194 99,912
17 ,013 ,066 99,978
18 ,004 ,020 99,998
19 ,000 ,002 100,000
20 8,610E-18 4,305E-17 100,000
Extraction Method: Principal Component Analysis.
Total Variance Explained
Compo
nent
Initial
Eigenvalues Extraction Sums of Squared Loadings
Cumulative % Total % of Variance Cumulative %
1 37,228 7,446 37,228 37,228
2 49,052 2,365 11,824 49,052
3 59,866 2,163 10,815 59,866
4 69,775 1,982 9,909 69,775
5 77,763 1,598 7,988 77,763
6 83,065 1,060 5,302 83,065
Extraction Method: Principal Component Analysis.

The influence of chocolate and wafer on customers – An application of Kansei Engineering
45
Total Variance Explained
Compo
nent
Rotation Sums of Squared Loadings
Total % of Variance Cumulative %
1 3,344 16,718 16,718
2 3,089 15,443 32,161
3 3,015 15,077 47,238
4 2,680 13,402 60,640
5 2,267 11,334 71,974
6 2,218 11,091 83,065
Extraction Method: Principal Component Analysis.

Appendix
46
Component Matrixa
Component
1 2 3 4 5 6
Kvalitet ,781
Uppskattad ,663
Trendig ,839
Begäran ,753
Förutsägbar ,531
Exklusiv ,616
Classy ,699
Aktiv ,693
Romantisk ,756
Billig ,566 -,539
Igenkännbar
Knaprig ,507 ,558
Hälsosam ,676 ,513
Familjär ,598
Smaskens ,604
Smulig ,754
Praktisk -,523
Substitut ,570
Traditionell ,677 -,558
Kladdig ,714
Extraction Method: Principal Component Analysis.
a. 6 components extracted.

The influence of chocolate and wafer on customers – An application of Kansei Engineering
47
Rotated Component Matrixa
Component
1 2 3 4 5 6
Kvalitet ,669 ,556
Uppskattad ,755
Trendig ,569 ,503
Begäran ,730
Förutsägbar ,950
Exklusiv ,880
Classy ,842
Aktiv ,572 ,589
Romantisk ,794
Billig ,903
Igenkännbar ,659
Knaprig ,879
Hälsosam ,834
Familjär ,746
Smaskens ,541 ,557
Smulig ,667 ,574
Praktisk ,767
Substitut ,750
Traditionell ,865
Kladdig ,771
Extraction Method: Principal Component Analysis.
Rotation Method: Varimax with Kaiser Normalization.
a. Rotation converged in 7 iterations.
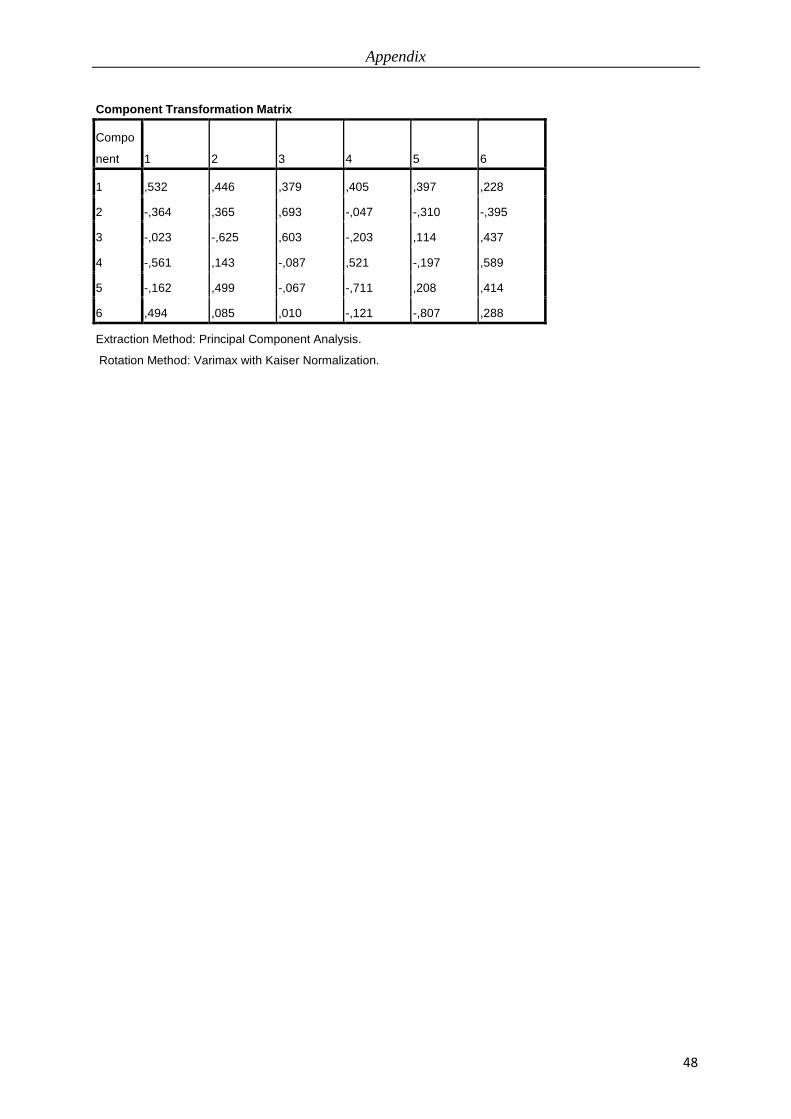
Appendix
48
Component Transformation Matrix
Compo
nent 1 2 3 4 5 6
1 ,532 ,446 ,379 ,405 ,397 ,228
2 -,364 ,365 ,693 -,047 -,310 -,395
3 -,023 -,625 ,603 -,203 ,114 ,437
4 -,561 ,143 -,087 ,521 -,197 ,589
5 -,162 ,499 -,067 -,711 ,208 ,414
6 ,494 ,085 ,010 -,121 -,807 ,288
Extraction Method: Principal Component Analysis.
Rotation Method: Varimax with Kaiser Normalization.

The influence of chocolate and wafer on customers – An application of Kansei Engineering
49
Appendix 5 - Some direct thoughts from the test group during sample-testing of product A.
Problem Action/Measures/Tips Small amount of chocolate Put more chocolate Insufficient/bad quality of breaking lines in KexChoklad
Increase the breaking lines, make it deeper and more user-friendly
Too dry Make it more Chunky, for example 50/50 considering the amount of wafer and chocolate. Thin wafers on both sides of a big chunky chocolate to fill the mouth.
Package not nice and user-friendly. The package doesn’t open in a straight line.
Make some design changes to make it more user-friendly.

Ap
pen
dix
5
0
Appendix 6 – K
ES
o Analysis – R
esults of Properties
User No.
Gender
Location
Mängden Choklad
Rån-Tjockleken
Produktstorlek
Brytlinjer/Antalet brytlinjer
Antalet rån
Smaken på chokladen
Hårdhet på chokladen
Initialer/inskrift på chokladen
Antalet olika hårdheter i
chokladen
Produktutformning
Hårdheten på chokladen
Produktens Sammansättning
Nötter i Chokladen
Gluteninnehåll
Laktos innehåll
Chokladens färg
Mängd socker
Produkt kostnad
Produkt komplexitivitet
No 1
K
S
10
7
6
1
1
8
9
2
3
6
8
6
10
0
0
8
0
6
3
No 2
M
S
10
10
8
8
10
10
9
2
1
9
9
8
7
0
9
57
8
9
0
No 3
M
S
69
21
24
7
11
10
15
0
2
7
62
78
0
0
61
8
92
10
0
No 4
K
S
62
32
58
67
66
96
67
1
33
69
41
58
38
68
56
26
33
39
57
No 5
K
S
7
83
87
76
14
81
21
78
79
8
19
74
0
0
0
88
18
7
26
No 6
K
L
61
76
9
97
44
9
67
18
75
71
73
87
31
61
77
88
89
62
86
No 7
K
S
10
37
35
99
7
10
83
5
26
69
83
96
23
1
82
36
93
58
97
No 8
K
S
7
7
3
9
3
9
5
9
9
7
5
8
1
2
2
8
3
7
7
No 9
K
L
6
6
6
7
6
8
6
2
6
8
6
6
9
1
1
6
8
4
4
No 10
K
L
89
8
95
10
12
10
74
13
97
95
74
13
26
0
0
10
4
10
55
No 11
M
S
86
6
32
34
64
85
85
18
68
59
58
95
22
0
8
66
73
75
25
No 12
M
S
66
5
71
83
73
94
73
25
73
72
79
77
68
0
0
3
82
85
93
No 13
M
L
10
10
0
10
10
59
10
10
82
68
10
0
61
0
0
0
0
10
86
No 14
K
S
62
37
34
37
31
7
35
11
6
7
55
63
26
17
19
61
31
64
59
No 15
K
L
10
0
0
0
0
10
2
8
0
6
3
10
0
0
0
9
10
3
6
No 16
M
S
75
26
86
93
87
94
23
71
88
11
23
54
85
11
1
0
8
84
88
No 17
M
S
84
53
41
23
0
10
64
66
4
66
72
76
29
0
0
33
35
68
39
Legend: M
– Man; K
– Kvinna; L – La
ndsbygd; S
– Sto
rstadsregion

The influence of chocolate and wafer on customers – An application of Kansei Engineering
51
Appendix 7 – List of property words chosen for the first survey (additional)
• The wafer thickness (Rån-tjockleken) • The amount of chocolate (Mängden choklad) • The product size (Produktstorleken) • The breaking lines/No. of breaking lines (Brytlinjer/Antalet brytlinjer) • The no. of wafers (Antalet rån) • The chocolate flavor (Smaken på chokladen) • The hardness of the chocolate (Hårdheten på chokladen) • Initials/Inscriptions on the chocolate (Initialer/inskrifter på chokladen) • Different consistency of chocolate (Antalet olika hårdheter i chokladen) • Product formation (Produktutformningen) • Nuts in the chocolate (Nötter i chokladen) • Gluten content (Gluteninnehåll) • Lactos content (Laktosinnehåll) • Chocolate color (Färgen på chokladen) • Sugar level (Mängd socker) • Product Cost (Kostnaden för produkten) • Product complexity (Produktens komplexitet, ex. enkel eller komplicerad)

Appendix
52
Appendix 8: Radar charts for the prototypes used in the final survey
Product 1 – 3 number of wafer with 1mm of chocolate
Product 2 – 4 number of wafer with 1mm of chocolate

The influence of chocolate and wafer on customers – An application of Kansei Engineering
53
Product 3 – 5 number of wafer with 1mm of chocolate
Product 4 – 3 number of wafer with 2mm of chocolate
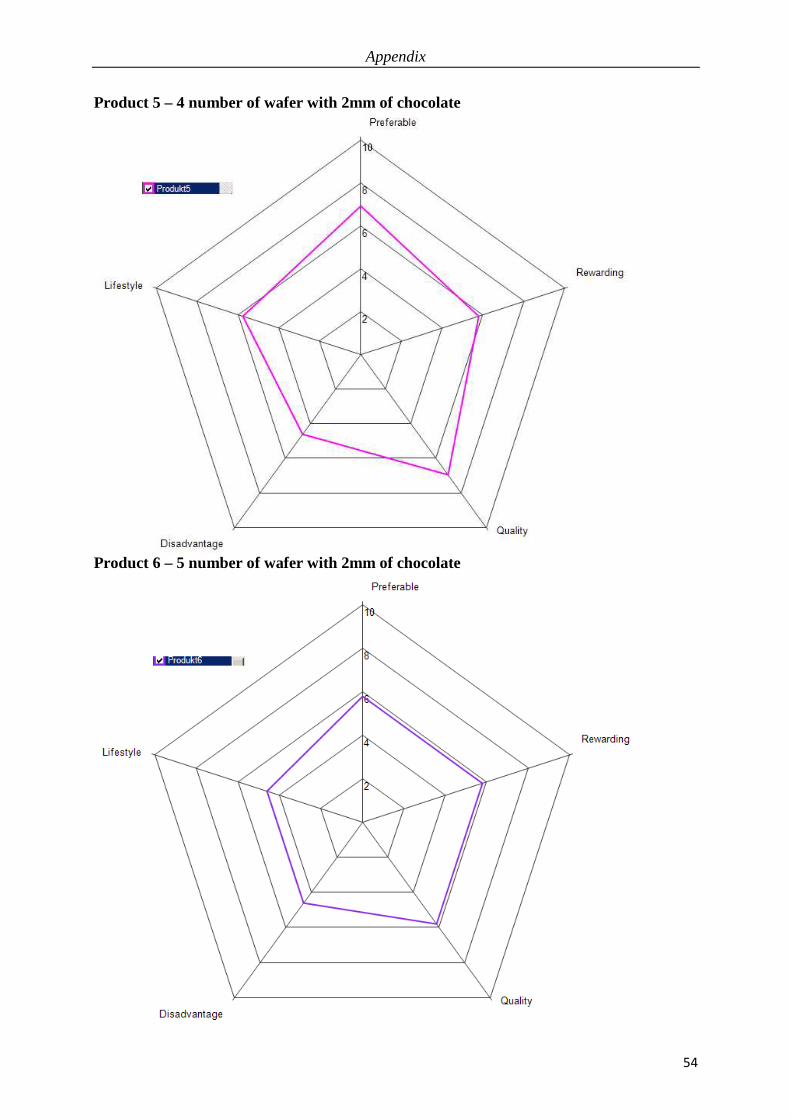
Appendix
54
Product 5 – 4 number of wafer with 2mm of chocolate
Product 6 – 5 number of wafer with 2mm of chocolate

The influence of chocolate and wafer on customers – An application of Kansei Engineering
55
Product 7 – 3 number of wafer with 3mm of chocolate
Product 8 – 4 number of wafer with 3mm of chocolate

Appendix
56
Product 9 – 5 number of wafer with 3mm of chocolate