the influence of brand equity towards repurchasing intention of nokia ...
19
Transcript of the influence of brand equity towards repurchasing intention of nokia ...


1
THE INFLUENCE OF BRAND EQUITY TOWARDS
REPURCHASING INTENTION OF NOKIA MOBILE PHONES
THROUGH THE CONSUMER VALUE
Christina Esti Susanti Fakultas Bisnis, Universitas Katholik Widya Mandala
email: [email protected]
Abstract
This research is aimed to partially and simultaneously examine the influence of brand equity
element towards repurchasing intention of Nokia cell phones in Surabaya through the customer
value. The populations of this research are the entire Nokia cell phones customers in Surabaya.
The numbers of population taken are 150 respondents. The sample was taken by using purposive
sampling method. The data are processed and analyzed by using hierarchical regression analysis.
The results of the research show that brand equity elements affect the customer value.
Consequently, the customer value affects the repurchasing intention of the customers. In
conclusion, the elements of brand equity partially and simultaneously affect the repurchasing
intention through the customer value in Surabaya. Based on the results of the research, it is
suggested that the producer of Nokia cell phones should creates advertisement in television,
which gives the better information about cell phones Nokia specification.
Keywords: brand equity, repurchasing intention, customer value
Abstrak
Penelitian ini bertujuan menguji pengaruh elemen ekuitas merk terhadap niat membeli ulang
melalui nilai pelanggan baik secara parsial maupun secara simultan pada telepon seluler Merk
Nokia di Surabaya. Populasi penelitian ini adalah para pengguna telepon seluler merk Nokia di
Surabaya. Jumlah sampel dalam penelitian ini ditetapkan sebesar 150 responden. Metode
pengambilan sampel menggunakan purposive random sampling. Data diolah dan dianalisis
dengan menggunakan hierarchical regression analysis. Hasil penelitian ini menunjukkan bahwa
elemen ekuitas merk mempengaruhi nilai pelanggan. Hasil penelitian ini juga membuktikan
bahwa nilai pelanggan mempengaruhi niat beli ulang. Kesimpulan yang dapat diambil dalam
penelitian ini adalah elemen ekuitas merek baik secara parsial maupun simultan mempengaruhi
niat beli ulang melalui nilai pelanggan di Surabaya. Berdasarkan hasil penelitian tersebut, saran
bagi produsen telepon seluler adalah merancang iklan di televisi, yang memberikan informasi
lebih baik tentang spesifikasi telepon seluler merk Nokia.
Keywords: brand equity, repurchasing intention, customer value
Introduction
Brands are varying in strength and value in the market, therefore companies must be able to
develop a product that has a prestigious brand or could have strong brand equity. According to
Aaker (1997:23), Kim & Hyun (2011) brand equity can be grouped into four categories which
include: brand awareness, brand association, perceived quality, and brand loyalty.
Brand awareness shows a prospective buyer's ability to recognize or recall that a brand is
part of a particular product category. Therefore, consumers who want to buy a product, it
2
becomes the obligation of the company to introduce its products to build brand awareness. It is
done in order for the company's products will have a competitive edge over other similar
products.
The perceived quality is a reflection of the overall customer perception of quality or
excellence of a product or service with respect to the expected mean. Every company is trying to
satisfy its customers, by improving its perceived quality. Companies need to create the perceived
quality of the product. When consumers want to decide to purchase something, they always base
their consideration on perceptions about the quality of a product.
According to Rangkuti (2004:60), brand loyalty is "a measurement of consumer loyalty
to a brand". With the consumers’ loyalty to the brand, then consumers will not be easily switch
brands. If the customers’ loyalty to a brand increases, the fragility of these customer groups of
threats and attacks of other competitor branded products can be reduced.
According to Tjiptono (2004:150), customer value is taken as perceived value and
customer evaluation of product attributes, performance attributes and consequences that occur
from the utilization of the product to achieve the purpose and intention of consumers when using
the product. If brand awareness, perceived quality and brand loyalty of consumers is pleasing for
them, consumers are satisfied, then the customer will be more positive and in the future, the
intention to buy these products with the brand is getting bigger.
Ajzen (1998:1-15) described Re-purchase Intention as a situation in which before a
person decided of doing any act, which can be used as a basis for predicting the behavior or
action. After getting the information to a certain extent, a customer exists until the process of
estimating and evaluating, then making purchasing decisions after comparing and deliberation.
Research on brand awareness, perceived quality and brand loyalty of customer value has
been done by Baldauf et al. (2003). The study aims to determine the effect of brand awareness,
perceived quality and brand loyalty of customer value and intention to make another
purchase. From the results of these studies obtained show that brand awareness, perceived
quality, and brand loyalty shown to have contribution significantly on influencing the formation
of customer value that can increase purchase intention. The gaps with this research is the aims
of this research to partially and simultaneously examine the influence of brand equity elements
(brand awareness, brand association, perceived quality, and brand loyalty) towards repurchasing
intention through the customer value.
Based on this background, the study aims to analyze the effect of brand awareness,
perceived quality and brand loyalty of customer value and intention to re-purchase the Nokia
brand mobile phones in Surabaya. This study is done because nowadays many different brands
of mobile phones in circulation, where competition among branded mobile phones are becoming
increasingly stringent. Nokia mobile Brand is seen as one of the brands that dominate the mobile
phone sales and it conducts vigorous campaigns in various media to introduce its
products. Promotion conducted by Nokia brand mobile phone is also intended to build brand
awareness, perceived quality, brand loyalty, customer value and re-purchase intention of
consumers. The novelty of this research is the effect of brand awareness, brand association,
perceived quality, and brand loyalty to customer value and repurchasing intention tested either
partially or simultaneously and the object of this research is at a very high competition.
Therefore, the problem formulations presented in this study are as follow: (1) Do the
elements of brand equity, either partially or simultaneously, affect the customer value on Nokia
brand mobile phones in Surabaya? (2) Do the elements of brand equity partially or
simultaneously influence consumer repurchase intention on the Nokia brand mobile phones in

3
Surabaya? (3) Does the customer value influence repurchase intention on Nokia brand mobile
phones in Surabaya? (4) Do the elements of brand equity, either partially or simultaneously,
influence purchase intention through customer value on Nokia brand mobile phones in
Surabaya?
Based on the formulation of the problem, the hypothesis proposed in this study are as
follows: (1) The elements of brand equity, either partially or simultaneously, affect the customer
value on Nokia brand mobile phones in Surabaya (2) The elements of brand equity partially or
simultaneously influence consumer repurchase intention on the Nokia brand mobile phones in
Surabaya (3) The customer value influence repurchase intention on Nokia brand mobile phones
in Surabaya (4) The elements of brand equity, either partially or simultaneously, influence
purchase intention through customer value on Nokia brand mobile phones in Surabaya.
Literature Review
Brand Equity
Durianto et al. (2001:4) defines brand equity as "a set of brand assets and liabilities relating
to a brand, name and symbol, which could increase or decrease the value given by a product or
service to companies and customers". Assets that they contain can assist customers in forming
and storing information related to the products and brands. Keller (2003:27) defines brand equity
as the real power of a brand is in thoughts, feelings, images, beliefs, attitudes, experiences and so
on that exist in the minds of consumers. In other word, the value of a brand – and thus its equity
– is ultimately derived in the marketplace from the words and actions of consumers. Consumers
decide with their purchases, based on whatever factors they deem important, which brands have
more equity than other brands. Although the details of different approaches to conceptualize
brand equity differ, they tend to share a common core: All definitions typically either implicitly
or explicitly rely on brand knowledge structures in the minds of consumers – individuals or
organizations – as the source or foundation of brand equity.
Cravens (1996:20) asserts that brand equity is "a set of brand assets and debt associated
with a brand, name and symbol, added to or subtracted from the values given in a product or
service for consumers" Brand equity comprises brand awareness, brand associations, perceived
quality and brand loyalty (Baldauf et al, 2003). Brand equity is a key resource or asset in the
resource based view literature and the creation of brand equity is a key marketing strategy
(Baldauf et al, 2003).
Aaker, (2004:89) state that, brand equity is particularly crucial with services where there is
difficulty in differentiation and a lack of physical characteristics to evaluate competing service
offerings.
Based on some of these definitions, brand equity can be taken as a set of brand assets and
liabilities related to a brand, name and symbol that add or subtract the value given by an item or
service to the company or the firm's customers.
Besides providing value for its customers, brand equity provides value to the company
(Durianto et al., 2001:6), among others in these forms:
1. Strong brand equity that can enhance success in attracting new consumer products and re-
embrace the old consumer. Promotion done will be more effective if the brand is well
known.
2. Four variables brand equity: brand awareness, association, impression quality, and other
brand assets can affect consumers’ purchasing reasons. If brand awareness, quality

4
impression and associations are not so important in the process of purchasing the brand,
all three can reduce the willingness of consumers to try other brands.
3. Strong brand loyalty is important as a response to the innovation done by the competitors.
4. Brand association is very important as positioning strategies and product expansion
strategy.
5. Strong brand equity enables companies to obtain greater profits by applying a premium
price and reduce reliance on promotions.
6. Strong brand equity used as the basis for growth and expansion of the brand to other
products by creating new business which its cost will be much more expensive to enter
without a brand rather than brand equity.
7. Brand equity can provide a boost in distribution channels. Strong brands will benefit in
storage space placement of goods in stores or supermarkets.
8. Brand equity assets provide a competitive advantage which often provide a real barrier
against competitors.
Brand Awareness
Aaker (1991:90) defines brand awareness as: "Willingness of one potential buyer to
recognize or recall that a brand is part of a particular product category". Product category should
be emphasized here, because there is a strong influence among the categories of products with
the exclusion of certain brands. Brand awareness is the first and prerequisite dimension of the
entire brand knowledge system in consumers’ minds, reflecting their ability to identify the brand
under different conditions: the likelihood that a brand name will come to mind and the ease with
which it does so (Keller, 1993).
Based on these definitions, brand awareness can be interpreted as a prospective buyer's
ability to recognize or recall that a brand is part of a particular product category. Aaker (1991:91)
stated that the role of brand awareness in brand equity depends on the level of awareness on the
achievement of the minds of consumers, which can be divided into:
1. Top of mind means when a brand is called, remembered for the first time by the consumer
at the time of brand recognition without any assistance, is top of mind brand awareness
which is the highest leadership of the variety of brands that exist in minds of consumers for
a particular product category.
2. Brand Recall means unaided brand recall. Consumers do not need to be helped to
remember a brand. Brand recall reflects what respondents remembered for the first time
after mentioning the brand.
3. Brand Recognition means brand recall with assistance (aided recall) for example by
mentioning the characteristics of the brand product, brand, or ask a question will show the
image characteristics of the brand in question.
Perceived Quality
According to Kotler and Armstrong (1997:279) "Perceived quality is the product's ability
to perform its functions, including durability, reliability, accuracy, use and repair simplicity, and
other valuable attributes". Perceived quality is a critical element for consumer decision making;
consequently, consumers will compare the quality of alternatives with regard to price within a
category (Jin and Yong, 2005).
Based on these definitions, perceived quality can be interpreted as reflecting the overall
customer perception of quality/excellence of a product or service with respect to the expected

5
mean.
Some quality concepts according to Everett and Ebert (1995:596-597) are as follows:
1. Quality is the ability to use
2. Quality is doing the right thing for the first time and every time
3. Quality is the consumer perception
4. Quality is providing products and services at affordable prices that can be paid by consumers
5. The quality of products and services are the most expensive piece
Durianto et al. (2001:96) explained that the perceived quality will create the perception of
the quality of a product in the eyes of the customer. Overall perceived quality of a product or
service can determine the value of such products or services and directly affects consumer
purchasing decisions and their loyalty to the brand.
According to Garvin (1997:133), perceived quality is influenced by several factors or
dimensions. In the context of product quality, product quality dimensions are divided into:
Performance, Involve a variety of operational characteristics of the main products.
1. Product Characteristic, secondary elements of a product or additional parts of the
product. Apart from being an important differentiator when the two products look identical,
characteristics of the product will show that the company understands the needs of the users
of these products.
2. Compliance with specifications, No product is imperfect so that it is taken as an assessment of
the quality of the manufacturing process.
3. Reliability, Consistency of performance from a product purchase to the next purchase and the
percentage of time owned the product to perform properly.
4. Endurance, reflecting the economic life of certain products.
5. Service, reflecting the company's ability to provide services with one similarly influenced
with these products.
6. The final result (fit and finish), Indicates when the appearance or feel of the product’s quality
product. The assumption is that if the company could not produce a product with good end
results then these products may not have other more important quality attributes.
Brand Loyalty
Aaker (1991:5) stated that "brand loyalty as an important factor in determining the value
of a brand. The importance of brand can include the quality, shape and utility of goods and
services offered are better than that offered by competitors ".Furthermore, Aaker argued that
"brand loyalty has a strategic value to the company, among others, reduce marketing costs,
attract customers, and can provide the advantage of time as a response to competitors'.
According to Mowen and Minor (1995:531), brand loyalty is a trend where customers
have a positive attitude toward the brand is committed to the brand and tend to buy the brand in
the future. Based on some of these definitions, brand loyalty reflects the level of consumer
engagement with a brand product. Least loyal consumers against a company brand are highly
dependent on the ability of corporate management in managing the factors that influence brand
loyalty factor.
According to Aaker (1991:6) variables that affect brand loyalty are:

6
1. Satisfactory Variable or satisfaction derived from the use of products which includes a
match between needs and wants, conformity with the benefits, drawing and writing, design
of typical colors, clarity of information, the ability to acquire the product.
2. Habitual Behavior Variable or habits in the use of a product that includes the process of
decision making and fondness for the product.
3. Commitment Variable means the belief in the use of a product which includes
recommendation and trust.
4. Fondness of the brand Variable means the level of preference for a product includes the
attachment and experience.
Customer Value
According to Kotler (2000:34), the measurement of customer value involves two
measurements. The measurements are the measurement of the quality and the measurement of
prices. The measurement of this quality include:
1. Products
Measurement of the quality of these products include:
a. Confidence (reliability) of the products or services that is provided by
consumers. The increasing belief of the product or service being presented posses
quality as promised to give will result a higher rating to the quality of the product.
b. Level of safety (safety rating) that guarantees the safety of products or services
provided for consumers.
a. Eligibility level (roominess), namely the feasibility of a product or service
presentation. For example, the comfort of room occupancy have an important role for
a hotel.
2. Service
The measurement of these services include:
a. Friendliness of service renderers (dealer friendliness), the presenter of this service are
the ones who meet directly with consumers.
b. Honesty of service (perceived honesty). These services include honesty in providing
information, honesty in providing services, and others.
c. Access to services (service accessibility), ie easiness provided by service providers to
purchase products or services already offered to consumers.
3. Personnal
Measurement of these services include:
a. Typical personnel, namely an assessment of the personality of the service renderer
that can be seen and valued by consumers.
b. Knowledge of personnel (knowledge ability) is the knowledge possessed by
personnel, particularly knowledge about specifications of the products or services
provided.
7
c. Overall Courtesy of employees (appearance and courtesy of People who work at
dealerships) that includes the employee's ability to provide service with a courteous
and polite behavior.
4. Brand image
An assessment of the brand image includes an assessment of the conformity between the
services provided by the customer desires.
These four indicators can be used to gauge how high customer value of a service or
product to the customer himself. Customer assessment of each indicator is very high and low
affecting the overall value of customer value.
Repeat Purchase Intention
Re-purchase intention is a behavior that emerged in response to the object. Purchase
intention is the intention of re-purchase that shows the customer wishes to make repeat purchases
(Assael, 1998:88). Repurchase intention means the status of consumers’ (ones who purchased at
least once from the shopping malls) desire to purchase again. Repurchase intention of customers
is an indispensable factor for successful operation of Internet shopping malls. The value provided
by steady and loyal customers has direct influence on the success of a company, and it is largely
determined by customers’ (Chung and Lee, 2003). Repurchase intention. Some understanding of
the intentions (Ihwan, et al., 2004), are as follows:
1. Intentions are considered as a 'trap' or intermediary between the motivational factors that
influence behavior.
2. Intentions also indicate how far one has the will to try.
3. Intentions show the will of a person's measurements.
4. Intentions effect with continued behaviors.
According to Mangkunegara, (2005:29) intention is a predictor that includes when, where,
and how consumers act against a brand or product and is influenced also by factors immediately
preceding the behavior, which is influenced by attitude or personal component and social
component or norms prevailing in society. Based on these definitions, re-purchase intention is a
process of decision making by consumers for products offered or needed by consumers.
Research Methods
The design of this study using the study design causality, because causality is the purpose
of research to understand the variables that serve as the cause of the brand equity elements and
variables that function as a result (customer value and re-purchase intention).
Research Variables
Variables used in the study are:
1. Independent Variables: Brand Awareness, Perceived Quality, and Brand Loyal.
2. Dependent Variables: Customer Value and Purchase Intention Birthday
Population and Sample
The population in this study were all mobile brand Nokia consumers in Surabaya. Hence, these
study population characteristics are as follows:
1. Mobile phone brand Nokia consumers in Surabaya.
2. Minimum age 17 years.
3. Last educational background is at least high schoolers.
4. Minimun monthly income Rp.2.000.000, -.

8
5. Have a job.
In this study a sample size of 150 people as respondents were interviewed. Were intervied
dihapus saja. Sampling technique in this study is a not random (non-probability sampling), a
technique used to draw the sample is purposive sampling technique.
Data Analysis Tool
Data analysis techniques are used to test the influence of the elements of brand equity and
customer value to the consumer's purchase intention reset the Nokia brand mobile phones in
Surabaya is the Hierarchical Regression.
Results and Discussion
Description of Data Characteristic of Respondents
Characteristics of respondents based on the status of the respondent as a consumer mobile
phone brand Nokia in Surabaya can be seen in Table 1.
Table 1. Characteristics of Respondents Based on Consumer Mobile Brand Nokia
Consumer Mobile Brand Nokia Frequency (%)
Yes 150 100.0
No 0 0.0
Total 150 100.0 Source: Data processed
Based on Table 1 can it be known from the existing 150 respondents, all respondents
are consumers mobile phone brand Nokia.
Table 2. Characteristics of Respondents by Age
Age Frequency Percentage (%)
< 17 years 0 0.0
≥ 17 years 150 100.0
Total 150 100.0
Source: Data processed
Characteristics of respondents by age are shown in Table 2. Based on Table 2 can it be
seen that all respondents were aged ≥ 17 years. Characteristics of respondents by
education latter can be seen in Table 3.
Table 3. Characteristics of Respondents Based on Latest Education
Latest Education Frequency Percentage (%)
SMU 31 20.7
Diploma 28 18.7
S1 87 58.0
S2/S3 4 2.7
Total 150 100.0 Source: Data Processed

9
Based on Table 3 it can be seen from the 150 respondents, as many as 31 people
or 20.7% high school graduates, 28 people or 18.7% has diploma certified, 87 people or
58% possessed Bachelor Degree, and 4 people or 2.7 % last possessed S2/S3 Degree. This
indicates that most of S1-graduate respondents, 58%.
Tabel 4. Respondents Characteristic Based on Monthly Income
Income Frequency Percentage (%)
Rp. 2.000.000 – Rp. 4.000.000 73 48.7
Rp. 4.000.001 - Rp. 6.000.000 39 26.0
≥ Rp. 6.000.001, 38 25.3
Total 150 100.0 Source: Data Processed
Based on Table indicates that most respondents’ monthly income Rp. 2.000.000,
Rp. 4.000.000, -, amounting to 48.7%.
Table 5. Respondent Characteristic Based on Profession
Profession Frequency Percentage (%)
Civil Servants 38 25.3
Private Employees 53 35.3
Self-employed 41 27.3
Professional 18 12.0
Total 150 100.0 Source: Data processed
Based on Table 5 it can be inferred from the 150 respondents, as many as 38 people
or 25.3% work as civil servants, 53 people or 35.3% worked as private employees, 41
people or 27.3% worked as a self-employed, and 18 people or 12% work as professionals. This
shows that the majority of respondents worked as private employees, 35.3%.
Data Analysis
Effect of Elements and Brand Equity by Simultaneous Partial against Customer Value
To elucidate the influence of the elements of brand equity to variable customer value by
creating multiple linear regression equation. Multiple linear regression results are presented in
full in Table 6.
Table 6. Brand Equity Elements towards Customer Value
Notes
Standardized
Coefficients
(β)
t count Sig.
r r2
Brand Awareness (X1) 0,425 7,324 0,000 0,518 0,268
Perceived Quality (X2) 0,259 4,450 0,000 0,346 0,120
Brand Loyalty (X3) 0,308 5,327 0,000 0,403 0,162
Related Variable Customer Value (Y1)
F counting (3/146;5%) 221,785 Sig. = 0,000
R 0,906
R square 0,820
Source: Data processed
10
Based on Table 6 obtained value brand awareness variable (X1) = 0.425, perceived quality
(X2) = 0.259, brand loyalty (X3) = 0.308 and e1 = 0.424, resulting in a regression equation as
follows:
Y1 = 0.425 X1 + 0.259 X2 + 0.308 X3 + 0.424
Positive sign indicates that the elements of brand equity has a positive influence on
customer value.
Multiple correlation coefficient (R) are shown in Table 6 of 0.906 indicates that between
brand awareness (X1), perceived quality (X2) and brand loyalty (X3) simultaneously have a
strong influence on customer value. It has a strong influence because the correlation coefficient
value is between 0.8 and 1.0. Table 6 shows that the calculated F value is equal to 221.785 in
which the value is greater than the F table of 2.67. This gives the sense that the brand
awareness (X1), perceived quality (X2) and brand loyalty (X3) simultaneously have a strong
and significant influence on customer value.
The coefficient of multiple determination (R square) are shown in Table 6 of 0.820
indicates that the contribution of the variable changes brand awareness, perceived quality (X2)
and brand loyalty (X3) simultaneously to changes in customer value variables by 82%, while
the contribution of other factors that are not examined in this study by 18%.
Brand awareness partial correlation coefficients (r) are shown in Table 6 of 0.518 indicates
that brand awareness partially has a fairly strong influence on customer value. It is said to be
quite strong because the value of the correlation coefficient is between 0.4 and 0.6. Brand
awareness partial coefficient of determination (r2) of 0.268 indicates that the contributions of
changes in brand awareness variables are partially change in customer value variables by
26.8%. Significance value is indicated by the t count value of 7.324. This value is greater than
the table t value of 1.96. Therefore it can be stated that the brand awareness partially has a
fairly strong influence and significant impact on customer value.
Perceived quality of partial correlation coefficients (r) are shown in Table 6 of 0.346
indicates partially perceived quality has a weak influence on customer value. This value is
weak because the value of the correlation coefficient is between 0.2 - 0.4. Perceived quality of
partial coefficients of determination (r2) of 0.120 indicates that the contribution of changes in
perceived quality variables are partially changes in customer value variables by 12%.
Significance value is indicated by the t count value of 4.450. This value is greater than the table
t value of 1.96. Therefore it can be implied that the perceived quality partially influence is
strong enough and significant impact on customer value.
Brand loyalty partial correlation coefficients (r) are shown in Table 6 of 0.403 indicates that a
partial brand loyalty has a fairly strong influence on customer value. It is quite strong because
the value of the correlation coefficient is between 0.40 and 0.60. Brand loyalty partial
coefficient of determination (r2) of 0.162 indicates that the contributions of changes in brand
loyalty variables are partially change in customer value variables by 16.2%. Significance value
is indicated by the t count value of 5.327. This value is greater than the table t value of
1.96. Therefore it can be inferred that brand loyalty has partially strong enough influence and
significant impact on customer value.
11
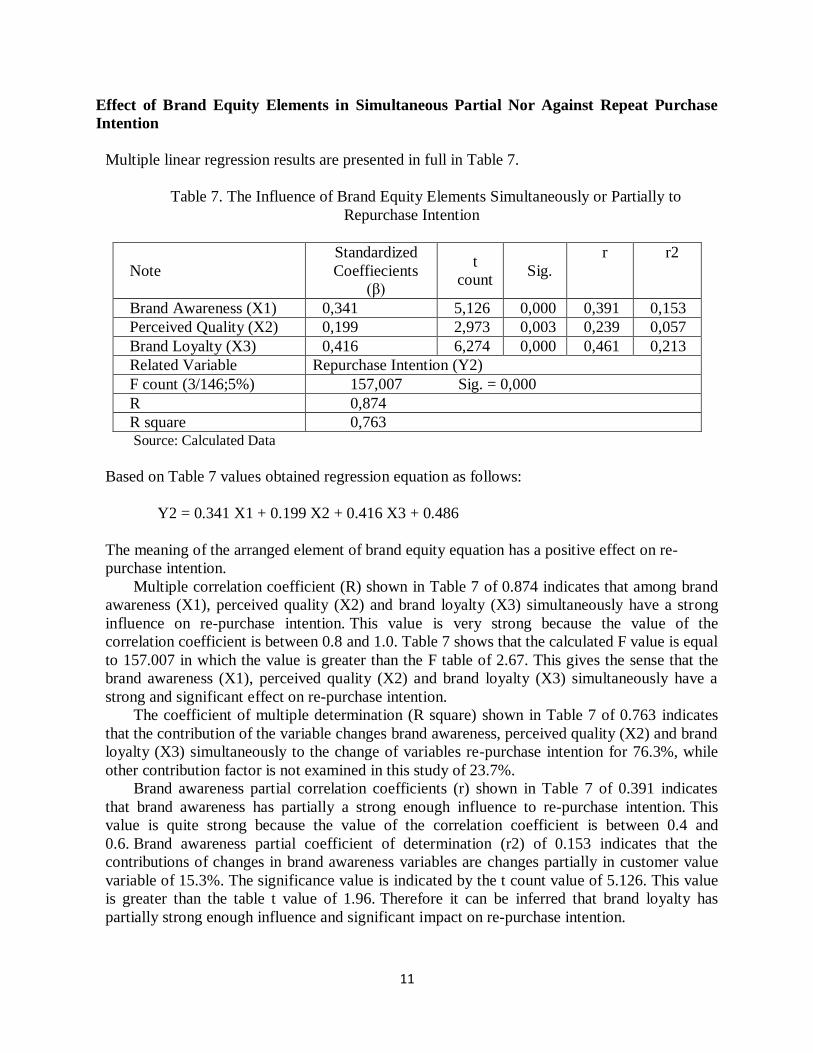
Effect of Brand Equity Elements in Simultaneous Partial Nor Against Repeat Purchase
Intention
Multiple linear regression results are presented in full in Table 7.
Table 7. The Influence of Brand Equity Elements Simultaneously or Partially to
Repurchase Intention
Note
Standardized
Coeffiecients
(β)
t
count Sig.
r r2
Brand Awareness (X1) 0,341 5,126 0,000 0,391 0,153
Perceived Quality (X2) 0,199 2,973 0,003 0,239 0,057
Brand Loyalty (X3) 0,416 6,274 0,000 0,461 0,213
Related Variable Repurchase Intention (Y2)
F count (3/146;5%) 157,007 Sig. = 0,000
R 0,874
R square 0,763 Source: Calculated Data
Based on Table 7 values obtained regression equation as follows:
Y2 = 0.341 X1 + 0.199 X2 + 0.416 X3 + 0.486
The meaning of the arranged element of brand equity equation has a positive effect on re-
purchase intention.
Multiple correlation coefficient (R) shown in Table 7 of 0.874 indicates that among brand
awareness (X1), perceived quality (X2) and brand loyalty (X3) simultaneously have a strong
influence on re-purchase intention. This value is very strong because the value of the
correlation coefficient is between 0.8 and 1.0. Table 7 shows that the calculated F value is equal
to 157.007 in which the value is greater than the F table of 2.67. This gives the sense that the
brand awareness (X1), perceived quality (X2) and brand loyalty (X3) simultaneously have a
strong and significant effect on re-purchase intention.
The coefficient of multiple determination (R square) shown in Table 7 of 0.763 indicates
that the contribution of the variable changes brand awareness, perceived quality (X2) and brand
loyalty (X3) simultaneously to the change of variables re-purchase intention for 76.3%, while
other contribution factor is not examined in this study of 23.7%.
Brand awareness partial correlation coefficients (r) shown in Table 7 of 0.391 indicates
that brand awareness has partially a strong enough influence to re-purchase intention. This
value is quite strong because the value of the correlation coefficient is between 0.4 and
0.6. Brand awareness partial coefficient of determination (r2) of 0.153 indicates that the
contributions of changes in brand awareness variables are changes partially in customer value
variable of 15.3%. The significance value is indicated by the t count value of 5.126. This value
is greater than the table t value of 1.96. Therefore it can be inferred that brand loyalty has
partially strong enough influence and significant impact on re-purchase intention.

12
Perceived quality of partial correlation coefficients (r) are shown in Table 7 of 0.239
indicates that partially perceived quality has a weak influence on the re-purchase intention. This
value is weak because the value of the correlation coefficient is between 0.2 - 0.4. Perceived
quality of partial coefficients of determination (r2) of 0.057 indicates that the contribution of
changes in perceived quality variables are partially to re-purchase intention variable changes of
5.7%. The significance value is indicated by the t count value of 2.973. This value is greater
than the table t value of 1.96. Therefore it can be stated that brand loyalty has partially strong
enough influence and significant impact on re-purchase intention.
Partial brand loyalty correlation coefficients (r) shown in Table 7 of 0.461 indicates that a
partial brand loyalty has a strong enough influence to re-purchase intention. This value is quite
strong because the value of the correlation coefficient is between 0.40 and 0.60. Partial brand
loyalty coefficient of determination (r2) of 0.213 indicates that the contributions of changes in
brand loyalty variables are partially to re-purchase intention variable changes of
21.3%. Significance value is indicated by the t count value of 6.274. This value is greater than
the table t value of 1.96. Therefore it can be inferred that brand loyalty has partially strong
enough influence and significant impact on re-purchase intention.
Effect of Customer Value Against Repeat Purchase Intention
Simple linear regression results are presented in full in Table 8. Based on Table 8
regression coefficient values obtained customer value variables (Y1) = 0.874 resulting in a
regression equation as follows:
Y2 = 0.874 Y1 + 0.486
The meaning of the arranged equation is customer value who has a positive effect on re-
purchase intention.
Table 8. Customer Value Influence on Repurchase Intention
Keterangan
Standardized
coeffiecients
(β)
t count Sig.
r r2
Customer value (Y1) 0,874 21,873 0,000 0,874 0,763
Related Variable Repurchase Intention (Y2)
F count (1/148;5%) 476,863 Sig. = 0,000
R 0,874
R square 0,763 Source: calculated data
Correlation coefficient (r) shown in Table 8 of 0.874 indicates that the partial value to the
customer has a strong influence on re-purchase intention. Said to be very strong because as the
value of the correlation coefficient is between 0.8 and 1.0.
The coefficient of multiple determination (r square) shown in Table 8 of 0.763 indicates
that the contribution of changes partially in customer value variables to the change of variables
re-purchase intention for 76.3%, while the contribution of other factors not examined in this
study of 23.7% .
Table 8 shows that the value t count is equal to 21.873 in which the value is greater than t
table by 1.96. This means that customer value has a strong and significant influence on re-
purchase intention.

13
Discussion
Effect of Elements and Brand Equity By Simultaneous Partial Against Customer Value
Based on Table 6 can be seen that the elements of brand equity have a positive influence
on customer value. Multiple correlation coefficient (R) indicates that brand awareness (X1),
perceived quality (X2) and brand loyalty (X3) have a strong influence on customer value
simultaneously. The coefficient of multiple determination (R square) indicates that the
contribution of changes in brand awareness variable (X1), perceived quality (X2) and brand
loyalty (X3) simultaneously to changes in customer value variables by 82%, while the
contribution of other factors not examined in this study by 18%. F values is calculated to give the
sense that the brand awareness (X1), perceived quality (X2) and brand loyalty (X3)
simultaneously have a strong and significant influence on customer value.
Partial correlation coefficients indicate partially brand awareness has a fairly strong
influence on customer value. Partial coefficient of determination indicates that the contribution
of partially brand awareness variable changes to changes in customer value variables by
26.8%. The significance value is indicated by the value of 7.324 to the t count. Therefore it can
be stated that the partially brand awareness has a strong enough influence and significant impact
on customer value.
Perceived quality of partial correlation coefficients showed partially perceived quality has
a weak influence on customer value. Perceived quality of partial coefficient of determination
indicates that the contribution of changes in perceived quality variables are partially to changes
in customer value variables by 12%.This significance value is indicated by the value of 4.450 to t
count. Hence, it can be stated that the perceived quality influenced partially is strong enough and
significant impact on customer value. Partial correlation coefficients show brand loyalty partially
has a fairly strong influence on customer value. Partial coefficient of determination indicates that
the contribution of partially brand loyalty variable changes to changes in customer value
variables by16.2%. The significance value is indicated by the value of 5.327 to t count.
Therefore, it can be stated that brand loyalty is partially have a strong enough influence and
significant impact on customer value. This processing of these data indicates conformity with the
opinion of Aaker (1991: 90) which states that "a variety of organizational effort was instrumental
in developing the brand equity dimensions, because the dimensions of brand equity have a
positive effect on providing value to customers". This reinforced of Aaker’s opinion (1991: 57)
which states that an understanding of the value of a product, will make it easier for customers in
making purchasing decisions. In any discussion of value to a customer, the knowledge related to
consumer behavior to be a prerequisite subject. This suggests that customers get the value of a
good product, so it will have positive influence on customer value. This finding is consistent
with research findings in Baldauf et al. (2003) which state that customer value is the total value
of customers gained in using a product/service so that customers will affect the re-purchase
intention of consumers. These findings also strengthen the research results in Baldauf et
al. (2003) which states that a person's ability to identify the prospective buyer or recall that a
brand is part of a particular product category, will affect the customer value.
Effect of Brand Equity Elements in Simultaneous Partial or Against Repurchase Intention
The results of processing the data in Table 7 shows that the element of brand equity has a
positive effect on re-purchase intention. Multiple correlation coefficients indicate that brand
awareness (X1), perceived quality (X2) and brand loyalty (X3) simultaneously have a strong
influence on re-purchase intention. The coefficient of multiple determinations indicate that the

14
contribution of changes in brand awareness variable (X1), perceived quality (X2) and brand
loyalty (X3) simultaneously to the change of variables re-purchase intention for 76.3%, while the
contribution of other factors not examined in this study for 23.7%. Calculated F value of 157.007
gave the sense that the brand awareness (X1), perceived quality (X2) and brand loyalty (X3)
simultaneously have a strong and significant effect on re-purchase intention.
Partial correlation coefficients indicate partially brand awareness has a strong enough
influence to re-purchase intention. Partial coefficient of determination indicates that the
contribution of partially brand awareness variable changes to changes in customer value variable
of 15.3%. The significance value is indicated by the value of 5.126 to t count because it can be
stated that partially brand loyalty have a strong enough influence and significant impact on re-
purchase intention.
Perceived quality of partial correlation coefficients showed that partially perceived quality
has a weak effect on re-purchase intention. Perceived quality of partial coefficient of
determination indicates that the contribution of changes in perceived quality variables are
partially to re-purchase intention variable changes of 5.7%. This significance value is indicated
by the value of 2.973 to t count because it can be stated that partial brand loyalty has a strong
enough influence and significant impact on re-purchase intention.
Partial correlation coefficients show that partial brand loyalty has a strong enough
influence to re-purchase intention. Partial coefficient of determination indicates that the
contribution of brand loyalty variable changes partially to re-purchase intention variable changes
of 21.3%. This significance value is indicated by the value of 6.274 to t count. It can be inferred
that partial brand loyalty has a strong enough influence and significant impact on re-purchase
intention.
This strengthens the opinion mentioned by Durianto et al., (2001:6) which stated that brand
awareness, perceived quality, and brand loyalty to other brand assets can affect consumers
repurchase intentions. If brand awareness, perceived quality, and brand loyalty is not so
important in the process of purchasing the brand, all three can reduce the consumers willingness
trying other brands.
This finding is consistent with research findings by Baldauf et al. (2003) which states that
consumers have brand awareness, perceived quality and brand loyalty that will either affect the
customer re-purchase intention.
Effect of Customer Value against Repeat Purchase Intention
Based on Table 8 it can be inferred that customer value has a positive effect on re-purchase
intention. The correlation coefficient shows that customer value is partially a strong influence on
re-purchase intention.
The coefficient of multiple determination indicates that the contribution of partially
changes in customer value variables towards the change of variables re-purchase intention for
76.3%, while the contribution of other factors are not examined in this study of 23.7%. T count
value of 21.873 means that customer value has a strong and significant influence on re-purchases
intention.
This reinforced the opinion of Umar (2003:424) indicates that brand awareness, perceived
quality, and brand loyalty can be interpreted as a set of brand assets and liabilities relating to a
brand, name and symbol, that enhances or deducts customer value that can emerge repurchase
intention.

15
This finding is consistent with research findings by Baldauf et al. (2003) which states that
consumers have brand awareness, perceived quality and brand loyalty that will either affect the
re-purchase intention of customers if the customers get good value from these products.
Influence Of Brand Equity Elements Simultaneously With The Customer Value Of
Consumer Intentions To Repurchase Nokia Brand Mobile Phones In Surabaya
Based on Table 6 it can be seen that the value of R for the influence of brand equity
elements simultaneously to customer value is equal to 0.906. Whereas according to Table 8 it
can be seen that the value of R to influence customer value on re-purchase intention amounted to
0.874. Based on these values it can be seen that the value of R for the influence of these elements
simultaneously with brand equity through customer value to the consumer's purchase intention
for the Nokia brand mobile phones in Surabaya amounted to 0.792. The results of this study
reinforce the opinion of Umar (2003:424) who states that the elements of brand equity can be
interpreted as a set of brand assets and liabilities relating to a brand, name and symbol that
enhances or deducts customer value worth to re-purchase intention. The results of this study are
also consistent with the results of Baldauf et al. (2003) which state that consumers who have
good brand equity will affect the re-purchase intention of customers if the consumer has such
good customer value.
CONCLUSION AND SUGGESTIONS
Conclusion
Based on the results of the analysis and conclusions of the discussion that can be formulated
is as follow:
1. Elements of brand equity, both partial and simultaneous effect on customer value in
Nokia mobile phones in Surabaya. The nature of the effect is positive, strong, and
significant.
2. Brand equity elements partially or simultaneously influence to consumers’ repurchase
intention on Nokia mobile phones in Surabaya. The nature of the effect is positive,
strong, and significant.
3. Customer value influence towards the repurchase intention as well as strong and
significant influence on Nokia mobile phone in Surabaya. The nature of the effect is
positive, strong, and significant.
4. The elements of brand equity simultaneously alongside with customer value influence
repurchase intention of consumers on Nokia mobile phone in Surabaya. The nature of the
effect is positive, strong, and significant.
Suggestion
Nokia's management should increase efforts in order to build brand equity elements. Given
that the elements of brand equity has a positive influence, strong, and significant impact on
customer value and to re-purchase intention.
For further research it is expected to perform in-depth study using other study variables
besides brand equity that can help increase customer value and an explanation of the re-purchase
intention.
References
Aaker, David, 1991, Brand Equity Management, Translation, London: Key Partners.

16
Aaker, D. A., 2004, Brand Portfolio strategy, creating relevance, differentiation, energy,
leverage and charity, New York: The Free Press.
Ajzen, Icek, 1998, Attitudes, Personality and Behavior, Berkshire, UK: Open University Press-
McGraw Hill Education.
Assael, Henry, 1998, Consumer Behavior and Marketing Action, 4th edition, Mass.: Kent
Publishing Company
Baldauf, Artur, Karen S. Cravens, and Gudrun Binder, 2003, Performance Consequences of
Brand Equity Management: evidence from organizations in the Value Chain, Journal of
Product & Brand Management, Vol. 12, No. 4: 220-236.
Chung, In-Keun and Myung-Moo Lee, 2003, A Study of Influencing Factors for Repurchase
Intention in Internet Shopping Malls, 0-7695-1926-1/03/$17.00 (C) IEEE. 1-7.
Cravens, David W., 1996, Strategic Marketing, Fourth Edition, Volume 2, London: Grants.
Durianto, Darmadi; Sugiarto and Tony Sitinjak, 2001, Conquer Strategy Through Market
Research Brand Equity and Behavior, New York: Scholastic Press.
Everett, Adam. E. and Roland J. Ebert, 1995, Production and Operation Management (Concept,
Models, and Behavior), Engelwood Cliffs, New Jersey: Prentice Hall Inc.
Garvin, DA, 1997, Competing on the Eight Dimensions of Quality, Harvard Business Review
Book: Keeping Customers, J Sviokla and Shapiro B. 119-37.
Jin, B. and G.S. Yong, 2005. Integrating effect of consumer perception factors in predicting
private brand purchase in a Korean discount store context, Journal Consumer Market, 22:
62-71.
Keller, K.L. 1993, Conceptualizing, Measuring, and Managing Customer-Based Brand Equity,
Journal of Marketing, Vol.57 (1).
______, 2003, Strategic brand management: Building, measuring, and managing brand equity,
2nd ed., Upper Saddle River, NJ: Prentice Hall.
Kim, Ji-Hern and Yong J. Hyun. 2011. A model to investigate the influence of marketing-mix
efforts and corporate image on brand equity in the IT software sector, Industrial Marketing
Management 40. 424–438
______, And Gary Armstrong, 1997, Principles of Marketing, Third Edition, Volume I, Jakarta:
PT. Prehallindo.
______, 2000, Marketing Management, Translation, Millennium Edition, London: grants.
Mangkunegara, Anwar P, 2005, Perilaku Konsumen, Edisi Revisi, Refika Aditama, Bandung.
Mowen, J.C., and M. Minor, 1995, Consumer Behavior, Boston: Irwin.
Rangkuti, Freddy, 2004, The Power of Brands: Techniques Managing Brand Equity and Brand
Development Strategy and Case Analysis with SPSS, New York: Scholastic Press.
Setyawan dan Ihwan, Anton A, Ihwan Susila, 2004, “Pengaruh Service Quality Perception
terhadap Purchase Intentions: studi empirik pada konsumen supermarket”, Usahawan, No
7 th XXXIII Juli, pp 29-37.
Tjiptono, F., 2004, Marketing Services, New York: Andi Offset.
Umar, Hussein, 2003, Research Methodology: Applications in Marketing, New York: Scholastic
Press.