The Inflation Songbook: Play it Again
23
David A. Rosenberg +1 416-583-5566 [email protected] rosenbergresearch.com The Inflation Songbook: Play it Again Author: David Rosenberg Economic Commentary May 14, 2021 IN THIS ISSUE THE INFLATION SONGBOOK: PLAY IT AGAIN • Inflation is not a one-off change in the price level caused by a short-term distortion to protect profit margins but is a persistent acceleration in prices • Pundits who are talking incessantly about the “Roaring Twenties” never tell anyone that for the next decade the economy was in a period of mild deflation and long-term bond yields actually fell 150 basis points • There is a 75% inverse correlation between the debt ratio and core inflation — the debt morass ends up being a future drag on real GDP growth and hence the downward pull on inflation and interest rates • Post-summer, expect to see production expand, demand growth recede, and all this inflation chatter to quiet down — and the case for a bull-flattener in the Treasury market will be very strong in that environment • It’ll be interesting to see what aggregate demand growth looks like in the future with an ongoing resource gap in the labor market and a consumer base that is tapped out when it comes to durable goods expenditure WANT TO GET MORE REPORTS LIKE THIS? FREE 30-DAY TRIAL: https://bit.ly/3yNEFiM
Transcript of The Inflation Songbook: Play it Again

David A. Rosenberg +1 416-583-5566 [email protected] rosenbergresearch.com
The Inflation Songbook: Play it Again Author: David Rosenberg
Economic Commentary May 14, 2021
IN THIS ISSUE
THE INFLATION SONGBOOK: PLAY IT AGAIN • Inflation is not a one-off change in the price level caused by a short-term distortion to protect profit margins
but is a persistent acceleration in prices
• Pundits who are talking incessantly about the “Roaring Twenties” never tell anyone that for the next decade the economy was in a period of mild deflation and long-term bond yields actually fell 150 basis points
• There is a 75% inverse correlation between the debt ratio and core inflation — the debt morass ends up being a future drag on real GDP growth and hence the downward pull on inflation and interest rates
• Post-summer, expect to see production expand, demand growth recede, and all this inflation chatter to quiet down — and the case for a bull-flattener in the Treasury market will be very strong in that environment
• It’ll be interesting to see what aggregate demand growth looks like in the future with an ongoing resource gap in the labor market and a consumer base that is tapped out when it comes to durable goods expenditure
WANT TO GET MORE REPORTS LIKE THIS?
FREE 30-DAY TRIAL:
https://bit.ly/3yNEFiM

ECONOMIC COMMENTARY May 14, 2021
rosenbergresearch.com Page 2 of 23
THE INFLATION SONGBOOK: PLAY IT AGAIN As Time Goes By (the fundamental things apply)
Let me just start off with what inflation is and what it isn’t.
Inflation is not a one-off change in the price level caused by a short-term distortion to protect profit margins but is a persistent acceleration in prices. It is a condition that lasts for years; it is not something that is temporary, and I am not going to debate whether we are seeing a deviation in the fundamental trendline since we clearly are now and likely will be for the next several months. But the trendline has not changed because of the pandemic; there has never been a natural disaster or a policy response to a natural disaster that ushered in a permanent change in the inflation trend, all they do is create short-term disturbances, distortions, and deviations. I think we must look at the pandemic in that light — a natural disaster on a global scale that has a huge impact on supply and on demand and generates huge disturbances, but they are not permanent. Nobody has suffered more natural disasters in the past decade than Japan with over 100 earthquakes, typhoons, and floods, and yet its inflation rate has gone from +0.2% to -0.2% over that timeframe, and that’s even with the fiscal spigots turned on to such an extent that its government debt-to-GDP ratio has ballooned from 180% to 225%.
CHART 1: Google Searches for “Inflation” United States (index)
Source: Google Trends, Rosenberg Research
You don’t have to rely on Japan — look at what happened to inflation coming out of the global pandemic of 1918-1919. The pundits out there now, who are talking incessantly about the “Roaring Twenties” as their new post-COVID-19 theme, never seem to tell anyone that for the next decade, the economy was in a period of mild deflation, not hyperinflation, and long-term bond yields actually fell 150 basis points through the entire piece.
40
50
60
70
80
90
100
110
2004 2006 2008 2010 2012 2014 2016 2018 2020
ECONOMIC COMMENTARY May 14, 2021
rosenbergresearch.com Page 3 of 23
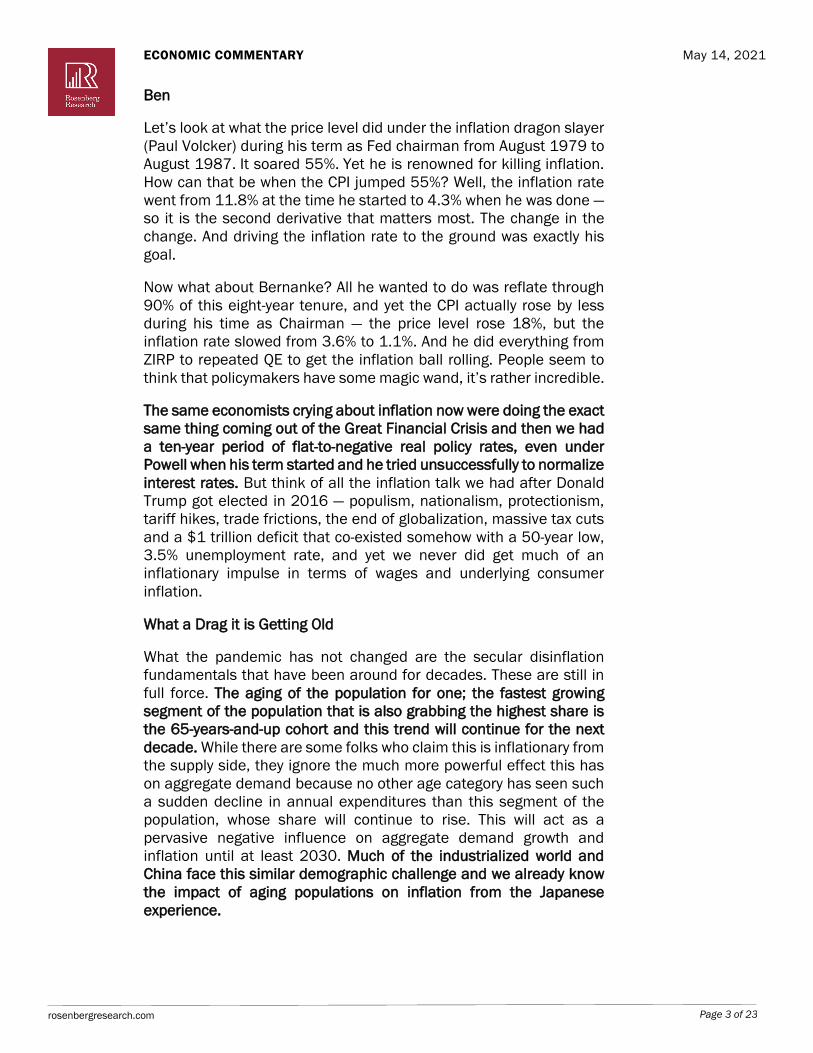
Ben
Let’s look at what the price level did under the inflation dragon slayer (Paul Volcker) during his term as Fed chairman from August 1979 to August 1987. It soared 55%. Yet he is renowned for killing inflation. How can that be when the CPI jumped 55%? Well, the inflation rate went from 11.8% at the time he started to 4.3% when he was done — so it is the second derivative that matters most. The change in the change. And driving the inflation rate to the ground was exactly his goal.
Now what about Bernanke? All he wanted to do was reflate through 90% of this eight-year tenure, and yet the CPI actually rose by less during his time as Chairman — the price level rose 18%, but the inflation rate slowed from 3.6% to 1.1%. And he did everything from ZIRP to repeated QE to get the inflation ball rolling. People seem to think that policymakers have some magic wand, it’s rather incredible.
The same economists crying about inflation now were doing the exact same thing coming out of the Great Financial Crisis and then we had a ten-year period of flat-to-negative real policy rates, even under Powell when his term started and he tried unsuccessfully to normalize interest rates. But think of all the inflation talk we had after Donald Trump got elected in 2016 — populism, nationalism, protectionism, tariff hikes, trade frictions, the end of globalization, massive tax cuts and a $1 trillion deficit that co-existed somehow with a 50-year low, 3.5% unemployment rate, and yet we never did get much of an inflationary impulse in terms of wages and underlying consumer inflation.
What a Drag it is Getting Old
What the pandemic has not changed are the secular disinflation fundamentals that have been around for decades. These are still in full force. The aging of the population for one; the fastest growing segment of the population that is also grabbing the highest share is the 65-years-and-up cohort and this trend will continue for the next decade. While there are some folks who claim this is inflationary from the supply side, they ignore the much more powerful effect this has on aggregate demand because no other age category has seen such a sudden decline in annual expenditures than this segment of the population, whose share will continue to rise. This will act as a pervasive negative influence on aggregate demand growth and inflation until at least 2030. Much of the industrialized world and China face this similar demographic challenge and we already know the impact of aging populations on inflation from the Japanese experience.

ECONOMIC COMMENTARY May 14, 2021
rosenbergresearch.com Page 4 of 23
CHART 2: Share of Population Aged 65 & Older United States (percent)
Source: Haver Analytics, Rosenberg Research
CHART 3: Consumer Spending Through the Life Cycle United States: Total consumer expenditures ($)
Source: Haver Analytics, Rosenberg Research
Video Killed the Radio Star
The accelerating pace of technological change has not changed either and is actually picking up momentum during this pandemic as businesses figured out they can do more with less labor input. Here we had the worst economy since 1946 last year and yet business volume spending on automation, IT equipment and software, expanded more than 6%. The share of business spending on productivity enhancements in the past 15 months has risen to an all-time high. And so, look at what is happening fundamentally in the real economy and we saw this in spades in the first quarter, where
10
12
14
16
18
20
22
1990 1995 2000 2005 2010 2015 2020 2025 2030

ECONOMIC COMMENTARY May 14, 2021
rosenbergresearch.com Page 5 of 23
productivity accelerated at a 4% year-over-year rate, or double the historical trend. It is still too early to make a complete assessment here as to whether we have seen a structural improvement in productivity, but it certainly is possible.
We have GDP back to record highs and employment still down more than 8%. Productivity, which was so lacking in the 1970s, is an inflation killer — it has a 40% inverse correlation with the year-over-year trend in consumer prices, total and core, because of the dampening impact on until labor costs, which is the mothers’ milk for inflation. The correlation between productivity and inflation, over cycles, is 40x more powerful than commodity prices, keeping in mind that we have seen no fewer than 15 commodity cycles in the past six decades and they all look like a recurring sequence of sine waves and each time, the inflationists claim that we are about to embark on a “commodity supercycle.” Twice in the last decade and change we have seen the oil price soar above $100 per barrel and each time, the underlying trend in inflation was not impaired.
CHART 4: IT Equipment & Software Equipment United States (year-over-year percent change)
Shading indicates recession Source: Haver Analytics, Rosenberg Research

ECONOMIC COMMENTARY May 14, 2021
rosenbergresearch.com Page 6 of 23
CHART 5: IT Equipment & Software Investment as a Share of GDP United States (percent)
Shading indicates recession Source: Haver Analytics, Rosenberg Research
CHART 6: Real Output per Hour United States (year-over-year percent change)
Shading indicates recession Source: Haver Analytics, Rosenberg Research
Another Day Older and Deeper in Debt
And then, of course, we have the greatest inflation killer of all which is excessive indebtedness, in that the all-economy debt-to-GDP ratio crossed above 250% back in the dotcom bubble and that was the threshold at which the growth in aggregate demand was impaired by the chokehold of extreme levels of indebtedness. We have the law of diminishing marginal utility as it pertains to debt decades ago, and we will come out of the pandemic with debt across the household, business and government sectors at an unprecedented 370% of
ECONOMIC COMMENTARY May 14, 2021
rosenbergresearch.com Page 7 of 23
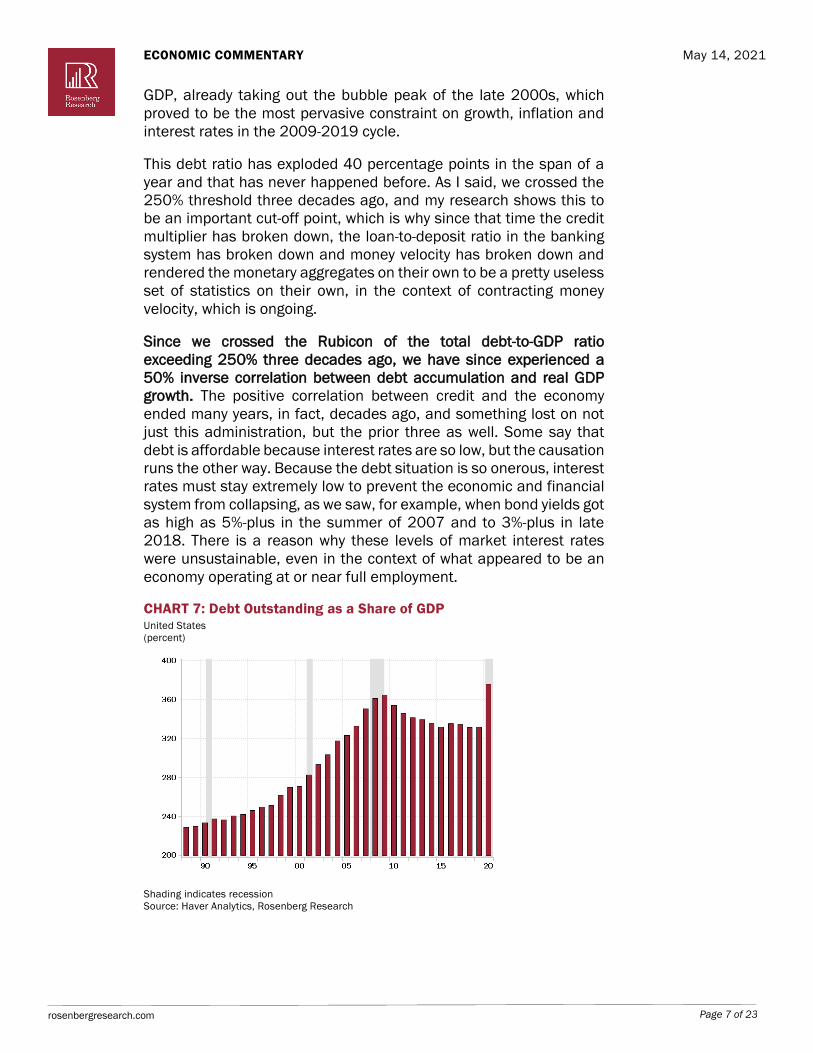
GDP, already taking out the bubble peak of the late 2000s, which proved to be the most pervasive constraint on growth, inflation and interest rates in the 2009-2019 cycle.
This debt ratio has exploded 40 percentage points in the span of a year and that has never happened before. As I said, we crossed the 250% threshold three decades ago, and my research shows this to be an important cut-off point, which is why since that time the credit multiplier has broken down, the loan-to-deposit ratio in the banking system has broken down and money velocity has broken down and rendered the monetary aggregates on their own to be a pretty useless set of statistics on their own, in the context of contracting money velocity, which is ongoing.
Since we crossed the Rubicon of the total debt-to-GDP ratio exceeding 250% three decades ago, we have since experienced a 50% inverse correlation between debt accumulation and real GDP growth. The positive correlation between credit and the economy ended many years, in fact, decades ago, and something lost on not just this administration, but the prior three as well. Some say that debt is affordable because interest rates are so low, but the causation runs the other way. Because the debt situation is so onerous, interest rates must stay extremely low to prevent the economic and financial system from collapsing, as we saw, for example, when bond yields got as high as 5%-plus in the summer of 2007 and to 3%-plus in late 2018. There is a reason why these levels of market interest rates were unsustainable, even in the context of what appeared to be an economy operating at or near full employment.
CHART 7: Debt Outstanding as a Share of GDP United States (percent)
Shading indicates recession Source: Haver Analytics, Rosenberg Research

ECONOMIC COMMENTARY May 14, 2021
rosenbergresearch.com Page 8 of 23
CHART 8: M2 Money Velocity United States (ratio)
Shading indicates recession Source: Haver Analytics, Rosenberg Research
CHART 9: Loan to Deposit Ratio United States (percent)
Shading indicates recession Source: Haver Analytics, Rosenberg Research

ECONOMIC COMMENTARY May 14, 2021
rosenbergresearch.com Page 9 of 23
CHART 10: Loans & Leases United States (year-over-year percent change)
Shading indicates recession Source: Haver Analytics, Rosenberg Research
Most people don’t know this, but the new paradigm of debt and growth and interest rates began in 1990, in the aftermath of the advent of the Leveraged Buyout Cycle, which once existed on the fringes of the financial system and is now endemic. The causation runs the other way. Higher debt growth past a certain limit is deflationary and exerts downward pressure on interest rates. In the past three decades, we have seen a 90% inverse correlation between the all-economy debt-to-GDP ratio and the 10-year Treasury note yield. There is a 75% inverse correlation between the debt ratio and core inflation — the debt morass and adding to it ends up being a future drag on real GDP growth and hence the downward pull on inflation and interest rates. Because today’s investor lives in the here and now and don’t have the same time horizons that used to exist before assets became trading vehicles, they don’t see what is going to happen around the bend.
That Joe Biden wants to rewrite the social contract with massive spending and debt may well level the playing field and make a whole lot of people better off, the historical record shows that this will not produce better economic outcomes. If a level playing field and larger government incursion into the economy were truly generators of better economic outcomes, then the Soviet Empire would not have collapsed and the leaders of economic growth in these past few decades would have been Italy, Greece, Portugal and Japan.
Shock the Monkey
At the same time, the way I see the situation, we are still in the grips of excess capacity in the product and labor markets. The truth is, there has been nothing quite like the disruption caused by the pandemic. The initial shock hit demand more than supply, so we had

ECONOMIC COMMENTARY May 14, 2021
rosenbergresearch.com Page 10 of 23
a temporary deflation shock to the global economy. Last spring, the three-month trend in the CPI was -4% and the three-month trend in the PPI was -8% at an annual rate and commodity prices were in a nosedive. Did that create the conditions for some persistent deflationary experience? Of course not. But the same holds true for the distortion we are now seeing in the opposite direction.
Now with the re-opening and fiscal juice boosting demand ahead of supply, we have a temporary inflationary situation on our hands that will get resolved in the second half of the year. It may take some time, as Jay Powell told us at the last FOMC meeting, and for all the bond bears and inflation-phobes out there who extrapolate the present into the future and gaze at the various purchasing manager surveys, the statement that resonated the most was that nobody should claim that they have a more extensive network of business contacts than the Fed has at its disposal. And while Joe Biden and his band of fiscal adventurers think they have a mandate to use the pandemic as a means to have government infiltrate the economy, the 2022 midterms will have a say in how long this lasts, as Clinton found out the hard way in 1994, Obama in 2010 and Trump in 2018.
It is 100% true that this time around, the pandemic has triggered supply chain disruptions and the lingering effects of COVID-19 have restricted the supply of some key materials and this is also the case on the labor front — though there is more than ample supply of idle workers waiting in the wings whether in manufacturing, construction, resources or consumer cyclical services. It is tough for me to wrap my head around the concept of a labor shortage when we have a total of 17 million available labor resources and that runs 6 million deeper than was the case a year ago. That is just a fact. Maybe there are constraints on freeing up those resources right now, but I do not see this as being anything more than a temporary situation that has continued to be influenced by the pandemic and the policy response to the pandemic.
While we are seeing companies in some sectors offering up pay sweeteners and signing bonuses, and as we saw in Friday’s payroll report some hefty wage increases to lure workers back in, keep in mind that a lot of this labor that is being held back will not be held back come September when the extended federal jobless benefits expire, assuming they do expire and when schools and day care centers fully open up (freeing up more of the female labor cohort). It has been very evident in the data that people have not returned to the labor force in full because of lingering health concerns, but again, moving from 40% vaccinations rates to 75% by the end of the summer is going to rectify this anomaly.
It is amazing to me that most economists spend most of their time looking at the trees instead of the forest past the trees. This is also the case with food, though inclement weather conditions (in Brazil but

ECONOMIC COMMENTARY May 14, 2021
rosenbergresearch.com Page 11 of 23
also in key growing parts of the U.S.) have played a role here in terms of pricing, not to mention the traders in the futures and options pits trying to make a quick buck as the net speculative long positions in corn, wheat and soybeans have been soaring to the moon. But with a lag, the basic laws of economics will reassert themselves, in that the vaccination success will help ease up whatever shortages seem to exist in the jobs market. And on the demand side, one can reasonably expect the end of the stimulus checks and uber-generous unemployment benefits in the third quarter to exert a sharp dampening influence.
As for further fiscal stimulus from the Biden team, including infrastructure, these latest proposals are already being met with some resistance in Congress, including some factions within the Democratic Party. So post-summer, expect to see production expand, demand growth recede, and all this price inflation chatter to quiet down. The case for a bull-flattener in the Treasury market will be very strong in that environment, all the more so since vibrant growth, accelerated inflation and an early return to Fed tightening has already been priced in.
CHART 11: Labor Supply United States (millions)
Shading indicates recession Source: Haver Analytics, Rosenberg Research
The Best Things in Life are Free
One very important element in all of this is where the new equilibrium personal savings rate levels off at once all the distortions play out. It goes without saying that it isn’t going to remain at 27.6%. And it is only there because government transfers have boomed 148% in the past year — real incomes excluding these fiscal giveaways are running barely above 1% on a YoY basis. We are now at a situation where consumer cyclical expenditures have recouped 70% of the huge loss but are still 20% below pre-pandemic peaks. But much of this

ECONOMIC COMMENTARY May 14, 2021
rosenbergresearch.com Page 12 of 23
spending is lost forever since there are only so many visits to restaurants, bars, salons, sporting events, movies, etc. that we can make in a given week, month, or year, not to mention how many vacations we can really afford to take.
And then there is this other little matter, which has accentuated the shortages of materials, which is the unprecedented consumer spending on durable goods during this crisis — soaring 44% in the year to March and well over 20% above the pre-COVID-19 peak. And keep in mind that this segment of personal consumption expenditure is more than double the areas of services that are primed for a post-COVID-19 recovery. That so-called “pent-down” demand, since nobody is building another deck in the backyard or fitting a second table in the dining room, may well provide a huge offset to the service sector rebound. What we then end up with is the government deficit bumping against massive surplus savings in the household sector, which then splashes a lot of cold water on the hawkish inflation and bearish interest views that have dominated the market narrative for much of this year.
And nobody I know is calling for a return to a 3.5% jobless rate, and yet we never did experience a normal wage and inflation cycle when we hit that 50-year low in late 2019 and early 2020. The last time we had a 3.5% unemployment rate, back in 1969, core inflation was 6% and the trend in wages was 6.5%. At this last go-around just over a year ago, core inflation was barely higher than 2% and the trend in wages was just over 3%. The Phillips Curve has flattened over time, and it isn’t clear to me yet that stimulus checks, vaccines and even future infrastructure is going to change the shape of that curve in any meaningful way. And yet, even with the unemployment rate not seen getting back to that low of 3.5%, the market somehow thought the funds rate is getting back to the peak of the last cycle, and the same for inflation. Just another way of saying a whole cycle of Fed tightening and peak inflation from the 2009-2019 period is already being discounted. The risk-reward ratio in bonds is tilted in a bullish pattern, all the more so since it has re-emerged as the most detested asset class. I understand that is an out-of-consensus view, but this is only an acknowledgment that there is a lot priced into bonds at the current time. Too much, from my viewpoint.
You have to ask yourself, if a 50-year low 3.5% unemployment rate couldn’t generate a normal wage and price inflation cycle — and a normal Fed rates cycle — then how will anything above that do the trick?
Out of the Gap
For all the talk of pervasive shortages and disrupted supply chains, this is also not a permanent situation. Production of semiconductors out of Taiwan and Korea are booming, as are exports. Lumber activity

ECONOMIC COMMENTARY May 14, 2021
rosenbergresearch.com Page 13 of 23
in Canada is soaring. The containers off the Ports of LA and Long Beach are filled to the brim and ready to be unloaded. So just as the fiscal stimulus wanes and the re-opening effect on demand subsides in the second half of the year, the supply will be coming back with a lag. I keep hearing once again about the end of globalization and yet world trade volumes have just managed to hit records both in level terms and as a share of GDP.
CHART 12: Merchandise Exports Taiwan ($ billions)
Shading indicates recession Source: Haver Analytics, Rosenberg Research
CHART 13: Merchandise Exports South Korea ($ billions)
Shading indicates recession Source: Haver Analytics, Rosenberg Research

ECONOMIC COMMENTARY May 14, 2021
rosenbergresearch.com Page 14 of 23
CHART 14: Merchandise Exports Taiwan (year-over-year percent change)
Shading indicates recession Source: Haver Analytics, Rosenberg Research
CHART 15: Merchandise Exports South Korea (year-over-year percent change)
Shading indicates recession Source: Haver Analytics, Rosenberg Research

ECONOMIC COMMENTARY May 14, 2021
rosenbergresearch.com Page 15 of 23
CHART 16: Port of LA Inbound Loaded Containers United States (year-over-year percent change)
Shading indicates recession Source: Haver Analytics, Rosenberg Research
CHART 17: Port of Long Beach Inbound Loaded Containers United States (year-over-year percent change)
Shading indicates recession Source: Haver Analytics, Rosenberg Research

ECONOMIC COMMENTARY May 14, 2021
rosenbergresearch.com Page 16 of 23
CHART 18: Trade Volume World (index)
Shading indicates recession Source: Haver Analytics, Rosenberg Research
CHART 19: Trade Unit Value World (index)
Shading indicates recession Source: Haver Analytics, Rosenberg Research
And then there is just the basic math. Any elementary course in economics will teach you that the price of labor, wages, and other compensation, should rise at a rate roughly equal to productivity growth plus inflation in an economy that is truly at this full-

ECONOMIC COMMENTARY May 14, 2021
rosenbergresearch.com Page 17 of 23
employment equilibrium. With productivity growth climbing at 4%, maximum employment and stable inflation will only occur when wages are running at a sustained rate of about 6%. Today, total labor compensation growth is below 3%, meaning that there is likely still considerable slack in the labor market. This is exactly the point that Powell is making, and I think next time, at the post-meeting Q&A press conference, he should just wheel out an old fashioned chalk board and show the math to everyone so they can understand this basic principle. We have a broad U-6 unemployment rate of 10.4% and inflation does not become a pervasive problem until this measure approaches 8%; and the industry-wide capacity utilization rate is 74% and inflation here does not become a persistent experience until it nears 78%.
CHART 20: U-6 Unemployment Rate United States (percent)
Shading indicates recession Source: Haver Analytics, Rosenberg Research
There have only been two other times in the past four decades when we had the U-6 unemployment and capacity utilization rates at these levels at the same time and it was November 2001 and September 2008, and I am not sure you wanted to be thinking about sustainable inflation and a new higher path for interest rates in those periods. Let’s just say that what these metrics speak to is an output gap of over 1% in the same quarter that that GDP growth is going to peak and then succumb to intense moderation as the stimulus checks wear off. Which means all the inflation risks going forward, fundamentally speaking, are to the downside because I think there is a good chance that after having never closed the output gap in all this policy stimulus, the deflationary output gap is going to rear its head again. This is not priced into any asset class and I think this may be the principal risk to the risk-on inflation narrative.
Take the Money and Run
One also has to remember that when forecasting interest rates, it is not the fiscal deficit alone that matters, but the entire savings pie

ECONOMIC COMMENTARY May 14, 2021
rosenbergresearch.com Page 18 of 23
relative to desired spending and investment. So while the deficit boom has resulted in the federal government having “dissaved” by $3 trillion over the past year, household savings have ballooned $4 trillion and the net savings in the corporate sector have expanded $100 billion (internally generated cash flows minus capital spending).
In other words, we are still stuck in a savings glut, and it remains to be seen just how profligate Congress will be in the future and just how much consumers are going to unleash their savings cache in view of the fact that the spending spree we will see in services is likely to be short-lived and that there is no pent-up demand for the much larger (more than double) market for household durable goods.
I keep hearing this term “dry powder” and “pent-up demand.” What makes you think that money gets spent after the flurry of spending on durables these past 12 months?
The assumption is that these savings have to get spent. Why is that? There is no pent-up demand for virtually every component of durable goods consumption. We have had this unusual situation where in a recession, spending on durable goods soared. The YoY trend today, of over 40%, is the strongest since 1950. At the same time, just as people start spending more on restaurants, theme parks, travel, and entertainment, we are completely maxed out on goods consumption. Here we are, a year after the economic trough, and spending volume on consumer goods is more than 12% higher than it was before the downturn began.
It took six years to accomplish that coming out of the 2008-09 Great Financial Crisis and three years following the 1990-91 and 2001-02 economic downturns. If you were to ever look at the chart of household ownership of durable goods assets per capita, the change in the past year to unprecedented levels looks like a dotcom stock from 1999. I kid you not. At the same time, the production of consumer goods is flat year-over-year but expanding nonetheless — up 17% from the trough, which is half the pace of consumer goods demand. But we will very likely see production become better realigned in the second half of the year. The process is already underway even if the bond bears and inflation-phobes use the CRB index as their primary focal point.

ECONOMIC COMMENTARY May 14, 2021
rosenbergresearch.com Page 19 of 23
CHART 21: CRB Commodity Price Index United States (year-over-year percent change)
Shading indicates recession Source: Haver Analytics, Rosenberg Research
CHART 22: Core CPI & CRB Commodity Price Index United States (red line; Core CPI; year-over-year percent change; LHS) (blue line; CRB index; year-over-year percent change; RHS)
Shading indicates recession Source: Haver Analytics, Rosenberg Research
We’ll see where the new post-pandemic personal savings rate levels out — something tells me it will be a lot higher than the pre-COVID-19 level of 7%, just as that 7% was higher than the 5% savings rate that existed before the Great Financial Crisis.
New York, New York
And we can see this shift in preferences towards saving in the data — look at the New York Fed’s tracking. Maybe this is why Biden felt the need to go big — less than 25% of these stimulus checks are going into the real economy and that share is going down with each fiscal

ECONOMIC COMMENTARY May 14, 2021
rosenbergresearch.com Page 20 of 23
package. One-third is going to pay down debt and over 40% is being saved, which is code for opening a Robinhood account. Either way, no assessment of where inflation is going can be done without some estimate of where the new post-pandemic personal savings rate is going to level off, and something tells me as a student of economic behavior that it is going to remain very high for an extended period of time.
In fact, the secular change in how households, not businesses or governments, have approached their balance sheets coming out of the Great Financial Crisis is most likely not going to change. This doesn’t mean that free money from the government won’t be spent, but what is most striking is that less than 25% of these stimulus checks have been finding their way into the economy, and it will be interesting to see what aggregate demand growth looks like in the future with an ongoing resource gap in the labor market, a consumer base that is tapped out when it comes to durable goods expenditure and the end of the gravy train when it comes to gargantuan fiscal stimulus. Though I’ll admit that ending the gravy train will probably end up resting on Joe Manchin’s vote and whether he represents his conservative state of West Virginia or the left-leaning UBI advocates of his own party.

ECONOMIC COMMENTARY May 28, 2021
rosenbergresearch.com Page 21 of 23
OUR PRODUCTS Breakfast with Dave Our flagship product, Breakfast with Dave, is an in-depth look into the global financial markets and the economy. You’ll access Dave’s deep data analysis and assessments of “big picture” trends, and his advice on how to invest around them.
Sample Report
Strategizer A monthly report designed to produce actionable investment ideas based on our proprietary models. The report covers a wide range of asset classes and sectors and will help investors identify shifts and opportunities in the investment landscape.
Sample Report
Webcast with Dave For these webcasts, David is joined by industry titans to share their views on the markets and the economy. Past and future speakers include Gary Shilling, Richard Bernstein, Niall Ferguson, Jeffrey Gundlach, and other legends.
Check out our guest line up
Early Morning with Dave Analysis of the overnight markets and global events. Dave’s take on macroeconomic trends from his global perspective will give you the insight you need to understand the investment landscape for the day ahead.
Sample Report
Technicals with Dave Each week Dave and our technical analysts engage their charting expertise to identify both broad secular trends and near-term shifts across all markets, including equities, fixed income, currencies and commodities.
Sample Report
Special or Thematic Reports Dave and the team produce periodic, high-level studies on the secular and structural shifts in the global economic and financial landscape.
Sample Report
Weekly Buffet with Dave Cap off your investment week with Dave’s digest of the key economic themes and investment ideas that moved the markets this week.
Sample Report
Charts with Dave Charts with Dave provides regular access to our latest slide deck. Dave’s charts capture the current and future trends in economic and market activity.
Sample Report
Deep Dives & Market Movers This periodic, event-based report offers analysis of breaking news and/or data releases that are affecting the markets and your investments.
Sample Report
For pricing information on any of our products contact us at: +1(416) 583-5566 [email protected]
FREE 30-DAY TRIAL:
https://bit.ly/3uvD3XQ

ECONOMIC COMMENTARY May 28, 2021
rosenbergresearch.com Page 22 of 23
CONTACT US 3080 Yonge Street, Suite 6060 Toronto, Ontario M4N 3N1
+1 416-583-5566 [email protected] www.rosenbergresearch.com
OUR PEOPLE
ECONOMICS
David Rosenberg Chief Economist & Strategist
Brendan Livingstone Senior Market Strategist
Ellen Cooper Senior Economist
Marius Jongstra Economist & Strategist
Vibhu Kapoor Economist
Julia Wendling Junior Economist
Keith Edwards Technical Analysis Consultant
Krishen Rangasamy Economic Consultant
OPERATIONS
Enrique Flores Chief Marketing & Technology Officer
Marcel Aulls Vice President, Sales
Dana Habib Office & Client Administration Manager and Executive Assistant to David Rosenberg
Rachael Zbar Corporate Director
Dinesh Vel Business Intelligence and Technology Manager
Jacob Rosenberg Client Relations Representative
Jeff Burchell Senior Advisor

ECONOMIC COMMENTARY May 28, 2021
rosenbergresearch.com Page 23 of 23
IMPORTANT DISCLOSURES
This report comments on the economy and capital markets. The opinions are those of the author as of the date of the report and are subject to change without notice. Rosenberg Research & Associates Inc. (Rosenberg Research) will not necessarily update the report in the event facts or opinions change.
This report is for discussion purposes only.
Although Rosenberg Research may provide commentary relating to investment approaches and opportunities to buy or sell securities, you should not construe such commentary as legal, tax, investment, financial or other advice. Nothing contained in any Rosenberg Research report or any other content on our web site constitutes a solicitation, recommendation, endorsement, or offer to buy or sell any securities or other financial instruments. Consult your own advisors if you require such advice.
This report should not be regarded by recipients as a substitute for the exercise of their own judgement and readers are encouraged to seek independent, third party research on any companies discussed or impacted by this report.
This report is not a research report under applicable U.S. rules and regulations.
Rosenberg Research does not guarantee the accuracy of any information in this report. This report may contain links to third-party websites. These links are provided as a convenience only. By providing these links, Rosenberg Research is not expressly or impliedly endorsing or approving these other sites, nor warranting or guaranteeing the content of the materials on such sites or the services or products that may be offered on such sites.
TERMS AND CONDITIONS OF USE
Your receipts and use of this report are governed by the Terms and Conditions of Use which may be viewed at [www.rosenbergresearch.com]
ANY USE OF THIS REPORT IS AT YOUR OWN RISK AND LIABILITY. NEITHER ROSENBERG RESEARCH, NOR ANY DIRECTOR, OFFICER, EMPLOYEE OR AGENT OF ROSENBERG RESEARCH, ACCEPTS ANY LIABILITY WHATSOEVER FOR ANY DIRECT, INDIRECT, CONSEQUENTIAL, MORAL, INCIDENTAL, COLLATERAL OR SPECIAL DAMAGES OR LOSSES OF ANY KIND, INCLUDING, WITHOUT LIMITATION, THOSE DAMAGES ARISING FROM ANY DECISION MADE OR ACTION TAKEN BY YOU IN RELIANCE ON THE CONTENT OF THIS REPORT, OR THOSE DAMAGES RESULTING FROM LOSS OF USE, DATA OR
PROFITS, WHETHER FROM THE USE OF OR INABILITY TO USE ANY CONTENT OR SOFTWARE OBTAINED FROM THIRD PARTIES REQUIRED TO OBTAIN ACCESS TO THE CONTENT, OR ANY OTHER CAUSE, EVEN IF ROSENBERG RESEARCH IS ADVISED OF THE POSSIBILITY OF SUCH DAMAGES OR LOSSES AND EVEN IF CAUSED BY ANY ACT, OMISSION OR NEGLIGENCE OF ROSENBERG RESEARCH OR ITS DIRECTORS, OFFICERS, EMPLOYEES OR AGENTS AND EVEN IF ANY OF THEM HAS BEEN APPRISED OF THE LIKELIHOOD OF SUCH DAMAGES OCCURRING.
![[Songbook] the Great American Songbook](https://static.fdocuments.in/doc/165x107/55cf99f3550346d0339fda47/songbook-the-great-american-songbook.jpg)