The induction zone/factor and sheared inflow: A linear ...
11
General rights Copyright and moral rights for the publications made accessible in the public portal are retained by the authors and/or other copyright owners and it is a condition of accessing publications that users recognise and abide by the legal requirements associated with these rights. Users may download and print one copy of any publication from the public portal for the purpose of private study or research. You may not further distribute the material or use it for any profit-making activity or commercial gain You may freely distribute the URL identifying the publication in the public portal If you believe that this document breaches copyright please contact us providing details, and we will remove access to the work immediately and investigate your claim. Downloaded from orbit.dtu.dk on: Feb 08, 2022 The induction zone/factor and sheared inflow: A linear connection? Meyer Forsting, AR; van der Laan, MP; Troldborg, Niels Published in: Journal of Physics: Conference Series Link to article, DOI: 10.1088/1742-6596/1037/7/072031 Publication date: 2018 Document Version Publisher's PDF, also known as Version of record Link back to DTU Orbit Citation (APA): Meyer Forsting, AR., van der Laan, MP., & Troldborg, N. (2018). The induction zone/factor and sheared inflow: A linear connection? Journal of Physics: Conference Series, 1037(7), [072031]. https://doi.org/10.1088/1742- 6596/1037/7/072031
Transcript of The induction zone/factor and sheared inflow: A linear ...
General rights Copyright and moral rights for the publications made accessible in the public portal are retained by the authors and/or other copyright owners and it is a condition of accessing publications that users recognise and abide by the legal requirements associated with these rights.
Users may download and print one copy of any publication from the public portal for the purpose of private study or research.
You may not further distribute the material or use it for any profit-making activity or commercial gain
You may freely distribute the URL identifying the publication in the public portal If you believe that this document breaches copyright please contact us providing details, and we will remove access to the work immediately and investigate your claim.
Downloaded from orbit.dtu.dk on: Feb 08, 2022
The induction zone/factor and sheared inflow: A linear connection?
Meyer Forsting, AR; van der Laan, MP; Troldborg, Niels
Published in:Journal of Physics: Conference Series
Link to article, DOI:10.1088/1742-6596/1037/7/072031
Publication date:2018
Document VersionPublisher's PDF, also known as Version of record
Link back to DTU Orbit
Citation (APA):Meyer Forsting, AR., van der Laan, MP., & Troldborg, N. (2018). The induction zone/factor and sheared inflow: Alinear connection? Journal of Physics: Conference Series, 1037(7), [072031]. https://doi.org/10.1088/1742-6596/1037/7/072031
Journal of Physics: Conference Series
PAPER • OPEN ACCESS
The induction zone/factor and sheared inflow: Alinear connection?To cite this article: AR Meyer Forsting et al 2018 J. Phys.: Conf. Ser. 1037 072031
View the article online for updates and enhancements.
Related contentSimultaneous estimation of wind shearsand misalignments from rotor loads:formulation for IPC-controlled windturbinesM. Bertelè, C.L. Bottasso and S. Cacciola
-
Full-scale measurements of aerodynamicinduction in a rotor planeGunner Chr Larsen and Kurt S Hansen
-
Comparison of wind turbine wakeproperties in non-uniform inflow predictedby different rotor modelsNiels Troldborg, Frederik Zahle, Niels NSørensen et al.
-
This content was downloaded from IP address 192.38.90.17 on 21/06/2018 at 13:24
1
Content from this work may be used under the terms of the Creative Commons Attribution 3.0 licence. Any further distributionof this work must maintain attribution to the author(s) and the title of the work, journal citation and DOI.
Published under licence by IOP Publishing Ltd
1234567890 ‘’“”
The Science of Making Torque from Wind (TORQUE 2018) IOP Publishing
IOP Conf. Series: Journal of Physics: Conf. Series 1037 (2018) 072031 doi :10.1088/1742-6596/1037/7/072031
The induction zone/factor and sheared inflow: A
linear connection?
AR Meyer Forsting1, MP van der Laan1, N Troldborg1
1 DTU Wind Energy, Technical University of Denmark, Risø Campus, DK-4000 Roskilde,Denmark
E-mail: [email protected]
Abstract. Sheared inflow causes significant periodic load variations in wind turbine blades,but has only limited impact on the mean wake deficit. Following these findings the wind speedreduction upstream of the turbine - referred to as the induction zone - might also show littledifference to uniform inflow. Using the local free-stream velocity to normalise the upstreamflow-field should then render uniform and sheared inflow induced velocity profiles indiscernible,hinting towards wind shear acting solely as a linear addition. This has great implicationsin BEM methods for determining the velocity at the blades and also for near-rotor lidarmeasurements. The latter being applied in for power/loads assessment and turbine control. LESsimulations with an actuator line representation of the rotor confirm the linearity assumptionfor moderate wind shear. To estimate the normal velocities at the disc the annularly averagedthrust coefficient is best suited, when the induction is imposed on the inflow profile. A strictlylocal relationship breaks down in strongly sheared flow. A simple induction zone model devisedfor uniform inflow estimates the velocity upstream within ±0.5% even at extreme shear in theupper half of the rotor and at least three rotor radii away from the turbine.
1. IntroductionThe flow incoming towards a wind turbine rotor is continuously decelerated by the rotor’sthrust force acting on it. The thrust is in turn a result of the aerodynamic forces actingover the rotor blades, which are directly linked to the velocities normal to the rotor plane.The free-stream or inflow velocity, V∞, is related to the normal/axial velocity, u, throughthe induction factor a, such that u = V∞(1 − a). This factor essentially quantifies thedeceleration introduced by the rotor forces. In sheared inflow V∞ becomes a function of heightz, but what about a? Field measurements and simulations by Meyer Forsting et al. [1] -supported by Simley et al. [2] - show a near constant a with height, when computed locally i.e.ashear(x) = 1−u(x)/V∞(z) = auniform(x). In fact following this normalisation little difference inthe flow-field upstream is found between uniform and moderately sheared inflow. This suggeststhat shear solely acts as linear perturbation to the the rotor flow for moderate shear. Thishas great implications for near-rotor lidar measurements, from which the free-stream velocity isestimated as reference for power and loads assessments. An induction zone model for uniforminflow [3] could thus be applied to sheared inflow, when assuming a certain velocity profile[4]. Despite first signs for an equivalence between uniform and sheared inflow a more thoroughand quantitative analysis is needed with respect to eventual non-linear effects at high thrustand extreme levels of shear. Previously the rotor was represented by constantly loaded discs,
2
1234567890 ‘’“”
The Science of Making Torque from Wind (TORQUE 2018) IOP Publishing
IOP Conf. Series: Journal of Physics: Conf. Series 1037 (2018) 072031 doi :10.1088/1742-6596/1037/7/072031
whereas in this study individual blades and their corresponding aerodynamic data are included.
2. Computational method2.1. Flow solver and modelling approachThe finite-volume solver, EllipSys3D, discretises the Navier-Stokes equations over a block-structured domain [5]. The turbulence is either modelled by a Reynolds-averaged Navier-Stokes(RANS) formulation with a Menter k−ω shear-stress transport (SST) closure [6] or by solving thefiltered Navier-Stokes equations with a sub-grid scale (SGS) model. Switching between modelsis determined by a limiter function as defined by Strelets [8]. This also determines whether theQUICK [9] (RANS) or a fourth-order CDS scheme (LES) discretises the convective terms. The
shear is specified at the inflow boundary in form of a power law V∞(z) = V∞,hub
(z+zhubzhub
)α. The
rotor forces of the NREL 5-MW [10] with a hub height of 90 m and 63 m blades are introducedby an actuator line (AL) [11].
2.2. Numerical setupThe numerical domain is defined as in preceding studies and detailed in [1]. The grid spacingaround the rotor is R/32, where R represents the rotor radius.
The atmospheric boundary layer is assumed to follow a power law with α = {0, 0.1, 0.3, 0.5}.As the blade forces are directly linked to the available kinetic energy sampled by the turbineF∫A
12ρV
2∞(x) dA it is kept constant for the different shear profiles. The rotor-based Reynolds
number is kept far above 105 [12] and the time step is set to 0.03 s at 9.2 rotations per minute.The smearing factor is set to twice the grid spacing and the tip correction by Shen et al. [13] isused with a modified constant c2 = 33. The latter are chosen to fit the results of the full rotorsimulations presented in [14].
3. Results and DiscussionAll following results and analyses are based on time-averaged quantities. The averaging periodencompasses 10 minutes, converging the residual of the mean quantities to 10−5.
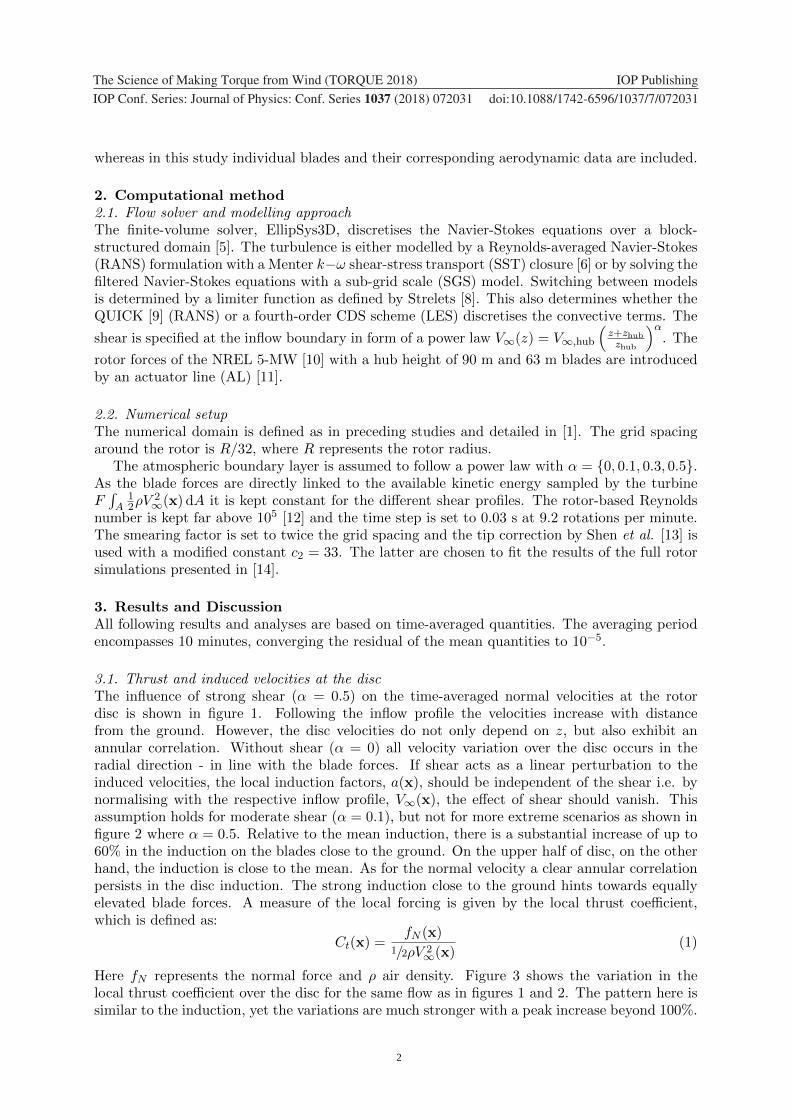
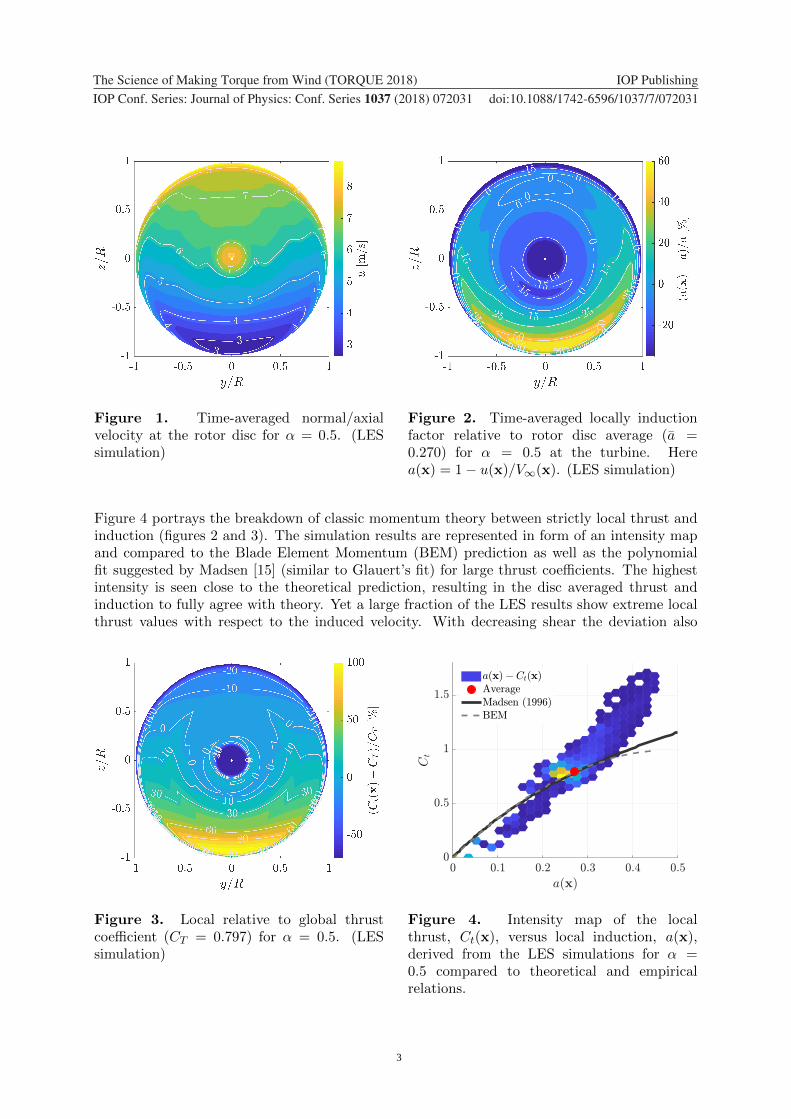
3.1. Thrust and induced velocities at the discThe influence of strong shear (α = 0.5) on the time-averaged normal velocities at the rotordisc is shown in figure 1. Following the inflow profile the velocities increase with distancefrom the ground. However, the disc velocities do not only depend on z, but also exhibit anannular correlation. Without shear (α = 0) all velocity variation over the disc occurs in theradial direction - in line with the blade forces. If shear acts as a linear perturbation to theinduced velocities, the local induction factors, a(x), should be independent of the shear i.e. bynormalising with the respective inflow profile, V∞(x), the effect of shear should vanish. Thisassumption holds for moderate shear (α = 0.1), but not for more extreme scenarios as shown infigure 2 where α = 0.5. Relative to the mean induction, there is a substantial increase of up to60% in the induction on the blades close to the ground. On the upper half of disc, on the otherhand, the induction is close to the mean. As for the normal velocity a clear annular correlationpersists in the disc induction. The strong induction close to the ground hints towards equallyelevated blade forces. A measure of the local forcing is given by the local thrust coefficient,which is defined as:
Ct(x) =fN (x)
1/2ρV 2∞(x)
(1)
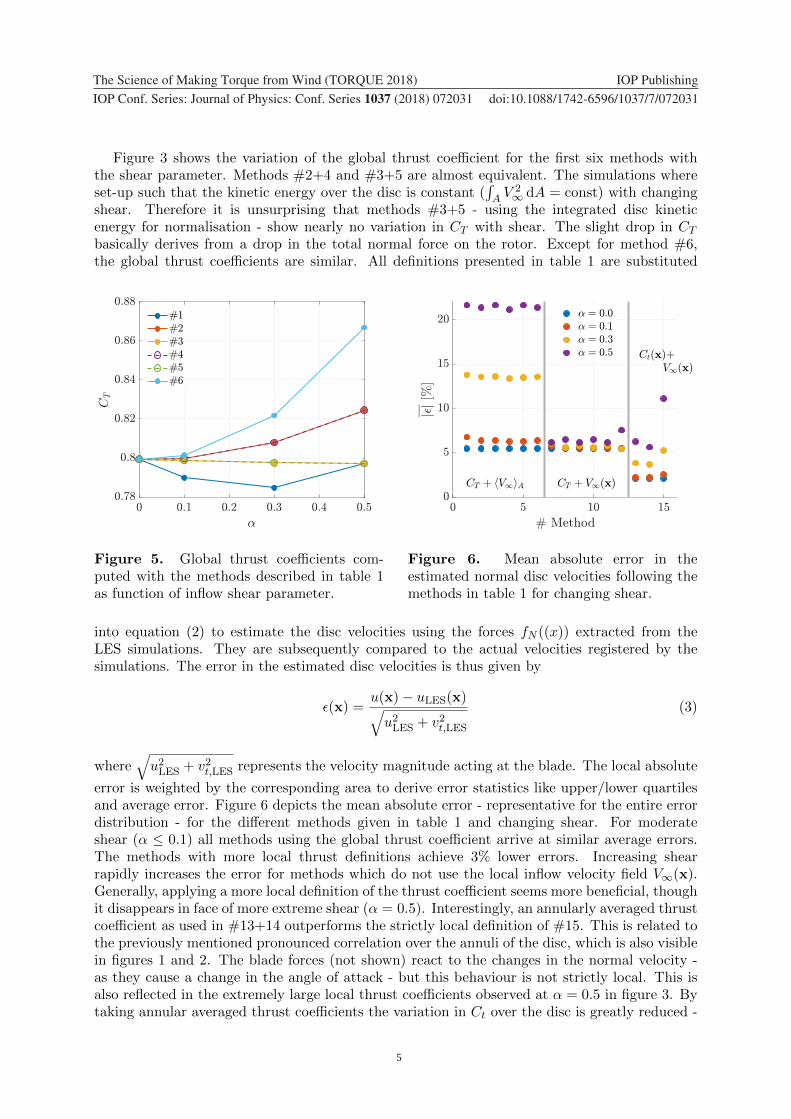
Here fN represents the normal force and ρ air density. Figure 3 shows the variation in thelocal thrust coefficient over the disc for the same flow as in figures 1 and 2. The pattern here issimilar to the induction, yet the variations are much stronger with a peak increase beyond 100%.
3
1234567890 ‘’“”
The Science of Making Torque from Wind (TORQUE 2018) IOP Publishing
IOP Conf. Series: Journal of Physics: Conf. Series 1037 (2018) 072031 doi :10.1088/1742-6596/1037/7/072031
Figure 1. Time-averaged normal/axialvelocity at the rotor disc for α = 0.5. (LESsimulation)
Figure 2. Time-averaged locally inductionfactor relative to rotor disc average (a =0.270) for α = 0.5 at the turbine. Herea(x) = 1− u(x)/V∞(x). (LES simulation)
Figure 4 portrays the breakdown of classic momentum theory between strictly local thrust andinduction (figures 2 and 3). The simulation results are represented in form of an intensity mapand compared to the Blade Element Momentum (BEM) prediction as well as the polynomialfit suggested by Madsen [15] (similar to Glauert’s fit) for large thrust coefficients. The highestintensity is seen close to the theoretical prediction, resulting in the disc averaged thrust andinduction to fully agree with theory. Yet a large fraction of the LES results show extreme localthrust values with respect to the induced velocity. With decreasing shear the deviation also
Figure 3. Local relative to global thrustcoefficient (CT = 0.797) for α = 0.5. (LESsimulation)
Figure 4. Intensity map of the localthrust, Ct(x), versus local induction, a(x),derived from the LES simulations for α =0.5 compared to theoretical and empiricalrelations.

4
1234567890 ‘’“”
The Science of Making Torque from Wind (TORQUE 2018) IOP Publishing
IOP Conf. Series: Journal of Physics: Conf. Series 1037 (2018) 072031 doi :10.1088/1742-6596/1037/7/072031
diminishes and nearly disappears at α = 0.
3.2. Estimating the normal disc velocitiesThe local divergence from BEM in sheared inflow may influence the results of simple design codes,as most of them use BEM-based models to determine the normal velocities at the rotor. Madsenet al. [14] compared different BEM implementations with full rotor and AL simulations andfound pronounced differences in the induced velocities even between the BEM implementations.They connected these differences to the exact procedure with which the induced velocities areestimated.
Following BEM theory the velocity at the disc is given by
u(x) = [1− a(x)]Vref(x) with a(x) = f(Ct(x)) (2)
,where the induction is itself a function of the thrust coefficient. Here the fit by Madsen[15] is used to relate Ct with a (also see figure 4). Equation (2) leads to very different discvelocities depending on the choices for Ct(x) and Vref(x). Table 1 lists the different combinationstested in this analysis. The first 6 methods set the local thrust to the global thrust coefficient(Ct(x) = CT ), but the definition of the reference velocity for computing the coefficient varies.The same reference velocity is used for determining the disc velocities. Methods #7-12 followthe same approach as previous once with regard to CT , but use the actual inflow profile V∞(x)to arrive at the disc velocities. The last three methods #13-15 use more local definitions of thethrust coefficient.
Table 1. Different definitions for estimating the induced velocities following equation (2). Herec = 1/2ρ and the average is abbreviated with 〈a〉b =
∫ba db/
∫bdb.
# Ct(x) Vref(x)
1 CT =(∫A fN (x) dA
) (cV 2{∞,hub}A
)−1V{∞,hub}
2 CT =(∫A fN (x) dA
) (c〈V∞(x)〉2AA
)−1 〈V∞(x)〉A3 CT =
(∫A fN (x) dA
) (c〈V 2∞(x)〉AA
)−1 √〈V 2∞(x)〉A
4 CT =(∫ACt(r) dA
)A−1 Ct(r) =
(∫θ fN (x) dθ
) (c〈V∞(x)〉2θ2πr
)−1 〈V∞(x)〉θ5 CT =
(∫ACt(r) dA
)A−1 Ct(r) =
(∫θ fN (x) dθ
) (c〈V 2∞(x)〉θ2πr
)−1 √〈V 2∞(x)〉θ
6 CT =(∫ACt(x) dA
)A−1 Ct(x) = (fN (x))
(cV 2∞(x)
)−1 √〈V 2∞(x)〉A
7 Equivalent to # 1 V∞(x)8 Equivalent to # 2 V∞(x)9 Equivalent to # 3 V∞(x)10 Equivalent to # 4 V∞(x)11 Equivalent to # 5 V∞(x)12 Equivalent to # 6 V∞(x)
13 Ct(r) =(∫θ fN (x) dθ
) (c〈V∞(x)〉2θ2πr
)−1V∞(x)
14 Ct(r) =(∫θ fN (x) dθ
) (c〈V 2∞(x)〉θ2πr
)−1V∞(x)
15 Ct(x) = (fN (x))(cV 2∞(x)
)−1V∞(x)
5
1234567890 ‘’“”
The Science of Making Torque from Wind (TORQUE 2018) IOP Publishing
IOP Conf. Series: Journal of Physics: Conf. Series 1037 (2018) 072031 doi :10.1088/1742-6596/1037/7/072031
Figure 3 shows the variation of the global thrust coefficient for the first six methods withthe shear parameter. Methods #2+4 and #3+5 are almost equivalent. The simulations whereset-up such that the kinetic energy over the disc is constant (
∫A V
2∞ dA = const) with changing
shear. Therefore it is unsurprising that methods #3+5 - using the integrated disc kineticenergy for normalisation - show nearly no variation in CT with shear. The slight drop in CTbasically derives from a drop in the total normal force on the rotor. Except for method #6,the global thrust coefficients are similar. All definitions presented in table 1 are substituted
Figure 5. Global thrust coefficients com-puted with the methods described in table 1as function of inflow shear parameter.
Figure 6. Mean absolute error in theestimated normal disc velocities following themethods in table 1 for changing shear.
into equation (2) to estimate the disc velocities using the forces fN ((x)) extracted from theLES simulations. They are subsequently compared to the actual velocities registered by thesimulations. The error in the estimated disc velocities is thus given by
ε(x) =u(x)− uLES(x)√u2LES + v2t,LES
(3)
where√u2LES + v2t,LES represents the velocity magnitude acting at the blade. The local absolute
error is weighted by the corresponding area to derive error statistics like upper/lower quartilesand average error. Figure 6 depicts the mean absolute error - representative for the entire errordistribution - for the different methods given in table 1 and changing shear. For moderateshear (α ≤ 0.1) all methods using the global thrust coefficient arrive at similar average errors.The methods with more local thrust definitions achieve 3% lower errors. Increasing shearrapidly increases the error for methods which do not use the local inflow velocity field V∞(x).Generally, applying a more local definition of the thrust coefficient seems more beneficial, thoughit disappears in face of more extreme shear (α = 0.5). Interestingly, an annularly averaged thrustcoefficient as used in #13+14 outperforms the strictly local definition of #15. This is related tothe previously mentioned pronounced correlation over the annuli of the disc, which is also visiblein figures 1 and 2. The blade forces (not shown) react to the changes in the normal velocity -as they cause a change in the angle of attack - but this behaviour is not strictly local. This isalso reflected in the extremely large local thrust coefficients observed at α = 0.5 in figure 3. Bytaking annular averaged thrust coefficients the variation in Ct over the disc is greatly reduced -
6
1234567890 ‘’“”
The Science of Making Torque from Wind (TORQUE 2018) IOP Publishing
IOP Conf. Series: Journal of Physics: Conf. Series 1037 (2018) 072031 doi :10.1088/1742-6596/1037/7/072031
covering a range of 20% relative to the mean, compared to 160% using a strictly local definition.In fact the BEM predicted connection between Ct and a (see figure 4) is recovered using theannular definition of the thrust coefficient.
3.3. Estimating velocities upstream of rotorWhereas the disc velocities are important for predicting turbine loads, the upstream decelerationin front of a rotor is of interest in power performance evaluation [4] and predictive control [16].
Troldborg and Meyer Forsting [3] devised a semi-analytical model from AL simulations ofmultiple rotors, that uses a vortex sheet formulation along the axial direction and a shapefunction for the radial dimension:
u(x, r, CT ) = 1−axial︷ ︸︸ ︷
a(x, CT )f(ε)︸︷︷︸radial
(4)
Here the • represents normalised quantities. For the detailed definitions refer to [3]. Numerically,Meyer Forsting et al. [1] showed the model to perform acceptably in moderate shear. Borraccinoet al. [4] applied the model to lidar measurements taken upstream of a commercial multi-megawatt turbine and reported positively on its accuracy. In this section previous work is
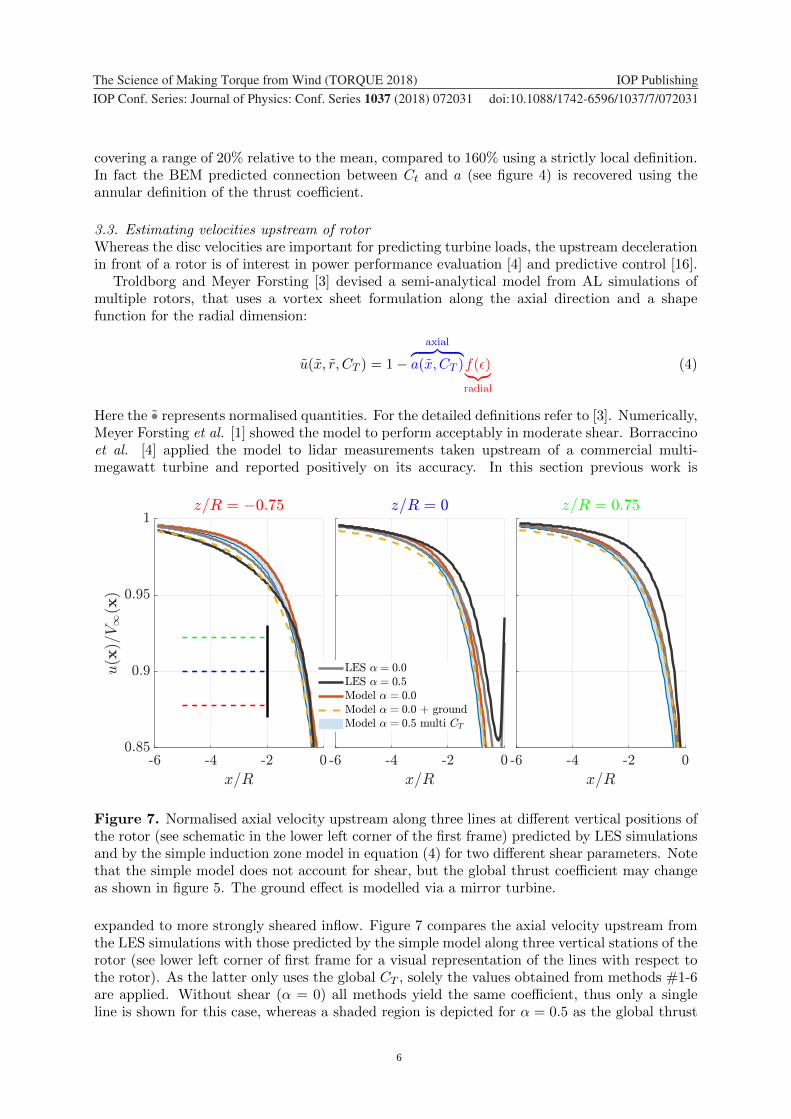
Figure 7. Normalised axial velocity upstream along three lines at different vertical positions ofthe rotor (see schematic in the lower left corner of the first frame) predicted by LES simulationsand by the simple induction zone model in equation (4) for two different shear parameters. Notethat the simple model does not account for shear, but the global thrust coefficient may changeas shown in figure 5. The ground effect is modelled via a mirror turbine.
expanded to more strongly sheared inflow. Figure 7 compares the axial velocity upstream fromthe LES simulations with those predicted by the simple model along three vertical stations of therotor (see lower left corner of first frame for a visual representation of the lines with respect tothe rotor). As the latter only uses the global CT , solely the values obtained from methods #1-6are applied. Without shear (α = 0) all methods yield the same coefficient, thus only a singleline is shown for this case, whereas a shaded region is depicted for α = 0.5 as the global thrust
7
1234567890 ‘’“”
The Science of Making Torque from Wind (TORQUE 2018) IOP Publishing
IOP Conf. Series: Journal of Physics: Conf. Series 1037 (2018) 072031 doi :10.1088/1742-6596/1037/7/072031
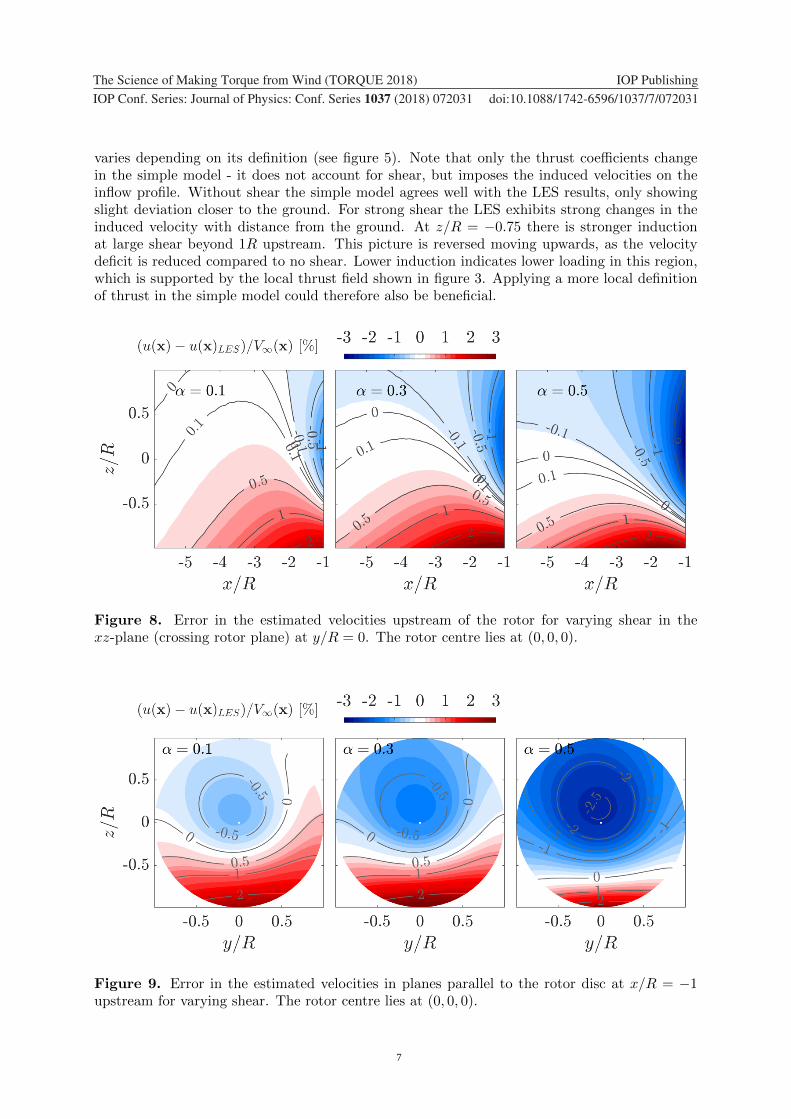
varies depending on its definition (see figure 5). Note that only the thrust coefficients changein the simple model - it does not account for shear, but imposes the induced velocities on theinflow profile. Without shear the simple model agrees well with the LES results, only showingslight deviation closer to the ground. For strong shear the LES exhibits strong changes in theinduced velocity with distance from the ground. At z/R = −0.75 there is stronger inductionat large shear beyond 1R upstream. This picture is reversed moving upwards, as the velocitydeficit is reduced compared to no shear. Lower induction indicates lower loading in this region,which is supported by the local thrust field shown in figure 3. Applying a more local definitionof thrust in the simple model could therefore also be beneficial.
Figure 8. Error in the estimated velocities upstream of the rotor for varying shear in thexz-plane (crossing rotor plane) at y/R = 0. The rotor centre lies at (0, 0, 0).
Figure 9. Error in the estimated velocities in planes parallel to the rotor disc at x/R = −1upstream for varying shear. The rotor centre lies at (0, 0, 0).

8
1234567890 ‘’“”
The Science of Making Torque from Wind (TORQUE 2018) IOP Publishing
IOP Conf. Series: Journal of Physics: Conf. Series 1037 (2018) 072031 doi :10.1088/1742-6596/1037/7/072031
As suggested by Branlard [17] and Meyer Forsting [1] an image vortex system is implementedto represent the ground - this equivalent to superposing the induced velocities of a neighbouringturbine located two hub heights downwards. Unfortunately, this does not improve thepredictions, except close to the ground.
Figures 8 and 9 give a more complete overview of the simple model error and its evolutionwith shear. The former shows the errors in the xz-plane through y/R = 0 (along the rotorcentreline) and the latter in the yz-plane parallel to the disc at x/R = −1. The error increaseswith shear, but is limited to ±0.5% of the local free-stream velocity in the region z/R > −0.25and x/R < −3. The yz-planes clearly show the asymmetry of the induction and depict the over-prediction of the normal velocity close to the ground. The under-prediction is circular abovehub height and the zero error line moves downwards with increasing shear.
4. ConclusionLES simulations with an actuator line representation of the rotor confirm the linearityassumption for moderate wind shear. To estimate the normal velocities at the disc the annularlyaveraged thrust coefficient is best suited when the induction is imposed on the inflow profile.A strictly local definition of the thrust and induction leads to strong over-prediction of theinduction in the rotor plane near the ground. Forces and induction exhibit a strong annularcorrelation over the rotor, such that the inflow velocity profile cannot simply be mapped ontothe rotor. A simple induction zone model devised for uniform inflow estimates the velocityupstream within ±0.5% even in extreme shear over a region which covers the upper half of therotor and is at least three rotor radii away from the turbine. The addition of a mirror vortexsystem - modelling the ground effect - does not improve the results, as it leads to over-predictionof the induction.
AcknowledgmentsThis work was performed inside the UniTTe project (unitte.dk), which is partially financed byThe Innovation Fund Denmark, grant number 1305-00024B.
References[1] Meyer Forsting A, Troldborg N, Bechmann A and Rethore P E 2017 Modelling Wind Turbine Inflow: The
Induction Zone Ph.D. thesis DTU Wind Energy Denmark[2] Simley E, Angelou N, Mikkelsen T, Sjoholm M, Mann J and Pao L Y 2016 Journal of Renewable and
Sustainable Energy 8[3] Troldborg N and Meyer Forsting A R 2017 Wind Energy ISSN 1099-1824 we.2137 URL
http://dx.doi.org/10.1002/we.2137
[4] Borraccino A, Schlipf D, Haizmann F and Wagner R 2017 Wind Energy Science Discussions 2 269–283 ISSN2366-7621
[5] Sørensen N 1995 General purpose flow solver applied to flow over hills Ph.D. thesis Risø National Laboratory[6] Menter F R 1993 Zonal two equation k − ω turbulence models for aerodynamic flows 23rd Fluid Dynamics,
Plasmadynamics, and Lasers Conference, Fluid Dynamics and Co-located Conferences (Orlando,FL)[7] Phouc T 1994 Modeles de sous maille appliques aux ecoulmements instationnaires decolles (LIMSI)[8] Strelets M 2001 Detached eddy simulation of massively separated flows 39th AIAA Aerospace Sciences
Meeting and Exhibit AIAA Paper 2001-0879 (Reno,NV)[9] Leonard B 1979 Computer Methods in Applied Mechanics and Engineering 19 59–98
[10] Jonkerman J, Butterfield S, Musial W and Scott G 2009 Definition of a 5-mw reference wind turbine foroffshore system development Tech. rep. NREL
[11] Srensen J N and Shen W Z 2002 Journal of Fluids Engineering 124 393–399[12] Troldborg N, Sørensen J and Mikkelsen R 2009 Actuator Line Modeling of Wind Turbine Wakes Ph.D. thesis
Technical University of Denmark[13] Shen W, Srensen J and Mikkelsen R 2004 Tip loss correction for actuator / Navier Stokes computations
(Delft University of Technology) pp 138–144

9
1234567890 ‘’“”
The Science of Making Torque from Wind (TORQUE 2018) IOP Publishing
IOP Conf. Series: Journal of Physics: Conf. Series 1037 (2018) 072031 doi :10.1088/1742-6596/1037/7/072031
[14] Madsen H A, Riziotis V, Zahle F, Hansen M, Snel H, Grasso F, Larsen T, Politis E and Rasmussen F 2012Wind Energy 15 63–81 ISSN 1099-1824 URL http://dx.doi.org/10.1002/we.493
[15] Aagaard Madsen H 1997 A CFD analysis of the actuator disc flow compared with momentum theory results(Technical University of Denmark. Department of Fluid Mechanics) pp 109–124
[16] Schlipf D, Fleming P, Haizmann F, Scholbrock A K, Hofsaß M, Wrigth A and Cheng P W 2012 Field testingof feedforward collective pitch control on the cart2 using a nacelle-based lidar scanner The Science ofMaking Torque from Wind
[17] Branlard E 2017 Wind Turbine Aerodynamics and Vorticity-Based Methods (Research Topics in Wind Energyvol 7) (Springer)