The Indian Mutual Fund Industry.ppt - wirc-icai.org · THE INDIAN MUTUAL FUND INDUSTRY ... AMFI...
14
THE INDIAN MUTUAL FUND INDUSTRY THE INDIAN MUTUAL FUND INDUSTRY CONFIDENTIAL; FOR INTERNAL USE ONLY
Transcript of The Indian Mutual Fund Industry.ppt - wirc-icai.org · THE INDIAN MUTUAL FUND INDUSTRY ... AMFI...

THE INDIAN MUTUAL FUND INDUSTRYTHE INDIAN MUTUAL FUND INDUSTRY
CONFIDENTIAL; FOR INTERNAL USE ONLY
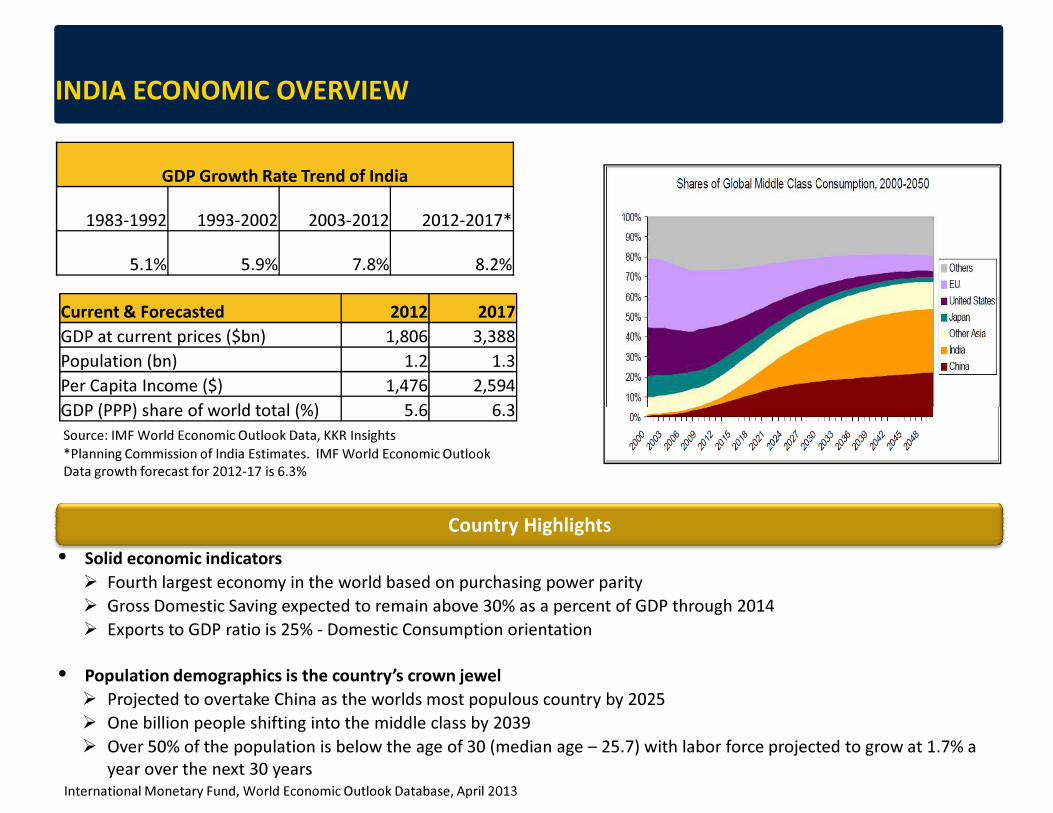
INDIA ECONOMIC OVERVIEW
GDP Growth Rate Trend of India
1983-1992 1993-2002 2003-2012 2012-2017*
5.1% 5.9% 7.8% 8.2%
Current & Forecasted 2012 2017
GDP at current prices ($bn) 1,806 3,388
Population (bn) 1.2 1.3
Per Capita Income ($) 1,476 2,594
GDP (PPP) share of world total (%) 5.6 6.3
Country Highlights
• Solid economic indicators
� Fourth largest economy in the world based on purchasing power parity
� Gross Domestic Saving expected to remain above 30% as a percent of GDP through 2014
� Exports to GDP ratio is 25% - Domestic Consumption orientation
• Population demographics is the country’s crown jewel
� Projected to overtake China as the worlds most populous country by 2025
� One billion people shifting into the middle class by 2039
� Over 50% of the population is below the age of 30 (median age – 25.7) with labor force projected to grow at 1.7% a
year over the next 30 yearsInternational Monetary Fund, World Economic Outlook Database, April 2013
GDP (PPP) share of world total (%) 5.6 6.3
Source: IMF World Economic Outlook Data, KKR Insights
*Planning Commission of India Estimates. IMF World Economic Outlook
Data growth forecast for 2012-17 is 6.3%

CAPITAL MARKETS
As on March 2013
Annualized Returns
Equity
Benchmark
Fixed
Income*
Since Inception (33 Years) 17% 9.6%
10 Years 19.7% 7.7%
5 Years 1.4% 8.4%
3 Years 1.9% 8.8%
* Bank Fixed Deposit rates used as representation for Fixed
Income
MSCI Index as of May 01,
2013 1 Yr 3 Yr 5 Yr 10 Yr
INDIA 12.5% 1.9% 1.4% 19.7%
CHINA 1.0% -1.5% -4.2% 16.1%
SOUTH KOREA -4.3% 4.0% 1.8% 12.3%
BRAZIL -3.7% -4.1% -5.2% 14.4%
RUSSIA -5.7% -1.6% -11.6% 8.6%
SOUTH AFRICA 8.2% 9.1% 5.2% 15.8%
EM ASIA 4.2% 2.7% -0.2% 12.0%
EM (EMERGING MARKETS) 3.0% 2.0% -1.1% 12.3%
Indian Capital Markets Has Delivered Attractive Returns
SECTOR
% MARKET CAP
INDIA BSE 500 INDEX
SECTOR WEIGHT PRIVATE SECTOR
Consumer Discretionary 10.0 10.0
Consumer Staples 11.1 11.1
Energy 10.4 6.4
Financials 26.5 21.1
Health Care 5.9 5.9
Industrials 9.2 7.9
Information Technology 10.1 10.1
Materials 10.3 9.9
Telecommunication
Services1.8 1.8
Utilities 4.6 2.0
Total 100.0 86.2
Private Enterprise Are Dominant In Indian Stock Markets
• The private sector has a 86% market
capitalization share.
• Country of entrepreneurs with a wide
market of more than 5,000 listed
stocks or 10.3% of the world’s share
(U.S. is 2nd with 8.4%).
Market sources, Bank websites, BSE/NSE Website, MSCI Website

CHALLENGES INVOLVED INVESTING DIRECTLY IN CAPITAL MARKET
� Time
� Expertise
� Lack of Information
� Portfolio
� Volatility

KEY INVESTMENT CONSIDERATIONS
Safety
You get your
money back
Liquidity
You get your money back when you want it
Plus Convenience
How easy is it to invest, disinvest
and adjust to your needs?
Post-tax Returns
How much is really left for you post tax?

WHAT IS MUTUAL FUND AND WHY MUTUAL FUND
� A mutual fund is the trust that pools the savings of a number of
investors who share a common financial goal.
� Anybody with an investible surplus of as little as a few hundred rupees
can invest in Mutual Funds.
� The money thus collected is then invested by the fund manager in
different types of securities. These could range from shares todifferent types of securities. These could range from shares to
debenture to money market instruments, depending upon the
scheme’s stated objective.
� It gives the market returns and not assured returns.
� In the long term market returns have the potential to perform better
than other assured return products.
� Mutual Fund is the most cost efficient distributors of financial products

STRUCTURE OF MUTUAL FUND
Custodian keeps safe custody of the investments (related documents of securities invested).

HOW MUTUAL FUND WORKS?
A VEHICLE FOR INVESTING IN PORTFOLIO OF STOCKS AND BONDS

TYPES OF MUTUAL FUNDS
Types of
Mutual Funds
By
Constitution
By
Investment Constitution
Objective
Close Ended Open Ended Interval Equity Funds Cash FundDebt Funds

ADVANTAGES OF MUTUAL FUNDS
1.Professional Management
2.Diversification
3.Convenient Administration
4.Return potential
5.Low cost
6.Liquidity6.Liquidity
7.Transparency
8.Flexibility
9.Choice of schemes
10.Well regulated
11.Tax benefits

MUTUAL FUND AUM GROWTH
5,000
10,000
15,000
20,000
25,000
40
60
80
100
120
140
160
US
D B
n
AUM— USD Bn(left-hand scale)
S&P BSE Sensex (right-hand scale)
-
5,000
0
20
40
Dec-01
Dec-02
Dec-03
Dec-04
Dec-05
Dec-06
Dec-07
Dec-08
Dec-09
Dec-10
Dec-11
Dec-12
Mar-13
• 2003 to 2007
� This growth was supported by strong equity market performance and enhanced liquidity conditions in the economy
• 2008 to 2012
� Growth more volatile due to tougher economic conditions globally and regulatory activism.
AMFI Website

ASSET MANAGEMENT MARKET
• Corporate and Institutional markets refers
primarily to corporate treasury’s and banks
investing in money market and short term debt
instruments
• ETF’s linked to gold dominate this category
• Overseas investing is relatively new and currently
opportunities are limited due to high domestic
interest rates. Also, companies are not encouraged
by regulators to make portfolio investments
overseas.
AUM - Asset Class Break Up
77
4230 3 0
50.6%
27.6%
19.7%1.8% 0.3%
0
10
20
30
40
50
60
70
80
90
Debt (Other
than Money
Market)
Equity Money
Market
ETFs Overseas
overseas.
11
Investor Category Assets
AUM as on 31-Dec-2012 in USD Bn % of Total
68
5 1
36 34
46.8%
3.8%0.7%
25.2% 23.5%
0
10
20
30
40
50
60
70
80
Corporates Banks/FIs FIIs High
Networth
Individuals
Retail
AUM as on Sep 30, 2012 USD Bn % of Total
37%
22%10%
18%
13% Indian Promoter
Foreign Promoter
Domestic Institutions
FIIs
Public / Others
Shareholding Pattern of Indian Equities
AMFI Website

INFLUENCING FACTORS
Macro-Economics
Macros continued to be stretched during the year especially on account of government deficits
Regulations
Evolving regulatory framework has kept strategy formulation in abeyance.
Distribution
New distributors are not entering the business.
Retail Investing
General apathy towards capital market investments
3
Earnings growth continued to be under pressure , but equity performance has been good.
Government’s aggression to push through key reforms brought late cheer
Stringent due diligence and penalties for mis-selling has been an issue
New client acquisition has been difficult.
Retention a struggle with closure of folios
Showed continued preference for avenues like Real Estate, Gold, Fixed Deposits
Equity market surge seen as an opportunity to exit from Equity MFs
A lot of these factors will continue to play out over the longer-term….we need to have
the staying power to harness them effectively

MACRO TRENDS
� Strong regulatory framework
― The capital markets regulator (“SEBI”) is one of the most robust capital market regulators in the world today
― Best in the class corporate governance standards and transparency
― Has a longer-term view on markets
� Policy orientation of the government is based on channelizing savings from physical assets to financial assets - capital markets, insurance, pensions, etc.
― Favourable tax regime for mutual funds
― Pending insurance reform & pension bill in parliament― Pending insurance reform & pension bill in parliament
― Regulation in place to permit foreign individuals to invest directly in capital markets & mutual funds
� However, there has been an economic slowdown
― Tough economic conditions globally, reduced export growth and current account deficit
― Inflation levels have declined considerably, but still present a risk to curtail demand generation
― Government’s inability to push through key administrative and investment reforms
― Slow implementation of key infrastructure projects have reduced India’s advantage
― Despite the slowdown, in rupee terms Foreign Institutional inflows into Indian equities for the year
2013 are at a record high
15