The Increasing Importance of Statistical Methods in Astronomy
4
nisms (magnetic fields and energy sources), gleaned from evidence of spectralline changes during the rotational modu- lation. We want to understand how the chromospheric struc- ture and magnetic heterogeneities behave according to the major stellar parameters, viz. mass, age, composition and rotation rate, and the present observations will provide us with a key to understanding both chromospheric heating mecha- nisms, and the dynamo mechanism in late-type stars. The Increasing Importance of Statistical Methods in Astronomy A. Heck, Observatoire Astronomique, Strasbourg, France F. Murtagh*, The Space Te/escope European Coordinating Faci/ity, European Southern Observatory 0. Ponz, European Southern Observatory You may ask: "What can a hard headed statistician ofter to a starry eyed astronomer?" The answer is: "Plenty." Narlikar (1982) Generalities In the past, astronomers did everything individually, from the conception of a project to the collection of data and their analysis. As the instrumentation became more complex, teams had to be set up and they progressively included people (astronomers or otherwise) specialized in technology. Today it is practically impossible to run a project at the forefront of astronomical research without the help of these technologists. In a similar way, one can already see that, at the other end of the chain, teams will have to include also people specialized in methodology to work on the collected data. And we are not thinking here only of image processing (which is a natural consequence of sophisticated technology), but mainly of a methodology applicable to already well-reduced data. This is actually the only way to face the challenge put to us by the accumulation of data. Compared to the past, we are indeed collecting now a huge amount of data (see e. g. Jaschek, 1978), and the rate will speed up in the next decades. Just think that the Space Telescope will send down, over an estimated lifetime of 15 years, the equivalent of 14 x 10 12 bytes of information, wh ich means a daily average of 4 x 10 9 bytes! But even if we exclude this special case of ST, we have now at our disposal more and more instruments which are collecting observations faster and faster. And these data are more and more diversified. The rate of data accumulation is higher than the rate of increase of the people able to work on them. Thus, we will have to work on bigger sampies if we want to take advantage and fully use the information contained in all these data, globally and individually. We might weil live at the end of the period when a significant number of astronomers are spending their lives investigating a couple of pet objects. If not, what would be the use of collecting so many data? One way to work efficiently on large sampies is to apply, and if necessary to develop, an adequate statistical methodology. If Nature Is consistent, the results obtained by applying the tools developed by the mathematicians and the statisticians • Affilialed 10 lhe ASlrophysies Division, Spaee Seienee Department, European Spaee Ageney. 22 should not be in contradiction with those obtained by physical analyses. However, do not let us say what we did not say: the statistical methodology is not intended to replace the physical analysis. It is complementary and it can be efficiently used to run a rough preliminary investigation, to sort out ideas, to put a new ("objective" or "independent") light on a problem or to point out si des or aspects which would not come out in a classical approach. A physical analysis will have anyway to refine and interpret the results and take care of all the details. Probably the most important statistical methods, for astronomical problems, are the multivariate methods such as Principal Components Analysis (PCA) and Cluster Analysis. The former allows the fundamental properties to be chosen for a possibly large number of observational parameters. This is clearly an important task, since the apparent complexity of a problem will necessarily grow with improvement in observa- tional techniques. The problem of c1ustering is that of the automatic classifica- tion of data. Clustering methods can also be employed to pick out anomalous or peculiar objects. These techniques all work at will in a multidimensional parametric space, while graphi- cally, and also classically in statistics, it is difficult to get results from more than two dimensions. These statistical methods are often considered as descriptive rather than inferential and, since astronomy is fundamentally a descriptive science, they would appear to be ideally suited for problems in this field. In the same way that instrumentation should not be employed without respecting its conditions of use, algorithms should not be applied as black boxes by non-specialists without paying attention to their applicability constraints and their result limitations. Forgetting this golden rule is the best way to contribute to the bad reputation of statistics while ruining from the start any attempt at elaborating relevant conclusions. Maybe somewhat paradoxically, astronomers have not been among the quickest to realize the potentialities of the "modern" statistical methodology. One of us (AH) became interested in 1974- 75 and produced among the first papers in the field. But the idea was in the air and applications started to multiply. He therefore suggested the holding of a first meeting on "Statistical methods in astronomy". It took place in Sep- tember 1983 at Strasbourg Observatory with the European Space Agency as co-sponsor (the proceedings were pub- lished as ESA SP-201). This was the first opportunity to bring together astronomers using various statistical techniques on different astronomical objects and to review the status of the methodology, not only among astronomers, but also with invited statisticians. The
Transcript of The Increasing Importance of Statistical Methods in Astronomy

nisms (magnetic fields and energy sources), gleaned fromevidence of spectralline changes during the rotational modulation. We want to understand how the chromospheric structure and magnetic heterogeneities behave according to the
major stellar parameters, viz. mass, age, composition androtation rate, and the present observations will provide us witha key to understanding both chromospheric heating mechanisms, and the dynamo mechanism in late-type stars.
The Increasing Importance of Statistical Methodsin AstronomyA. Heck, Observatoire Astronomique, Strasbourg, FranceF. Murtagh*, The Space Te/escope European Coordinating Faci/ity, European SouthernObservatory0. Ponz, European Southern Observatory
You may ask:"What can a hard headed statisticianofter to a starry eyed astronomer?"The answer is:"Plenty."
Narlikar (1982)
Generalities
In the past, astronomers did everything individually, fromthe conception of a project to the collection of data and theiranalysis. As the instrumentation became more complex,teams had to be set up and they progressively included people(astronomers or otherwise) specialized in technology. Today itis practically impossible to run a project at the forefront ofastronomical research without the help of these technologists.
In a similar way, one can already see that, at the other end ofthe chain, teams will have to include also people specialized inmethodology to work on the collected data. And we are notthinking here only of image processing (which is a naturalconsequence of sophisticated technology), but mainly of amethodology applicable to already well-reduced data. This isactually the only way to face the challenge put to us by theaccumulation of data.
Compared to the past, we are indeed collecting now a hugeamount of data (see e. g. Jaschek, 1978), and the rate willspeed up in the next decades. Just think that the SpaceTelescope will send down, over an estimated lifetime of 15years, the equivalent of 14 x 1012 bytes of information, whichmeans a daily average of 4 x 109 bytes! But even if we excludethis special case of ST, we have now at our disposal more andmore instruments which are collecting observations faster andfaster. And these data are more and more diversified. The rateof data accumulation is higher than the rate of increase of thepeople able to work on them.
Thus, we will have to work on bigger sampies if we want totake advantage and fully use the information contained in allthese data, globally and individually. We might weil live at theend of the period when a significant number of astronomersare spending their lives investigating a couple of pet objects. Ifnot, what would be the use of collecting so many data?
One way to work efficiently on large sampies is to apply, andif necessary to develop, an adequate statistical methodology.If Nature Is consistent, the results obtained by applying thetools developed by the mathematicians and the statisticians
• Affilialed 10 lhe ASlrophysies Division, Spaee Seienee Department, EuropeanSpaee Ageney.
22
should not be in contradiction with those obtained by physicalanalyses.
However, do not let us say what we did not say: thestatistical methodology is not intended to replace the physicalanalysis. It is complementary and it can be efficiently used torun a rough preliminary investigation, to sort out ideas, to put anew ("objective" or "independent") light on a problem or topoint out sides or aspects which would not come out in aclassical approach. A physical analysis will have anyway torefine and interpret the results and take care of all the details.
Probably the most important statistical methods, forastronomical problems, are the multivariate methods such asPrincipal Components Analysis (PCA) and Cluster Analysis.The former allows the fundamental properties to be chosen fora possibly large number of observational parameters. This isclearly an important task, since the apparent complexity of aproblem will necessarily grow with improvement in observational techniques.
The problem of c1ustering is that of the automatic classification of data. Clustering methods can also be employed to pickout anomalous or peculiar objects. These techniques all workat will in a multidimensional parametric space, while graphically, and also classically in statistics, it is difficult to get resultsfrom more than two dimensions. These statistical methods areoften considered as descriptive rather than inferential and,since astronomy is fundamentally a descriptive science, theywould appear to be ideally suited for problems in this field.
In the same way that instrumentation should not beemployed without respecting its conditions of use, algorithmsshould not be applied as black boxes by non-specialistswithout paying attention to their applicability constraints andtheir result limitations. Forgetting this golden rule is the bestway to contribute to the bad reputation of statistics whileruining from the start any attempt at elaborating relevantconclusions.
Maybe somewhat paradoxically, astronomers have notbeen among the quickest to realize the potentialities of the"modern" statistical methodology. One of us (AH) becameinterested in 1974-75 and produced among the first papers inthe field. But the idea was in the air and applications started tomultiply. He therefore suggested the holding of a first meetingon "Statistical methods in astronomy". It took place in September 1983 at Strasbourg Observatory with the EuropeanSpace Agency as co-sponsor (the proceedings were published as ESA SP-201).
This was the first opportunity to bring together astronomersusing various statistical techniques on different astronomicalobjects and to review the status of the methodology, not onlyamong astronomers, but also with invited statisticians. The

colloquium was areal success and another one is planned,most likely in 1987. In addition, a working group, concernedwith the application of statistical methodology to astronomicaldata, is being set up. A newsletter should keep interestedpersons in touch and informed of the various activities in thefield.
We shall present in the following a few examples of applications which do not exhaust all the possibilities and can onlygive a partial idea of the variety of the problems that can betackled with this methodology.
Photometry Versus Spectroscopy
Since practically nothing had been done when AH startedworking in the field, he was first concerned with the applicability of this "modern" statistical methodology to astronomy.Thus he decided to put the algorithms on the trial bench ofstellar data because there were a lot of such data availableand because the corresponding physics was weil established(and could be efficiently used for comparison).
Apriori, however, it might be more appropriate to apply thismethodology to non-stellar objects because their physics isless developed and because the data are more heterogeneous, incomplete, very diverse (continuous, discrete, binary,qualitative, ...) and are thus challenging for the methods.
In stellar astronomy, an interesting subject was to study theinterface between photometry and spectroscopy, especially inthe framework of stellar classification. In the past, photometrieand spectroscopic data were thought of as conflicting bysome astronomers, but today most consider these techniquesto be complementary. With P. C. Keenan (1973), we now "takeit as evident that the aims of stellar classification are the samewhether we work by direct photoelectric photometry throughfilters, by spectrophotometry, or by visual classification ofspectrograms" .
How weil could, for instance, photometrie indices of a starallow us to predict its spectral classification? Apart form itsscholastic interest, this question has direct practical observational implications since photometrie colours are much morequickly collected than good spectrograms, and with a smallerinstrument for a given object.
The first step (Heck, 1976) has been to point out bymultivariate statistical algorithms the most significant indicesor group of indices in the uvby ß photometrie system fordifferent ranges of spectral types. The photometrie catalog(Lindemann & Hauck, 1973) was considered as a set ofnumerical data and the only physical hypothesis wh ich intervened was a correlation between the effective temperatureand the spectral types. The results were in full agreement with
those of Strämgren (1966, 1967) obtained by physical analysis. The correct indices or groups of indices were selected asdiscriminators of luminosity and effective temperature.
The second step (Heck et al., 1977) was to directly confrontphotometrie and spectroscopic data by applying clusteringalgorithms in an adequate multivariate space to the photometrie indices of the same catalog (considered again purely as aset of numerical data). Then looking at the continuity of thearborescences or the homogeneity of the groups obtainedfrom the point of view of the spectral classification, it transpired that about 8 % of the stars where deviating significantlyfrom the ranges in spectral types and luminosity classes theyshould naturally belong to. These discrepancies resultedeither from a wrong spectral type (as some re-determinationsindicated), from poorly determined photometrie indices, orsimply because photometrie indices, even when weil selected,give information of a type different from the spectral features,and also from different wavelength coverages.
Might this mean that spectral classifications could be predicted from uvby ß indices with about 90 % chance of beingcorrect? This was investigated in a couple of subsequentpapers (Heck and Mersch, 1980; Mersch and Heck, 1980) byelaborating an algorithm involving isotonic regression (working on the ranks of the spectral subtypes and luminosityclasses) and stepwise multiple regressions (selecting the mostsignificant indices or combinations of indices).
It resulted that there was an 80 % chance of predicting thespectral type within one spectral subtype for luminosityclasses I to IV and an 87 % chance for luminosity class V. As faras luminosity was concerned, there were 44 %,28 % and 56 %chances of predicting it correctly for luminosity classes I, 111,and V respectively. This might point out some inability of theuvby ßphotometry alone to discriminate properly the luminosity and it would be worthwhile to undertake a similar study withdifferent photometry.
Ultraviolet Spectral Classification
The previous investigations were more centered on studying the applicability of the "modern" statistical methodology toastronomical data than on tackling new fields. An opportunitycame recently with the classification of IUE low-dispersionstellar spectra.
The International Ultraviolet Explorer (IUE), launched on 26January 1978 and still operating in an observatory mode, is themost successful astronomical satellite up to now. Details canbe found in Boggess et al. (1978a and b). We shall only recallhere that it is collecting low- and high-resolution spectra of allkinds of celestial objects in the ultraviolet wavelength range(UV) covering about 1 150 to 3200 Ängsträms.
0.2 (a) dA1•• 0.2BA~. '. I
.r. .p8gOl,"BO (bi 2·5
""6- gUl ._-g081,,05 dDl, dD2
" 0.0 dHb. • .,.ot. 0.0 dD6.
~.. aA.5 ,~ 0.5
01-'2 dDl . ••~g09 0 JY.• <lAli df4.:> -- dBI.5gBO.5 d~; .801 " .ro illl8. t;;IJI
~ des. .. dGS' sf'.! dA, -gD' dJlO.5c dDU.5'cU1 " ",,- gD~.5]-0.2 .~ -0.2 gBQ
dKdD2·S" •
f;.g .-09 og01
dDO.5 gO
gOL- ••09-o.h -O.h
- dG05
sOlo
-0.6 -0.6
-1.2 -1.0 -0. -0. -0. I -0.2 0.0 0.2 0.4 -1 . .:? -\,O -0.8 -0.6 -0,1, -0.2 0.0 0.2 O.LFirnt. fucl,or ~'i rat. fuct..or
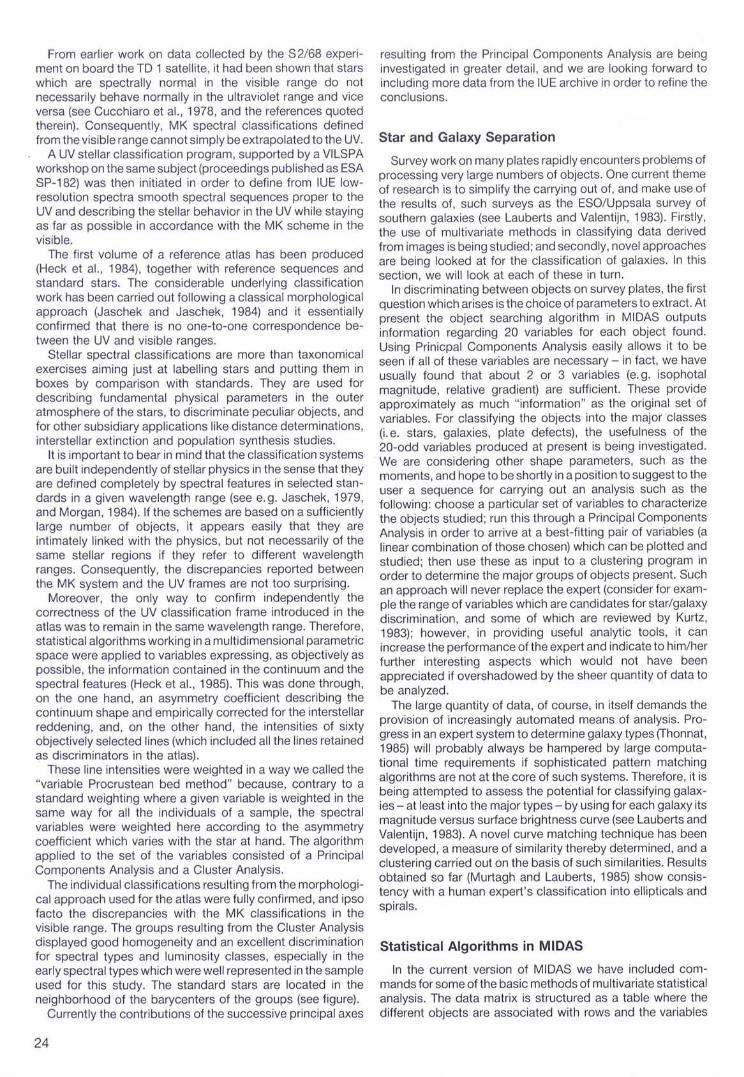
Distribution of the group barycenters in the plane of the first two PCA factors (a) and of the first and third PCA factors (b) derived from theIUE spectral data. Each center has been named according to the spectral mode in the multivariate space of the first twenty PCA factors.The UV spectral symbols have been introduced in Heck et al. (1984).
23
From earlier work on data collected by the S2/68 experiment on board the TD 1 satellite, it had been shown that starswhich are spectrally normal in the visible range do notnecessarily behave normally in the ultraviolet range and viceversa. (see Cucchiaro et al., 1978, and the references quotedtherem). Consequently, MK spectral classifications definedfrom the visible range cannot simply be extrapolated to the UV.
A UV stellar classification program, supported by a VILSPAworkshop on the same subject (proceedings published as ESASP-182) was then initiated in order to define from IUE lowresolution spectra smooth spectral sequences proper to theUV and descri~ing the stellar behavior in the UV while stayingas far as posslble m accordance with the MK scheme in thevisible.
The first volume of a reference atlas has been produced(Heck et al., 1984), together with reference sequences andstandard stars. The considerable underlying c1assificationwork has been carried out following a classical morphologicalapproach (Jaschek and Jaschek, 1984) and it essentiallyconflrmed that there is no one-to-one correspondence between the UV and visible ranges.
Stellar spectral classifications are more than taxonomicalexercises aiming just at labelling stars and putting them inboxes by comparison with standards. They are used fordescribing fundamental physical parameters in the outeratmosphere of the stars, to discriminate peculiar objects, andfor other subsidiary applications like distance determinationsinterstellar extinction and population synthesis studies. '
It is important to bear in mind that the classification systemsare budt Independently of stellar physics in the sense that theyare deflned completely by spectral features in selected standards in a given wavelength range (see e. g. Jaschek, 1979,and Morgan, 1984). If the schemes are based on a sufficiently!arge number of objects, it appears easily that they aremtlmately linked with the physics, but not necessarily of thesame stellar regions if they refer to different wavelengthranges. Consequently, the discrepancies reported betweenthe MK system and the UV frames are not too surprising.
Moreover, the only way to confirm independently thecorrectness of the UV c1assification frame introduced in theatlas was to remain in the same wavelength range. Therefore,statist/caIalgorithms working in a multidimensional parametricspac~ were applied to variables expressing, as objectively asposslble, the mformatlon contained in the continuum and thespectral features (Heck et al., 1985). This was done through,on the one hand, an asymmetry coefficient describing thecontmuum shape and empirically corrected for the interstellarre~dening, and, on the other hand, the intensities of sixtyobjectlvely selected lines (wh ich included all the lines retainedas discriminators in the atlas).
These line intensities were weighted in a way we called the"variable Procrustean bed method" because, contrary to astandard welghtlng where a given variable is weighted in thesame way for all the individuals of a sampie, the spectralvana~les were weighted here according to the asymmetrycoefflclent whlch vanes with the star at hand. The algorithmapplled to the set of the variables consisted of a PrincipalComponents Analysis and a Cluster Analysis.
The individual classifications resulting from the morphological approach used for the atlas were fully confirmed, and ipsofacta the discrepancies with the MK c1assifications in thevisible range. The groups resulting from the Cluster Analysisdlsplayed good homogeneity and an excellent discriminationfor spectral types and luminosity classes, especially in theearly spectral types which were weil represented in the sampieused for this study. The standard stars are located in theneighborhood of the barycenters of the groups (see figure).
Currently the contributions of the successive principal axes
24
resulting from the Principal Components Analysis are beingInvestlgated In greater detail, and we are looking forward toIncludmg more data from the IUE archive in order to refine theconclusions.
Star and Galaxy Separation
Survey work on many plates rapidly encounters problems ofprocessing very large numbers of objects. One current themeof research is to simplify the carrying out of, and make use ofthe results of, such surveys as the ESO/Uppsala survey ofsouthern galaxies (see Lauberts and Valentijn, 1983). Firstly,the use of multivariate methods in c1assifying data derivedfrom images is being studied; and secondly, novel approachesare being looked at for the classification of galaxies. In thissection, we will look at each of these in turn.
In discriminating between objects on survey plates, the firstquestion which arises is the choice of parameters to extract. Atpresent the object searching algorithm in MIDAS outputsInformation regarding 20 variables for each object found.Using Prinicpal Components Analysis easily allows it to beseen if all of these variables are necessary - in fact, we haveusually found that about 2 or 3 variables (e. g. isophotalmagnitude, relative gradient) are sufficient. These provideapproximately as much "information" as the original set ofvariables. For classifying the objects into the major c1asses(i. e. stars, galaxies, plate defects), the usefulness of the20-odd variables produced at present is being investigated.We are considering other shape parameters, such as themoments, and hope to be shortly in a position to suggest to theuser a sequence for carrying out an analysis such as thefollowing: choose a particular set of variables to characterizethe objects studied; run this through a Principal ComponentsAnalysis in order to arrive at a best-fitting pair of variables (alinear combination of those chosen) which can be plotted andstudied; then use these as input to a c1ustering program inorder to determine the major groups of objects present. Suchan approach will never replace the expert (consider for exampie the range of variables which are candidates for star/galaxydiscrimination, and some of which are reviewed by Kurtz,1983); however, in providing useful analytic tools, it canincrease the performance of the expert and indicate to him/herfurther interesting aspects which would not have beenappreciated if overshadowed by the sheer quantity of data tobe analyzed.
The large quantity of data, of course, in itself demands theprovision of increasingly automated means of analysis. Progress In an expert system to determine galaxy types (fhonnat1.985) ,,:,ill probably always be hampered by large computa~tlonal time requirements if sophisticated pattern matchingalgonthms are not at the core of such systems. Therefore, it isbeing attempted to assess the potential for classifying galaxles - at least into the major types - by using for each galaxy itsmagnitude versus surface brightness curve (see Lauberts andValentijn, 1983). A novel curve matching technique has beendeveloped, a measure of similarity thereby determined, and ac1ustering carried out on the basis of such similarities. Resultsobtained so far (Murtagh and Lauberts, 1985) show consistency with a human expert's classification into ellipticals andspirals.
Statistical Aigorithms in MIDAS
In the current version of MIDAS we have included commands for some of the basic methods of multivariate statisticalanalysis. The data matrix is structured as a table where thedifferent objects are associated with rows and the variables

are associated with columns. The methods currently availableare:
- Principal Components Analysis, to produce the projection of the data matrix onto the principal axes.
- Cluster Analysis, using hierarchical c1ustering with several agglomerative criteria (single link, complete link, minimumvariance, etc.).
- Fast iterative non-hierarchical c1ustering methods.In this context, the tables in MIOAS provide a bridge
between the raw data and the algorithms for analysis. Oataoriginally in the form of images or catalogs can be put into theanalysis program by structuring the extracted information astables, a natural way of representing the objects in theparameter space.
These commands are in an experimental state. Work isongoing in making more statistical methods available withinthe interactive framework of MIOAS. Special attention will begiven to the friendliness of usage by means of display facilitiesand easy interaction. Unlike many statistical packages commercially available, MIOAS ofters the advantage of integratingimage processing algorithms with extensive graphicscapabilities and, of course, the statistical methods.
The linking-up of data collection and of statistical dataanalysis - of database creation and of an important use towhich a database is put - is also of singular importance. Thefuture existence of an ESO and of aSpace Telescope archivecreates exciting possibilities for the possible use of multivariate statistical procedures on a large scale. A step of farreaching implications was taken a few years aga when thelarge-scale archiving of data was linked to the down-streamanalyzing (by multivariate statistical methods) of such data:this was when Malinvaud, head of the French statisticalservice (INSEE), strongly linked the two together (Malinvaudand Oeville, 1983). Multivariate statistical analysis of datarequires that the data collection be competently carried out;and, in return, it ofters the only feasible possibility for condensing data for interpretation if the data is present in verylarge quantities.
A Collaborative Future
Current trends in astronomical research not only createprospects for statistical methods to be used, but for reasonsmentioned in this article they require them. The flow will not be
just one-way however: statisticians will also learn from theproblems of astronomy. Computational problems related tothe large amounts of data which must be handled, the bestways to treat missing values and mixed qualitative-quantitative data, and even the most appropriate statistical methods toapply - all these and many more currently unforeseen issueswill lead to a very fruitful and productive interaction betweenmethodologist and astronomer over the coming years.
ReferencesBoggess, A. et al. 1978a, Nature 275, 377.Boggess, A. et al. 178 b, Nature 275, 389.Cucchiaro, A., Jaschek, M., Jaschek, C. 1978, An atlas of ultraviolet
stellar spectra, Liege and Strasbourg.ESO 1985, MIDAS Operating Manual No. 1.Heck, A. 1976, Astron. Astrophys. 47, 129.Heck, A., Albert, A., Delays, 0., Mersch, G. 1977, Astron. Astrophys.
61,563.Heck, A., Egret, 0., Jaschek, M., Jaschek, C. 1984, IUE low-dispersion
spectra relerence atlas. Part 1. Normal stars. ESA SP-1052.Heck, A., Egret, 0., Nobelis, Ph., Turlot, J. C. 1985, Statistical classili-
cation 01 IUE low-dispersion stellar spectra, in preparation.Heck, A. and Mersch, G. 1980, Astron. Astrophys. 83, 287.Jaschek, C. 1978, Q. J. Roy. Astron. Soc. 19, 269.Jaschek, C. 1979, in Classification Spectrale, Ecole de Goutelas, ed.
D. Ballereau, Obs. Meudon.Jaschek, M. and Jaschek, C., 1984, in The MK Process and Stellar
Classification, ed. R. F. Garrison, David Dunlap Obs., p. 290.Keenan, P. C. 1973, in Spectral Classification and Multicolour Photo
metry, ed. Ch. Fehrenbach and B. E. Westerlund, D. Reidel Publ.Co., Dordrecht, p. 3.
Kurtz, M. J. 1983, in Statistical Methods in Astronomy, ESA SP-201,p.47.
Lauberts, A. and Valentijn, E. A. 1983, The Messenger 34, 10.Lindemann, E. and Hauck, B. 1973, Astron. Astrophys. Suppl. 11,119.Malinvaud, E. and Deville, J. C. 1983, J. Roy. Statist. Soc. A 146,
335-361.Mersch, G. and Heck, A. 1980 Astron. Astrophys. 85, 93.Morgan, W. W. 1984, in The MK Process and Stellar Classification,
ed. R. F. Garrison, David Dunlap Obs., p. 18.Murtagh, F. and Lauberts, A. 1985, Comm. to Fourth Meeting 01
Classilication Societies, Cambridge.Narlikar, J. V. 1982, Indian J. Statist. 44, 125.Strömgren, B. 1966, Ann. Rev. Astron. Astrophys. 4, 433.Strömgren, B. 1967, in The Magnetic and Related Stars, ed. R.
Cameron, Mono Book Corp., Baltimore, p. 461.Thonnat, M. 1985, INRIA (Centre Sophia Antipolis) Report No. 387.
The following information on instrumentation has been provided by the Optical Instrumentation Group.
The ESO Multiple Object Spectroscopic Facility "OPTOPUS"
OPTOPUS is a fiber-optics instrument intended for multipleobject spectroscopy with the Boiler & Chivens spectrographand a CCO detector at the 3.6 m telescope. Using the Optopussystem, the spectra from up to 47 independent objectslocated within a 33 arcmin field can be simultaneously recorded.
Overall View of the System
For multi-object observations, the B & C spectrograph ismounted on a separate frame within the Cassegrain cage of
the 3.6 m telescope and a special fiber optics adaptor is fixedto the Cassegrain flange. The adaptor serves as a support formetal templates (starplates) containing precisely drilled holes(corresponding to the objects of interest for a given observedfield) into wh ich the individual fibers are connected. Thefibers,serving the purpose of a flexible light transport from focalplane to spectrograph, are terminated together at their outputends in a closely packed row wh ich replaces the conventionalB & C entrance slit.
For guiding and alignment purposes, each starplate mustalso contain bundle connector holes for two guidestars, which
25