
David Lifson of Skrumble presents Finding The Elsuvie Product Market Fit
Upload
truongkhanhCategory
view
214download
0
THE INCORPORATION OF ACETATE AND BUTYRA4TE CARBON INTO RAT LIVER GLYCOGEN BY PATHWAYS OTHER
THAN CARBON DIOXIDE FIXATIOs*
BY NATHSN LIFSON, VICTOR LORBER, WARWICK SAKAMI, AND HARLAND G. WOOD
(Prom the Department of Physiology, University of Minnesota, Minneapolis, and the Department of Biochemistry, School of Medicine, Western Reserve University,
Cleveland)
(Received for publication, July 23, 1948)
This investigation was undertaken to study, by use of acetic and butyric acids labeled with (33, the conversion in the intact animal of lower fatty acid carbon to liver glycogen in order to help explain the intermediate re- actions linking fat and carbohydrate metabolism in the intact animal. It appears certain that such conversion does occur for both of these acids (1).
Classically, a dietary constituent has been considered a glycogen former if, after its administration, a net increase in glycogen is found over and above that of t,he control. By this criterion, there is no general agreement whether acetate and butyrate are glycogen formers. However, the carbon of a fatty acid could enter liver glycogen without effecting a net increase in the glycogen. For example, carbon could enter because of the constant turnover between carbohydrate and its precursors. Furthermore, because of the influence of the dynamic equilibrium between fats, proteins, and carbohydrates there could actually be a decrease in glycogen after admin- istration of a fatty acid and still carbon of the fatty acid could enter the latter. Similarly, a net increase in glycogen could conceivably occur with- out transfer of carbon from the fatty acid to glycogen. The question of whether acetate and butyrate are liver glycogen formers in the classical sense is different from that being considered in the present work; namely, whether the carbon of these fatty acids is incorporated into liver glycogen.
The fatty acids in question are relatively rapidly metabolized to CO2 (l), and CO2 itself can be incorporated into liver glycogen (2). The biochemi- cal significance of the presence of fatty acid carbon in glycogen therefore depends to a considerable degree upon (a) whether all such carbon entered glycogen via CO2 fixation or (b) whether some entered by another route without first being converted to CO,.
It is possible to degrade the glucose units of liver glycogen to locate the
* This work was supported in part by grants from the Graduate School of the University of Minnesota and from the American Cancer Society on the recommenda- tion of the Committee on Growth of the National Research Council.
1263
by guest on July 17, 2018http://w
ww
.jbc.org/D
ownloaded from

1264 LIVER GLYCOGEN
position of the labeled carbon (2). In the case of CO2 fixation, the isotopic carbon has been detected only in positions 3 and 4 of the glucose (2): Should the heavy carbon in glycogen isolated after feeding isotopic fatty acid appear in positions other than 3 and 4, this would be rather convincing evidence that a pathway other than CO2 fixation was involved. In the experiments to be reported, the distribution of Cl3 has been determined in rat liver glycogen after the administration, respectively, of each of the fol- lowing acids : CH3CY300H, C13H3COOH, CY3HJY300H, CH&H&H2- C1300H, CH&HD3H2COOH, CH3C13H&H&OOH. Evidence has been obtained which indicates that these acids are converted to glycogen by another route in addition to COZ fixation, and some indications have been obtained as to the mechanisms of these conversions. Preliminary reports of this work have been published previously (3-5).
Methods
Preparation of Isotopic Fatty Acids-The carboxyl-labeled fatty acids were prepared by the Grignard reaction from the appropriate bromide and isotopic COZ. Purity of these acids was checked by determination of ti- tratable acidity, total carbon, and partition coefficients (6); all agreed with theoretical values except the partition coefficient of the CH3. CH2. CHZ- WOOH, which was 30.6 as compared with 31.1 for known butyric acid.
The CYH3COOH was synthesized by a modification of the method of Anker (7). The purity of this and the following compounds was estab- lished by the same procedures that were used with the carboxyl-labeled acids. Agreement with theory was satisfactory unless otherwise indicated.
The C13H3. C300H was synthesized by a procedure which was based upon the method of Cramer and Kistiakowsky (8). In the modification 50 mAI of BaC303 were used. The acetylene-hydrogen mixture as formed on hydrolysis of the barium carbide magnesium was collected over water in a 3 liter flask and was then passed through a sintered glass disk into 150 ml. of boiling catalyzing solution. The resulting aldehyde was col- lected in 50 ml. of 5 per cent sodium bisulfite. The outgoing gas was col- lected and again passed through the catalyzing solution. The aldehyde was distilled from the bisulfite, after addition of calcium carbonate, and was oxidized to acetic acid by the dichromate method of Stahly et al. (9).
Butyric acid labeled in the CY position with Cl3 was prepared by the fol-
1 In experiments carried out subsequently with CYO2, it has been found that actually a trace of isotope does appear in carbon atoms 1,2,5, and 6. The specific activity of these positions has been found to be 1 to 2 per cent of that of carbon atoms 3 and 4.
by guest on July 17, 2018http://w
ww
.jbc.org/D
ownloaded from

LIFSON, LORBER, SAKAMI, AND WOOD 1265
lowing series of reactions. Carboxyl-labeled sodium propionate was syn- thesized by the Grignard reaction and converted into the ethyl ester by heating with diethyl sulfate. The procedure was similar to the synthesis of carboxyl-labeled ethyl acetate (10). The ethyl propionate was then hydrogenated at 250” and 220 atmospheres by use of the copper-barium- chromium oxide catalyst (11, 12). The mixture of ethyl and propyl alco- hols was converted into a mixture of the corresponding iodides by heating with constant boiling hydriodic acid (13). The iodides were separated by fractionation. This separation was not complete and there was some non- labeled ethyl iodide in the propyl iodide fraction. The isotopic propyl iodide was converted into a-labeled butyric acid by the Grignard reaction. The over-all yield was 22 per cent of the theory. From 60 m&r of isotopic BaC03, as determined by the partition coefficient, 13.1 mM of a-labeled butyric acid were obtained, mixed with 5.3 mM of non-isotopic propionate.
Butyric acid labeled in the p position with CL3 was synthesized by the following procedure. Carboxyl-labeled acetic acid was esterified with n- butyl alcohol and hydrogenated at 250” and 220 atmospheres with the copper-barium-chromium oxide catalyst. The mixture of ethyl and butyl alcohols was converted into the corresponding mixture of iodides and frac- tionated. The isotopic ethyl iodide was converted into butyric acid by the malonic ester procedure (14). The butyric acid and some non-labeled acetic acid from the malonic ester were converted into the methyl esters by heating the potassium salts with dimethyl sulfate and purified by frac- tionation. The methyl butyrate was saponified, and the butyric acid iden- tified by determination of the partition coefficient. The over-all yield was 25 per cent. From 93.5 mM of sodium acetate 24.5 mM of p-labeled butyric acid mixed with 0.96 mM of non-isotopic acetic acid were obtained.
Before administration to the experimental animals, the solution of the sodium salt was made just acid to phenolphthalein by t.he addition of HCl.
General Experimental Procedure-The procedure of Buchanan et al. (1) has been adopted, in which glucose is fed to fasted rats, together with the isotopic fatty acid. Under such conditions a net deposition of isotope- containing glycogen occurs and there is relatively minor dilution of the newly formed glycogen by preformed non-isotopic glycogen.
Table I contains data concerning the animals used, the material admin- istered, the liver weight, and the quantity of liver glycogen recovered.
Rats, 120 to 240 gm. in weight, raised on a diet of Promax rat food,2 were fasted for approximately 24 hours. Immediately after their teeth were clipped, the rats were fed by stomach tube a solution containing 1.7 to 3.3
2 Analysis by manufacturer, in per cent, protein 29.5, fat 8.40, fiber 2.8, nitrogen- free extract 41.45, moisture 9.00, ash 8.85, calcium 1.20, phosphorus 1.13.
by guest on July 17, 2018http://w
ww
.jbc.org/D
ownloaded from

1266 LIVER GLYCOGEN
mM of fatty acid and 353 to 477 mg. of glucose per 100 gm. of body weight. The total volume administered was usually such as to make the glucose concentration 20 per cent.
TABLE I General Experimental Data
33 234 34 215 38 215
100 155 101 148 102 153 103 165
51 190 63 210 64 210 69 200 70 200 71 183 72 179 73 125 74 135 75 140 53 240 67 230 81 140 82 155 83 160 84 140 89 140 90 130 91 130 92 130
P kiki;t fast
e. hrs.
24 24 50 24 24 24 24 24 27 27 24 24 24 24 24 24 24 24 24 24 24 24 24 24 24 24 24
Sex 1
Fatty acid administered
CH&YOOH “ “
CPH&OOH I‘ “ “
CY3HJY300H “ “ “ “ “ “ “ “ “
CH&H&HdYOOH “
CH$H&‘3H&OOH “ ‘I I‘
CH$ZPH&H&OOH ‘I “ “
imouni rdmin- stered
n16 pe7 100 gm. body
weight
2.5 2.5 2.5 2.4 2.4 2.4 2.5 2.9 2.7 2.7 2.8 2.8 2.8 2.8 2.3 2.3 2.3 2.6 2.5 1.82’ 1.79’ 1.81’ 1.74: 2.5 2.5 2.5 2.5
Glu- co?&
.dmin- stered
ag. pa 00 gm body
weight
400 400 400 390 400 400 400 420 410 410 450 450 438 438 400 400 400 417 400 408 402 406 390 400 400 400 400
Live w&l
m.
8.4 7.6 5.8 5.5 5.8 5.8 5.5, 5.6 7.5 7.4 5.9 5.2 6.7 6.3 4.9 5.5 5.5 8.3 6.7 6.3 6.2 6.6 6.1 6.1 6.2 5.5 5.8
Liver :lyCO- :en (as gill-:
CW)
m?.
29
81
188
116
35 100 85
500
115 90
140
378
129 96 91
105
* The solution contained appreciable amounts of non-isotopic propionate.
The animals were placed in a metabolism chamber for collection of their respiratory COz in NaOH, as previously described (2), with the modifi- cation that in the experiments other than those with carboxyl-labeled acids both the alkali and air were stirred. There were three collection periods of 50 minutes each, between which the chamber was opened for changing
by guest on July 17, 2018http://w
ww
.jbc.org/D
ownloaded from

LIFSON, LORBER, SAKAMI, AND WOOD 1267
the alkali, a series of manipulations requiring less than a minute in nearly all cases. The CO2 content of a sample of the air of the chamber taken at the end of each of two collection periods was found to be 0.16 and 0.18 per cent, respectively. Since the total volume of the chamber was about 11 liters, it may be estimated that some 20 ml. of CO2 remained uncollected per period or less than 3 mM for an entire experiment. The COZ content of the alkali was measured by analyzing an aliquot in the manometric Van Slyke apparatus.
Usually 23 hours after feeding the fatty acid-glucose solution, the rats were anesthetized with sodium amytal (100 mg. per kilo, intraperitoneally). The liver was extirpated, immediately placed in hot 30 per cent KOH, and heated in a boiling water bath for 3 hours.
Glycogen was isolated by a modification of the method of Stetten and Boxer (15) in all experiments but those with the carboxyl-labeled acids, in which the procedure of Good, Kramer, and Somogyi (16) was used. As previously noted (2), when the procedure of Good et al. was used, the total carbon, as determined by a modification of the Van Slyke and Folch tech- nique (17), amounted to 117 to 134 per cent of the glucose estimated by reducing power. When the procedure of Stetten and Boxer was employed, the corresponding values were 94 to 112 per cent.
The glycogen was converted to glucose by hydrolysis in H$SOk. To re- move any volatile Cl3 fatty acid, the hydrolysis was begun in 0.25 N acid, which was concentrated in a boiling water bath to 1 N by evaporation to one-fourth the original volume. The original volume was restored with water and the concentration repeated three times, whereupon the hydrolysis was completed in the remaining 1 N acid. The hydrolysate was decolorized with charcoal and filtered. Glucose was determined by either the Shaffer- Hartmann method (18) or the method of Folin and Malmros (19).
Two types of degradation of glucose, bacterial and chemical, were carried out as previously described (2). In the bacterial degradation the glucose is fermented to lactic acid and then the lactic acid is oxidized with KMn04 to acetaldehyde and COZ. The acetaldehyde is in turn converted by the iodoform reaction to iodoform and formic acid. In this manner the carbons of the glucose are obtained in three fractions containing respectively car- bon atoms 3 and 4, 2 and 5, and 1 and 6.
CeH1206 --+ CHa-CHOH.COOH + CHz-CHO + CO* 1,6 2,5 3,4 1,6 2,5 3,4
CH,*CHO, + CHI, + HCOOH
1,6 2,5
In several instances the acetaldehyde was oxidized directly with persulfate (20) instead of being subjected to theiodoform reaction; thus carbon atoms
by guest on July 17, 2018http://w
ww
.jbc.org/D
ownloaded from

1268 LIVER GLYCOGEN
1, 2, 5, and 6 were obtained in one fraction. Ether extraction of the lactic acid was performed only in experiments on Rats 69 to 75 and Rats 100 to 103; in other instances the oxidation was carried out directly on the centrifuged solution from the bacterial fermentation.
In the chemical degradation, with limitations as described previously (2) and in this communication, carbon atoms 3 and 6 are obtained as in- dividual fractions and carbon atoms 1, 2, 4, and 5 as a third fraction.
Methyl glucoside + HCOOH + CH(OCH,).CHO CH0.CH.CH20H --j
I -0 !
4HCOOH + HCHO + CH,OH
1,2,4,5 6
Heavy carbon was determined with the mass spectrometer. The values are expressed as atom per cent excess C13, i.e. Cl3 in excess of normal (un- enriched) carbon, commercial reagent grade BaC03 being employed as a source of a CO2 standard in calibrating the mass spectrometer. The maxi- mum difference in Cl3 content between this standard and normal rat liver glycogen was found to be 0.005 atom per cent. Whereas this result might indicate 0.005 to be the expected experimental variation, it has been our procedure not to place significance on values less than 0.02 atom per cent in excess of normal. Thus a margin is provided for possible incomplete separation of the isotopic and non-isotopic compounds.
In a control experiment non-isotopic acetate was administered to the animal, but at the time the liver was placed in KOH, carboxyl-labeled ace- tate was also added to the alkali. Significant amounts of excess Cl3 were not found in the glycogen (see Table II, results for Rat 35).
RESULTS AND DISCUSSION
The discussion will take the following order. First the data on the rela- tive distribution of the isotope in the glucose unit of the glycogen will be considered for each of the different types of labeled acids. Next evidence will be presented which shows that these acids are converted to glycogen by a pathway in addition to that of COz fixation. Finally the intermediary mechanism of metabolism of acetate and butyrate will be considered in relation to the tricarboxylic acid cycle and glycogen synthesis.
Distribution of Isotope in Glucose from Liver Glycogen
The distribution of CL3 in the liver glycogen following the administration of labeled fatty acids is shown in Table II; the values are from both the bacterial and chemical degradations. Although there are some discrep- ancies between results by the two methods, which will be considered later,
by guest on July 17, 2018http://w
ww
.jbc.org/D
ownloaded from

TABL
E II
Dist
ribut
ion
of 0
3 in
Liv
er
Glyc
ogen
af
ter
Adm
inist
ratio
n of
Lab
eled
Fatty
Ac
ids
Cl3
value
s ar
e ex
pres
sed
in
term
s of
at
om
per
cent
ex
cess
.
Fatty
ad
d ad
mini
stere
d
CHU2
00H
CHAF
OOH
U3H,
COOH
U3
H&‘30
0H ‘I ‘I
CHzC
HzCH
zCPO
OH
‘I
CH$H
kPH&
OOH “
CH&Y
3H&H
&OOH
“
C”
whole
fa
tt d ac
1 III
&-
C&
0.00
2.
63
1.98
4.
30
4.30
4.
60
0.98
0.
98
0.97
0.
97
1.09
1.
09
Rat
No.
35
33,
34
100-
103
51
63,
64
69-7
5 53
67
81
82
-84
90
89,
91,
92
- Cl
: in
bac
teria
l 0”
in
che
mica
l de
grad
ation
fra
ctio
ns
degr
adat
ion
fract
ions
Carb
on
atom
s of
glu
cose
3,4
0.01
; 0.
10
0.08
0.
24
0.36
0.
13
0.18
0.
04
0.05
0.
12
0.16
2,s
1 19
6 -
0.01
0.
01
0.18
0.
16t
0.19
0.
14$
0.29
0.
288
0.01
0.
01
0.02
0.
01
0.17
0.
1411
0.
16
0.14
7 0.
02
0.01
0.
02
0.02
&bon
at
oms
of g
luco
se !
I
Mg.
of
CO2
in
sam
ple
(t)
28.5
, ($
) 8.
2,
(8)
19.8
, (II
) 15
.0,
(8)
14.9
.
3 1,
2,4,
5 6
0.10
0.
17
0.19
0.
14
0.29
0.
25
0.23
0.
26
0.32
0.
28
0.24
0.
29
0.05
0.11
0.14
0.05
0.17
0.01
0.14
0.06
-
- - -
Loca
tion
of is
otop
e in
glyc
ogen
c-c-
c-c-
c-c
c-c-
c*-c
*-c-
c c*
-~*-~
o-~o
--~*-~
*
.c*-~
*-c*-~
*-c*-~
*
&-c-
c*--c
*-c-
c
~*-c
*-~o~
(y-~
*-~*
c-c-
c*-c
*-c-
c
by guest on July 17, 2018http://w
ww
.jbc.org/D
ownloaded from

1270 LIVER GLYCOGEN
the over-all results can be summarized from the data as given. It is seen that with both carboxyl-labeled acetic and butyric acids glucose was ob- tained in which the isotope was predominantly in the 3 and 4 positions. There was little or no excess in the 2,5 and 1,6 positions. This fact has been indicated in the last column of Table II by means of a 6-carbon skele- ton (C-C-C*-C*-C-C) in which the asterisk locat,es the preponder- ance of isotope. A similar glucose is obtained with the p-labeled butyrate. On the other hand, with methyl-labeled and doubly labeled acetate and with a-labeled butyrate, a significant concentration of isotope was found in all degradation fractions and the indications are that each position of the glucose contained isotope. In the case of the methyl-labeled acetate and a-labeled butyrate the 3 and 4 positions contained a smaller but significant excess of isotope than the other positions, and this type of glucose has been indicated as follows : C*-C*-Co-Co-C*-C*. With the doubly labeled acetate all positions were high, but the 3 and 4 positions were the highest.
Before further consideration is given to the significance of these data, the reliability of the degradation procedures will be discussed. It will be noted in Table II that whenever there was an excess of isotope in the 2,5 and 1,6 positions as obtained by the bacterial degradation the concentrations were usually of the same order of magnitude in the two fractions, but frequently the 1 and 6 positions contained somewhat less excess Cl3 than did the 2 and 5 positions. It was of considerable importance to establish whether or not these small differences were true differences, for, as will be shown in the later discussion, an unequal concentration would not be compatible with the currently accepted schemes of carbohydrate metabolism.
It has been found that the observed values are not true ones and that an error is caused by traces of extraneous carbon which are oxidized to COZ by the chromic acid oxidation used to convert the iodoform carbon to COZ. Dilution from this source may be appreciable when samples of the size usually dealt with in the present work are involved (0.5 mM of CO2 and less). In the case of the 2,5 position when mercuric acetate is used to convert the formic acid to COZ, no comparable dilution occurs.
Some of the evidence on this point follows: When CO2 was liberated from BaC303 by the chromic acid oxidant, it regularly displayed a lower Cl3 concentration than the original BaC1303, unless enough BaC303 was used to obviate t’he effects of dilution by the extraneous carbon which was oxi- dized to COZ. The same type of dilution was observed when the chromic acid oxidation was applied to a labeled organic compound (C13H&Hz- COOH). The resulting COZ contained a progressively greater Cl3 concen- tration as the sample size was increased (from 5 to 40 mg. of COZ). When lactic acid, which was synthesized chemically (8) from isotopic acetylene, and thus contained an equal concentration of Cl3 in the CL- and p-carbons,
by guest on July 17, 2018http://w
ww
.jbc.org/D
ownloaded from

LIFSON, LORBER, SAKAMI, AND WOOD 1271
was degraded in the usual way, a discrepancy was noted between the la- beled positions similar to that found with the lactate from liver glycogen. With a large enough sample the Cl3 content of the COZ derived from the (Y- and ,&carbons of the synthetic lactate was found to be the same. These results are summarized in Table III. In addition when two aliquots of the lactate from the liver glycogen of Rats 69 to 75 were degraded, the smaller samples showed a discrepancy between the (33 content of the cr- and fl- carbons, whereas the larger samples contained practically identical isotope concentrations (Table III). It is thus clear that with small samples false and variably low values were obtained for the 1 and 6 positions.
The results indicate with reasonable certainty that there is no difference between the 2,5 and 1,6 positions, and that any difference shown in Table
TABLE III
Effect of Sample Size on Apparent Zsotope Content of w and p-Carbon Atoms of Labeled Lactate
/ rr-Carbon 1 @-Carbon Material degraded
co3 C’S co2 1 C’3
atom pa, cent mg. , ,,“zzt &?XS%S ezcess
3.32 10.6 2.62 3.37 18.1 2.96 1.14 31.5 1.16 0.28 12.5 j 0.22 0.29 19.8 / 0.28
Synthetic Cl3H&l3HOHCOOH.. 10.6 “ (‘ . . . . . 21.1 “ “ * 24.9
Aliquot of lactate from Rats 69-75. 8.3 “ “ “ “ “ 69-75..................... 18.2
* Run on a sample of lactate containing less isotope than that used for the first two degradations.
II may be the result of the small samples employed. The present results are therefore considered to be in agreement with the idea that the 2,5 and 1,6 positions contained equal concentrations of isotope.
It should be pointed out that the degradation cleanly separates the differ- ent positions of the lactic acid. Thus in the degradation of synthetic CY3H3CY3HOHCOOH, the COZ isolated from the carboxyl group contained no excess Cl3 and the OL- and P-carbon fractions contained equal Cl3 con- centrations. On the other hand when a sample of synthetic CHD3HOH- COOH was degraded, it yielded excess isotope only in the single fraction corresponding to the a-carbon atom.
The results from the chemical degradation will be considered next. The data from this degradation in conjunction with the data from the bacterial degradation provide an opportunity to determine in greater detail the dis- tribution of the isotope in the sugar.
by guest on July 17, 2018http://w
ww
.jbc.org/D
ownloaded from

1272 LIVER GLYCOGEN
Sufficient material was available in four of the glucose samples for both a bacterial and a chemical degradation. In the chemical degradation, probably the most reliable result is for position 6, since the formation of formaldehyde in the periodic acid oxidation is quite specific for primary alcohols. It will be noted in Table II that position 6 as determined by chemical degradation contained approximately the same concentration of isotope as did the 1,6 and 2,5 fractions obtained from bacterial degrada- tion. The only exception is the result from the doubly labeled acetate, Rats 69 to 75, in which the concentration of isotope in position 6 was 0.24 as compared to that of 0.29 and 0.28 for the 2,5 and 1,6 positions. Possi- bly this result may be in error. A discrepancy in the results is indicated, because the average concentration of all fractions by bacterial degradation was higher than those from chemical degradation.
On the whole, however, it is seen that the results are in agreement with the idea that carbon atoms 1, 2, 5, and 6 contain an equal concentration of isotope. This follows from the observation that in general carbon atom 6=1,6;thereforecarbonatom1=6;alsolor6or1,6= 2,5. Itisto be noted that, although the results offer direct data indicating equality of positions 1 and 6, they do not give direct evidence that position 2 equals position 5. It seems likely, however, that this is the case from a consider- ation of the schemes of glycolysis.
An evaluation of the relative concentration of Cl3 in positions 3 and 4 may be obtained from the value for position 3 as determined chemically and that of the value for combined positions 3 and 4 from bacterial degrada- tion. Only a rough approximation is possible, however, because position 3 in the chemical degradation is not completely specific. Position 3 as ob- tained in this method consists of formic acid and it is contaminated by formic acid arising from other positions. In part this contamination comes from unmethylated glucose, since the samples of glucoside contained at least 1 to 2 per cent free glucose. In addition some free glucose may be formed by hydrolysis of the glucoside during the oxidation. In the periodic acid oxidation of free glucose formic acid is formed from 5 of the 6 carbon atoms. The fact that contamination does occur is indicated by results ob- tained on glucoside prepared from pure glucose in which more than a mole for mole yield of formic acid was found (2). Contamination of position 3 becomes apparent when the 1,6 and 2,5 positions have a low or high concen- tration of isotope as compared to the 3 and 4 positions. Thus when 1, 2, 5, and 6 carbon atoms contained more isotope than carbons 3 and 4, the con- tamination gave a high value for carbon atom 3 as compared to carbons 3 and 4; on the other hand when carbon atoms 1, 2, 5, and 6 contained a low concentration of isotope, the opposite effect occurred. These results were noted in most cases (see Table II).
When consideration is taken of these sources of contamination of posi-
by guest on July 17, 2018http://w
ww
.jbc.org/D
ownloaded from

LIFSON, LORBER, SAKAMI, AND WOOD 1273
tion 3, comparison of position 3 from chemical degradation with positions 3 and 4 from bacterial degradation indicates that position 3 is approxi- mately equal to positions 3 and 4. Thus carbon atoms 3 and 4 probably contain an equal concentration of C3. All the results of Table II, there- fore, are in conformity with the idea that the two halves of glucose are identical. This is the distribution of isotope which is to be expected on the basis of the conventional schemes of glycolysis in which glucose is formed on an over-all basis by union of 2 pyruvate molecules through a carboxyl to carboxyl linkage (2). This prediction assumes that the triose isomerase acts sufficiently rapidly to equilibrate the isotope in the glyceraldehyde phosphate and dihydroxyacetone phosphate. It is apparent, however, that the methods do not permit t’he strictly quantitative measurement which would be necessary to prove this point rigidly.
Evidence for Conversion of Fatty Acid Carbon to Glycogen by Pathway Other Than CO2 Fixation
It is apparent from Table II that after the feeding of carboxyl-labeled acetate or butyrate, as well as of p-labeled butyrate, all, or practically all, of the detectable excess Cl3 was found in positions 3 and 4 of the glucose. Since these are the same positions as for COz fixation, the results with these compounds provide no direct evidence that there is a mechanism other than COz fixation by which the carbon of acetic or butyric acid is incorpo- rated into liver glycogen. However, after the feeding of a-labeled acetate, doubly labeled acetate, or of a-labeled butyrate, not only carbon atoms 3 and 4, but all degradation fractions contained significant amour& of C3. These latter results furnish direct evidence that at least the a-carbon atoms of the fatty acids studied are incorporated into liver glycogen by some means in addition to CO, fixation. The possiblity that the presence of fatty acid has provided a route over which carbon may be incorporated as CO2 into positions other than 3 and 4 of the glucose is excluded by the results ob- tained when the carboxyl-labeled acids were fed.
The level of isotope in the respiratory COz has been used in attempting to evaluate the extent to which isotope from administered fatty acids reaches liver glycogen by COz fixation. Buchanan et al. (I) fed rats ace- tate, propionate, and butyrate labeled with C” in the carboxyl position. On the basis of the radioactivity found in the liver glycogen and respiratory COz in these experiments as compared with the radioactivity found in liver glycogen and respiratory COz in COz fixation experiments, they attempted to apply a correction to the fatty acid experiments for the isotope deposited in the liver glycogen from COz. An observed isotope content in the glyco- gen over and above that calculated as derived from CO2 was taken to indi- cate conversion of fatty acid to glycogen by a second mechanism. These workers concluded that in the case of acetate CO2 fixation alone could ac-
by guest on July 17, 2018http://w
ww
.jbc.org/D
ownloaded from

1274 LIVER GLYCOGEN
count for all of the Cl1 of the glycogen, whereas for propionate and bu- tyrate CO2 fixation could account for only a fraction of the isotope found.
In the present work, in the case of acetate as well as of butyrate, for all types of labeling employed, the isotope was more abundant in carbon atoms 3 and 4 of the glucose than would be anticipated from the level of Cl3 in the respiratory CO2 were CO2 fixation the only mechanism at work. For example, the excess Cl3 in carbon atoms 3 and 4 of the glucose isolated from the liver of rats administered NaHC303 was only about one-sixth to one- seventh that found in the respiratory COz (2), while in the experiments with carboxyl-labeled acetate, the isotope in positions 3 and 4 was rela- tively twice as abundant as in the CO2 fixation experiments, being about one-t’hird the excess noted in the respiratory COZ.
Certain objections to comparisons of this sort may be pointed out. Ex- periments on CO2 fixation in which labeled bicarbonate has been given may not be regarded as suitable controls for experiments in which fatty acids have been fed, since the influence of fatty acid feeding on CO2 fixation has not been assessed. Furthermore, the isotope content of the respiratory CO2 may not bear the same relationship to the isotope content of the intra- cellular COz in both instances, since the isotopic COz has been introduced into the animal as bicarbonate in one case and has arisen from the intra- cellular oxidation of an organic acid in the other. The experiments of Ball et al. (21), in which NaHC”03 was administered and the specific activity of the NaHC03 of pancreatic juice and of the respiratory CO2 was found to be the same, cannot be considered as establishing the respiratory COZ as a valid sample of the intracellular COz of all tissue cells with respect to isotope content, since the cells of external secretion of the pancreas are probably unique in their ability to concentrate bicarbonate. Hence it is apparent that experiments with the carboxyl-labeled acids provide only in- direct evidence regarding the transfer of the fatty acid carbon to glycogen by ways other than COz fixation, and, in view of the possible source of error described above, it is not surprising that the evidence of Buchanan et al. (1) and of the present work is in conflict with respect to acetate.
The present results with a-labeled and doubly labeled acetate, in which the isotope occurs in positions other than 3 and 4 of liver glucose, show conclusively, however, that this acid is converted to carbohydrate by path- ways other than CO2 fixation.
Intermediary Metabolic Steps in Conversion of Fatty Acid to Glycogen
Although in the present work we are observing only the initial and final stages whereby fatty acid carbon is transformed to glycogen, some discus- sion seems desirable concerning intermediate steps.
by guest on July 17, 2018http://w
ww
.jbc.org/D
ownloaded from

Abrid
ged
Trica
rbox
ylic
Acid
Cy
cle
and
Its
Rela
tions
hip
to
Glyc
ogen
Syn
thes
is
CH
a.C
Hz.
CH
a.C
OO
H
Buty
rate
11
-co2
C
H2.
CO
OH
CH
3. c
ox
< I
(d)
l--
(b)
COO
H.
CH
:C.
COO
H e
COO
H.CH
~.CO
.CO
OH
\--
CO
* +
CH
I.CO
.CO
OH
H
OO
C.C
O.C
Hs
___-
--.A
Acon
itate
O
xala
ceta
te
Oxa
losu
ccin
ate 11
(f)
C
H,.
COO
H (8
) CO
OH~
CH~.
CIII~
COO
H +
CO2
I Su
ccin
ate
CO
OH
.CO
.CH
a +
CO
,
‘1 (a)
1 c-
c-c-
c-c-
c
L-
-O-
J
Glu
cose
Glyc
ogen
a-Ke
togl
utar
ate
by guest on July 17, 2018http://w
ww
.jbc.org/D
ownloaded from

1276 LIVER GLYCOGEN
Because of the impressive evidence accumulating in favor of the tricar- boxylic acid, or Krebs cycle, as a general mechanism for the oxidation of carbohydrat,es, fats, and proteins, the present results will be considered in terms of this cycle. The cycle, abridged for purposes of simplicity, is pre- sented schematically in the accompanying diagram. The assumptions are made that the constituent hexose units of glycogen are formed from two 3-carbon fragments (represented by pyruvate) in accordance with the conventional schemes of glycolysis, and that the tricarboxylic acid cycle participates in the introduction of isotope into the S-carbon fragment, pyruvate.
It must be emphasized that the following discussion of metabolic path- ways for acetic and butyric acids is speculative. The possibility exists that the results of the present experiments, as well as of those on COZ fix- ation (2), may be explained by unknown metabolic conversions, or by modi- fications of reactions in the tricarboxylic acid cycle, or by reactions on the path between pyruvate and glucose.
In the diagram it is to be noted that the carboxyl carbon of pyruvate becomes the 3 and 4 carbons of the glucose, the a-carbon becomes the 2 and 5 carbons, and the p-carbon becomes the 1 and 6 carbons (Reaction a). Furthermore, since pyruvate is formed from the oxalacetate (Reaction b) by loss of the carboxyl adjacent to the methylene group (p-carboxyl group), the location of 03 in the oxalacetate determines the location of the isotope in the pyruvate.
The oxalacetate formed from pyruvate and isotopic carbon dioxide would contain labeled carbon in the P-carboxyl group only. In order to explain the location of fixed carbon dioxide in positions 3 and 4 of glycogen, it is assumed that the oxalacetate is converted to a symmetrical Cd-dicarboxylic acid, represented by succinic acid in the scheme (Reaction c). In this way the labeled carbon becomes randomized between both carboxyl groups. Reversal of Reactions c and b would then yield carboxyl-labeled pyruvate and hence glycogen labeled in positions 3 and 4.
Pathways from Acetate to Glycogen-From carboxyl-labeled acetate the isotope is transferred via the cycle to both carboxyl groups of the oxal- acetate (Reactions d, e, f, g, c) and decarboxylation of the oxalacetate results in carboxyl-labeled pyruvate (Reaction b). Moreover, reentry of this labeled oxalacetate into the cycle cannot introduce the Cl3 into any other position in the oxalacetate, because both carboxyl groups of the oxal- acetate are lost as COZ in the transformations of the cycle. This condition also applies in the case of CO2 fixation. The scheme is thus in agreement with the observed results of Table II in that it indicates that either fixed carbon dioxide or the carboxyl of acetate will be only in the 3 and 4 posi- tions of the glucose.
The results following the feeding of a-labeled acetate are also explained.
by guest on July 17, 2018http://w
ww
.jbc.org/D
ownloaded from

LIFSON, LORBER, SAKAMI, AND WOOD 1277
Condensation of C3H&OOH with oxalacetate would lead through the cycle to the formation of oxalacetate, the non-carboxyl carbons of which are la- beled. Decarboxylation of such oxalacetate yields Q! J-labeled pyruvate and, hence, glycogen labeled equally in carbon atoms 1, 2, 5, and 6. These carbon atoms of the glycogen were found to contain excess isotope, but it will be observed in Table II that carbon atoms 3 and 4 also contained an excess of CF, up to nearly one-half that in the other positions. Part of this labeled carbon undoubtedly was introduced by reentry into the cycle of isotopic oxalacetate generated in the cycle. Assuming recirculation in the cycle of such oxalacetate, one finds upon study of the cycle that at the end of the second circulation the Cl3 concentration in the carboxyl groups of this compound is one-third that of the non-carboxyl carbons, and that with further recirculation of the oxalacetate the ratio of the isotope con- centration in the carboxyl carbons to that in the non-carboxyl carbons ap- proaches one-half. The methyl carbon of acetate can thus contribute sig- nificantly to the 3 and 4 positions of the glycogen, without conversion to CO%
The condensation of doubly labeled acetate with oxalacetate would lead through the cycle to the formation of oxalacetate, all carbon atoms of which are labeled; decarboxylation of such oxalacetate yields pyruvate and hence glycogen likewise with all its carbons labeled. Again the experimental results are in agreement with this expectation. If the route described is the only one by which acetate carbon is being converted to glycogen, the isotope concentrations should be equal in each carbon atom of the glucose chain. The deviation of experimental observations from this anticipation, i.e. a greater abundance of isotope in carbon atoms 3 and 4 than in the other fractions of the glycogen, is reasonably explained by the introduction of extra 03 into these positions by CO2 fixation. The fact that the ob- served Cl3 content of the respiratory CO2 (Table IV) was high in the ex- periments with the doubly labeled acetate is consistent with the idea that the extra Cl3 came from COZ. The high Cl3 content in the respiratory CO2 resulted because both carbons of the acid were labeled and therefore the average excess Cl3 content was higher in this case than for the other acids administered.
In addition to comparing the agreement between the predictions of the scheme and the observed data relative to the distribution of the isotope in the carbon chain of the glucose unit, there is also opportunity for a similar comparison on the basis of recovery of the isotope in the respira- tory CO*.
The data on the respiratory COz are shown in Table IV. The total respiratory COz (column (a)) represents the sum of values for the three collection periods during which approximately equal quantities of CO2 were obtained in each period. The total CL3 shown in column (b) was obtained
by guest on July 17, 2018http://w
ww
.jbc.org/D
ownloaded from
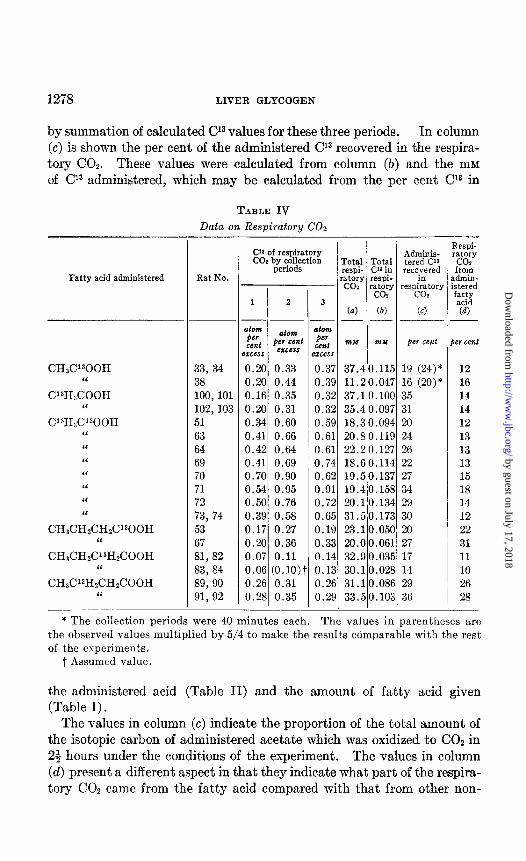
1278 LIVER GLYCOGEN
by summation of calculated Cl3 values for these three periods. In column (c) is shown the per cent of the administered Cl3 recovered in the respira- tory COz. These values were calculated from column (b) and the mM of Cl3 administered, which may be calculated from the per cent Cl3 in
TABLE IV
Data on Respiratory CO2
Fatty acid administered
CH&Y300H “
WH&OOH ‘I
C13HP00H “ “ “ “ “ “ “
CH$ZH&H#‘300H I‘
CH&H&‘3H&OOH “
CH$PH&H&OOH I‘
Rat No.
33, 34 38 100,101 102, 103 51 63 64 69 70 71 72 73, 74 53 67 81, 82 83, 84 89,90 91,92
_
e
C’S of respiratory CO1 by collection
- periods
1 2 3
atom @I
atom atom per cent w
cent ‘2CCS erce** cent
:.zcess
0.20 0.33 0.3i 0.20 0.44 0.3< 0.16 0.35 0.3: 0.20 0.31 0.3: 0.34 0.60 0.5s 0.41 0.66 0.61 0.42 0.64 0.61 0.41 0.69 0.74 0.70 0.90 0.6: 0.54 0.95 0.91 0.50 0.76 0.7: 0.39 0.58 0.6: 0.17 0.27 O.lE 0.20 0.36 0.3: 0.07 0.11 0.14 0.06 (0.10)’ 0.1: 0.26 0.31 0.2i 0.28 0.35 0.2<
Total Total respi- C’a in :atory respi-
co= %Y4 2
(0) (b) __-
mat m2.f
37.40.111 11.20.04; 37.1 O.lO( 35.4 0.09; 18.3 0.094 20.8 O.ll< 22.20.12; 18.6 0.114 19.50.13; 19.40.152 20.10.13i 31.50.17: 23.10.05( 20.00.061 32.9 0.03: 30.10.02t 31.10.08( 33.50.10:
-
5
7 1 7 4 ) 7
4
7 3 4 s 1 1 5 3 5 3 -
Adminis- tered C’s
recoivnered respiratory
co2
(cl
- 1 I
a i
Respi- ratory co2 from
dmin- stered fyJ
(a)
)W cent P w cent
19 (24)* 12 16 (20)* 16 35 14 31 14 20 12 24 13 26 13 22 13 27 15 34 18 29 14 30 12 20 22 27 31 17 11 14 10 29 26 36 28
* The collection periods were 40 minutes each. The values in parentheses are the observed values multiplied by 5/4 to make the results comparable with the rest of the experiments.
t Assumed value.
the administered acid (Table II) and the amount of fatty acid given (Table I).
The values in column (c) indicate the proportion of the total amount of the isotopic carbon of administered acetate which was oxidized to CO2 in 24 hours under the conditions of the experiment. The values in column (d) present a different aspect in that they indicate what part of the respira- tory COZ came from the fatty acid compared with that from other non-
by guest on July 17, 2018http://w
ww
.jbc.org/D
ownloaded from

LIFSON, LORBER, SAKAMI, AND WOOD 1279
labeled materials in the metabolic pool of the animal. The figures in col- umn (d) indicate simply the dilution of the administered isotope by non- isotopic carbon and were obtained by the following calculation.
Atom y0 excess Cl3 in respiratory COZ Atom y0 excess CY in fed fatty acid
x loo
The values for the denominator are given in Table II, while those for the numerator may be calculated from Table IV, columns (a) and (b).
It should be emphasized that this calculation (column (d)) assumes (ex- cept for the doubly labeled acid, for which no such assumption is neces- sary since both carbon atoms contain an equal isotope concentration) that all carbons of the fatty acid chain in question are converted to COZ at equal rates.
As nearly as can be judged from the limited data available in Table IV, all types of labeled acetate are oxidized at about the same rate. The aver- age for acetate is 27 per cent; i.e., 27 per cent of the isotope was recovered in the respiratory CO2 in 23 hours. Likewise that part of the respiratory COz that came from the fatty acid was for all types of acetate the same, the average being 14 per cent of the total COZ.
It is apparent that if the carboxyl carbon of acetate were actually con- verted to CO2 more rapidly than the methyl carbon these values would have been higher for the carboxyl-labeled acid than for the methyl-labeled acid, and the values for the doubly labeled acetate would have been inter- mediate. The fact that all types of labeled acetate give the same results in the respiratory CO2 is in agreement with the predictions of the cycle. Study of the schematic diagram will reveal that, at the end of the second circulation of oxalacetate through the cycle, one-half as much of the car- boxy1 carbon of the oxalacetate has been derived from the methyl carbon of the acetate as from the carboxyl carbon of the acetate. By further re- peated circulation the total contribution of the carboxyl and methyl car- bons of acetate to the carboxyl carbons of oxalacetate approaches equality. Since it is the carboxyl carbons of oxalacetate which yield CO2 on passage through the cycle, the rate of conversion of the methyl carbon of acetate to COZ should approach that at which the carboxyl carbon is so converted.
From the foregoing it is concluded that both carbons of acetate are con- verted to COZ at approximately equal rates. This finding, as well as the results of the distribution of the isotope in the glucose, thus seems to be consistent with the suggestion that acetate may be oxidized by the tricar- boxylic acid cycle.
It is noteworthy that the conversion of acetate to glycogen via the cycle cannot account for a net increase in glycogen from acetate carbon per se, since 2 moles of COZ are produced for each mole of acetate that enters the
by guest on July 17, 2018http://w
ww
.jbc.org/D
ownloaded from

12so LIVER GLYCOGEN
cycle. This is in agreement with the fact that glycogen is not deposited in the liver of the fasted rat following the feeding of acetate alone. As pre- viously noted, however, the net change in glycogen in an animal may be as much dependent on the effect of the fed compound on the balance of the dynamic equilibrium of the body as it is on whether or not there is a mech- anism for net transfer of carbons from the compound to the glycogen. The formation of glycogen in the traditional sense (i.e., net glycogen deposition) contrasted with an actual transfer of carbon from a compound to glycogen as measured with isotopes may have no relation. When viewed in terms of actual movement of carbon to glycogen, it is apparent that short chain fatty acids and, in all probability, long chain fatty acids as well can be converted to carbohydrate. Bloch and Rittenberg (22) have shown that a long chain fatty acid (myristic acid) can give rise to acetyl groups in the intact organism. Furthermore it has been reported that acetate enters aspartic acid and glutamic acid, which are considered to be in biological equilibrium with carbohydrates by routes other than CO2 fixation (23). These considerations together with present results with acetate indicate that glycogen carbon can be derived from long chain fatty acids.
It should be pointed out that the conversion of acetate to succinate by methyl to methyl condensation and a subsequent conversion of the suc- cinate to pyruvate and then to glycogen would meet all the requirements of the present experimental data. Therefore on this basis there is no reason to exclude this mechanism. On the other hand the conversion of acetate to glycogen by a mechanism involving the formation of pyruvate by ad- dition of a l-carbon compound to the carboxyl of acetate (or a derivative) can be excluded. If this occurred, it would be expected that carboxyl-la- beled acetate and probably carboxyl- and p-labeled butyrate would give rise to a a-labeled pyruvate. This type of pyruvate apparently was not the means of entrance of the acetate, for if it were, one would expect labeling to appear mainly in the 2,5 positions of the glucose. Actually this did not happen to a significant extent. On the other hand the results do not necessarily exclude the addition of a l-carbon compound to the methyl carbon of acetate.
It is thus seen that, although the results are in agreement with the tri- carboxylic acid cycle as a mechanism of conversion, this is by no means the only mechanism which would explain the results.
Pathways from Butyrate to Glycogen-There is a large body of experi- mental facts which indicates that fatty acids may be oxidized by /3 oxi- dation to acetate or derivatives of acetate (22, 24). If this occurs, it is reasonable to suppose that the resulting acetate would be converted to glycogen. With different types of labeled butyrate it should be possible by comparison with results obtained with the different kinds of labeled
by guest on July 17, 2018http://w
ww
.jbc.org/D
ownloaded from

LIFSON, LORBER, SAKAMI, AND WOOD 1281
acetate to determine whether or not the p oxidation scheme suitably ex- plains butyrate metabolism in intact animals. Thus carboxyl-labeled bu- tyrate or ,&labeled butyrate should be equivalent to carboxyl-labeled ace- tate and lead to the deposition of glycogen with isotope limited to the 3 and 4 carbon atoms of the glucose unit.
CHz.CH2.CHe.C1300H + CHz.CO.CH2.0300H + CH&OOH + CH&POOH CH~.WH*.CHs.COOH --+ CH~.WO.CH~.COOH -+ CH&‘300H + CHICOOH
a-Labeled butyrate should be equivalent to methyl-labeled acetate and lead to the deposition of glycogen with isotope preponderantly in carbon atoms 1, 2, 5, and 6.
CH~.CH~~CPH~.COOH + CH~.CO.C=H~.COOH -+ CH&OOH + CFHdZOOH
The results shown in Table II are in complete agreement with these pro- posals and offer support to the idea that butyrate undergoes /3 oxidation and that the resulting 2-carbon compound may be converted to glycogen via the tricarboxylic acid cycle through reactions similar to those previously described for acetate. It is realized, of course, that what are observed in these tests are the end-results and that no real information is given on intermediate steps. There may be other mechanisms which would fulfil the requirements of the data, but at present the /3 oxidation theory appears adequate.
The present results apparently rule out, at least for the conditions of these experiments, the formation of glycogen by w oxidation of butyrate to succinate as suggested by Blixenkrone-Moller (25). Whereas the results with carboxyl- and a-labeled butyrate could be explained by this mech- anism, it cannot explain the results with the P-labeled butyrate. By w oxidation to succinate, isotope from p-labeled butyrate would be located predominantly in positions 1, 2, 5, and 6 of the glycogen, as illustrated by the following equations.
CH~.C’3Hz-CH~-COOH -+ COOH.WHz.CHz.COOH -+
COOH.C’3Hz.C0.COOH CYHa-CO-COOH Or --+ or --j (y3.c13.c.c.c13,(y3
COOH.U30.CH~.COOH CHa. CYO. COOH Glucose
Actually, as already noted, a significant excess of Cl3 could be detected only in positions 3 and 4. It should be noted that this distribution proba- bly would not result by w oxidation even if the resulting dicarboxylic acid were not symmetrical. From anunsymmetrical Cd-dicarboxylic acid either of the two types of pyruvate as illustrated above would be expecbed and neither would give a glucose unit labelled in positions 3 and 4. Further- more the oxidation of butyrate to succinate, followed by cleavage in the
by guest on July 17, 2018http://w
ww
.jbc.org/D
ownloaded from
1282 LIVER GLYCOGEN
center, to 2 molecules of acetate is not likely, because this mechanism would be expected to give a glucose from P-labeled butyrate like that obtained from methyl-labeled acetate, whereas it did not.
Metabolism of butyrate via acetate would not directly provide for a net increase in carbohydrate precursors, but such an increase if it does occur (as indicated, for example, by the work of Blixenkrone-Miiller, wherein glucogenesis was reported in perfused livers following the administration of butyrate) could be an indirect effect of the fatty acid. The presence of butyrate may exert a sparing effect and cause the accumulation of glycogen from available carbohydrate or carbohydrate precursors derived from protein.
If butyrate is metabolized via acetate, one might expect, from the results on the three types of labeled acetate, that all carbon atoms of butyrate would be converted to COZ at approximately equal rates. From the data on respiratory CO2 (Table IV) it would appear that the carboxyl and @- carbons of butyrate are burned much more rapidly than is the a-carbon. Unfortunately, the experiments with the a-labeled butyrate are not en- tirely comparable to those in which the carboxyl- and p-labeled acids were fed, since considerably smaller amounts of the a-labeled butyrate were ad- ministered and also this fatty acid was contaminated with appreciable amounts of non-isotopic propionate (see Table I). Both these factors would lower the relative amount of labeled carbon in relation to the total metabolic pool and thus the Cl3 in the respiratory CO2 would be less con- centrated. As a consequence of this, as judged by column (d), Table IV, which gives the dilution in the respiratory CO2 of administered isotope by non-isotopic metabolic COz, the oxidation of the a-carbon would be indi- cated to be relatively lower than for the other positions. Actually, how- ever, a proportionally greater oxidation of non-isotopic material may have been the real cause of this difference. The values for the per cent of the administered isotope recovered in the CO2 (column (c)) also indicate a slower oxidation of the rY-carbon, but no definite conclusion seems justified on the basis of the two results, for it is seen in column (c) that there is a great deal of variation in the results from one experiment to another. This variation may in part be caused by variation in absorption. Thus at present there is no reliable indication that the rate of oxidation differs for the individual positions of the butyrate molecule and this question must be left open.
Considered as a whole, these studies with acetate and butyrate which have been performed on intact normal animals have yielded results which agree remarkably well with predictions from schemes which have been de- rived for the most part from studies in vitro. The results give some evi- dence that the tricarboxylic acid cycle is an active mechanism in the normal
by guest on July 17, 2018http://w
ww
.jbc.org/D
ownloaded from

LIFSON, LORBER, SAKAMI, AND WOOD 1283
animal; also the evidence lends support to the conventional schemes of glycolysis. It should be borne in mind that, although these studies were made on whole, fasted animals, they probably represent in a large part the metabolism of the liver. It is conceivable that studies of longer duration with glycogen from other tissues might yield results which differed from the present results. Conceivably kidney, heart, etc., may follow metabolic pathways with some variations from the metabolism of liver.
SUMMARY
The glycogen of rat liver was isolated following feeding, by stomach tube, of glucose plus either acetate or butyrate labeled with C13. The glycogen was hydrolyzed to glucose, and the latter degraded.
After the administration of CHJ. C1300H or CHB. CH2. CH,. CFOOH as well as after the administration of CHI. C3HZ. CH2. COOH, all of the ex- cess isotopic carbon in the glycogen was found in positions 3 and 4 of the glucose unit. Since these are the same positions as for CO2 fixation, and since considerable amounts of isotopic carbon appeared in the respiratory COZ, it was impossible from location of Cl3 in the glycogen to determine whether there was an additional pathway of conversion of fatty acid carbon to glycogen.
With Cl3H3.COOH or CY3H3+C300H or CH3.CHz.C3H2.COOH, all de- gradation fractions of the glycogen contained excess CY3. This is considered direct evidence that at least the a-carbon atoms of acetate and butyrate can enter glycogen by a pathway other than CO2 fixation.
The distribution of isotope found in liver glycogen is consistent with formation of 3-carbon carbohydrate fragments from acetate and butyrate via the tricarboxylic acid cycle, and synthesis of the g-carbon glycogen units from two 3-carbon fragments through reversal of the conventional reactions of glycolysis.
The results after the administration of butyrate are consistent with the p oxidation of butyrate to 2 molecules of acetate, but inconsistent with w oxidation of butyrate to succinate.
These observations have been made with intact animals and provide some evidence for the functioning, under in viva conditions, of schemes based largely on in vitro studies.
We wish to thank Dr. Walton Shreeve, Miss Carol Carlson, Miss Eleanor Davies, Miss Bernice Theissen, and Miss Margaret Cook for help with a number of the chemical determinations, and Dr. A. 0. C. Nier of the De- partment of Physics, University of Minnesota, for most of the mass spectrometer measurements.
by guest on July 17, 2018http://w
ww
.jbc.org/D
ownloaded from

1284 LIVER GLYCOGEN
BIBLIOGRAPHY
1. Buchanan, J. M., Hastings, A. B., and Nesbett, F. B., J. Biol. Chem., 150, 413 (1943).
2. Wood, H. G., Lifson, N., and Lorber, V., J. Biol. Chem., 159, 475 (1945). 3. Lifson, N., Lorber, V., and Wood, H. G., Federation Proc., 4, 47 (1945). 4. Lorber, V., Lifson, N., and Wood, H. G., J. Biol. Chem., 161, 411 (1945). 5. Lifson, N., Lorber, V., Sakami, W., and Wood, H. G., Federation Proc., 6, 152
(1947). 6. Osborn, 0. L., Wood, H. G., and Werkman, C. H., Ind. and Eng. Chem., Anal.
Ed., 5, 247 (1933). 7. Anker, H. S., J. BioZ. Chem., 166, 219 (1946). 8. Cramer, R. D., and Kistiakowsky, G. B., J. BioZ. Chem., 137, 549 (1941). 9. Stahly, G. L., Osborn, 0. L., and Werkman, C. H., Analyst, 59, 319 (1934).
10. Sakami, W., Evans, W. E., and Gurin, S., J. Am. Chem. Sot., 69, 1110 (1947). 11. Adkins, H., and Folkers, K., J. Am. Chem. Sot., 53, 1095 (1931). 12. Folkers, K., and Adkins, H. J., J. Am. Chem. Sot., 54, 1145 (1932). 13. Norris, J. F., Am. Chem. J., 38, 627 (1907). 14. Bischoff, C. A., Ber. them. Ges., 28,2622 (1895). 15. Stetten, D., Jr., and Boxer, G. E., J. BioZ. Chem., 155, 231 (1944). 16. Good, C. A., Kramer, H., and Somogyi, M., J. BioZ. Chem., 100, 485 (1933). 17. Van Slyke, D. D., and Folch, J., J. BioZ. Chem., 136,509 (1940). 18. Shaffer, P. A., and Hartmann, A. F., J. BioZ. Chem., 45,365 (1921). 19. Folin, O., and Malmros, H., J. BioZ. Chem., 88, 115 (1929). 20. Osborn, 0. L., and Werkman, C. H., Ind. and Eng. Chem., Anal. Ed., 4,421 (1932). 21. Ball, E. G., Tucker, H. F., Solomon, A. K., and Vennesland, B., J. BioZ. Chem.,
140, 119 (1941). 22. Bloch, K., and Rittenberg, D., J. BioZ. Chem., 155,243 (1944). 23. Rittenberg, D., and Bloch, K., J. BioZ. Chem., 157, 749 (1945). 24. Medes, G., Weinhouse, S., and Floyd, N. F., J. BioZ. Chem., 157, 35 (1945). 25. Blixenkrone-Moller, N., Z. physiol. Chem., 252, 137 (1938).
by guest on July 17, 2018http://w
ww
.jbc.org/D
ownloaded from

Sakami and Harland G. WoodNathan Lifson, Victor Lorber, Warwick
FIXATIONOTHER THAN CARBON DIOXIDE
LIVER GLYCOGEN BY PATHWAYSAND BUTYRATE CARBON INTO RAT THE INCORPORATION OF ACETATE
1948, 176:1263-1284.J. Biol. Chem.
http://www.jbc.org/content/176/3/1263.citation
Access the most updated version of this article at
Alerts:
When a correction for this article is posted•
When this article is cited•
alerts to choose from all of JBC's e-mailClick here
html#ref-list-1
http://www.jbc.org/content/176/3/1263.citation.full.accessed free atThis article cites 0 references, 0 of which can be
by guest on July 17, 2018http://w
ww
.jbc.org/D
ownloaded from


![Lupron (leuprolide acetate) Injection, Solution Rx only ... · Lupron (leuprolide acetate) Injection, Solution [Abbott Laboratories] Rx only . DESCRIPTION . Leuprolide acetate is](https://static.fdocuments.in/doc/165x107/5bd5671d09d3f2733e8b8a35/lupron-leuprolide-acetate-injection-solution-rx-only-lupron-leuprolide.jpg)