The Incidence and Prevalence of Spinal Cord Injury in...
57
The Incidence and Prevalence of Spinal Cord Injury in Canada Overview and esmates based on current evidence A joint publication of and URBAN FUTURES Strategic Research to Manage Change
Transcript of The Incidence and Prevalence of Spinal Cord Injury in...

The Incidence and Prevalence ofSpinal Cord Injury in Canada
Overview and esti mates based on current evidence
A joint publication of
and
U R B A N F U T U R E S SS tt rr aa tt ee gg ii cc RR ee ss ee aa rr cc hh tt oo MM aa nn aa gg ee CC hh aa nn gg ee


The Incidence and Prevalence ofSpinal Cord Injury in Canada
Overview and esti mates based on current evidence
Project Co-ordinator: Angela Farry, Rick Hansen Insti tute
Report Authors:Angela Farry, Rick Hansen Insti tute
David Baxter, Urban Futures Insti tute
Project Contributors: The authors wish to thank all of those who generously shared their knowledge of, and insights into, the many dimensions of spinal cord injury in Canada, including:
David Cassidy, PhD, DrMedSc;Marcel Dvorak, MD;
Michael Fehlings, MD, PhD;Matt hew Fingas, MSc;
Hans Krueger, PhD;Vanessa Noonan, PhD;
Anoushka Singh, PhD; andLesley Soril, MSc
Having acknowledged these valuable contributors, the authors remain fully and solely responsible
for the report and its contents.
Please address comments and correspondence concerning this report to info@rickhanseninsti tute.org, with “Incidence and Prevalence Report” in the subject line.
D e c e m b e r 2 0 1 0
This report may be reproduced in whole or in part with appropriate acknowledgement of the source.


U R B A N F U T U R E S SS tt rr aa tt ee gg ii cc RR ee ss ee aa rr cc hh tt oo MM aa nn aa gg ee CC hh aa nn gg ee
P a g e iDecember 2010The Inc idence and Prevalence of Spinal Cord In jury in Canada
Table of Contents
Executi ve Summary iii
I. Terminology 1
II. Relevance of Measuring the Incidence and Prevalence of SCI 4
III. The Current State of Knowledge Concerning the Incidence and 6 A. Summary of Arti cles and Implied Canadian Prevalence 6 B. Implicati ons for Measurement in Canada 10
IV. Esti mates of Incidence and Prevalence Based on Best-Available Evidence 12 A. Esti mate of Initi al and Discharge Incidence 12 B. Esti mate of Prevalence 17
V. Conclusions and Next Steps 22 A. Summary 22 B. Next Steps 23
Appendix I: Summaries of Reviewed Arti cles Concerning SCI 26
Appendix II: Comparison of ICD Codes Used In SCI Research 35
Appendix III: Preliminary Esti mates of Prevalence of Spinal Cord Injury in Canada Using Published Incidence Rates 39
Appendix IV: Age specifi c esti mates of incidence and prevalence of spinal cord injury in Canada, 2010 44
Appendix V: Projecti on of incidence and prevalence of spinal cord injury in Canada, 2010 to 2030 46
References 48

U R B A N F U T U R E S SS tt rr aa tt ee gg ii cc RR ee ss ee aa rr cc hh tt oo MM aa nn aa gg ee CC hh aa nn gg ee
P a g e i iDecember 2010The Inc idence and Prevalence of Spinal Cord In jury in Canada
This page intent ional ly left b lank.

U R B A N F U T U R E S SS tt rr aa tt ee gg ii cc RR ee ss ee aa rr cc hh tt oo MM aa nn aa gg ee CC hh aa nn gg ee
P a g e i i iDecember 2010The Inc idence and Prevalence of Spinal Cord In jury in Canada
Executive Summary
This report was prepared to provide a review of the current measures of the incidence and prevalence of spinal cord injury (SCI) in Canada. It is to be considered within the context of a strategic discussion concerning the need for, and directi on of, further formal research into the extent of spinal cord injury in the country. The report commences with considerati on of defi niti ons relati ng to spinal cord injury, followed by a review of methodology used in the measurement of its incidence (annual number of new cases) and prevalence (total number of people living with SCI, the cumulati ve net result of past SCI), and of the major Canadian publicati ons, and selected internati onal ones, that are concerned with this measurement. On this basis, esti mates of the current levels of incidence and prevalence of spinal cord injury in Canada are presented, before concluding with recommendati ons concerning these esti mates and possible directi ons for further research.
The terms of reference for this research were to produce esti mates of the incidence and prevalence of spinal cord injury in Canada based on currently published evidence. It is important to note that no such measures currently exist: very litt le has been published about the extent of spinal cord injury in Canada, and what has is limited to the incidence of traumati c spinal cord injury, with the literature silent on its prevalence, and most strikingly, on both the incidence and prevalence of non-traumati c spinal cord injury. The absence of esti mates of incidence and prevalence is of signifi cant concern, as it limits a wide range of research and policy, ranging from the determinati on of the most eff ecti ve preventi on strategies through the delivery of health and medical care to the considerati on of the fi nancial impact of SCI and funding of preventi on and care programmes.
Given the informati on provided in the reviewed publicati ons, and data on the current and historical demography of Canada, the report presents three disti nct measures concerning the current extent of SCI. The fi rst is an esti mate of the initi al incidence of SCI, which includes all new occurrences of SCI during a year, including persons dying of spinal cord injury before reaching hospital, those dying before hospital discharge, and those discharged from hospital: this is esti mated to be 4,259 new cases per year of SCI in Canada today. Of this total, an esti mated 42 percent (1,785 cases) are the result of traumati c spinal cord injury and 58 percent are from non-traumati c causes. The second measure of the extent of SCI is the discharge incidence of SCI, or the total number of people discharged from hospital aft er a spinal cord injury each year: this is esti mated to currently be 3,675 persons, 1,389 as a result of traumati c causes and 2,286 from non-traumati c causes. The third measure of the extent of SCI is its overall prevalence, or the total number of people who have incurred a spinal cord injury and who are currently living in Canada: it is esti mated that there are currently 85,556 persons living with spinal cord injury in Canada. Of this total, 51 percent (43,974 people) were the result of traumati c, and 49 percent from non-traumati c causes.
These aggregate esti mates are built up from single year of age and sex specifi c esti mates of initi al and discharge incidence and prevalence for both traumati c and non-traumati c spinal cord injury at both the tetraplegic and paraplegic levels of injury. These detailed esti mates are summarized by major age groups on the following table and by fi ve year age groups in Appendix IV of this report.

U R B A N F U T U R E S SS tt rr aa tt ee gg ii cc RR ee ss ee aa rr cc hh tt oo MM aa nn aa gg ee CC hh aa nn gg ee
P a g e i vDecember 2010The Inc idence and Prevalence of Spinal Cord In jury in Canada
Acknowledgment that these esti mates are based on the best currently available evidence also requires acknowledgement that this evidence is far from the best that there could be, parti cularly with respect to non-traumati c spinal cord injury. As the terms of reference for this research required the preparati on of these esti mates, use of the available evidence in turn required the development and documentati on of a number of assumpti ons; in these cases, the assumpti ons were intenti onally conservati ve. This means that the esti mates of incidence and prevalence may be biased downward, parti cularly in the case of non-traumati c spinal cord injury, from the actual levels that prevail in Canada.
This work should be viewed as the starti ng point in the development of robust evidence based and documented measurements of the incidence and prevalence of spinal cord injury in Canada. Further direct primary research in Canada will both increase the precision of the esti mates presented here and, more fundamentally, increase our knowledge about the extent and characteristi cs of the populati on living with spinal cord injury. Of parti cular importance will be research on non-traumati c spinal cord injury and on the survivorship of persons living with spinal cord injury, as the unique characteristi cs of Canada’s populati on, geography and health care system suggest that these may be diff erent from other countries. Given the importance of conti nuing to expand our knowledge about spinal cord injury, this report closes with a discussion of the some of the avenues further research may follow.
Esti mated Extent of Spinal Cord Injury in Canada, 2010
Age
Incidence Prevalence
Traumati c Non-traumati c Traumati c Non-traumati c
Initi al Discharge Initi al Discharge Paraplegia Tetraplegia Paraplegia Tetraplegia
0-19 243 189 53 49 459 601 181 80
20-39 646 502 285 263 3,923 5,134 2,114 941
40-59 501 390 757 700 7,782 10,154 8,598 3,818
60-79 290 226 974 900 5,502 7,048 12,214 5,354
80+ 105 82 405 374 1,567 1,805 5,904 2,377
Total 1,785 1,389 2,474 2,286 19,232 24,742 29,011 12,570
Table 1

U R B A N F U T U R E S SS tt rr aa tt ee gg ii cc RR ee ss ee aa rr cc hh tt oo MM aa nn aa gg ee CC hh aa nn gg ee
P a g e 1December 2010The Inc idence and Prevalence of Spinal Cord In jury in Canada
The Incidence and Prevalence of Spinal Cord Injury in CanadaOverview and estimates based on current evidence
I. Terminology
A. Overview of Spinal Cord Injury (SCI)
The spinal cord is the major bundle of nerves connected to the brain that extends down the spinal canal formed by the vertebrae of the spinal column. When damage occurs to the spinal cord, sensory input, movement of certain parts of the body, and involuntary functi ons such as breathing can be lost or greatly impacted. When temporary or permanent impairment occurs due to damage to the spinal cord, it is classifi ed as a spinal cord injury (Blackwell, 2001).
There are two general classes of SCI:
Traumati c SCI (tSCI) occurs when an external physical impact, such as that resulti ng from a motor vehicle accident, a fall, or from violence, damages the spinal cord. Hagen et al, 2009 defi ned traumati c SCI as an acute, traumati c lesion of the spinal cord with varying degrees of motor and/or sensory defi cit or paralysis. In this defi niti on, injuries of the cauda equina, the most caudal part of the spinal cord, were included. According to the American Board of Physical Medicine and Rehabilitati on Examinati on Outline for Spinal Cord Injury Medicine, traumati c SCI includes fractures, dislocati ons and contusions of the vertebral column (Kirshblum et al, 2002).
Non-traumati c SCI (ntSCI) occurs when a health conditi on, such as disease, infecti on, or a tumour damages the spinal cord; that is, when damage is done to the spinal cord by means other than an external physical force. The causal factors involved in non-traumati c SCI include motor neuron diseases, spondyloti c myelopathies, infecti ous and infl ammatory diseases, neoplasti c diseases, vascular diseases, toxic and metabolic conditi ons, and congenital and developmental disorders (Kirshblum et al, 2002).
The consequence of SCI is generally classifi ed as either:
Tetraplegia (or quadriplegia) which involves impairment of functi on in the arms as well as in the trunk (the body excluding the head and limbs), legs and pelvic organs but does not include brachial plexus lesions or injury to peripheral nerves outside neural canal; or
Paraplegia, which involves impairment of the trunk, legs and pelvic organs, but with arm functi on not impaired; cauda equina and conus medullaris injuries are included but lumbosacral plexus lesions or injury to peripheral nerves outside neural canal are excluded (Internati onal Standards for Neurological Classifi cati on of Spinal Cord Injury, ISNCSCI).
Classifi cati on of SCI into traumati c and non-traumati c and by the severity of the injury are parti cularly important for the treatment, recovery and rehabilitati on of the pati ent. When a SCI occurs, there can be complete or incomplete lesion(s) of the spinal cord, which, in turn, alters whether there is parti al or total motor and/or sensory defi cit. The neurological extent of the injury, or how much motor or sensory functi on is left intact aft er the SCI, is measured by a neurological examinati on specifi ed by ISNCSCI. This examinati on determines the level of impairment of the pati ent, reported with an American Spinal Injury Associati on (ASIA) Impairment Scale grade.

U R B A N F U T U R E S SS tt rr aa tt ee gg ii cc RR ee ss ee aa rr cc hh tt oo MM aa nn aa gg ee CC hh aa nn gg ee
P a g e 2December 2010The Inc idence and Prevalence of Spinal Cord In jury in Canada
The standard approach to the identi fi cati on of SCI occurs within the hospital context, where hospital record coders assign the relevant Internati onal Classifi cati on of Diseases (ICD) codes to pati ents. The ICD diagnosis codes in themselves indicate the level and severity of SCI but not the eti ology, morphology, or exact locati on of SCI, and hence are necessary but not suffi cient for the measurement of SCI. In order to determine the causal mechanism, details of SCI, and extent of impairment that results, it is necessary to additi onally obtain ICD External Cause of Injury Code (E-codes) for causati on in tSCI, existi ng health conditi ons in cases of ntSCI, and ISNCSCI results for research purposes.
B. Incidence and Prevalence
The incidence of SCI is defi ned as the number of new cases that occur each year (generally reported as a number of new SCI cases per million populati on per year); its prevalence is defi ned as the number of persons with SCI who are alive at a point in ti me, the cumulati ve result of past incidence of SCI net of mortality and potenti al cures measured as a number per million populati on (Lin, 2003).
The hospital based process for the identi fi cati on of SCI imposes signifi cant limitati ons on the measurement of its incidence and prevalence, for while the assignment of ICD codes routi nely occurs, the administrati on of ISNCSCI tests on SCI pati ents is not enti rely inclusive (oft enti mes non-traumati c SCI pati ents are not administered the ISNCSCI), and ISNCSCI results are not routi nely well reported. Another concern is the accuracy of the translati on of diagnosis from a clinician’s examinati on to the most appropriate ICD code by hospital record coders. Although there is general agreement within the medical community on the defi niti on of tSCI, there is no specifi ed standard of ICD codes that are to be included. Further, there is no consensus, general or specifi c, on what consti tutes ntSCI cases or which ICD codes apply. There is no standard reporti ng of people living with SCI, either within or outside the hospital context, and hence both procedures and codes must be developed in order to ensure eff ecti ve and comparable measurement of this populati on group. In this context, a number of recent studies have called for a standard defi niti on for traumati c and non-traumati c SCI and a uniform data collecti on methodology (Ackery et al, 2004; New & Sundararajan, 2008; Wyndaele & Wyndaele, 2006).
The absence of routi ne reporti ng has meant that measurement of incidence and prevalence has occurred on a project by project basis, leading to research using a wide range of measures and methodologies, and hence a wide range of esti mated levels. The resultant fi ndings are quite localized, as the research shows that SCI is not only age specifi c (with the highest rates for traumati c SCI found in the young adult stage of the life cycle and non-traumati c SCI demonstrati ng a steadily increasing incidence rate with increasing age), but also specifi c to the economic, social, and cultural structure of communiti es. This means that comparison of overall incidence and prevalence levels must acknowledge not only diff erent behavioural patt erns with respect to SCI but also diff erent underlying demographic and community factors.
As the general review of major published arti cles summarized in Secti on III of the body of this report (based on the more detailed review in Appendix I ‘Summary of Major Arti cles Concerning SCI’) shows, a number of researchers have provided signifi cant insights into the measurement of incidence and prevalence, but the results fall within a wide range. There have been two general methodological approaches used in published research. The fi rst approach, most commonly used in studies of SCI incidence, has been a case-based approach, using reported ICD codes to identi fy cases of SCI from databases such as the Nati onal Trauma Registry (NTR) or Discharge Abstract Database (DAD) and in some cases supplementi ng fi ndings by reviewing hospital charts. On the basis of this measurement of annual incidence, populati on age compositi ons and life expectancies are then used to esti mate prevalence.
In using this approach to esti mate prevalence, it is necessary to consider historical changes in incidence and durati on (life expectancy of those with SCI), in the age-specifi c patt ern of incidence, and the underlying

U R B A N F U T U R E S SS tt rr aa tt ee gg ii cc RR ee ss ee aa rr cc hh tt oo MM aa nn aa gg ee CC hh aa nn gg ee
P a g e 3December 2010The Inc idence and Prevalence of Spinal Cord In jury in Canada
demography. It is also important to consider the stage in the medical process that measurement occurs, as some incidence studies focus on initi al incidence which includes SCI that results in death before and during hospitalizati on. While this metric is an important considerati on in the context of preventi on, when using incidence to esti mate prevalence, it is appropriate to include only those persons who survive to reach hospital discharge.
The second approach is to measure both incidence and prevalence through a survey of the general populati on by using standard sampling and survey techniques. This approach provides a direct measurement, and can measure traumati c and non-traumati c injury by level of injury. It has a number of limitati ons, ranging from self-reporti ng bias to the problems of obtaining a stati sti cally representati ve number of respondents, parti cularly when any degree of cross-tabulati on is to be pursued.
As the following Secti on II discusses, accurate and standardized measurement of the incidence and prevalence of SCI is essenti al to evaluati on and improvement of programs relati ng to the preventi on and treatment of SCI. Such measurement does not currently occur, with existi ng studies, while valuable in their own right, using diff erent defi niti ons and measures of both incidence and prevalence.
U R B A N F U T U R E S SS tt rr aa tt ee gg ii cc RR ee ss ee aa rr cc hh tt oo MM aa nn aa gg ee CC hh aa nn gg ee
P a g e 4December 2010The Inc idence and Prevalence of Spinal Cord In jury in Canada
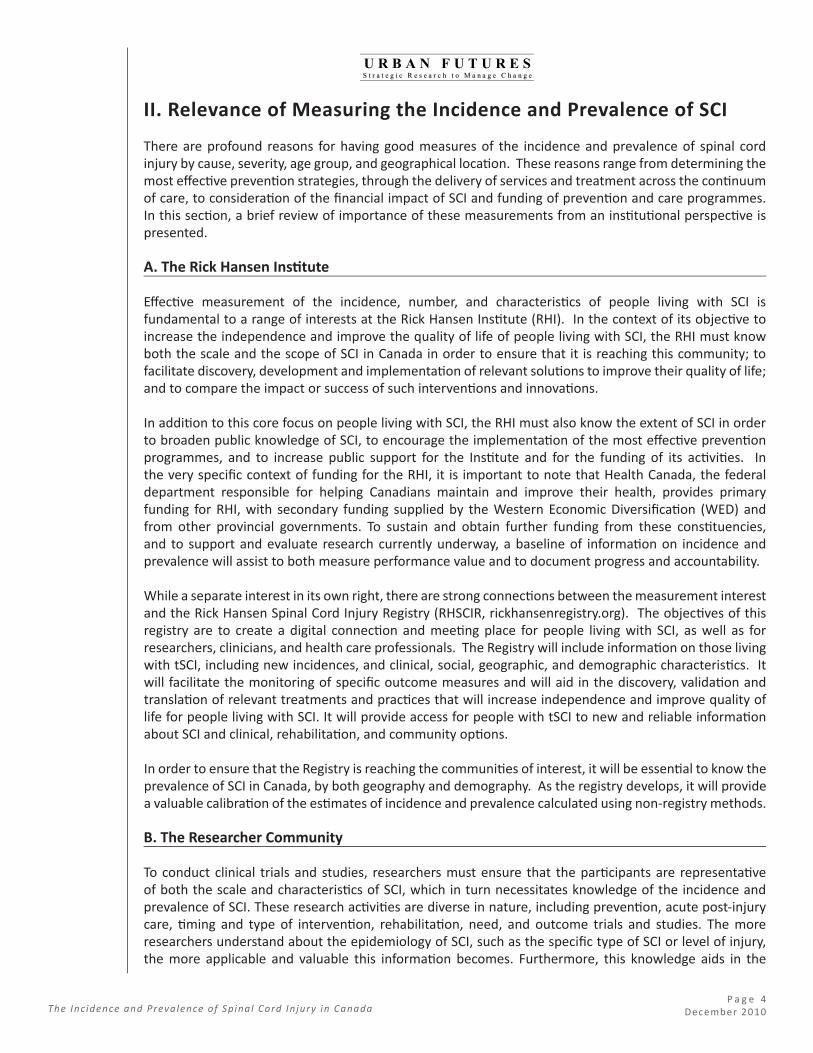
II. Relevance of Measuring the Incidence and Prevalence of SCI
There are profound reasons for having good measures of the incidence and prevalence of spinal cord injury by cause, severity, age group, and geographical locati on. These reasons range from determining the most eff ecti ve preventi on strategies, through the delivery of services and treatment across the conti nuum of care, to considerati on of the fi nancial impact of SCI and funding of preventi on and care programmes. In this secti on, a brief review of importance of these measurements from an insti tuti onal perspecti ve is presented.
A. The Rick Hansen Insti tute
Eff ecti ve measurement of the incidence, number, and characteristi cs of people living with SCI is fundamental to a range of interests at the Rick Hansen Insti tute (RHI). In the context of its objecti ve to increase the independence and improve the quality of life of people living with SCI, the RHI must know both the scale and the scope of SCI in Canada in order to ensure that it is reaching this community; to facilitate discovery, development and implementati on of relevant soluti ons to improve their quality of life; and to compare the impact or success of such interventi ons and innovati ons.
In additi on to this core focus on people living with SCI, the RHI must also know the extent of SCI in order to broaden public knowledge of SCI, to encourage the implementati on of the most eff ecti ve preventi on programmes, and to increase public support for the Insti tute and for the funding of its acti viti es. In the very specifi c context of funding for the RHI, it is important to note that Health Canada, the federal department responsible for helping Canadians maintain and improve their health, provides primary funding for RHI, with secondary funding supplied by the Western Economic Diversifi cati on (WED) and from other provincial governments. To sustain and obtain further funding from these consti tuencies, and to support and evaluate research currently underway, a baseline of informati on on incidence and prevalence will assist to both measure performance value and to document progress and accountability.
While a separate interest in its own right, there are strong connecti ons between the measurement interest and the Rick Hansen Spinal Cord Injury Registry (RHSCIR, rickhansenregistry.org). The objecti ves of this registry are to create a digital connecti on and meeti ng place for people living with SCI, as well as for researchers, clinicians, and health care professionals. The Registry will include informati on on those living with tSCI, including new incidences, and clinical, social, geographic, and demographic characteristi cs. It will facilitate the monitoring of specifi c outcome measures and will aid in the discovery, validati on and translati on of relevant treatments and practi ces that will increase independence and improve quality of life for people living with SCI. It will provide access for people with tSCI to new and reliable informati on about SCI and clinical, rehabilitati on, and community opti ons.
In order to ensure that the Registry is reaching the communiti es of interest, it will be essenti al to know the prevalence of SCI in Canada, by both geography and demography. As the registry develops, it will provide a valuable calibrati on of the esti mates of incidence and prevalence calculated using non-registry methods.
B. The Researcher Community
To conduct clinical trials and studies, researchers must ensure that the parti cipants are representati ve of both the scale and characteristi cs of SCI, which in turn necessitates knowledge of the incidence and prevalence of SCI. These research acti viti es are diverse in nature, including preventi on, acute post-injury care, ti ming and type of interventi on, rehabilitati on, need, and outcome trials and studies. The more researchers understand about the epidemiology of SCI, such as the specifi c type of SCI or level of injury, the more applicable and valuable this informati on becomes. Furthermore, this knowledge aids in the

U R B A N F U T U R E S SS tt rr aa tt ee gg ii cc RR ee ss ee aa rr cc hh tt oo MM aa nn aa gg ee CC hh aa nn gg ee
P a g e 5December 2010The Inc idence and Prevalence of Spinal Cord In jury in Canada
verifi cati on of value of treatments by allowing the researchers to esti mate the number of people who would benefi t from new therapeuti c strategies. Allocati on of funding and resources to identi fy those strategies that would be most benefi cial is essenti al for moving forward in SCI research.
The incidence and prevalence knowledge is also fundamental in the determinati on of the strategic focus on diff erent populati ons at risk or living with SCI, and in the comparisons of SCI epidemiology with other nati ons which may identi fy potenti al issues, such as an unusually high nati onal or regional SCI incidence rate in the Canadian context.
C. The Canadian Public
The consequences of SCI are overwhelmingly borne by persons living with SCI and their family and friends, and hence they, and the rest of the public, have profound interest in the preventi on of, and care for, spinal cord injury. Preventi on is the foundati on of health policy: eff ecti ve preventi on strategies can be implemented only with an understanding of the extent and socio-demographic characteristi cs of the incidence of SCI, an understanding that must be shared by researchers and the Canadian public as a whole. Understanding the extent of SCI is also fundamental to the evaluati on of the wider consequences of SCI that are the foundati on of public eff orts to provide faciliti es, services, and care that increase independence and improve the quality of life of people living with SCI.
It is essenti al to demonstrate to the Canadian public the full cost of SCI, to both individuals and communiti es, and to demonstrate the benefi ts of programs that will either reduce incidence or improve the lives of those with SCI so that the wider public will give their support, both in spirit and in funding, of these programmes. The foundati on for both of these eff orts is an eff ecti ve measurement of the incidence and prevalence of SCI in Canada.

U R B A N F U T U R E S SS tt rr aa tt ee gg ii cc RR ee ss ee aa rr cc hh tt oo MM aa nn aa gg ee CC hh aa nn gg ee
P a g e 6December 2010The Inc idence and Prevalence of Spinal Cord In jury in Canada
III. The Current State of Knowledge Concerning the Incidence and Prevalence of SCI in Canada
PubMed Central Canada (an online digital archive of full-text, peer-reviewed Canadian research publicati ons in health and life sciences, pubmedcentralcanada.ca) was searched for studies, and reviews of studies, of the incidence and prevalence of SCI published over the past decade, with a focus on studies conducted in Canada and that specifi cally gave an incidence rate of SCI. Four Canadian studies were found, which form the basis of the literature review presented here. Two studies from Australia relati ng to ntSCI were also included. Finally, two other studies were included: a literature review of all published literature that related to incidence to provide the global context and a recently published U.S. prevalence of paralysis survey initi ated by the Christopher & Dana Reeve Foundati on (not indexed in PUBMED).
Appendix I to this Report, ‘Summary of Major Arti cles Concerning SCI’, presents a summary of these arti cles highlighti ng the fi ndings relevant to the measurement of incidence and prevalence. A number of general observati ons may be made concerning these publicati ons. First, each uses a diff erent methodology and diff erent defi niti on of SCI. Even those studies which use ICD codes to identi fy the potenti al incidence of spinal cord injury rely on diff erent sets of codes, as is indicated in the “Comparison of ICD Codes Used in SCI Research” presented in Appendix II. Second, given the small sample sizes in each study, variance should be anti cipated between measured and actual levels. Third, and more signifi cantly, researchers have raised a signifi cant concern about under-reporti ng of non-catastrophic injury for both traumati c and non-traumati c SCI.
To the extent that these publicati ons present esti mates for incidence or prevalence, the corresponding rates were tabulated and then applied to the appropriate demographic variable for the Canadian populati on to demonstrate what the incidence and prevalence of SCI in Canada would be should the research be directly applicable in the Canadian context. In the following secti on, the contents of these three Appendices are summarized (Secti on III. A.) and then conclusions with respect to the calculati ons of incidence and prevalence are presented (Secti on III. B.). The details of these calculati ons are presented in Appendix III, ‘Preliminary Esti mates of Prevalence of Spinal Cord Injury in Canada Using Published Incidence Rates’. In each case, incidence rates are number of new cases of SCI per million populati on for 2010 and prevalence rates are number of people living with SCI per million populati on in 2010, with incidence defi ned as the number of new cases in a year and prevalence as the total number of people living with spinal cord injury during the year.
A. Summary of Arti cles and Implied Canadian Prevalence
1. Couris et al, 2010 (Canada)
Gender-specifi c incidence rate of tSCI: 36.3 (male) and 12.1 (female).Implied tSCI prevalence in Canada: 18,438 (male), 6,378 (female); 24,816 total.
Data source - identi fi ed 936 incident tSCI cases in southern Ontario by ICD codes from hospital Discharge Abstract Database (DAD). DAD collects informati on on admission, transfers and deaths of in-pati ents, hence this rate would include deaths during hospitalizati on but not before admission. Excluded cases under the age of 18 years. Sensiti vity and specifi city of identi fi cati on of tSCI was not evaluated. Trauma pati ents for whom the SCI diagnosis is delayed or missed would not be counted.

U R B A N F U T U R E S SS tt rr aa tt ee gg ii cc RR ee ss ee aa rr cc hh tt oo MM aa nn aa gg ee CC hh aa nn gg ee
P a g e 7December 2010The Inc idence and Prevalence of Spinal Cord In jury in Canada
2. Pickett et al, 2006 (Canada)
Age specifi c incidence rates for tSCI: 0-14 years, 3.37; 15-64 years, 41.79; 65 plus, 50.87.Implied tSCI prevalence in Canada: 42,939 cases.
Data source - Identi fi ed 151 tSCI cases in south-western Ontario by ICD codes of medical records database. Does not specify whether data include cases of death before hospital discharge. Collecti on bias: no use of a trauma registry, did not include multi ple sources of data.
3. Dryden et al, 2003 (Canada)
Gender-specifi c incidence rates of tSCI: detailed for ten-year age groups (see Appendix III.A.4).Implied tSCI prevalence in Canada: 49,982 (male), 18,934 (female); 68,916 (total).
Data source - Identi fi ed 450 tSCI cases in Alberta by ICD codes from the Alberta Trauma Registry and Offi ce of the Medical Examiner with subsequent review of charts from the Alberta Ministry of Health and Wellness. Included deaths before hospitalizati on and discharge, hence initi al incidence rates. Validity test of approach and inclusion criteria resulted in positi ve predicti ve value of 94.4% and a sensiti vity of 100%. Rapidly resolving neurological defi cits would have been missed as well as pre-hospital deaths that included multi ple severe injuries.
4. Guilcher et al, 2010 (Canada)
No incidence or prevalence rates reported. Presents a comparison of selected characteristi cs of ntSCI and tSCI rehabilitati on pati ents aged 18-plus in the province of Ontario. Initi al admission for inpati ent rehabilitati on was 1,623 ntSCI and 842 tSCI: the exclusion criteria reduced the sample to 1,002 ntSCI cases and 560 tSCI cases, a 38 percent and 33 percent reducti on, respecti vely.
In considering Guilcher et al, 2010, the authors of this report noted that the use of rehabilitati on clinics as a setti ng for research on SCI potenti ally introduces limitati ons to the identi fi cati on of the relati ve incidence of ntSCI as compared to tSCI. In discussions conducted with spinal cord injury researchers during the preparati on of this report, it was occasionally remarked that individuals with ntSCI may not be as likely to be referred to rehabilitati on clinics as those with tSCI. This anecdotal evidence suggests that the populati on with spinal cord injury in rehabilitati on is not necessarily the total populati on with spinal cord injury as younger and middle aged persons with catastrophic tSCI are perhaps more likely to be referred to rehabilitati on than the elderly, those with non-catastrophic injury, and those with ntSCI. A number of reasons for this were suggested, ranging from complicati ons due to the causal disease or medical conditi on to a percepti on that, given their generally older age, individuals with ntSCI may not have as strong a commitment to rehabilitati on as younger individuals with tSCI. At this juncture there are no data to corroborate these anecdotal comments, which are raised here only by way of establishing a context for the use of relati ve magnitude esti mates derived from the rehabilitati on context.
5. New et al, 2010 (Australia)
No incidence rates reported. A rati o of 1,361 to 2,241 of traumati c to non-traumati c SCI rehab cases presented. The sampling base was persons in rehabilitati on programmes in Australia.

U R B A N F U T U R E S SS tt rr aa tt ee gg ii cc RR ee ss ee aa rr cc hh tt oo MM aa nn aa gg ee CC hh aa nn gg ee
P a g e 8December 2010The Inc idence and Prevalence of Spinal Cord In jury in Canada
6. New & Sundararajan, 2008 (Australia)
Gender-specifi c incidence rates of ntSCI in Australian context: adults 15 years and older, 30.5 (male) and 22.9 (female); 0-14 years: 0.7 for both genders. Implied ntSCI prevalence in Canada using these rates: 17,045 (male), 13,216 (female); 30,261 (total). Incidence rates for ntSCI from a review of selected internati onal publicati ons: a range from 5.1 to 80 cases per million populati on per year. Implied ntSCI prevalence in Canada using these rates: a range from 6,883 to 107,967 cases
Data source for Australian study: identi fi ed 631 ntSCI cases in Australia by ICD codes from a state-wide hospital discharge database; reviewed eleven publicati ons from eight countries. Victorian Admitt ed Episodes Dataset (for Australian data) includes cases on every admitt ed episode of care occurring in Victorian acute hospitals. Publicati on does not specify if it includes deaths before hospital discharge. Excluded congenital, motor neurone disease, multi ple sclerosis and cases under 15 years of age. Identi fi cati on of ntSCI may have not been totally inclusive and coding guidelines used in this study may not be applicable to other countries.
7. Wyndaele & Wyndaele, 2006 (Belgium – worldwide literature review)
Incidence rates for SCI (cause and incidence measure unspecifi ed): Range 10.4 - 83.0.Implied prevalence in Canada: from 13,334 to 106,416 cases of SCI.
This study also presented results from two post-1985 studies of prevalence of SCI in North America, citi ng esti mates for SCI (unspecifi ed as to type) of 681 and 755 cases per million. Applying these rates to Canada’s current demography results in 22,976 and 25,473 cases of unspecifi ed SCI.
Data Source - Review of existi ng literature on SCI incidence, prevalence and epidemiology. No specifi cati on of each study’s inclusion and exclusion criteria or whether the studies were on traumati c or non-traumati c SCI. Demography and economy of regions of study oft en diff erent than that of Canada.
8. Cahill et al, 2008 (Christopher & Dana Reeve Foundati on Paralysis Study, USA)
Prevalence (Percent of populati on with paralysis due to SCI): 0.4%.Implied SCI prevalence in Canada: 134,959 cases.
Data source: Telephone survey of households in the United States. Self-reported incidence and prevalence without clinical data. Results were generalized to the populati on of the United States although only households with listed telephone numbers were surveyed. Survey response management implicitly directed non-traumati c cases away from spinal cord injury category. No clinical verifi cati on that spinal cord injury was cause of paralysis (defi ned as diffi culty moving arms or legs).
Conclusions
The implied incidence and prevalence rates for the 2010 Canadian populati on based on these studies is an esti mated annual incidence (Figure 1) of tSCI from 351 to 2,800 cases and of ntSCI from 172 to 2,699 cases; an implied prevalence (Figure 2) of tSCI from 13,334 to 106,416 and of ntSCI from 6,883 to 107,967. This implies a range of prevalence of 360 percent (from 20,217 to 214,383) of SCI in Canada. Note that there is no clustering patt ern within these ranges for either incidence or prevalence.

U R B A N F U T U R E S SS tt rr aa tt ee gg ii cc RR ee ss ee aa rr cc hh tt oo MM aa nn aa gg ee CC hh aa nn gg ee
P a g e 9December 2010The Inc idence and Prevalence of Spinal Cord In jury in Canada
The wide ranges of implied incidence and prevalence are the results of the diff erences in defi niti ons, inclusions, and methodology used in the published research, as well as of underlying demographic and community characteristi cs. The reality that published research generates such ranges and diff erences when applied to Canada means that there is not an existi ng measure or esti mate of either the incidence or prevalence of spinal cord injury in Canada that will meet the needs of the Rick Hansen Insti tute, researchers, or the public and its agencies.
42,939
107,967 106,416
134,959
24,816
59,628
30,261
13,3346,8830
25,000
50,000
75,000
100,000
125,000
150,000
0 1 2 3 4 5 6 7
Prevalence Study
Range Lower Limit
Range Upper Limit
Couris et al , 2010
Pickettet al , 2006
New & Sundararajan,2008 (ntSCI)
Drydenet al , 2003
Wyndaele &Wyndaele, 2006Study
No.
of c
ases
Implied Annual Prevalence of SCI in Canada
Cahill et al, 2008
620
1,491
753
1,237
172351
2,6992,800
0
500
1,000
1,500
2,000
2,500
3,000
0 1 2 3 4 5 6
Incidence Study
Range Lower Limit
Range Upper Limit
Couris et al , 2010
Pickett et al , 2006
New & Sundararajan,2008 (non-traumatic SCI)
Drydenet al , 2003
Wyndaele & Wyndaele, 2006Study
No.
of c
ases
Implied Annual Incidence of SCI in CanadaFigure 1
Figure 2

U R B A N F U T U R E S SS tt rr aa tt ee gg ii cc RR ee ss ee aa rr cc hh tt oo MM aa nn aa gg ee CC hh aa nn gg ee
P a g e 1 0December 2010The Inc idence and Prevalence of Spinal Cord In jury in Canada
B. Implicati ons for Measurement in Canada
A number of important elements of SCI that will infl uence the eff ecti ve measurement of incidence and prevalence are discussed in these published arti cles:
1. The incidence of SCI is age specifi c
The distributi on of tSCI age specifi c initi al incidence rates (Figure 3, derived from Dryden, 2003) is bimodal, demonstrati ng a peak in the adolescent and younger adult stage of the life cycle primarily as a result of motor vehicle and sporti ng accidents and violence. A second peak in the older adult stage (70 years and older) is also seen, primarily as a result of falls (Pickett et al, 2006; Dryden et al, 2003). Age specifi c ntSCI initi al incidence rates (Figure 4, derived from New & Sundararajan, 2008) increase steadily with age (New & Sundararajan, 2008). The mean age of incidence of ntSCI is signifi cantly higher than that of tSCI (New et al, 2010; Guilcher et al, 2010).
The lifecycle patt ern of the incidence of SCI has signifi cant measurement implicati ons, as it will be essenti al to use age-specifi c rates to separate the eff ects of demographic diff erences in underlying populati ons from those of incidence patt erns. It will also have signifi cant implicati ons for both preventi on and treatment policy, as the aging of Canada’s populati on will shift the incidence populati on into the older age groups. Further, the age-specifi c nature of incidence will aff ect both the extent and the compositi on of prevalence. Recent studies have shown an increase in the age at injury and shift s in the mechanism of injury. Generally, the shift may be represented as being from young males injured in MVA to older people falling (Couris et al, 2010; Pickett et al, 2006), a change that will have signifi cant impacts on the extent of SCI, on the characteristi cs of persons living with SCI and on the enti re clinical care pathway in the future given the aging of the Canadian populati on that will occur in the coming decades.
0
25
50
75
100
125
0-4
5-9
10-1
4
15-1
9
20-2
4
25-2
9
30-3
4
35-3
9
40-4
4
45-4
9
50-5
4
55-5
9
60-6
4
65-6
9
70-7
4
75-7
9
80-8
4
85-8
9
90+
AgeInci
denc
e Ra
te (c
ases
per
mill
ion
popu
lati
on)
Initial Incidence of tSCI by Age and Sex (based on Dryden 2003)
Male
Female
Total
Figure 3

U R B A N F U T U R E S SS tt rr aa tt ee gg ii cc RR ee ss ee aa rr cc hh tt oo MM aa nn aa gg ee CC hh aa nn gg ee
P a g e 1 1December 2010The Inc idence and Prevalence of Spinal Cord In jury in Canada
2. SCI is gender-specifi c
In all age groups, for both ntSCI and tSCI, males are at a higher risk of SCI than females (Couris et al, 2010; Dryden et al, 2003; Pickett et al, 2006; New et al, 2010; New & Sundararajan, 2008; Wyndaele & Wyndaele, 2006; Guilcher et al, 2010). The greatest diff erence in tSCI occurs in the 20 -24 and 25-29 age groups, where the initi al incidence rates for males is 140 cases per million populati on compared to 40 per million for females. The greatest diff erence for ntSCI initi al incidence rates occurs in the 85+ age group where the incidence rate for males is 127 cases per million populati on compared to 70 cases per million populati on for females. Having noted this, it is important to also note that the diff erences in age-specifi c incidence rates are much greater for tSCI than for ntSCI. Overall, the average male rate for tSCI is 65 cases per million populati on compared to a rate of 24 for females (Dryden et al, 2003); the respecti ve rates for ntSCI are only 30 and 22 (New & Sundararajan, 2008).
3. SCI is geography specifi c
The eti ology of SCI diff ers between regions and countries. For example, although the leading cause of tSCI in many countries is motor vehicle accidents, in others it is not. For example, in Bangladesh the leading cause of tSCI is work-related falls, primarily from trees or while carrying a heavy load on the head, while in South Africa it is violence. As further examples of geographical diff erences, mean age of injury, male to female rati os, and secondary complicati ons show much diff erent trends in low average income countries than they do in higher income countries (Ackery et al, 2004); rural areas have a higher incidence rate of tSCI than urban areas (Dryden et al, 2003); and to the extent that workplace injuries lead to SCI, the diff erences in regions’ employment structures will lead to diff erent incidence rates. In this vein, military service (and parti cularly combat service) carries with it a signifi cant risk of SCI and hence diff erences in the relati ve level of military engagement will generate diff erences in incidence of SCI between countries. While there is scant evidence on ntSCI, diff erences in underlying disease exposures and pre-conditi ons for ntSCI will generate diff erences in SCI prevalence and incidence between countries. Finally, the general level of health care and life expectancy in a region will in turn aff ect the rate of survival of those with SCI, and hence its prevalence.
0
25
50
75
100
125
15-24 25-34 35-44 45-54 55-64 65-74 75-84 85+Age
Inci
denc
e Ra
te
Male
Female
Total
Initial Incidence of ntSCI by Age and Sex (based on New, 2008)Figure 4

U R B A N F U T U R E S SS tt rr aa tt ee gg ii cc RR ee ss ee aa rr cc hh tt oo MM aa nn aa gg ee CC hh aa nn gg ee
P a g e 1 2December 2010The Inc idence and Prevalence of Spinal Cord In jury in Canada
IV. Estimates of Incidence and Prevalence Based on Best-Available Evidence
The ideal measure of incidence and prevalence of SCI would provide details on age, sex, cause, severity, mobility limitati on, region of occurrence, and place of residence. As the previous secti on showed, this ideal has not yet been att ained in Canada; in fact, there is not a documented evidenced based esti mate of either incidence or prevalence for use in research or policy development.
While this ideal will only be found through future completi on of comprehensive studies that use standard defi niti ons accepted by the research community, it is possible to use the existi ng studies to demonstrate how the ideal measures might be applied and to document an evidence-based esti mate of incidence and prevalence using what is currently known about them. This is done in this secti on, which combines the best available current evidence on the incidence of SCI with current esti mates of the age and gender compositi on of Canada’s populati on to generate such esti mates of incidence and prevalence of SCI for Canada in 2010.
A. Esti mate of Initi al and Discharge Incidence
The evidence from Dryden et al, 2003 was used as the basis for the esti mati on of the current incidence of tSCI as it is the Canadian study with the most complete case ascertainment. The study compared multi ple sources of data and checked that missed and duplicate cases were minimized. The study also gave gender-specifi c initi al incidence rates for ten year age groups, which is an important factor in both determining incidence and in esti mati ng prevalence. The overall incidence values found in this study were also near the middle of the range of implied incidence rates arti culated using published rates in other studies and Canadian demographic variables.
It must be noted that there is no great virtue per se in using a mid-range value, for if the highest value refl ects the most complete informati on, it should be used. In this case, however, the high range values came from omnibus studies which included regions with greatly diff ering demographics and eti ologies, and with noted limitati ons in data collecti on methodology. For these reasons, these rates were not seen as the most appropriate for use in this context. Furthermore, the use of a mid-range value does reduce the risk of a percepti on that esti mate of incidence and prevalence are intenti onally based on outlier values.
The tSCI data from Dryden et al, 2003 were vett ed with those from Couris et al, 2010 (although this is the most recently published study and calculated incidence on the biggest sample size, the study included only pati ents that were 18 years or older, which is a signifi cant limitati on as many tSCIs occur before the age of 18) and from Pickett et al, 2006 (which was also considered as it gave age-specifi c incidence rates, but only in three age groups and which considered only one database without searching a trauma registry to fi nd missed cases).
In using rates generated for Alberta to esti mate incidence at the nati onal level, it is important to comment on diff erences between the province and the nati onal average. Demographically, Alberta is younger (with a median age of 35.6 years compared to the nati onal average of 39.5) and has a greater percentage of males (51.1 percent compared to 49.6 percent), something that, all other things equal, would result in a greater number of new tSCI cases each year. However, the use of age and gender specifi c incidence rates eff ecti vely standardizes for diff erences in underlying demography, shift ing the focus to the behavioural patt erns that might result in diff erences in age-specifi c rates between Alberta and the rest of Canada. While this may be fruitf ul ground for further research, the data that are currently available suggest that such diff erences may not be as great as might be anti cipated, as Alberta is both as urban (with 82 percent of the populati on living in urban areas compared to the nati onal average of 80 percent) and as metropolitan

U R B A N F U T U R E S SS tt rr aa tt ee gg ii cc RR ee ss ee aa rr cc hh tt oo MM aa nn aa gg ee CC hh aa nn gg ee
P a g e 1 3December 2010The Inc idence and Prevalence of Spinal Cord In jury in Canada
(with 72 percent of its populati on in census metropolitan areas compared to a nati onal average of 68 percent) compared to Canada as a whole. On this basis, for the purposes of producing a esti mate of SCI using best currently available data, the evidence from Dryden et al, 2003 is an appropriate starti ng point.
The process between this starti ng point and the fi nal esti mates of incidence of both tSCI and ntSCI by severity involves a number of steps. These steps are described in the following paragraphs, and are outlined in the following fl ow chart (Figure 5). While the calculati ons are performed at the single years of age level, the results are given in aggregate in this secti on and by 5 year age groups in Appendix IV, ‘Age Specifi c Esti mates of Incidence and Prevalence of SCI in Canada’.
Starti ng with the ten-year-age-group- and sex-specifi c initi al tSCI incidence rates from Dryden et al, 2003, and using the age group rate as the rate for each age within in it, an esti mate of 2010 initi al incidence of tSCI in Canada was calculated by multi plying the age- and sex-specifi c rate by the esti mated number of people of each age for both sexes in Canada provided by the Urban Futures Insti tute. [See htt p://www.urbanfutures.com/reports/Report%2074.pdf for details of the demographic data base used for this report.] As the tSCI incidence rates published in Dryden et al, 2003, include deaths before hospital admission and before hospitalizati on discharge aft er injury, the result is an esti mate of the 2010 initi al incidence of tSCI of 1,785 cases.
In additi on to this esti mate of initi al incidence, another objecti ve of this research project was to produce an esti mate of prevalence, and hence it is necessary next to esti mate the discharge incidence rate (the initi al incidence net of deaths occurring before reaching hospital and in hospital aft er initi al incidence).According to Dryden et al, 2003, 15.8 percent of people who initi ally suff ered tSCI died before hospital admission and a further 7.7 percent died in hospital before discharge. The total case fatality rate before discharge was 22.2 percent, implying a 77.8 percent survival rate. This survival rate was applied to the esti mated initi al incidence in each age group to calculate a hospital tSCI discharge populati on of 1,389 new cases of tSCI in 2010 .
From the discharge populati on, age specifi c tSCI hospital discharge rates were calculated using the 2010 esti mated Canadian populati on. Figure 6 shows the 2010 age specifi c incidence for tSCI at both the
Initial ntSCI Incidence Population 2,474
Other Factors Reducing
Discharge Rate 7%
Deaths within One Year of
Diagnosis 0.6%
Deaths before Admission 15.8%
Deaths during Hospitalization
7.7%
SCI Prevalence 85,556
Initial tSCI Incidence Rates
Initial ntSCI Incidence Rates
Initial tSCI Incidence Population 1,785
ntSCI Discharge Rates
tSCI Discharge Rates
Paraplegia Life Expectancy &
Mortality Calculation
Tetraplegia Life Expectancy &
Mortality Calculation
ntSCI Hospital Discharge
Population 2,286
tSCI Hospital Discharge
Population 1,389
Ratio of ntSCI to tSCI 1.6
Figure 5

U R B A N F U T U R E S SS tt rr aa tt ee gg ii cc RR ee ss ee aa rr cc hh tt oo MM aa nn aa gg ee CC hh aa nn gg ee
P a g e 1 4December 2010The Inc idence and Prevalence of Spinal Cord In jury in Canada
incidence and discharge levels that resulted from this calculati on process. This fi gure shows the peak in incidence in the 15 to 29 age group, the results of the high incidence rates in the age group; as well it shows another, smaller peak in the 70 to 84 age group, again driven by the relati ve high incidence rates for tSCI in the older populati on. Interesti ngly, there is a third peak between these two, falling in the 40 to 54 age groups: as the graph of the age distributi on of the populati on of Canada that is also shown on this fi gure indicates, this third local peak is the result of the baby boom bulge in the populati on profi le in this age group in spite of its relati vely low incidence rates.
The next step in the calculati on process was to esti mate the incidence of ntSCI. In this context evidence from New & Sundararajan, 2008, New et al, 2010; and Guilcher et all, 2009, was used. The evidence from New & Sundararajan 2008 provided measures of age- and sex-specifi c non-traumati c SCI incidence in a rehabilitati on setti ng: these rates were used for the age-specifi c incidence patt ern for Canada. The other two studies were used to esti mate the magnitude of ntSCI relati ve to tSCI in Canada. New et al 2010 provides a rati o of ntSCI to tSCI of 2,241 to 1,361 in the rehabilitati on context in Australia, which implies a relati ve magnitude for discharge incidence of ntSCI that is 1.65 ti mes that of tSCI. As noted in the publicati on, these data are drawn from all pati ents with a primary diagnosis of SCI, and hence this rati o is derived from the enti re incidence populati on.
Guilcher et al 2010 provides a rati o of ntSCI to tSCI of 1.8 (1,002 cases to 560 cases) for the adult (18-plus) populati on in Ontario. As SCI is signifi cantly age-related, it is necessary to adjust this rati o to include the younger populati on. Using the age specifi c propensiti es for tSCI from Dryden et al 2003 as applied to the 2010 Canadian populati on indicates that, in additi on to the 560 cases involving the 18-plus populati on, it would be reasonable to anti cipate an additi onal 89 cases of tSCI in the under-18 populati on, for a total of 649 tSCI cases. Similarly, using the age-specifi c propensiti es for ntSCI derived from New & Sundararajan, 2008 as applied to the Canadian populati on, suggests that, in additi on to the 1,002 cases of ntSCI involving the 18-plus populati on, it would be reasonable to anti cipate an additi onal 22 cases of ntSCI in the under-18 populati on, for a total of 1,024 tSCI cases. These expanded fi gures imply a rati o of ntSCI to tSCI of 1.58 (1,024 cases to 649 cases). [See Appendix IV of this report for the esti mated 2010 age specifi c incidence used to scale the 18-plus populati on values from Guilcher et al, 2010 to the enti re populati on.]
0
50
100
150
200
250
0-4
5-9
10-1
4
15-1
9
20-2
4
25-2
9
30-3
4
35-3
9
40-4
4
45-4
9
50-5
4
55-5
9
60-6
4
65-6
9
70-7
4
75-7
9
80-8
4
85-8
9
90+
0
500,000
1,000,000
1,500,000
2,000,000
2,500,000
3,000,000
Discharge
Initial
Estimated Age-Specific Initial & Discharge tSCI Incidence, Canada, 2010
Ann
ual
case
s
Age
Popu
lati
on
Age Profile of 2010 Canadian Population
Figure 6

U R B A N F U T U R E S SS tt rr aa tt ee gg ii cc RR ee ss ee aa rr cc hh tt oo MM aa nn aa gg ee CC hh aa nn gg ee
P a g e 1 5December 2010The Inc idence and Prevalence of Spinal Cord In jury in Canada
This value is not materially diff erent from the 1.65 scalar derived from New et al, 2010; as the 1.65 value was directly obtained from data, rather than requiring additi onal adjustment, it was selected as the scalar used to esti mate the magnitude of ntSCI in Canada. When applied to the esti mated 1,389 persons discharged with tSCI based on Dryden et al, 2003, the result is an esti mate of an incidence of 2,286 new cases of ntSCI in Canada in 2010. Please note that if the 1.58 scalar was used (based on adjustments to Guilcher et al, 2010) the magnitude of discharge ntSCI esti mated would be 2,192, only four percent lower than the 2,286 used here.
In order to esti mate the age specifi c patt ern of ntSCI discharge incidence (an essenti al component is esti mati ng prevalence), the age specifi c ntSCI rates from New & Sundararajan, 2008 were re-based so that when they were applied to the 2010 populati on of Canada by age group the result was the esti mate of 2,286 discharge cases with ntSCI derived from Dryden et al, 2003 and New et al, 2010. The result was a set of esti mated age specifi c ntSCI discharge incidence rates that correspond to the tSCI discharge incidence rates derived from Dryden et al, 2003.
The fi nal step in the ntSCI incidence calculati ons was to calculate initi al incidence rates from this discharge level. It is at this juncture that once again the dearth of research on ntSCI presents signifi cant limitati ons to sati sfying the terms of reference for this report, which is to provide measures of the incidence and prevalence of SCI in Canada. The issue at hand is that while the consequences of SCI are essenti ally the same for tSCI and ntSCI, the paths followed to arrive at these consequences are remarkably diff erent. In the case of tSCI there is clearly an initi al incident —a car accident, a fall, a sporti ng injury—that permits measurement of initi al incidence, with subsequent mortality leading to a lower discharge incidence. The identi fi cati on of initi al incidence in the context of tSCI is of signifi cant concern, as preventi on measures must be both targeted and evaluated at this point.
In the context of non-traumati c spinal cord injury, the concept of initi al incidence is much diff erent, as ntSCI is largely seen as being a consequence of some other medical conditi on or disease. As such, preventi on and measurement have a much diff erent meaning in the context of ntSCI, falling perhaps more in the realm of the measurement of the degree to which diagnosis of, and treatment for, SCI occurs within the context of these other diseases. Certainly from a policy perspecti ve, the discharge incidence (the annual number of new persons with ntSCI who survive initi al hospitalizati on) and the prevalence of ntSCI (the number of persons with ntSCI living in our communiti es) are the most important fi gures. Nonetheless, it remains important to acknowledge that these numbers do not include all of those who suff er ntSCI, and that there is a larger number, one that has implicati ons for the conti nuum of care for both pati ents and service providers, than is indicated by the discharge incidence measures. The fact that we may not ever be able to answer the questi on of how many people annually suff er from ntSCI does not preclude the importance of asking it, as asking it will change how we look at ntSCI, and specifi cally how we look at ntSCI in the contexts of diagnosis, rehabilitati on, and most importantly, care.
There is no direct research that provides any insight into the relati onship between the total number of annual occurrences of ntSCI and the number of people recorded in the discharge populati on. Catz et al, 2002 indicates 0.6 percent of those diagnosed with ntSCI die within one year of diagnosis, a value that is used in this report. Additi onally, Guilcher et al, 2010, indicate that out of the initi al admission for inpati ent rehabilitati on of 1,623 ntSCI cases, 38 percent were excluded and out of 842 cases of tSCI, 33 percent were excluded. As the exclusion criteria included in-hospital mortality, index discharge aft er the end of study date, and death within one year aft er discharge, it is possible to hypothesize that the rati o between initi al and discharge incidence for both ntSCI and tSCI are of the same order of magnitude. However, discussions of these relati ve magnitudes conducted during the preparati on of this report indicated a general theme that the gap between initi al and discharge incidence for ntSCI, while positi ve, is not as large as the 23.5 percent gap for tSCI. In order to refl ect this narrati ve, a rate one-third of that for tSCI was used for ntSCI.

U R B A N F U T U R E S SS tt rr aa tt ee gg ii cc RR ee ss ee aa rr cc hh tt oo MM aa nn aa gg ee CC hh aa nn gg ee
P a g e 1 6December 2010The Inc idence and Prevalence of Spinal Cord In jury in Canada
In doing so, this is not to assert that this 7.6 percent gap is the correct value, but rather to state that if it is, the consequent ntSCI initi al incidence rate can be esti mated; it is to assert that specifi c research into the incidence of ntSCI would be a valuable contributi on to our understanding of this, the most prevalent form of SCI in Canada.
Applying this 7.6 percent margin to the discharge incidence number for ntSCI in each age group results in an esti mate of initi al ntSCI incidence (2,474 cases in 2010) which, when divided by the 2010 populati on of Canada by age group, gave an esti mate of the 2010 initi al incidence rated of ntSCI by age group. Figure 7 shows the resultant esti mates of the 2010 age specifi c initi al and discharge levels for ntSCI in Canada, which shows that the incidence of ntSCI peaks in the older age groups, the result of the high incidence rates in these older age groups off setti ng the relati vely small proporti on of the populati on that is currently of these ages. Please note that using this approach for the calculati on of initi al incidence for ntSCI has no consequence for the esti mates of either its discharge incidence or its prevalence.
To summarize, the process used to esti mate incidence and prevalence results in an esti mated 2010 initi al incidence of new spinal cord injury of 1,785 cases for tSCI and 2,474 cases for ntSCI (4,259 in total), and a discharge incidence of 1,389 cases for tSCI and 2,286 cases for ntSCI (3,675 in total). These esti mates are based on the following assumpti ons:
a) that Dryden et al, 2003 rates are representati ve of tSCI initi al incidence by age in Canada;that the survivorship rati os between initi al and discharge incidence for tSCI documented in Dryden et al, 2003 apply to all age groups;
b) that the rati o of ntSCI to tSCI presented in New et al, 2010 prevails in Canada;
c) that the assumed survivorship rati o between initi al and discharge incidence for ntSCI is in the order of 7.6 percent and that it applies for all age groups; and
d) the general life cycle patt ern of the incidence of ntSCI presented in New & Sundararajan, 2008, also prevails in Canada.
0
50
100
150
200
250
300
350
0-4
5-9
10-1
4
15-1
9
20-2
4
25-2
9
30-3
4
35-3
9
40-4
4
45-4
9
50-5
4
55-5
9
60-6
4
65-6
9
70-7
4
75-7
9
80-8
4
85-8
9
90+
0
500,000
1,000,000
1,500,000
2,000,000
2,500,000
3,000,000
Estimated Age-Specific Initial & Discharge ntSCI Incidence, Canada, 2010
Age Profile of 2010 Canadian Population
Ann
ual
case
s
Age
Popu
lati
on
Discharge
Initial
Figure 7

U R B A N F U T U R E S SS tt rr aa tt ee gg ii cc RR ee ss ee aa rr cc hh tt oo MM aa nn aa gg ee CC hh aa nn gg ee
P a g e 1 7December 2010The Inc idence and Prevalence of Spinal Cord In jury in Canada
In each case, it can be argued that the assumpti on may not be valid, and hence the esti mates may not be accurate. Unfortunately, there is no evidence available to prove or disprove validity – it is the absence of evidence that necessitates these assumpti ons. It is here suggested that, with respect to tSCI, Dryden et al, 2003 is suffi ciently robust as to apply generally in Canada, with the consequences that diff erences between esti mates and what actually occurs would not be in terms of orders of magnitude. With respect to ntSCI, the issues of under reporti ng of ntSCI will have a greater impact on the esti mate of ntSCI than the assumpti ons made here. Thus the esti mated incidence of tSCI is likely proximate to what a detailed measurement study would produce, while the esti mated incidence of ntSCI is likely below, and perhaps well below, what direct measurement would reveal.
B. Esti mate of Prevalence
The esti mate of prevalence is based on the esti mates of discharge incidence, on the annual number of people by age group who are discharged from hospital with spinal cord injury. As there has never been a census of SCI prevalence in Canada, there is no base on which to develop a current esti mate. It is therefore necessary to go as far back as possible in history and model prevalence forward using annual discharge incidence to populate the prevalence group. This demographic acknowledgement was done by using a database maintained by Urban Futures which contains esti mates of the Canadian populati on, and of its death and birth rates, by single years of age and sex, for each year from 1921 to 2010.
The fi rst step in the process of esti mati on of prevalence was to esti mate historical annual discharge incidence by applying the age and sex specifi c discharge incidence rates for tSCI and ntSCI discussed in the preceding secti on to the esti mated populati on of Canada by age and sex each year for the 1921 to 2010 period. This annual incidence was then disaggregated into four groups: tSCI with paraplegia and tetraplegia (based on a 43.3% and 56.7% split documented in Dryden et al, 2003) and ntSCI with paraplegia and tetraplegia (based on a 69.2% and 30.8% split documented in New et al, 2010). Prevalence for each of these four groups was esti mated using the general methodology discussed in the following paragraphs, with the only disti ncti on being the diff erent age specifi c mortality rates applied to paraplegia and tetraplegia. Survival rates aft er ntSCI and tSCI have been compared in the rehabilitati on setti ng in Israel. These studies report that survival rates between the two sub-types of SCI are similar. When controlling for age at injury, gender, injury severity, and level of injury, no diff erences were detected between the mortality risks of tSCI and ntSCI (Ronen et al, 2004)
The second step was to account for prevalence by adding the current year’s discharge incidence to the survivors of the previous year’s prevalence. In the absence of a census of prevalence at any ti me in the past, the 1921 discharge incidence populati on was equated to that year’s prevalence, thereby forming the starti ng populati on to which the subsequent year’s incidence would be added. To determine the number of people who survived to 1922, the age and sex specifi c mortality rate for people living with SCI was esti mated. This relied on using the average life expectancies of persons with SCI compared to that of persons of the same age not living with SCI. These data are published for the United States populati on by age group in the NSCISC Annual Stati sti cal Report 2009 (values for these data in 5 year age groups were kindly provided by Dr. H. Krueger by e-mail). Data are for fi ve levels of spinal cord injury (motor functi onal, any level; paraplegia, tetraplegia C5-C8; tetraplegia C1-C4; venti lator dependent, any level); as incidence esti mates prepared for this report are aggregates for paraplegia and tetraplegia, the life expectancy rati os for paraplegia and tetraplegia C5-C8 were used for purposes of prevalence calculati ons. Values of life expectancies for people living with paraplegia and tetraplegia were calculated as percentages of the average life expectancy for persons of each age, with the result smoothed to single years of age using a best-fi t polynomial equati on (Figure 8).

U R B A N F U T U R E S SS tt rr aa tt ee gg ii cc RR ee ss ee aa rr cc hh tt oo MM aa nn aa gg ee CC hh aa nn gg ee
P a g e 1 8December 2010The Inc idence and Prevalence of Spinal Cord In jury in Canada
As populati on models use mortality rates rather than life expectancy, it was necessary to esti mate the age specifi c mortality rate for a person with SCI relati ve to the average mortality rate for a person of the same age without SCI. For example, if the life expectancy of a 40 year old with SCI was 70 percent of that of a person of the same age without SCI, then the mortality rates, both current and over the rest of their life, for persons with SCI who were 40 years of age must be above those of their peers who do not have spinal cord injury. As a wide range of diff erent patt erns of age specifi c mortality rates could generate a 30 percent diff erence in life expectancy, and in the absence of any informati on as to the actual path of diff erences in age-specifi c mortality over the lifeti me of these two peer groups, it was appropriate to take the simplest approach, which was to scale age-specifi c mortality for persons with SCI up to match the age-specifi c diff erences in life expectancy. The same method was applied for each age group for each year in the 1921 to 2010 period: this implicitly assumes that the life expectancy for people with SCI increased at the same rate and followed the same patt ern as life expectancy increases for the populati on as a whole.
Aft er applying the mortality rates to the 1921 discharge incidence populati on, the survivors were aged one year and the 1922 discharge incident populati on was added to them to result in the 1922 prevalence. This calculati on process was repeated each year up to 2010. Clearly, starti ng with the equati on of the 1921 discharge incidence populati on with 1921 prevalence underesti mates that year’s prevalence; however, by conti nuing to add the incidence each year, and acknowledging aging and mortality in the prevalence group, over ti me this underesti mate will be diminished. By 1961, for example, most of the 1921 prevalence group would have left the populati on and hence the magnitude of the 1921 starti ng group would have litt le impact on the esti mated prevalence in 1961. The result of this calculati on of prevalence is a consistent esti mate of prevalence from 1961 to 2010.
On the basis of this process, the total prevalence for people living with SCI in Canada in 2010 is esti mated to be 85,556 persons (0.25 percent of the populati on). Of this total, 43,974 people (51 percent) would have SCI as a result of traumati c causes and 41,581 (49 percent) as a result of non-traumati c causes. An esti mated 37,313 people would be living with tetraplegia (44 percent) and 48,243 people (56 percent) living with paraplegia. As Figure 9 shows, the prevalence of both tSCI and ntSCI is concentrated in the older age groups, the result of both survivorship and the signifi cant incidence of SCI in the older populati on, both tSCI as a result of falls and ntSCI generally.
0%
15%
30%
45%
60%
75%
0 5 10 15 20 25 30 35 40 45 50 55 60 65 70 75 80 85
Paraplegic
Tetraplegic
Estimated Life Expectancy of Paraplegics & Tetraplegics as a Percentage of Average Life Expectancy of Persons without SCI
% o
f Avg
Life
Exp
ecta
ncy
Age
Figure 8

U R B A N F U T U R E S SS tt rr aa tt ee gg ii cc RR ee ss ee aa rr cc hh tt oo MM aa nn aa gg ee CC hh aa nn gg ee
P a g e 1 9December 2010The Inc idence and Prevalence of Spinal Cord In jury in Canada
Figure 10 shows the esti mated levels of discharge incidence (right hand scale) and prevalence (left hand scale) in Canada over the 1961 to 2010 period, both lines refl ecti ng the growing and aging of the Canadian populati on and the increases in life expectancies over the past half century. Over the past two decades, for example, annual discharge incidence is esti mated to have increased by 41 percent, from 2,607 in 1990 to 3,675 in 2010, and annual prevalence by 62 percent, from 52,759 in 1990 to 85,556 in 2010.
While not within the specifi c terms of reference for this report, the same methodology that was used to produce the 2010 esti mates can be used to project levels in the future given an age- and sex-specifi c projecti on of Canada’s populati on. Such a projecti on may be useful for strategic purposes and hence is presented in brief summary in Appendix V, ‘Projecti on of incidence and prevalence of spinal cord injury in Canada, 2010 to 2030’.
0
1,000
2,000
3,000
4,000
5,000
6,000
0..4
5..9
10..1
4
15..1
9
20..2
4
25..2
9
30..3
4
35..3
9
40..4
4
45..4
9
50..5
4
55..5
9
60..6
4
65..6
9
70..7
4
75..7
9
80..8
4
85..8
9
90+
0
500,000
1,000,000
1,500,000
2,000,000
2,500,000
3,000,000
tSCIntSCI
Estimated Age-Specific Prevalence of ntSCI and tSCI, Canada, 2010
Age Profile of 2010 Canadian Population
Ann
ual
case
s
Age
Popu
lati
on
85,556
3,675
0
20,000
40,000
60,000
80,000
100,000
1961
1963
1965
1967
1969
1971
1973
1975
1977
1979
1981
1983
1985
1987
1989
1991
1993
1995
1997
1999
2001
2003
2005
2007
2009
0
2,000
4,000
6,000
8,000
10,000
Estimated Incidence & Prevalence of SCI, Canada, 1961 to 2010
Prev
alen
ce
Inci
denc
e
Discharge Incidence (number of new SCI cases annually)
Prevalence (number of persons living with SCI)
Figure 10
Figure 9

U R B A N F U T U R E S SS tt rr aa tt ee gg ii cc RR ee ss ee aa rr cc hh tt oo MM aa nn aa gg ee CC hh aa nn gg ee
P a g e 2 0December 2010The Inc idence and Prevalence of Spinal Cord In jury in Canada
To summarize, using the best available evidence produces an esti mated prevalence of 85,556 people living with spinal cord injury in Canada in 2010, with 43,974 people living with SCI that resulted from traumati c causes (19,232 with paraplegia and 24,742 with tetraplegia) and 41,582 with SCI that resulted from non-traumati c causes (29,011 with paraplegia and 12,582 with tetraplegia). In additi on to the assumpti ons that underlie the esti mates of annual discharge incidence rates used to calculate these esti mates, they are also based on the following assumpti ons:
a) that age-specifi c discharge incidence rates have not changed signifi cantly;
b) that the rati o of life expectancy of persons with SCI to average life expectancies observed in the United States prevails in Canada for both tSCI and ntSCI; and
c) that the rati o of life expectancy of persons with SCI to average life expectancies has generally remained constant and hence that the life expectancy of persons with SCI has increased at the rate of the overall average.
The approach used here captures the changes in demography and life expectancy that have occurred in Canada over the past decades; what it does not precisely capture are changes that are specifi c to SCI. While the methodology does assume constant incidence rates over the enti re historical period, given the shorter life expectancy of persons living with SCI, compared to the overall average, eff ecti vely this presumed constancy will be for the past twenty to thirty years, something that will reduce its impact on the esti mate of prevalence. A similar situati on will prevail with respect to the use of the constant rati o of life expectancies. Thus, only if signifi cant change occurred over the past two to three decades would use of the 2010 rates for earlier period have a major impact on the prevalence measure. As with the esti mati on of incidence, the major concern with the esti mati on of prevalence will lie with likely under-reporti ng of ntSCI.
Without any published benchmarks, it is not possible to judge how closely these esti mates of prevalence correspond to the actual number of people currently living with spinal cord injury in Canada. Having noted this, they do fall within the range indicated by the simple scaling of incidence rates based on studies conducted in Canada presented in Appendix III, and below the range of values based on studies conducted in the United States.
It is appropriate that prevalence and incidence rates, and specifi cally rates for tSCI, in Canada are indicated as being below those of United States, as the underlying patt ern and level of injury in the United States is signifi cantly diff erent from that of Canada. As examples, Cahill et al, 2009 (recall that there is a bias towards tSCI in this research’s fi ndings) found that:
a) twenty-four percent of the persons living with spinal cord injury in the United States stated that a motor vehicle accident was the cause of their injury; data from the US NCHS and Stati sti cs Canada indicate that age-specifi c motor vehicle mortality rates for young adult males in the United States are 75 percent higher than they are for their peers in Canada;
b) victi ms of violence account for four percent of the people living with spinal cord injury in the United States; US NCHS and Stati sti cs Canada data indicate the age-specifi c mortality rates as a result of violence for young adult males in the United States are six ti mes what they are for their Canadian peers; and

U R B A N F U T U R E S SS tt rr aa tt ee gg ii cc RR ee ss ee aa rr cc hh tt oo MM aa nn aa gg ee CC hh aa nn gg ee
P a g e 2 1December 2010The Inc idence and Prevalence of Spinal Cord In jury in Canada
c) six percent of the people living with SCI in the United States were injured during military service; data published by the federal governments of the two countries indicate that the acti ve military force of the United States represents a rate of 5 per 1000 populati on while Canada’s represents a rate of 2 per 1000.
To the extent that these diff erences correspond to diff erences in the incidence rates for traumati c spinal cord injury, it is reasonable to anti cipate that Canada would demonstrate corresponding lower incidence and hence prevalence rates. Thus, based on current evidence, the esti mate of 85,556 people living with SCI is an appropriate starti ng point for both further research and policy.

U R B A N F U T U R E S SS tt rr aa tt ee gg ii cc RR ee ss ee aa rr cc hh tt oo MM aa nn aa gg ee CC hh aa nn gg ee
P a g e 2 2December 2010The Inc idence and Prevalence of Spinal Cord In jury in Canada
V. Conclusions and Next Steps
A. Summary
This report has reviewed the current evidence concerned with the incidence and prevalence of spinal cord injury in Canada, commencing with defi niti onal considerati ons, followed by a review of methodology and of the major publicati ons that have presented such measures. On the basis of this review, the report presented evidence-based esti mates of the current levels of incidence and prevalence in Canada, indicati ng a 2010 annual initi al incidence of 4,259 cases of SCI (1,785 of tSCI and 2,474 of ntSCI), a discharge incidence of 3,675 cases (1,388 of tSCI and 2,287 of ntSCI) and annual prevalence of 85,556 persons living with spinal cord injury (43,974 as a result of tSCI and 41,582 from ntSCI). For reference purposes, it is suggested that rounded values of 4,300 for initi al incidence, 3,700 for annual discharge incidence, and 86,000 for prevalence be used.
Both the data and the methodology used to produce these esti mates have their limitati ons, as is acknowledged in the report. It is not intended that these esti mates be regarded as defi niti ve; their purpose is to say “here are esti mates of incidence and prevalence that are documented and supported by the best available evidence” which can and should be revised to remove their acknowledged shortcomings when research is done that improves the evidence that is currently available. Having said this, these esti mates provide a valid starti ng point in the process of determining the precise level of the extent of spinal cord injury in Canada, and as a base for policy unti l further research has been completed.
Before carrying on with the research process, however, it is important for the spinal cord research and policy community to decide whether there is an urgent need for dedicati ng signifi cant research resources to refi ning these esti mates. This context raises three questi ons, the answers to which will be essenti al to determining the directi on of further research. The fi rst questi on is: “Do the evidence based esti mates of annual initi al incidence of 4,300 new cases of spinal cord injury and a current prevalence of 86,000 persons living with spinal cord injury provide the RHI, researchers, and the community at large with suffi cient informati on to meet their needs?” If the answer is “yes”, then research resources may be directed to other acti viti es.
However, if the answer to this questi on is “no”, then the other two questi ons must be addressed. The second questi on is: “Are the limitati ons perceived in these esti mates merely technical and hence can be suffi ciently refi ned without major research resources, or are they fundamental, and hence further signifi cant research is required?” The answer to this questi on will determine the magnitude of the additi onal resources that will be required to ulti mately get a “yes” as the answer for the fi rst questi on.
If more than simple refi nements will be necessary to obtain an affi rmati ve answer to questi on one, then the research focus must be clarifi ed. The need for this clarifi cati on arises from the reality that the greatest limitati ons on data and evidence are in the context of ntSCI. This is in part the result of the very limited research that has been conducted on ntSCI, but it is also in part the result of an implicit ambivalence with respect to the inclusion of ntSCI in SCI research. If further research on the measurement of the extent of SCI in Canada is to be pursued, it will also be necessary to answer the third questi on: “Is the research focus SCI and people living with SCI regardless of cause, or is it a cause specifi c focus emphasizing tSCI?” If the answer is that the focus is all SCI, then the next step in research would be a priority focus on ntSCI to bring evidence in the Canadian context up to the same level as is available for tSCI. If the answer is a narrower focus, then a much diff erent research path would be followed.

U R B A N F U T U R E S SS tt rr aa tt ee gg ii cc RR ee ss ee aa rr cc hh tt oo MM aa nn aa gg ee CC hh aa nn gg ee
P a g e 2 3December 2010The Inc idence and Prevalence of Spinal Cord In jury in Canada
B. Next Steps
Presuming that further research is deemed appropriate, there are a number of approaches and data sources in additi on to those outlined in the literature review that might be considered. In the interests of informing the discussion of these paths, this report closes with a very brief overview of some of the data sets/sources that might be consulted.
1. Defi niti on
Fundamental to moving the research on the extent of SCI in Canada forward is agreement on defi niti ons, in the sense of establishment of a single data-based defi niti on of what consti tutes both tSCI and ntSCI. Specifi cally, there must be an accepted standard list of ICD codes that identi fi es SCI and a medical defi niti on for each code. With this list, informati on can be extracted from existi ng databases, such as a hospital discharge database or the Nati onal Trauma Registry, and comparable data can be gathered. Furthermore, standards must be arti culated to guide hospital and medical coding that identi fi es SCI (parti cularly inclusion of cases of SCI with less severe impairment and with cases of ntSCI). A challenge will be measurement of SCI with temporary motor and/or sensory defi cit. Note that in the arti culati on of these standards, considerati on should be given to applicability in both the prevalence and incidence contexts.
2. Measurement of Incidence
Incidence is best measured in a hospital context, as it is in this context that initi al diagnosis and treatment are routi nely performed. Presuming the existence of the standard ICD-based defi niti on of SCI, an accurate way of measuring incidence could be through reporti ng from hospital databases. For data on deaths before hospital admission, another approach would have to be considered, such as investi gati on of a medical examiner’s database. However, the Pickett et al study discussed that this method may sti ll present an under-representati on of the number of people with SCI that die before arrival to hospital.
In the specifi c context of tSCI, the Nati onal Trauma Registry (NTR), which provides nati onal stati sti cs on injury in Canada, reported by Canadian Insti tute for Health Informati on (CIHI) will prove useful. The data in the NTR comes from the Hospital Morbidity Database, with additi onal input from provincial trauma registries or trauma centres in Canada. The Hospital Morbidity Database provides hospital discharge stati sti cs as well as administrati ve, clinical and demographic informati on on inpati ent events. The NTR collects all hospital separati ons (discharges and deaths), hence when measuring incidence the inclusion criteria must state clearly whether they include deaths or discharges alone.
Currently, the NTR contains the Minimum Data Set (MDS) which includes demographic, diagnosti c and procedural informati on on all admissions to acute care hospitals in Canada due to injury, and the Comprehensive Data Set which contains data on pati ents hospitalized with major trauma (Injury Severity Score of 12 or greater). The Death Data Set (DDS), which is currently under development, will contain data on all deaths in Canada due to injury (htt p://secure.cihi.ca/cihiweb). Data from the DDS will be benefi cial to the SCI research community as it will allow the measurement of incidence including deaths at the scene and before admission to hospital.
Incidence of ntSCI is harder to measure in the hospital context as the onset of injury may be much earlier than when the pati ent is admitt ed into a hospital for diagnosis. Studies in the past have published measures on incidence based on data from rehabilitati on centres (Cosar et al, 2010; New & Sundararajan, 2008; Scivolett o et al, 2010; Guilcher et al, 2010), however there are a number of limitati ons with this method, as it equates incidence of ntSCI with rehabilitati on admission. It assumes that all pati ents with a confi rmed ntSCI are referred to rehabilitati on, which is untrue as ntSCI is more likely to occur to elderly

U R B A N F U T U R E S SS tt rr aa tt ee gg ii cc RR ee ss ee aa rr cc hh tt oo MM aa nn aa gg ee CC hh aa nn gg ee
P a g e 2 4December 2010The Inc idence and Prevalence of Spinal Cord In jury in Canada
persons (New et al, 2010) and as a result oft en not transferred to rehabilitati on, hence under-esti mati ng the ntSCI populati on. It would be ideal to capture the ntSCI cases based on admission or discharge from the locati on of diagnosis.
Alternati vely, informati on from provincial Medical Services Plans (MSPs) may provide a source of data on the incidence of SCI for both ntSCI and tSCI. These plans insure medically required services provided by physicians and supplementary health care practi ti oners, laboratory services, and diagnosti c procedures. To the extent that these points of contact between pati ents and the health care system are accurately coded in MSP accounti ng, it may be possible to tabulate data on the incidence of both tSCI and ntSCI. Case reviews would be necessary in order to confi rm eti ology and level of impairment.
3. Measurement of Prevalence
Once discharged from hospital, people living with spinal cord injury have very diff use interacti ons with the health care and medical systems, something that makes routi ne reporti ng of the prevalence of SCI much more diffi cult. Following from the previous secti on, one approach would be to acknowledge the comprehensive and universal nature of the MSPs, and rely on their coding to identi fy the prevalence of SCI. The diffi culty in this regard would be to discern from a specifi c treatment or prescripti on suffi cient informati on to identi fy SCI. For example, while MSPs cover wheelchairs, it does not identi fy that SCI is present nor does it capture those people living with SCI who do not use wheelchairs covered by the MSPs.
The wide range of interacti ons of people living with SCI with the health care system, and the absence of routi ne reporti ng suggests that the best direct way to collect data for the measurement of prevalence would be through the use of a survey procedure. One survey approach would be to remain within the medical context, and survey hospitals, clinics and physicians, on either a universal or random sample basis, asking them to provide data on their interacti ons with persons living with spinal cord injury (if this approach was followed, care would have to be exercised to avoid double counti ng). Alternati vely, the survey could be directed to people living with SCI and distributed by way of either hospitals, clinics and physicians, or by the provincial MSPs.
Another approach is to directly survey the enti re populati on much as the Cahill et al, 2008 recently did for the United States populati on. This is the approach that Stati sti cs Canada has historically used in its Parti cipati on and Acti vity Limitati on Survey (PALS) which has been distributed to households in conjuncti on with the Census: there will be no PALS accompanying the 2011 Census, and it will not be possible to add questi ons to the voluntary survey of households that will replace the compulsory long form Census questi onnaire.
A specifi c SCI prevalence direct populati on survey may be conducted (either as a standalone or as part of an omnibus survey), however such an approach may not be cost eff ecti ve as one would have to contact roughly 400 households to identi fy one person living with SCI. To facilitate collecti on of any signifi cant data, the sample size must be large and representati ve of the overall populati on: the required sample would need to be even larger if any cross-tabulati on of characteristi cs is to be pursued. The cost involved in this type of survey would need to be carefully considered, given that the larger the sample populati on, the larger the cost of such a survey would be. The alternati ve of sampling voluntary parti cipants can introduce strong biases, as those who respond may have diff erent characteristi cs, whether demographic or other, from those who do not. Another notable limitati on of total populati on surveys is inaccuracy due to self-reporti ng of medical conditi on with no supporti ng clinical or medical informati on. Finally, such surveys do not reach persons living in insti tuti ons and collecti ve dwellings.

U R B A N F U T U R E S SS tt rr aa tt ee gg ii cc RR ee ss ee aa rr cc hh tt oo MM aa nn aa gg ee CC hh aa nn gg ee
P a g e 2 5December 2010The Inc idence and Prevalence of Spinal Cord In jury in Canada
If a direct populati on survey was to be conducted, it would perhaps be most cost eff ecti ve to recognize the universal nature of Canada’s health care system by fi nding a way to conduct a survey to identi fy people living with spinal cord injury using the MSPs. To the extent that results of such a survey could be ti ed to medical records, this could be a parti cularly att racti ve way to proceed. Similarly, the public goodwill held by the RHI could be used to att ract respondents to a populati on survey: for example, an on-line survey document could be posted, supported by public service announcements that directed people to the survey site. A RHI-centered survey vehicle could also support development of the Rick Hansen Spinal Cord Injury Registry, either by streaming tSCI respondents to the Registry or by broadening its scope to include ntSCI.

U R B A N F U T U R E S SS tt rr aa tt ee gg ii cc RR ee ss ee aa rr cc hh tt oo MM aa nn aa gg ee CC hh aa nn gg ee
P a g e 2 6December 2010The Inc idence and Prevalence of Spinal Cord In jury in Canada
Appendix I: Summaries of Reviewed Articles Concerning SCI
All incidence rates in this Appendix are number of new cases per million populati on per year and prevalence rates are the number of people living with SCI per million populati on at a point in ti me; incidence is the number of new cases per year and prevalence is the number of people living with SCI during the year.
1. Couris et al. Characteristi cs of adults with incident traumati c spinal cord injury in Ontario, Canada, 2010
Objecti ve: To provide recent esti mates of the incidence of tSCI in adults living in Ontario, Canada for the fi scal years 2003/04-2006/07. Method: A cohort study. Two primary data sources were census data provided by Stati sti cs Canada and the hospital Discharge Abstract Database (DAD) provided by the Canadian Insti tute for Health Informati on. Results: Majority of SCI cases was male. Falls emerged as leading cause of tSCI in this study. Fall-induced injury increases with age, while other causes of tSCI decrease with age. Incident cases had a mean age of 51.3 years.
Defi niti on of traumati c SCI:Inclusion: ICD-10-CA Codes (Cervical spinal cord: S14.0, S14.10, S14.11, S14.12, S14.13, S14.18, S14.19; Thoracic spinal cord: S24.0, S24.10, S24.11, S24.12, S24.13, S24.18, S24.19; Lumbar spinal cord: S34.0, S34.10, S4.11, S34.12, S34.13, S34.18, S34.19; Other spinal cord injury: S34.30, S34.38, T06.0, T06.1) (obtained from Rick Hansen Foundati on)Exclusion: Invalid value for gender, less than 18 years of age at ti me of admission, previous hospital stay for SCI within past year, SCI not most responsible diagnosis.
Defi niti on of non-traumati c SCI: N/AIncidence rates: Average age-standardized annual rate over 4-year period: 24 per million; In-hospital deaths were included, but pre-hospital deaths were not, hence incidence falls between initi al and discharge.Male-female rati o: 2.9:1Prevalence rates: N/A Life expectancy: N/AGender Specifi c tSCI Incidence Rates (per million populati on per year): Mean incident rate: Total 24; Male 36.3; Female 12.1
The eti ological diff erences found in this study diff er from worldwide trends with respect to the causes of SCI, which generally fi nd MVAs as the leading source of tSCI. This diff erence can be att ributed to the inclusion and exclusion criteria that the study was conducted under, one of them being that any tSCI pati ents under the age of 18 were excluded: as tSCI caused by MVA are highest in adolescents and young adults, this might explain the diff erent causal patt ern discovered. Another feasible explanati on was changes in seat belt legislati on and motor vehicle licensing regulati ons decreased the number of tSCIs caused by motor vehicle accidents in the locality of study.
Cause of tSCI in Men & Women
% Male % Female
Falls 47.8 54.1
MVC 23 28.5
Struck by/against an object 12.9 5.4
Other 15.1 8.7

U R B A N F U T U R E S SS tt rr aa tt ee gg ii cc RR ee ss ee aa rr cc hh tt oo MM aa nn aa gg ee CC hh aa nn gg ee
P a g e 2 7December 2010The Inc idence and Prevalence of Spinal Cord In jury in Canada
2. Dryden et al, 2003. The Epidemiology of Traumati c Spinal Cord Injury in Alberta, Canada, 2003
Objecti ve: To describe incidence and patt ern of tSCI in Alberta, Canada from 1 April 1997 to 31 March 2000. Method: A populati on-based study. Data was gathered from: admin data from the Alberta Ministry of Health and Wellness, records from the Alberta Trauma Registry, and death certi fi cates from the Offi ce of the Medical Examiner. Results: Incidence rates for males were higher than for females for all age groups. MVC accounted for majority of injuries (highest rates in 15-29 years), falls next (highest rates in people older than 60 years). Rural resident incidence 2.5 ti mes that of urban residents.
Defi niti on of traumati c SCI:Inclusion: ICD, 9th revision, Clinical Modifi cati on diagnosti c codes: 806.x (fracture of the vertebral column with SCI) or 952.x (SCI without evidence of spinal bone injury). Injuries of cauda equina were included. Cases were included if they had an external cause of injury code (E code) consistent with tSCI, and were admitt ed for at least one day to a trauma centre in Alberta.Exclusion: Diagnosis of a “conversion” disorder (ICD-9-CM code 300.11), pati ents who sustained a SCI as a result of medical/surgical complicati ons ICD-9-CM codes 998.2 (accidental puncture or lacerati on during a procedure and E870.x-E879.x (misadventures to pati ents during surgical and medical care).
Defi niti on of non-traumati c SCI: N/AIncidence rates: Mean incidence rate 52.5; rates are initi al incidence rates.
Male-female rati o: 2.5:1Prevalence rates: N/A Life expectancy: N/AUrban and Rural tSCI Incidence Rates:
Gender Specifi c Peak Incidence Rates:
tSCI Incidence Rates
Total Male Female
Mean Incidence rate 52.5 75.4 29.8
Mean Incidence rate only including those who survived to hospitalizati on
44.3 64.9 23.8
Urban and Rural tSCI Incidence Rate
Urban Rural
Mean Incidence Rate 32.0 72.6
Gender Specifi c Peak Incidence Rates
Male Female
Peak Age Groups 20-29 yrs 70+ yrs 15-19 yrs 70+ yrs
Incidence Rates 138.0 98.9 65.3 58.7

U R B A N F U T U R E S SS tt rr aa tt ee gg ii cc RR ee ss ee aa rr cc hh tt oo MM aa nn aa gg ee CC hh aa nn gg ee
P a g e 2 8December 2010The Inc idence and Prevalence of Spinal Cord In jury in Canada
Eti ology of tSCI in Alberta:
tSCI Incidence:
3. Pickett GE et al. Epidemiology of Traumati c Spinal Cord Injury in Canada, 2006
Objecti ve: To determine the incidence, clinical features and treatment of tSCI with a parti cular interest in defi ning populati on at risk for injury in south-western Ontario, Canada between Jan 1998 and Jun 2001. Method: A retrospecti ve, descripti ve study identi fi ed 151 cases defi ned by ICD-9 diagnosti c codes aft er a search of London Health Sciences Centre medical records database. Results: tSCI due to falls are increasing (Table 1.1), but leading cause of tSCIs are motor vehicle accidents (Table 1.2). Mean age of pati ents with tSCI is increasing (Table 1.3), as well as number of elderly with tSCI (Table 1.4), so focus of preventi on programs should also expand to home safety and avoidance of falls.
Defi niti on of traumati c SCI:Inclusion: ICD-9, Clinical Modifi cati on diagnosti c codes 952.x (SCI without evidence of spinal bone injury) and 806.x (fracture of vertebral column with SCI)Exclusion: spine fracture without SCI, SCI unrelated to trauma (tumour, vascular lesion, iatrogenic injury), neurologic defi cit cause by peripheral nerve lesion.
Defi niti on of non-traumati c SCI: N/A Incidence rates: 3.370 for ages 0-14 years; 41.79 for ages 15-64 years; 50.87 for ages 65 and olderMale-female rati o: 3:1; includes all hospital admissions as rates fall between initi al and discharge.Prevalence rates: N/A Life expectancy: N/AMortality in SCI Pati ents: Percent of pati ents – total 8%; 0-59 years of age 5%; 60 + years of age 18%Percentage of tSCI due to MVA and Falls in Various Years:
Percentage of tSCI due to MVA & Falls
Study % of tSCI - MVA % of tSCI - Falls
Sekhon & Fehlings, 2001 40-50 20
Pickett et al, 2003 43.2 42.8
Pickett et al, 2006 35 31
Eti ology of tSCI in Alberta
Eti ology % of Total
MVC 56.4
Falls 19.1
Sports & Recreati on 11.3
Struck by object/person 5.3
Intenti onal (Assault/self-infl icted) 4.4
Other/Unspecifi ed 3.3
tSCI Incidence Rate
Age Group Male Female
0..4 3.8 1.9
5..14 22.0 14.4
15..19 91.0 62.5
20..29 132.1 38.3
30..39 71.8 33.5
40..49 91.0 19.1
50..59 71.8 15.3
60..69 57.4 24.9
70+ 94.7 56.2

U R B A N F U T U R E S SS tt rr aa tt ee gg ii cc RR ee ss ee aa rr cc hh tt oo MM aa nn aa gg ee CC hh aa nn gg ee
P a g e 2 9December 2010The Inc idence and Prevalence of Spinal Cord In jury in Canada
Causes of tSCI According to Gender: (Note that only 39 females were included in the study compared to 112 males.)
Mean Pati ent Age in Various Years:
Percentage of tSCI in Pati ents 60 Years or Older in Various Years: (Note that the 2003 study att ributed its results to an increase in elderly incidence that was a recent phenomenon not captured in earlier reports.)
Annual Incidence of Acute Hospitalizati on for tSCI in Ontario:
Mean Pati ent Age in Various Years
Source Mean
Pati ent Age
US Nati onal SCI Database, 1973-79 28.6
Major Trauma Outcome Study for US & Canada, 1982-89 33.5
Sekhon et al, 2001 35.3
Pickett et al, 2006 42
Percentage of tSCI in Pati ents Aged 60+
SourceObservati on
Period% of tSCI in
Elderly (60+)
Sekhon & Fehlings, 2001 1970s 4.7%
Sekhon & Fehlings, 2001 2001 10.0%
US Nati onal SCI Database 2000-2006 10.9%
Pickett et al, 2003 2003 30.0%
Causes of tSCI by Gender
Leading causes of tSCI % of Total tSCI % of Males % of Females
Motor Vehicle Accidents 35 28.6 53.8
Falls 31 30.4 33.2
Other Vehicles 12 15.2 2.6
Sports/Recreati on 9 11.6 2.6
Work-related Accident 7 8 2.6
Violence 5 5.4 2.6
Suicide 1 0.8 2.6
Annual Incidence of Acute Hospitalizati on for tSCI in Ontario
SourceObservati on
PeriodEsti mates
of Incidence
Bott erell et al, 1975; Tator et al, 1993 1947-1981 13 - 16
CIHI, 1996-1999 1996-1999 44 - 50
Pickett et al, 2006 1997 21
Pickett et al, 2006 2000 49

U R B A N F U T U R E S SS tt rr aa tt ee gg ii cc RR ee ss ee aa rr cc hh tt oo MM aa nn aa gg ee CC hh aa nn gg ee
P a g e 3 0December 2010The Inc idence and Prevalence of Spinal Cord In jury in Canada
4. Guilcher et al. Health care uti lizati on in non-traumati c and traumati c spinal cord injury: a populati on-based study, 2010
Objecti ve: To compare the prevalence and impairment characteristi cs of ntSCI and tSCI pati ents admitt ed to inpati ent rehabilitati on; to determine and compare the outpati ent health care uti lizati on patt erns of pati ents with ntSCI and tSCI during the fi rst year aft er their index inpati ent rehabilitati on admission; and to determine factors that are associated with outpati ent health care uti lizati ons in both ntSCI and tSCI populati ons. Method: Used a retrospecti ve cohort design with administrati ve data from the Insti tute for Clinical Evaluati ve Sciences for the province of Ontario for the fi scal years April 2003 to June 2005 for pati ents 18 years of age and older. Results: Initi al admissions for inpati ent rehabilitati on were 1,623 ntSCI and 842 tSCI: the exclusion criteria (in-hospital mortality, index discharge aft er March 31 2006, and died within one year aft er discharge) reduced the numbers to 1,002 ntSCI cases and 560 tSCI cases, a 38 percent and 33 percent reducti on respecti vely. In the context of the adult populati on in rehabilitati on clinics the prevalence of ntSCI was 1.8 ti mes that of tSCI. Individuals admitt ed to inpati ent rehabilitati on for ntSCI were older, more likely to be paraplegic, and have more co-morbiditi es than individuals with tSCI.
Defi niti on of traumati c SCI: From Nati onal Rehabilitati on Reporti ng Systems Rehabilitati on Client Group Codes 04.2.
Defi niti on of non-traumati c SCI: From Nati onal Rehabilitati on Reporti ng Systems Rehabilitati on Client Group Codes 04.1.
Incidence rates: N/AMale-female rati o: ntSCI 52.2% to 47.8%; tSCI: 75.4% to 24.6%Prevalence rates: N/A Life Expectancy: N/ADemographic Characteristi cs of tSCI and ntSCI:
5. New & Sundararajan. Incidence of non-traumati c spinal cord injury in Victoria, Australia, 2008
Objecti ve: To determine the incidence of ntSCI in Victoria, Australia between 1 July 2000 and 30 June 2006. Method: Populati on-based study and literature review. Data extracti on from a state-wide, populati on-based, health-administrati on database of hospital admissions. Medline and Embase databases were searched with Ovid search engine. Results: Incidence of ntSCI was signifi cantly greater than the reported incidence for tSCI. Men had a higher incidence of ntSCI compared to women.
ntSCI & ntSCI by Characteristi cs
ntSCI tSCI
Demographic
Male 523 (52.2%) 422 (75.4%)
Female 479 (47.8%) 138 (24.6%)
Total 1,002 560
Median age 64 46
Level of injury
Paraplegia 396 (39.5%) 216 (38.6%)
Tetraplegia 186 (18.6%) 264 (47.1%)
Other 420 (41.9%) 80 (14.3%)
Locati on
Urban 483 (86.3) 882 (88.0%)

U R B A N F U T U R E S SS tt rr aa tt ee gg ii cc RR ee ss ee aa rr cc hh tt oo MM aa nn aa gg ee CC hh aa nn gg ee
P a g e 3 1December 2010The Inc idence and Prevalence of Spinal Cord In jury in Canada
Defi niti on of traumati c SCI: N/ADefi niti on of non-traumati c SCI:
Inclusion: A new onset of ntSCI or who developed ntSCI aft er hospitalizati on. ICD-10-AM codes: acute paraplegia (G8201, G8203, G8205, G8211, G8213, G8215, G8221, G8223, G8225); acute tetraplegia (G8231, G8233, G8235, G8241, G8243, G8245, G8251, G8253, G8255) or cauda equina syndrome (G834). Pati ents with cauda equina syndrome and C prefi x (occurred during course of hospitalizati on) were included. If the P prefi x (conditi ons were present on admission to hospital and underwent evaluati on and treatment) was used, only those pati ents with the cauda equina SCI listed as the fi rst of the presenti ng diagnoses were included.Exclusion: For identi fi ed cases, if a previous admission that included an SCI was found, the following cases were excluded: ICD-10-AM exclude codes 2000-2006: T91; 1998-2000: G82, G83, S140, S141, S240, S241, S340, S341, S343; ICD-9-AM exclude codes 1996-1998: 336, 340, 341, 344, 440, 441, 806, 952, 953, 013.4, 013.5, 192.2, 192.3 198.3, 198.4, 225.3, 225.4, 324.1, 721.1, 721.4, 722.7, 907.2, 907.3, 721.91). Pati ents with congenital conditi ons causing ntSCI, or pati ents with motor neurone disease or multi ple sclerosis were excluded. Non-Victorian residents and immigrants and residents moving from other states of Australia or overseas aft er ntSCI were excluded.
Prevalence rates: N/A Life expectancy: N/A Incidence rates: In Victoria 11.9; in all of Australia 11.9; Average age-adjusted incidence rate of ntSCI in Victoria: adults was 26.3; male 30.5; female 22.9; under age 15 0.7; as study included hospital admissions, rates fall between initi al and discharge.
ntSCI Incidence Rates
Age group Male Female TotalIndexed to15-24 Total
15-24 8.2 4 6.1 1.0
25-34 9.7 8.1 8.9 1.5
35-44 19.5 13.3 16.4 2.7
45-54 28.6 16.4 22.4 3.7
55-64 44.5 31.7 38.1 6.2
65-74 74.1 53.4 63.4 10.4
75-84 101.9 77.9 88 14.4
85+ 127.4 71.5 89.1 14.6
ntSCI Studies
Author, year published Country Observati on Period Incidence of ntSCI
Kurtzke, 1975 USA 1969-1972 80
Minaire, 1978 France 1970-1975 6.6
Murray, 1984 USA Not specifi ed, 3 yrs 51.9
Biering-Sorensen, 1990 Denmark 1975-1984 8.3
Garcia-Reneses, 1991 Spain 1984-1985 5.1
Schonherr, 1996 Netherlands 1982-1993 8.3
Maharaj, 1996 Fiji 1985-1994 8.7
Caldana, 1998 Italy 1994-1995 42.7
New, 2006 Australia 2005 26
New, Unpublished Australia (Victoria) 1995-1997 17
New, Unpublished Australia 2005 19

U R B A N F U T U R E S SS tt rr aa tt ee gg ii cc RR ee ss ee aa rr cc hh tt oo MM aa nn aa gg ee CC hh aa nn gg ee
P a g e 3 2December 2010The Inc idence and Prevalence of Spinal Cord In jury in Canada
6. New et al. A populati on-based study comparing traumati c spinal cord injury and non-traumati c spinal cord injury using nati onal rehabilitati on database, 2010
Objecti ve: To compare the demographic characteristi cs and outcomes between ntSCI and tSCI pati ents in Australia between 1 January 2002 and 31 December 2006. Method: An open cohort populati on-based study using a nati onal database of in-pati ent rehabilitati on admissions. Results: Total of 3610 pati ents indenti fi ed. There were more pati ents admitt ed with ntSCI than with tSCI. Compared to tSCI pati ents, ntSCI pati ents tended to be older, more likely to be female, have a shorter rehabilitati on LOS, and be less disabled on admission.
Defi niti on of traumati c SCI:Inclusion: Australasian Rehabilitati on Outcome Centre (AROC) impairment classifi cati on codes for tSCI and ntSCI. Exclusion: If admitt ed for less than 7 days, only for assessment or were a re-admission.
Defi niti on of non-traumati c SCI:Inclusion: AROC impairment classifi cati on codes for tSCI and ntSCI. Exclusion: as above
Incidence rates: N/AMale-female rati o: N/APrevalence rates: N/A Life expectancy: N/ADemographic Characteristi cs of tSCI and ntSCI:
7. Wyndaele and Wyndaele. Incidence, prevalence and epidemiology of spinal cord injury: what learns a worldwide literature survey?, 2006
Objecti ve: The objecti ve was to present an overview of data on incidence, prevalence, and epidemiology of SCI and a study of their evoluti on since 1977. Method: Literature survey from 1995 onwards, searched on Pubmed, an online digital archive of biomedical and life sciences journals. Three older studies were included for evoluti onary data. Results: Incidence and prevalence had not changed considerably over the past 30 years. A higher percentage of pati ents with SCI are tetraplegic and a higher percentage of SCI pati ents have a complete lesion.
Defi niti on of traumati c SCI:Inclusion: No specifi cs on classifi cati on, however, in order to make comparison with prevalence esti mates, only incidence studies based on a post-injury acute care and on a rehabilitati on populati on were included. Exclusion: SCI cases that died before hospitalizati on
Defi niti on of non-traumati c SCI: N/A
Incidence rates: 21 to 254 per millionMale-female rati o: 3.8:1Prevalence rates: Range 223-755 per million inhabitants (data insuffi cient, not representati ve globally)
tSCI & ntSCI by Gender
ntSCI tSCI
Male 1,179 (52.5%) 976 (71.6%)
Female 1,067 (47.5%) 388 (28.4%)
Total 2,246 (62.1%) 1,364 (37.7%)
Median age 67 46

U R B A N F U T U R E S SS tt rr aa tt ee gg ii cc RR ee ss ee aa rr cc hh tt oo MM aa nn aa gg ee CC hh aa nn gg ee
P a g e 3 3December 2010The Inc idence and Prevalence of Spinal Cord In jury in Canada
Life expectancy: Median survival ti me of pati ents with tSCI between ages 24 and 35: 38 years post-injury; 43 percent surviving at least 40 yearsEsti mated years of life left post-injury at 40 years of age: Paraplegia 28.3; low tetraplegia 24.4; high tetraplegia (as reported by NSCISC) 21.5.
Incidence Rates of SCI in Studies in Various Countries Since 1995:
Evoluti on of Incidence and Prevalence of SCI in North America:
8. Cahill et al. Christopher & Dana Reeve Foundati on Paralysis Study, 2009
Objecti ve: To fi nd the prevalence of paralysis, including spinal cord injury and other causes of paralysis, in the United States. Method: Random-digit dial populati on survey of over 33,000 households with telephones in U.S. Results: Approximately 1.84% of the U.S. populati on reported some form of paralysis, 0.4% of the U.S. populati on reported being paralyzed due to a SCI.
Defi niti on of Paralysis: Paralysis is a central nervous system disorder resulti ng in diffi culty or inability to move the upper or lower extremiti es. For someone to be counted as “paralysed” in this nati onal survey, they had to answer yes to the initi al screening questi on “Do you or does anyone in this household have any diffi culty moving their arms or legs?” and give one of the following causes of the diffi culty:
Spinal Cord Injury, Traumati c Brain Injury, Stroke, Poisoning, Complicati ons from surgery, ALS/Lou Gehrig’s, Guillain Barre Syndrome, Multi ple Sclerosis, Neurofi bromatosis, Epidural infecti on, Chiari malformati on, Syringomyelia, Post-Polio Syndrome, Spinal Muscular Atrophy, Fredrich’s Ataxia, Transverse Myeliti s, Cerebral palsy, or Spina Bifi da.
Evoluti on of Incidence & Prevalence of SCI in North America
Review Incidence Prevalence
Tricot, 1981 43.3 -
Blumer & Quine, 1995 46 681
Wyndaele & Wyndaele, 2006 51 755
Incidence rates of SCI in Studies in Various Countries, 1995-present
StudyObservati on
PeriodCountry
Incidence(per million p/a)
Karamehmetoglu et al, 1995 1992 Istanbul, Turkey 21
Warren et al, 1995 1991-1993 Alaska, USA 83
Shingu et al, 1995 1990-1992 Japan 40.2
Silberstein et al, 1995 1989-1993 Novosibirsk, Russia 29.7
Maharaj, 1996 1985-1994 Fiji Islands 18.7
Chen et al, 1997 1992-1996 Taiwan 18.8
Otom et al, 1997 1988-1993 Jordan 18
Karamehmetoglu et al, 1997 1994 Rural areas, Turkey 16.9
Marti ns et al, 1998 1989-1992 Coimbra, Portugal 254
van Asbeck et al, 2000 1994 The Netherlands 10.4
Karacan et al, 2000 1992 Turkey 12.7
Surkin et al, 2000 1992-1994 Mississippi, USA 59
Burke et al, 2001 Kentucky, Indiana, USA 27.1
O'Connor, 2002 1998-1999 Australia 14.5
Pickett et al, 2003 1994-1999 Ontario, Canada 37.2-46.2
Dryden et al, 2003 1997-2000 Alberta, Canada 44.3
Albert et al, 2005 2000 France 19.4

U R B A N F U T U R E S SS tt rr aa tt ee gg ii cc RR ee ss ee aa rr cc hh tt oo MM aa nn aa gg ee CC hh aa nn gg ee
P a g e 3 4December 2010The Inc idence and Prevalence of Spinal Cord In jury in Canada
Incidence rates: N/A Life expectancy: N/AMale-female rati o: N/APrevalence rates: 1.84% of U.S. with paralysis, 0.4% of U.S. with paralysis as a result of SCIGender distributi on of Respondents reporti ng paralysis due to SCI: 61 percent male; 39 percent female
Reported causes of SCI by respondents reporti ng paralysis due to SCI:
This distributi on clearly indicates a strong bias towards traumati c spinal cord injury, with 82 percent of causes being clearly traumati c and only 3 percent being clearly non-traumati c (birth defects). The structuring of the questi on, where spinal cord injury was presented as an alternati ve to other sources of injury (such as transverse myeliti s, multi ple sclerosis, chiari malformati on, cerebral palsy, ALS/Lou Gehrig’s, neurofi bromatosis, syringomyelia, Fredrich’s Ataxia, or spina bifi da) which can be a cause of spinal cord injury, is the likely cause of this skewed response.
Age Distributi on of respondents reporti ng paralysis due to SCI:
Age Distributi on of thoseReporti ng Paralysis due to SCI
Age (years)% of
Respondents
0-19 1
20-29 12
30-39 11.5
40-49 30.1
50-59 24.9
60-69 11.1
70-79 5.7
80+ 3.7
Reported Causes of SCI by thoseReporti ng Paralysis due to SCI
Causes of SCI% of
Respondents
MVA 24
Accident Working 28
Fall 9
Sporti ng/Recreati on Accident 16
Victi m of Violence 4
Birth Defect 3
Natural Disaster 1
Other 6
Unknown/No response 9

U R B A N F U T U R E S SS tt rr aa tt ee gg ii cc RR ee ss ee aa rr cc hh tt oo MM aa nn aa gg ee CC hh aa nn gg ee
P a g e 3 5December 2010The Inc idence and Prevalence of Spinal Cord In jury in Canada
Appendix II: Comparison of ICD Codes Used In SCI Research
A table of the ICD-Codes used in published studies reviewed in Appendix II, and other selected sources, is presented in Table A.II-1. As a general commentary on this tabulati on, it was noted that every study had diff erent inclusion and exclusion criteria using ICD-9 or ICD-10 codes. The ICD-10 codes are more specifi c in describing the level and severity of injury, therefore providing more informati on than the ICD-9 codes.
There is general agreement on the codes used in the inclusion criteria for tSCI, although diff erences across the studies remain. ICD-9 codes most commonly used were 806.x and 952.x for all studies that used ICD-9 codes. The common ICD-10 codes were: injury to the cervical spinal cord: S14.0, S14.1; thoracic: S24.0, S24.1; lumbar: S34.0, S34.1; other: T06.0, T06.1). Lacerati on of cauda equina (S34.30) was included in three of the four studies that addressed ICD-10 codes.
In this review, only one study (New & Sundararajan) presented ICD codes for non-traumati c SCI, hence no conclusions could be drawn. The lack of agreement in the ICD codes for tSCI, and the absence of studies of ntSCI, calls strongly for discussion in the SCI research community to address the limitati on these have on preparati on of comparable research and to develop a code standard.
Table A.II-1: Inclusion and Exclusion Criteria for tSCI and ntSCI from Multi ple Sources
Study traumati c SCI non-traumati c SCICahill et al, 2009 N/A N/A
Couris et al, 2010 Inclusion: ICD-10-CA Codes (Cervical spinal cord: S14.0, S14.10, S14.11, S14.12, S14.13, S14.18, S14.19; Thoracic spinal cord: S24.0, S24.10, S24.11, S24.12, S24.13, S24.18, S24.19; Lumbar spinal cord: S34.0, S34.10, S4.11, S34.12, S34.13, S34.18, S34.19; Other spinal cord injury: S34.30, S34.38, T06.0, T06.1) (obtained from Rick Hansen Foundati on)
Exclusion: Invalid value for gender, less than 18 years of age at ti me of admission, previous hospital stay for SCI within past year, SCI not most responsible diagnosis
N/A
Dryden et al, 2003 Inclusion: ICD, 9th revision, Clinical Modifi cati on diagnosti c codes: 806.x (fracture of the vertebral column with SCI) or 952.x (SCI without evidence of spinal bone injury). Injuries of cauda equina were included. Cases were included if they had an external cause of injury code (E code) consistent with tSCI, and were admitt ed for at least one day to a trauma centre in Alberta.
Exclusion: Diagnosis of a “conversion” disorder (ICD-9-CM code 300.11)
N/A

U R B A N F U T U R E S SS tt rr aa tt ee gg ii cc RR ee ss ee aa rr cc hh tt oo MM aa nn aa gg ee CC hh aa nn gg ee
P a g e 3 6December 2010The Inc idence and Prevalence of Spinal Cord In jury in Canada
Jaglal et al, 2009 Inclusion: ICD-10 diagnosti c codes: injury to cervical spinal cord (S14.0, S14.10, S14.11, S14.12, S14.13, S14.18, S14.19), injury to the thoracic spinal cord (S24.0, S24.10, S24.11, S24.12, S24.13, S24.18, S24.19), injury to lumbar spinal cord (S34.0, S34.10, S34.11, S34.12, S34.13, S34.18, S34.19), other SCI S34.30 (lacerati on of cauda equina), T06.0 (injuries of brain and cranial nerves with injuries of nerves and spinal cord at neck level) and T06.1 (injuries of nerves and spinal cord involving other multi ple body regions).
N/A
New et al, 2010 Inclusion: Australasian Rehabilitati on Outcome Centre (AROC) uses separate impairment classifi cati on codes for tSCI and ntSCI.
Exclusion: If admitt ed for less than 7 days, only for assessment or were a readmission.
Inclusion: Australasian Rehabilitati on Outcome Centre (AROC) uses separate impairment classifi cati on codes for tSCI and ntSCI.
Exclusion: If admitt ed for less than 7 days, only for assessment or were a readmission.

U R B A N F U T U R E S SS tt rr aa tt ee gg ii cc RR ee ss ee aa rr cc hh tt oo MM aa nn aa gg ee CC hh aa nn gg ee
P a g e 3 7December 2010The Inc idence and Prevalence of Spinal Cord In jury in Canada
New & Sundararajan, 2008
N/A Inclusion: A new onset of ntSCI or who developed ntSCI aft er hospitalizati on. ICD-10-AM codes: acute paraplegia (G8201, G8203, G8205, G8211, G8213, G8215, G8221, G8223, G8225); acute tetraplegia (G8231, G8233, G8235, G8241, G8243, G8245, G8251, G8253, G8255) or cauda equina syndrome (G834). Pati ents with cauda equina syndrome and C prefi x (occurred during course of hospitalizati on) were included. If the P prefi x (conditi ons were present on admission to hospital and underwent evaluati on and treatment) was used, only those pati ents with the cauda equina SCI listed as the fi rst of the presenti ng diagnoses were included.
Exclusion: For identi fi ed cases, if a previous admission that included an SCI was found, the following cases were excluded: ICD-10-AM exclude codes 2000-2006: T91; 1998-2000: G82, G83, S140, S141, S240, S241, S340, S341, S343; ICD-9-AM exclude codes 1996-1998: 336, 340, 341, 344, 440, 441, 806, 952, 953, 013.4, 013.5, 192.2, 192.3 198.3, 198.4, 225.3, 225.4, 324.1, 721.1, 721.4, 722.7, 907.2, 907.3, 721.91). Pati ents with congenital conditi ons causing ntSCI, or pati ents with motor neurone disease or multi ple sclerosis were excluded. Non-Victorian residents and immigrants and residents moving from other states of Australia or overseas aft er ntSCI were excluded.
Pickett et al, 2006 Inclusion: ICD-9, Clinical Modifi cati on diagnosti c codes 952.x (SCI without evidence of spinal bone injury) and 806.x (fracture of vertebral column with SCI).
Exclusion: spine fracture without SCI, SCI unrelated to trauma (tumour, vascular lesion, iatrogenic injury), neurologic defi cit cause by peripheral nerve lesion.
N/A

U R B A N F U T U R E S SS tt rr aa tt ee gg ii cc RR ee ss ee aa rr cc hh tt oo MM aa nn aa gg ee CC hh aa nn gg ee
P a g e 3 8December 2010The Inc idence and Prevalence of Spinal Cord In jury in Canada
Wyndaele & Wyndaele, 2006
Inclusion: No specifi cs on classifi cati on, however, in order to make comparison with prevalence esti mates, only incidence studies based on a post-injury acute care and on a rehabilitati on populati on were included.
Exclusion: SCI cases that died before hospitalizati on
N/A
Codes used for ACT (Access to Care/Timing) request to Nati onal Trauma Registry
Inclusion: ICD-9: cervical spinal cord injury (806.0, 806.1, 952.0); thoracic spinal cord injury (806.2, 806.3, 952.1); lumbar spinal cord injury (806.4, 806.5, 952.2, 952.3); cauda equina spinal cord injury (952.4)ICD-10: cervical spinal cord injury (S14.0, S14.1); thoracic spinal cord injury (S24.0, S24.1); lumbar spinal cord injury (S34.0, S34.1); cauda equina spinal cord injury (S34.30, S34.38)Other/unspecifi ed: T06.0, T06.1
N/A
Public Health Agency of Canada codes provided to Stati sti cs Canada
Inclusion: ICD-9: 805-809, 952ICD-10: S12-S12.7, S12.9, S14.0, S14.1, S22.0, S22.1, S24, S24.1, S32.0-32.2, S34, S34.1, T06.0, T06.1, T08, T09.3
N/A

U R B A N F U T U R E S SS tt rr aa tt ee gg ii cc RR ee ss ee aa rr cc hh tt oo MM aa nn aa gg ee CC hh aa nn gg ee
P a g e 3 9December 2010The Inc idence and Prevalence of Spinal Cord In jury in Canada
Appendix III: Preliminary Estimates of Prevalence of Spinal Cord Injury in Canada Using Published Incidence Rates
A. Preliminary Esti mates of Prevalence of tSCI in Canada
A simple preliminary esti mate of prevalence of a conditi on in one populati on can be calculated by using the incidence rate and the durati on of the conditi on for another populati on. In this secti on this approach is employed to esti mate the prevalence of tSCI using published incidence rates for tSCI and life expectancies for people living with SCI. These examples are presented starti ng with the simplest applicati on, considering published crude rates, followed by more complex examples using age and gender specifi c rates. The purpose of including these calculati ons in this report is to demonstrate what the extent of SCI in Canada would be if the rates that prevail elsewhere prevailed here: what they also demonstrate is that, in aggregate, use of the published rates provides such a wide range of possibiliti es as to be of litt le value in the Canadian context. The same analysis is repeated for ntSCI in Secti on B of this Appendix.
1. Wyndaele & Wyndaele, 2006
Wyndaele and Wyndaele published a summary of crude incidence rates (rates per million populati on) from a number of studies done in diff erent countries from 1985 on that have been published since 1995: these are listed in order of increasing incidence rates on Table III-3. These incidence rates were multi plied by Stati sti cs Canada’s current esti mate of the populati on of Canada of 33,739,000 to esti mate what the annual number of new cases of tSCI would be if the published rates applied in Canada: the result was a range from a low of 351 cases per year to a high of 2,800. The study also presented an esti mate of years of life left aft er injury of 38 years which was in turn applied to the calculated incidence to esti mate the corresponding level of prevalence, which resulted in a range from 13,334 to 106,416 persons living with spinal cord injury in Canada today.
Prevalence of tSCI Using Incidence Rates from Selected Studies
Country Incidence(per million p/a)
Implied Annual New Cases
Implied CanadianPrevalence
The Netherlands 10.4 351 13,334
Turkey 12.7 428 16,283
Australia 14.5 489 18,591
Rural areas, Turkey 16.9 570 21,668
Jordan 18 607 23,078
Fiji Islands 18.7 631 23,976
Taiwan 18.8 634 24,104
France 19.4 655 24,873
Istanbul, Turkey 21 709 26,924
Coimbra, Portugal 25.4 857 32,566
Kentucky, Indiana, USA 27.1 914 34,745
Novosibirsk, Russia 29.7 1,002 38,079
Ontario, Canada (Range lower limit) 37.2 1,255 47,695
Japan 40.2 1,356 51,541
Alberta, Canada 44.3 1,495 56,798
Ontario, Canada (Range upper limit) 46.2 1,559 59,234
Mississippi, USA 59 1,991 75,645
Alaska, USA 83 2,800 106,416

U R B A N F U T U R E S SS tt rr aa tt ee gg ii cc RR ee ss ee aa rr cc hh tt oo MM aa nn aa gg ee CC hh aa nn gg ee
P a g e 4 0December 2010The Inc idence and Prevalence of Spinal Cord In jury in Canada
Wyndaele and Wyndaele also present two post 1985 studies that provide direct esti mates of prevalence (in contrast to those derived from incidence rates). The two prevalence esti mates were for North America for the years 1995 (681 cases of tSCI per million inhabitants) and 2006 (755 per million). Applying these prevalence esti mates to Canada’s esti mated populati on in 2010 results in esti mated prevalence of 22,976 and 25,473 persons, respecti vely.
Accompanying these prevalence esti mates were corresponding incidence rates from the same studies, which when multi plied by Canada’s populati on and scaled by remaining years of life provided incidence based esti mates of prevalence of 62,080 and 68,828 new cases per year that were signifi cantly higher than those based on the corresponding directly measured prevalence rates (22,976 and 25,473, respecti vely).
The variability of incidence and prevalence shown in these studies highlights both the limitati ons of the data and the methodology. On the data side, the study does not specify the inclusion and exclusion criteria used to calculate each incidence rate, omitti ng, in some cases, to even note whether the rate was for tSCI, ntSCI, or both; furthermore, there is no indicati on whether these are initi al or discharge incidence rates. On the methodology side, the underlying demography, economy, and social structure of these countries are all diff erent from that of Canada, clearly limiti ng the applicability of crude rates from one region in studies of incidence and prevalence in another.
2. Couris et al, 2010
Couris et al published gender specifi c tSCI incidence rates for 2003-2006 for Ontario for the populati on aged 18 years of age and older (age specifi c rates were charted but no numerical values were given), and these rates were then applied to Stati sti cs Canada’s esti mated male and female 2010 Canadian populati on aged 18 plus. When scaled by an average of 40 years of life remaining aft er injury (longer than the 38 years of Wyndaele & Wyndaele to refl ect Canada’s longer life expectancies), the result is an esti mated prevalence of 24,816 cases of tSCI.
This esti mate is not without its own limitati ons, as it excludes incidence under the age of 18, is limited to tSCI, and is not specifi ed as to whether it is initi al or discharge incidence.
Esti mated Prevalence of tSCI, 2010
Review Prevalence Rate (per million p/a)
Implied CanadianPrevalence
IncidenceImplied Canadian
Prevalence
Blumer & Quine, 1995 681 22,976 46 62,080
Wyndaele & Wyndaele, 2006 755 25,473 51 68,828
Selected Stati sti cs, tSCI
Male Female
Populati on aged 18+ 12,698,100 13,178,000
Incidence rate 36.3 12.1
Annual new cases of tSCI 461 159
Hypotheti cal average years of life 40 40
left for person with tSCI
Gender-specifi c prevalence 18,438 6,378
Implied Canadian Prevalence 24,816

U R B A N F U T U R E S SS tt rr aa tt ee gg ii cc RR ee ss ee aa rr cc hh tt oo MM aa nn aa gg ee CC hh aa nn gg ee
P a g e 4 1December 2010The Inc idence and Prevalence of Spinal Cord In jury in Canada
3. Pickett et al, 2006
Pickett et al published tSCI rates for southern Ontario at a fi ner level of demography, giving rates for three age groups; 0-14 years (an incidence rate of 3.37 per million in the age group), 15-65 years (41.79), and 65 years and older (50.87). The 2010 populati on of Canada in these three age groups was multi plied by the corresponding incidence rates to produce the esti mated number of annual new cases of tSCI in each age group, resulti ng in a total incidence of 1,237 new cases.
The midpoint of the 0 to 14 age group is 7.5 years of age, and of the 15 to 64 age group is 40 years of age. With an average life expectancy of 80 years, the result is an average of 72.5 and 40 years of life remaining, respecti vely. For the 65 and older age group, assuming that most tSCI occurs between ages 65 and 75, a midpoint of 70 years of age was used, resulti ng in 10 years of life left aft er injury. For each of these age groups, the product of annual cases and years of life left were summed to produce an esti mated 2010 tSCI prevalence of 43,000:
This esti mate of prevalance applies only to tSCI and it is not clear whether the incidence rate is an inti al or a discharge rate.
4. Dryden et al, 2003
Dryden et al published gender specifi c tSCI incidence rates for 1997-2000 for Alberta for standard age groups. These rates were applied to Stati sti cs Canada’s esti mated 2010 male and female Canadian populati ons, aggregated into the appropriate age groups, which resulted in an incidence esti mate of 1,762 annual new cases of tSCI. When scaled by an average of life remaining aft er injury esti mated according to age group, the result was a prevalence of 68,916 persons.
Selected Stati sti cs, tSCI
AgeIncidence
rateAnnual
new cases
Hypotheti cal Avg Years of
Life Post-injury
ImpliedCanadian
Prevalence
0-14 3.4 19 72.5 1,371
15-64 41.8 980 40 39,183
65+ 50.9 238 10 2,385
Total 42,939
Selected Stati sti cs, tSCI
Incidence rate Annual New cases Esti mated Average Yrs of Life Post-Injury
Implied Canadian Prevalence
Age Group Male Female Male Female Male Female Total
0..4 3.8 1.9 4 2 78 282 134 415
5..14 22.0 14.4 43 26 70 2,986 1,846 4,833
15..19 91.0 62.5 105 69 63 6,608 4,328 10,936
20..29 132.1 38.3 314 88 55 17,282 4,826 22,107
30..39 71.8 33.5 165 76 45 7,407 3,427 10,834
40..49 91.0 19.1 241 50 35 8,451 1,756 10,207
50..59 71.8 15.3 171 37 25 4,265 925 5,191
60..69 57.4 24.9 92 42 15 1,385 630 2,015
70+ 94.7 56.2 132 106 10 1,315 1,063 2,378
Total 1,266 496 49,982 18,934 68,916

U R B A N F U T U R E S SS tt rr aa tt ee gg ii cc RR ee ss ee aa rr cc hh tt oo MM aa nn aa gg ee CC hh aa nn gg ee
P a g e 4 2December 2010The Inc idence and Prevalence of Spinal Cord In jury in Canada
This esti mate is limited to tSCI, including deaths before hospital admission and during hospitalizati on, hence the incidence rates need to be adjusted so that only hospital discharge cases of tSCI are included in the prevalence calculati on.
B. Preliminary Esti mates of Prevalence of ntSCI in Canada
1. New & Sundararajan, 2008
New and Sundararajan provided crude incidence rates for both tSCI and ntSCI for Australia for 2000 to 2006. These values permit use of the same methodology used above for values published by Wyndaele and Wyndaele in the esti mati on of prevalence of SCI for Canada. With respect to tSCI, the incidence rates ranged from 11.9 to 17 per million populati on, resulti ng in a prevalence range in Canada from 16,060 to 22,943 persons living with SCI as a result of tSCI:
With respect to ntSCI, the incidence rates were provided for two age groups, 0 to 14 and 15 and older and for both males and females. When multi plied by the number of people in the Canadian populati on in these age and sex groups, total prevalence of 30,261 persons living with ntSCI in Canada was calculated:
This study does not indicate whether these are initi al or discharge incidence rates and is limited to cases of ntSCI.
This publicati on also tabulates the results of a literature review, similar to that found in the Wyndaele & Wyndaele, 2006, for published rates of incidence for ntSCI. These rates were applied to the Canadian populati on and scaled by a presumed 40 years of remaining life expectancy to esti mate the prevalence of ntSCI in Canada should the published rates apply here, resulti ng in a range from 6,883 to 107,967.
Selected Stati sti cs, tSCI
Australia(lower range)
Australia(upper range)
Victoria, Australia
Populati on 33,739,800 33,739,800 33,739,800
Incidence rate 15 17 12
Annual new cases of tSCI 506 574 402
Hypotheti cal average years oflife left for person with tSCI
40 40 40
Prevalence 20,244 22,943 16,060
Selected Stati sti cs, ntSCI
Populati on Male Female
0-14 years 2,880,900 2,730,700
15+ 13,851,400 14,276,800
Incidence rate
0-14 years 0.7 0.7
15+ 30.5 22.9
Annual New
0-14 years 2 2
15+ 422 327
Hypotheti cal average years of life left for persons with SCI
0-14 years 72.5 72.5
15+ 40 40
Implied Cdn Prevalence 17,045 13,216
Total Prevalence 30,261

U R B A N F U T U R E S SS tt rr aa tt ee gg ii cc RR ee ss ee aa rr cc hh tt oo MM aa nn aa gg ee CC hh aa nn gg ee
P a g e 4 3December 2010The Inc idence and Prevalence of Spinal Cord In jury in Canada
As with Wyndaele and Wyndaele, this 2006 publicati on does not indicate whether the incidence rates are initi al or discharge, nor what is included in ntSCI in each of the underlying studies. The range of prevalence esti mates that result from these calculati ons is largely the product of data diff erences and underlying diff erences in demography, economy, social structure, and health care in the countries studied.
C. Preliminary Esti mates of Prevalence of SCI in Canada - Cahill et al, 2009
Cahill et al provide an esti mate of prevalence of spinal cord injury in the United States of 0.4 percent of the populati on; given Canada’s esti mated 2010 populati on, such a prevalence rate would result in a prevalence esti mate of 134,959 persons with spinal cord injury living in Canada. In this study, what is included as spinal cord injury is primarily the result of traumati c injury, with 82 percent of the causes of spinal cord injury specifi cally identi fi ed as traumati c, three percent from birth injury (and hence non-traumati c), and 15 percent from other and unknown causes.
Selected Stati sti cs, ntSCI
CountryIncidenceof ntSCI
AnnualNew Cases
ImpliedCanadian
Prevalence
Spain 5.1 172 6,883
France 6.6 223 8,907
Denmark 8.3 280 11,202
Netherlands 8.3 280 11,202
Fiji 8.7 294 11,741
Australia (Victoria) 17 574 22,943
Australia 19 641 25,642
Australia 26 877 35,089
Italy 42.7 1,441 57,628
USA 51.9 1,751 70,044
USA 80 2,699 107,967

U R B A N F U T U R E S SS tt rr aa tt ee gg ii cc RR ee ss ee aa rr cc hh tt oo MM aa nn aa gg ee CC hh aa nn gg ee
P a g e 4 4December 2010The Inc idence and Prevalence of Spinal Cord In jury in Canada
Appendix IV: Age specific estimates of incidence and prevalence of spinal cord injury in Canada, 2010
This appendix presents the detailed results of the calculati ons of the esti mates of incidence and prevalence following the methodology described in Secti on IV of this report.
Total Populati on, Canada, 2010
Age Male Female Total
0..4 952,454 905,954 1,858,408
5..9 926,149 873,002 1,799,151
10..14 993,572 944,098 1,937,671
15..19 1,125,036 1,076,326 2,201,362
20..24 1,184,776 1,131,400 2,316,176
25..29 1,204,094 1,170,958 2,375,052
30..34 1,148,825 1,144,085 2,292,910
35..39 1,154,231 1,138,513 2,292,744
40..44 1,222,287 1,198,868 2,421,155
45..49 1,404,910 1,384,959 2,789,869
50..54 1,305,819 1,311,470 2,617,289
55..59 1,129,037 1,160,225 2,289,262
60..64 965,953 1,004,079 1,970,032
65..69 714,031 758,170 1,472,200
70..74 522,597 587,678 1,110,274
75..79 413,813 502,637 916,450
80..84 285,194 406,630 691,823
85..89 150,999 279,886 430,885
90+ 169,478 159,125 328,603
Total 16,973,254 17,138,063 34,111,316
Esti mated Age- and Gender-specifi c Incidence Rates of tSCI & ntSCI, Canada, 2010
AgetSCI Initi al ntSCI Initi al tSCI Discharge ntSCI Discharge
Male Female Male Female Female Female Male Female
0..4 3.8 1.9 2.1 2.1 3.0 1.5 2.0 2.0
5..9 22 14.4 2.1 2.1 17.1 11.2 2.0 2.0
10..14 22 14.4 2.1 2.1 17.1 11.2 2.0 2.0
15..19 91 62.5 25.0 12.2 70.8 48.6 23.1 11.3
20..24 132.1 38.3 25.0 12.2 102.8 29.8 23.1 11.3
25..29 132.1 38.3 29.6 24.7 102.8 29.8 27.3 22.8
30..34 71.8 33.5 29.6 24.7 55.9 26.1 27.3 22.8
35..39 71.8 33.5 59.4 40.5 55.9 26.1 54.9 37.4
40..44 91 19.2 59.4 40.5 70.8 14.9 54.9 37.4
45..49 91 19.2 87.1 50.0 70.8 14.9 80.5 46.2
50..54 71.8 15.3 87.1 50.0 55.9 11.9 80.5 46.2
55..59 71.8 15.3 135.6 96.6 55.9 11.9 125.3 89.2
60..64 57.4 24.9 135.6 96.6 44.7 19.4 125.3 89.2
65..69 57.4 24.9 225.8 162.7 44.7 19.4 208.6 150.3
70..74 94.7 56.2 225.8 162.7 73.7 43.7 208.6 150.3
75..79 94.7 56.2 310.5 237.3 73.7 43.7 286.9 219.3
80..84 94.7 56.2 310.5 237.3 73.7 43.7 286.9 219.3
85..89 94.7 56.2 388.1 217.8 73.7 43.7 358.6 201.3
90+ 94.7 56.2 388.1 217.8 73.7 43.7 358.6 201.3*based on Dryden *based on New’s rati o

U R B A N F U T U R E S SS tt rr aa tt ee gg ii cc RR ee ss ee aa rr cc hh tt oo MM aa nn aa gg ee CC hh aa nn gg ee
P a g e 4 5December 2010The Inc idence and Prevalence of Spinal Cord In jury in Canada
Esti mated Age- and Severity-Specifi c Prevalence of SCI in Canada, 2010
AgetSCI ntSCI Total
Para Tetra Total Para Tetra Total Para Tetra Total
0..4 5 7 12 7 3 11 13 10 23
5..9 41 54 95 19 8 27 60 62 123
10..14 102 134 236 33 15 48 135 149 284
15..19 310 406 716 121 54 175 431 460 891
20..24 616 806 1,422 253 113 366 869 919 1,788
25..29 778 1,019 1,797 359 160 519 1,138 1,179 2,317
30..34 1,257 1,646 2,903 643 286 929 1,900 1,932 3,832
35..39 1,271 1,663 2,935 858 382 1,240 2,130 2,045 4,175
40..44 1,542 2,016 3,559 1,273 566 1,839 2,815 2,583 5,398
45..49 2,051 2,679 4,731 2,011 894 2,905 4,062 3,573 7,635
50..54 2,148 2,802 4,950 2,463 1,094 3,557 4,611 3,896 8,507
55..59 2,040 2,656 4,696 2,851 1,265 4,116 4,891 3,920 8,812
60..64 1,879 2,437 4,316 3,191 1,412 4,603 5,070 3,849 8,920
65..69 1,482 1,909 3,390 3,128 1,379 4,506 4,609 3,287 7,897
70..74 1,208 1,537 2,745 3,053 1,335 4,388 4,261 2,873 7,134
75..79 933 1,165 2,097 2,842 1,227 4,070 3,775 2,392 6,167
80..84 941 1,127 2,068 3,175 1,329 4,504 4,116 2,456 6,572
85..89 447 500 947 1,842 730 2,572 2,289 1,230 3,519
90+ 179 179 357 887 319 1,206 1,066 497 1,563
Total 19,232 24,742 43,974 29,011 12,571 41,582 48,243 37,313 85,556
Esti mated Age-, Gender-, Severity-specifi c Incidence of tSCI and ntSCI, Canada, 2010*
AgetSCI Initi al ntSCI Initi al tSCI Discharge ntSCI Discharge
Male Female Male Female Paraplegia Tetraplegia Parapelegia Tetraplegia
0..4 4 2 2 2 2 2 3 1
5..9 20 13 2 2 11 15 2 1
10..14 22 14 2 2 12 16 3 1
15..19 102 67 28 13 57 75 26 12
20..24 157 43 30 14 67 88 28 12
25..29 159 45 36 29 69 90 41 18
30..34 82 38 34 28 41 53 40 18
35..39 83 38 69 46 41 53 73 33
40..44 111 23 73 49 45 59 77 34
45..49 128 27 122 69 52 68 123 55
50..54 94 20 114 66 38 50 115 51
55..59 81 18 153 112 33 44 170 75
60..64 55 25 131 97 27 35 146 65
65..69 41 19 161 123 20 26 182 81
70..74 49 33 118 96 28 36 137 61
75..79 39 28 128 119 23 30 158 71
80..84 27 23 89 97 17 22 118 53
85..89 14 16 59 61 10 13 76 34
90+ 16 9 66 35 8 11 64 29
Total 1,284 501 1,415 1,059 601 787 1,582 704
*Data may not sum to totals due to rounding.

U R B A N F U T U R E S SS tt rr aa tt ee gg ii cc RR ee ss ee aa rr cc hh tt oo MM aa nn aa gg ee CC hh aa nn gg ee
P a g e 4 6December 2010The Inc idence and Prevalence of Spinal Cord In jury in Canada
Appendix V: Projection of incidence and prevalence of spinal cord injury in Canada, 2010 to 2030
Urban Futures maintains a projecti on series for the Canadian populati on by single years of age and sex, as well as for their accompanying projected birth and death rates for the period 2010 to 2060. The data on the incidence and characteristi cs of SCI and the methodology used to esti mate the 2010 prevalence of spinal cord injury in Canada was used with this projecti on series to esti mate the future level of incidence and prevalence of spinal cord injury in Canada. These esti mates of future levels are subject to the same assumpti ons that are described for the 2010 esti mates. Given the constancy of the spinal cord rates used, the changing extent of spinal cord injury shown in these projecti ons is the result of the changes in the underlying demography of Canada.
Both incidence and prevalence of SCI is projected to increase over the next two decades, with initi al incidence increasing from the 4,300 cases esti mated for 2010 to 5,800 cases in 2030; discharge incidence increasing from the 3,700 cases esti mated for 2010 to 5,000 in 2010; and prevalence increasing from the esti mated 86,000 persons living with SCI in 2010 to 121,000 persons in 2030. The greatest increase would be in the number of people with SCI as a result of ntSCI (posti ng an increase of 52 percent), and in the number with tetraplegia (an increase of 43 percent). The number of people living with SCI as a result of traumati c causes would increase to the 58,000 range (a 32 percent increase) while those with SCI as a result of non-traumati c causes would increase to the 63,000 range (a 52 percent increase).
This patt ern is largely the result of the aging of the Canadian populati on that will result over the coming two decades, something that will be refl ected in the age profi le of the populati on living with SCI (Figure V-2). Today 49 percent of people living with spinal cord injury are 60 years of age or older; by 2030, given aging of the populati on as a whole, the secondary peak in tSCI due to falls in the older populati on, and the general increasing rate of ntSCI with increasing age, over 63 percent of the people living with spinal cord injury will be 60 years of age and older.
85,556
120,998
3,675
5,003
0
20,000
40,000
60,000
80,000
100,000
120,000
140,000
2010
2011
2012
2013
2014
2015
2016
2017
2018
2019
2020
2021
2022
2023
2024
2025
2026
2027
2028
2029
2030
0
2,000
4,000
6,000
8,000
10,000
12,000
14,000
Estimated Incidence & Prevalence of SCI, Canada, 2010 to 2030(Dryden, 2003)
Discharge Incidence(number of new SCI cases annually)
Prevalence(number persons living with SCI)
Figure V-1

U R B A N F U T U R E S SS tt rr aa tt ee gg ii cc RR ee ss ee aa rr cc hh tt oo MM aa nn aa gg ee CC hh aa nn gg ee
P a g e 4 7December 2010The Inc idence and Prevalence of Spinal Cord In jury in Canada
0
2,000
4,000
6,000
8,000
10,000
12,000
14,000
16,000
0..4
5..9
10..1
4
15..1
9
20..2
4
25..2
9
30..3
4
35..3
9
40..4
4
45..4
9
50..5
4
55..5
9
60..6
4
65..6
9
70..7
4
75..7
9
80..8
4
85..8
9
90+
Estimated Age-Specific Prevalence of SCI, Canada, 2010 & 2030
2030 Prevalence
2010 Prevalence
Case
s
Age
Figure V-2

U R B A N F U T U R E S SS tt rr aa tt ee gg ii cc RR ee ss ee aa rr cc hh tt oo MM aa nn aa gg ee CC hh aa nn gg ee
P a g e 4 8December 2010The Inc idence and Prevalence of Spinal Cord In jury in Canada
References
1. Ackery A, Tator C, Krassioukov A. A global perspecti ve on spinal cord injury epidemiology. J Neurotrauma 2004; 21: 1355-1370.
2. Berkowitz M, O’Leary PK, Kruse DL, Harvey C. Spinal Cord Injury: An Analysis of Medical and Social Costs. New York: Demos Medical Publishing Inc., 1998.
3. Blackwell TL, Krause JS, Winkler T, Sti ens SA. Spinal Cord Injury Desk Reference: Guidelines for Life Care Planning and Case Management. New York: Demos Medical Publishing Inc., 2001.
4. Cahill A, Fredine H, Zilberman L. Initi al Briefi ng: Prevalence of Paralysis Including Spinal Cord Injuries in the United States, 2008.
5. Catz, A Thaleisnik M, Fishel B, Ronen J, Spasser R, Fredman B, Shabtay E, Gebstein R. Survivalfollowing spinal cord injury in Israel. Spinal Cord 2002; 40: 595-598.
6. Cosar SN, Yemisci OU, Oztop P, Ceti n N, Sarifakioglu B, Yalbuzdag SA, Ustaomer K, Karatas M.Demographic characteristi cs aft er traumati c and non-traumati c spinal cord injury: a retrospecti vecomparison study. Spinal Cord 2010; 48: 862-866.
7. Couris CM, Guilcher SJT, Munce SEP, Fung K, Craven BC, Verrier M, Jaglal SB. Characteristi cs of adultswith incident traumati c spinal cord injury in Ontario, Canada. Spinal Cord 2010; 48: 39-44.
8. Dryden DM, Saunders LD, Rowe BH, May LA, Yiannakoulias N, Svenson LW, Schopfl ocher DP, Voaklander DC. The Epidemiology of Traumati c Spinal Cord Injury in Alberta, Canada. Can J Neurol Sci 2003; 30: 113-121.
9. Guilcher SJT, Munce SEP, Couris CM, Fung K, Craven BC, Verrier M, Jaglal SB. Health care uti lizati on innon-traumati c and traumati c spinal cord injury: a populati on-based study. Spinal Cord 2010; 48: 45-50.
10. Jaglal SB, Munce SEP, Guilcher SJ, Couris CM, Fung K, Craven BC, Verrier M. Health system factorsassociated with rehospitalizati ons aft er traumati c spinal cord injury: a populati on-based study. Spinal Cord 2009; 47: 604-609.
11. Kirshblum S, Campagnolo D, DeLisa J (eds.). Spinal Cord Medicine. Philadelphia: Lippincott Williams & Wilkins, 2002.
12. Krueger H. The Economic Burden of Spinal Cord Injury: A Literature Review and Analysis. H. Krueger & Associates Inc., 2010.
13. Lin VW (ed.). Spinal Cord Medicine: Principles and Practi ces. Demos Medical Publishing Inc.,2003.
14. New PW, Simmonds F, Stevermuer T. A populati on-based study comparing traumati c spinal cord injury and non-traumati c spinal cord injury using a nati onal rehabilitati on database. Spinal Cord 2010; Jul 6 (epub ahead of print).
15. New PW, Sundararajan V. Incidence of non-traumati c spinal cord injury in Victoria, Australia: apopulati on-based study and literature review. Spinal Cord 2008; 46: 406-411.

U R B A N F U T U R E S SS tt rr aa tt ee gg ii cc RR ee ss ee aa rr cc hh tt oo MM aa nn aa gg ee CC hh aa nn gg ee
P a g e 4 9December 2010The Inc idence and Prevalence of Spinal Cord In jury in Canada
16. Pickett GE, Campos-Benitez M, Keller JL, Duggal N. Epidemiology of traumati c spinal cord injury inCanada. Spine 2006; 31: 799-805.
17. Ronen J, Goldin D, Bluvshtein V, Fishel B, Gelernter I, Catz A. Survival aft er nontraumati c spinalcord lesions in Israel. Arch Phys Med Rehabil 2004; 85: 1499-1502.
18. Scivolett o G, Frachi S, Laurenza L, Molinari M. Traumati c and non-traumati c spinal cord lesions: anItalian comparison of neurological and functi onal outcomes. Spinal Cord 2010; Jul 6 (epub ahead of print).
19. Wyndaele M, Wyndaele JJ. Incidence, prevalence and epidemiology of spinal cord injury: what learns a worldwide literature survey? Spinal Cord 2006; 44: 523-529.