The Incidence and Impacts of Student Transiency in...
13
Journal of Research in Rural Education, 2005, 20(15) The Incidence and Impacts of Student Transiency in Upstate New Yorkʼs Rural School Districts Kai A. Schafft The Pennsylvania State University This article is one of several in a special collection for which Lionel J. Beaulieu and Robert M. Gibbs served as guest editors (http://www.umaine.edu/jrre/20-12.pdf). Earlier versions of these articles were presented at the 2003 conference, “Promoting the Economic and Social vitality of Rural America: The Role of Education,” which was sponsored by the Southern Rural Develop- ment Center, the Economic Research Service of the USDA, and the Rural School and Community Trust. Support for this research was provided in part by the Office of University Partnerships, U.S. Department of Housing and Urban Development (HUD). Correspondence concerning this article should be addressed to Kai A. Schafft, Department of Education Policy Studies, The Pennsylvania State University, 204B Rackley Building, University Park, PA 16802-3200. ([email protected]) Citation: Schafft, K. A. (2005, December 22). The incidence and impacts of student transiency in upstate New York’s rural school districts. Journal of Research in Rural Education, 20(15). Retrieved [date] from http://jrre.psu.edu/articles/20-15.pdf Chronic student mobility, and in particular the mobility of students from low-income backgrounds, poses a serious yet un- derdocumented problem for rural schools. This article combines analyses of state-level school district data with survey and interview data to examine the patterns of low-income student mobility in upstate New York, and to assess the impacts on, and responses by, schools and other community institutions. The incidence and effects of student mobility are particularly pronounced in smaller, limited-resource districts. School district administrators report significant negative consequences due to the fiscal and administrative costs associated with high-need, highly mobile students. Student transiency not only requires extra administrative resources from teachers, guidance counselors, and other school staff, but the unpredictability of the movement vastly complicates planning and budgeting processes. Results portray a significant, high-need segment of the upstate New York population that is largely unrecognized, untargeted, and both socially and academically at risk. Most residential mobility is popularly understood as being both voluntary and largely opportunity-related. That is, people choose to move in order to obtain more desirable or lucrative employment, to improve their quality of life, to enter a better school district, or in some other way take advantage of perceived greater opportunities at migration destinations. Hence, mobility is often understood as an investment in one’s human capital, and according to this understanding, people tend to move to areas where the high- est “return” on their investment may be realized (Lichter & Costanzo, 1987). However, residential movement and one of its consequences—student transiency—is largely unplanned and unpredictable. Instead of yielding greater opportunity, residential mobility associated with student transiency is both symptomatic of and a causal factor in household inse- curity and broader community economic disadvantage. While there is a growing literature associated with student transiency, this research has tended to focus on transiency within urban settings (Alexander, Entwisle, & Dauber, 1996; Bruno & Isken, 1996; Conniff, 1998; Ker- bow, Azcoitia, & Buell, 2003; Lash & Kirkpatrick, 1990) or the relationship between student transiency and academic underachievement (Pribesh & Downey, 1999; Rumberger, Larson, Ream, & Palardy, 1999; Swanson & Schneider, 1999; Tucker, Marx, & Long, 1998; Wood, Halfon, Scarlata, Newacheck, & Nessim, 1993). In contrast, my focus primar- ily is on nonmetro schools and school districts. In so doing, I emphasize that chronic mobility of low-income students is not simply an urban phenomenon. Second, instead of exploring the connection between transiency and academic underachievement, I am more broadly concerned with the community context within which student transiency occurs. As such, I discuss how communities and community insti- tutions are affected by student transiency and the chronic mobility of low-income households, as well as what this may imply for school reform and public policy. Student Transiency and its Consequences for Public Education While the U.S. is generally a mobile society, some groups are far more likely to make residential changes than others, including renters and people living below the pov-
Transcript of The Incidence and Impacts of Student Transiency in...
Journal of Research in Rural Education, 2005, 20(15)
The Incidence and Impacts of Student Transiency in Upstate New Yorkʼs Rural School Districts
Kai A. SchafftThe Pennsylvania State University
This article is one of several in a special collection for which Lionel J. Beaulieu and Robert M. Gibbs served as guest editors (http://www.umaine.edu/jrre/20-12.pdf). Earlier versions of these articles were presented at the 2003 conference, “Promoting the Economic and Social vitality of Rural America: The Role of Education,” which was sponsored by the Southern Rural Develop-ment Center, the Economic Research Service of the USDA, and the Rural School and Community Trust.
Support for this research was provided in part by the Office of University Partnerships, U.S. Department of Housing and Urban Development (HUD).
Correspondence concerning this article should be addressed to Kai A. Schafft, Department of Education Policy Studies, The Pennsylvania State University, 204B Rackley Building, University Park, PA 16802-3200. ([email protected])
Citation: Schafft, K. A. (2005, December 22). The incidence and impacts of student transiency in upstate New York’s rural school districts. Journal of Research in Rural Education, 20(15). Retrieved [date] from http://jrre.psu.edu/articles/20-15.pdf
Chronic student mobility, and in particular the mobility of students from low-income backgrounds, poses a serious yet un-derdocumented problem for rural schools. This article combines analyses of state-level school district data with survey and interview data to examine the patterns of low-income student mobility in upstate New York, and to assess the impacts on, and responses by, schools and other community institutions. The incidence and effects of student mobility are particularly pronounced in smaller, limited-resource districts. School district administrators report significant negative consequences due to the fiscal and administrative costs associated with high-need, highly mobile students. Student transiency not only requires extra administrative resources from teachers, guidance counselors, and other school staff, but the unpredictability of the movement vastly complicates planning and budgeting processes. Results portray a significant, high-need segment of the upstate New York population that is largely unrecognized, untargeted, and both socially and academically at risk.
Most residential mobility is popularly understood as being both voluntary and largely opportunity-related. That is, people choose to move in order to obtain more desirable or lucrative employment, to improve their quality of life, to enter a better school district, or in some other way take advantage of perceived greater opportunities at migration destinations. Hence, mobility is often understood as an investment in one’s human capital, and according to this understanding, people tend to move to areas where the high-est “return” on their investment may be realized (Lichter & Costanzo, 1987). However, residential movement and one of its consequences—student transiency—is largely unplanned and unpredictable. Instead of yielding greater opportunity, residential mobility associated with student transiency is
both symptomatic of and a causal factor in household inse-curity and broader community economic disadvantage.
While there is a growing literature associated with student transiency, this research has tended to focus on transiency within urban settings (Alexander, Entwisle, & Dauber, 1996; Bruno & Isken, 1996; Conniff, 1998; Ker-bow, Azcoitia, & Buell, 2003; Lash & Kirkpatrick, 1990) or the relationship between student transiency and academic underachievement (Pribesh & Downey, 1999; Rumberger, Larson, Ream, & Palardy, 1999; Swanson & Schneider, 1999; Tucker, Marx, & Long, 1998; Wood, Halfon, Scarlata, Newacheck, & Nessim, 1993). In contrast, my focus primar-ily is on nonmetro schools and school districts. In so doing, I emphasize that chronic mobility of low-income students is not simply an urban phenomenon. Second, instead of exploring the connection between transiency and academic underachievement, I am more broadly concerned with the community context within which student transiency occurs. As such, I discuss how communities and community insti-tutions are affected by student transiency and the chronic mobility of low-income households, as well as what this may imply for school reform and public policy.
Student Transiency and its Consequences forPublic Education
While the U.S. is generally a mobile society, some groups are far more likely to make residential changes than others, including renters and people living below the pov-

2 SCHAFFT
erty line. Between March 1999 and March 2000, roughly 16% of the population changed residence. Yet, during that same time, nearly 33% of renters moved, and nearly 28% of people living in households below the poverty level moved (U.S. Census Bureau, 2001). One of the effects of this residential change is student mobility, usually defined as the nonroutine and unscheduled transfer of students from one school to another.
A certain amount of student movement is to be expected in any school system. However, some students are dispro-portionately likely to make multiple moves. Similarly, some schools and school districts are disproportionately likely to experience higher rates of student mobility. Students most likely to be highly mobile tend to come from low income families, inner city areas, migrant or limited English profi-ciency backgrounds, and/or single-parent families (Branz-Spall, Rosenthal, & Wright, 2003; Rumberger et al., 1999; U.S. General Accounting Office [GAO], 1994; Wood et al., 1993). Consequently, the schools most likely to experience high mobility include those in urban and high-poverty areas (Bruno & Isken, 1996; Capps & Maxwell, 2002; Office of Program Policy Analysis and Government Accountability, 1996; Rumberger, 2003). However, chronic residential mobility of limited resource families also occurs in many rural areas—places that also may have the least available resources, both economic and political, to address the needs of low income movers (Fitchen, 1994, 1995).
The academic consequences of student transiency have been debated, but most research points to profoundly nega-tive effects (Hartman, 2002; Wright, 1999). The U.S. GAO (1994) found that about 17% of third graders had attended three or more schools since kindergarten and therefore could be considered “highly mobile.” Forty-one percent of these highly mobile third graders scored below grade level in reading, and about 31% scored below grade level in math. In comparison, only 26% of stable students (those who attended only one school since kindergarten) tested below grade level in reading and about 16% tested below grade level in math. The study also found that highly mobile third graders were far more likely to repeat a grade than stable students. In their study of four groups of transient students, Ingersoll, Scamman, and Eckerling (1989) also found a strong, uniformly negative relationship between student mobility and academic attainment, particularly in the lower grades. Evidence suggests that transiency also affects school completion: Rumberger and Larson (1998) found that stu-dents who changed high schools even once were less than half as likely as more stable students to complete their high school education.1
Research also points to the impacts of student tran-siency on schools themselves. Student transiency can cause significant disruption to classrooms (Conniff, 1998), result-ing in slowed curricula and loss of instructional time as a
consequence of behavioral problems among new students (Sanderson, 2003). In a study of 21 classes in a single urban elementary school, Lash and Kirkpatrick (1990) found that teachers rarely received advance notice of new student arriv-als. In addition to increased administrative and bookkeeping tasks, teachers often needed to re-teach material so that new students could catch up academically. This created classroom management problems as new students learned classroom rules and adapted to new peer groups, but it also affected social cohesion within the classroom. As a second grade teacher explained, “One of the things we want to establish is that we are a group, and if that group keeps crumbling, it’s a little harder (to establish) than in stable schools” (Lash & Kirkpatrick, p. 186).
This is consistent with the work of Bruno and Isken (1996), who, in their study of transiency within an inner city school, report that teachers repeatedly described how student movement created extra burdens by increasing the admin-istrative workload and decreasing the regular instructional time. However, more significant was the disruption caused when enrollment change necessitated the reorganization of classrooms (i.e., either merging because of shrinking num-bers or splitting because of growing numbers of students), an event that could be expected to occur anywhere from 1 and 5 times at any grade level during any given school year. In sum, student transiency poses serious challenges for schools and school districts and is associated with significant social and academic risk factors.
Examining Student Transiency inRural Upstate New York
The ones that concern me are the families that just drift from rental to rental. We have 2 or 3 families in particular that I’m thinking of that just seem to bounce from one neighboring district to the next. It’s a factor of poverty. They pay rent for a while and then they get evicted and they have to move on and rent somewhere else. (Superintendent, northern upstate New York)
1Some researchers have argued that the connection between mobility and academic underachievement is spurious given that high mobility is often associated with other risk factors for un-derachievement. That is, “the predominant reasons students who perform less well in school than students who do not move is that the two groups differ before any moves occur” including the disproportionate likelihood of mobile students to come from poor, single-parent families with low community attachment (Pribesh & Downey, 1999, p. 531). However, other studies have found that residential relocation has negative impacts on academic per-formance even after sociodemographic factors are controlled for (e.g., Wood et al., 1993).
STUDENT TRANSIENCY 3
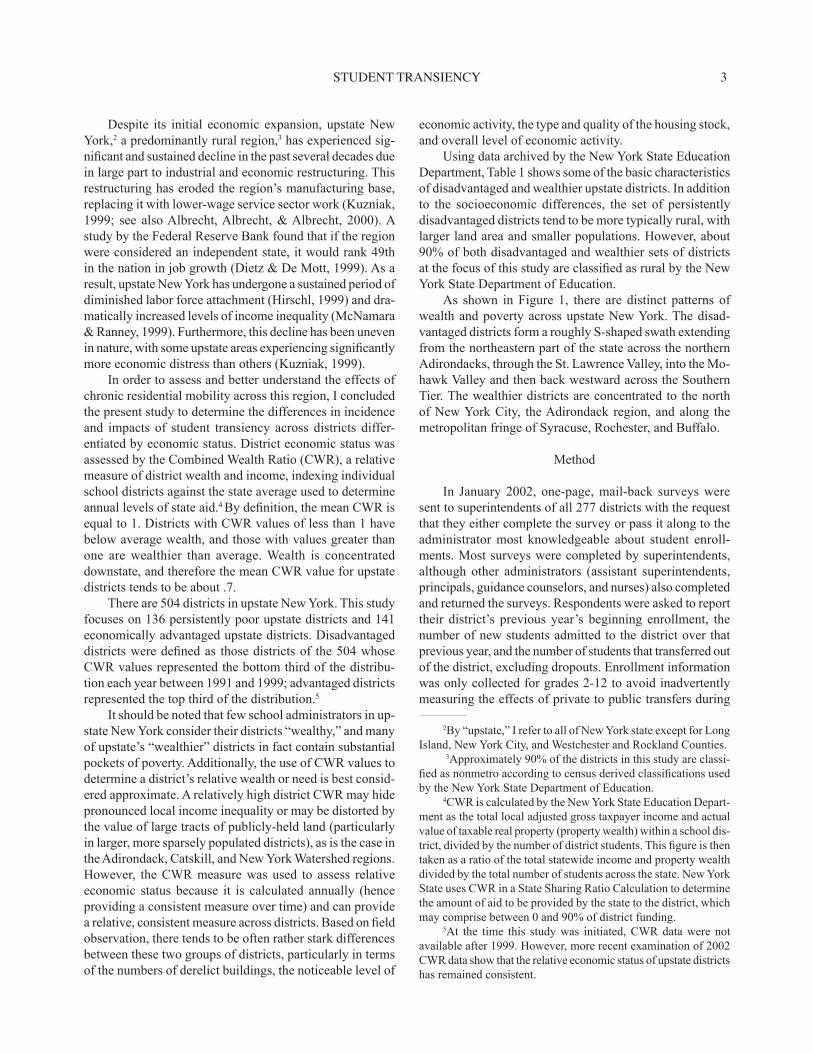
Despite its initial economic expansion, upstate New York,2 a predominantly rural region,3 has experienced sig-nificant and sustained decline in the past several decades due in large part to industrial and economic restructuring. This restructuring has eroded the region’s manufacturing base, replacing it with lower-wage service sector work (Kuzniak, 1999; see also Albrecht, Albrecht, & Albrecht, 2000). A study by the Federal Reserve Bank found that if the region were considered an independent state, it would rank 49th in the nation in job growth (Dietz & De Mott, 1999). As a result, upstate New York has undergone a sustained period of diminished labor force attachment (Hirschl, 1999) and dra-matically increased levels of income inequality (McNamara & Ranney, 1999). Furthermore, this decline has been uneven in nature, with some upstate areas experiencing significantly more economic distress than others (Kuzniak, 1999).
In order to assess and better understand the effects of chronic residential mobility across this region, I concluded the present study to determine the differences in incidence and impacts of student transiency across districts differ-entiated by economic status. District economic status was assessed by the Combined Wealth Ratio (CWR), a relative measure of district wealth and income, indexing individual school districts against the state average used to determine annual levels of state aid.4 By definition, the mean CWR is equal to 1. Districts with CWR values of less than 1 have below average wealth, and those with values greater than one are wealthier than average. Wealth is concentrated downstate, and therefore the mean CWR value for upstate districts tends to be about .7.
There are 504 districts in upstate New York. This study focuses on 136 persistently poor upstate districts and 141 economically advantaged upstate districts. Disadvantaged districts were defined as those districts of the 504 whose CWR values represented the bottom third of the distribu-tion each year between 1991 and 1999; advantaged districts represented the top third of the distribution.5
It should be noted that few school administrators in up-state New York consider their districts “wealthy,” and many of upstate’s “wealthier” districts in fact contain substantial pockets of poverty. Additionally, the use of CWR values to determine a district’s relative wealth or need is best consid-ered approximate. A relatively high district CWR may hide pronounced local income inequality or may be distorted by the value of large tracts of publicly-held land (particularly in larger, more sparsely populated districts), as is the case in the Adirondack, Catskill, and New York Watershed regions. However, the CWR measure was used to assess relative economic status because it is calculated annually (hence providing a consistent measure over time) and can provide a relative, consistent measure across districts. Based on field observation, there tends to be often rather stark differences between these two groups of districts, particularly in terms of the numbers of derelict buildings, the noticeable level of
economic activity, the type and quality of the housing stock, and overall level of economic activity.
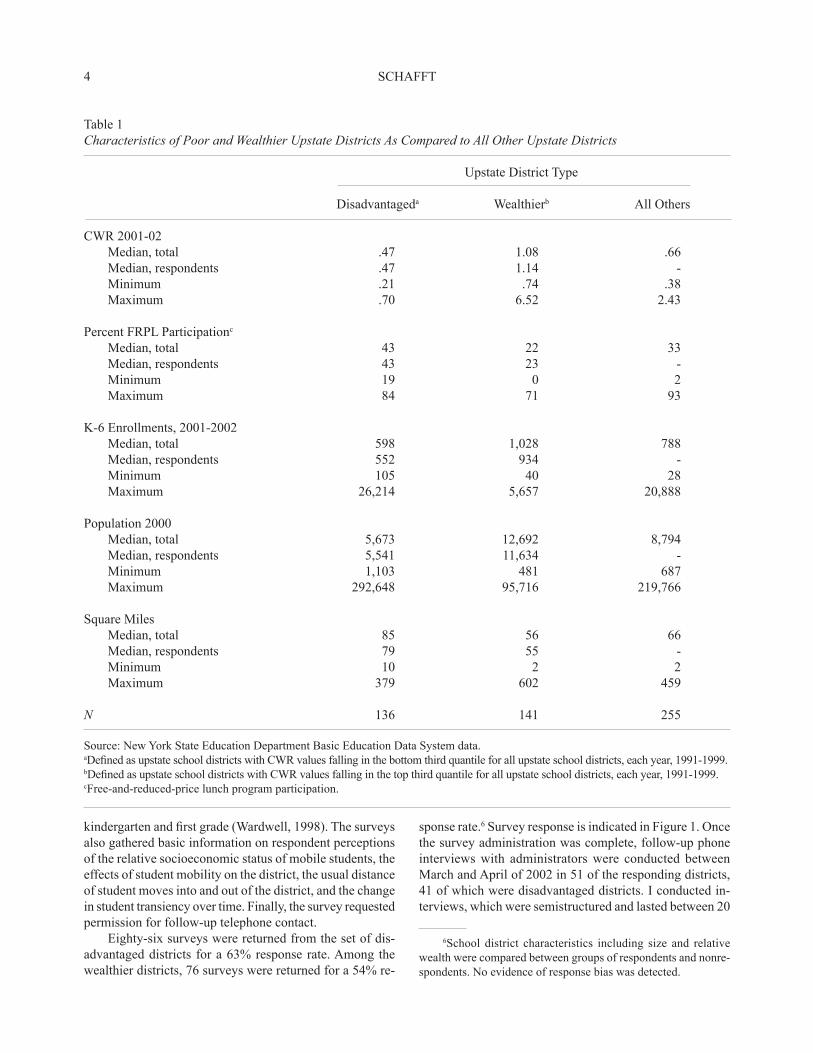
Using data archived by the New York State Education Department, Table 1 shows some of the basic characteristics of disadvantaged and wealthier upstate districts. In addition to the socioeconomic differences, the set of persistently disadvantaged districts tend to be more typically rural, with larger land area and smaller populations. However, about 90% of both disadvantaged and wealthier sets of districts at the focus of this study are classified as rural by the New York State Department of Education.
As shown in Figure 1, there are distinct patterns of wealth and poverty across upstate New York. The disad-vantaged districts form a roughly S-shaped swath extending from the northeastern part of the state across the northern Adirondacks, through the St. Lawrence Valley, into the Mo-hawk Valley and then back westward across the Southern Tier. The wealthier districts are concentrated to the north of New York City, the Adirondack region, and along the metropolitan fringe of Syracuse, Rochester, and Buffalo.
Method
In January 2002, one-page, mail-back surveys were sent to superintendents of all 277 districts with the request that they either complete the survey or pass it along to the administrator most knowledgeable about student enroll-ments. Most surveys were completed by superintendents, although other administrators (assistant superintendents, principals, guidance counselors, and nurses) also completed and returned the surveys. Respondents were asked to report their district’s previous year’s beginning enrollment, the number of new students admitted to the district over that previous year, and the number of students that transferred out of the district, excluding dropouts. Enrollment information was only collected for grades 2-12 to avoid inadvertently measuring the effects of private to public transfers during
2By “upstate,” I refer to all of New York state except for Long Island, New York City, and Westchester and Rockland Counties.
3Approximately 90% of the districts in this study are classi-fied as nonmetro according to census derived classifications used by the New York State Department of Education.
4CWR is calculated by the New York State Education Depart-ment as the total local adjusted gross taxpayer income and actual value of taxable real property (property wealth) within a school dis-trict, divided by the number of district students. This figure is then taken as a ratio of the total statewide income and property wealth divided by the total number of students across the state. New York State uses CWR in a State Sharing Ratio Calculation to determine the amount of aid to be provided by the state to the district, which may comprise between 0 and 90% of district funding.
5At the time this study was initiated, CWR data were not available after 1999. However, more recent examination of 2002 CWR data show that the relative economic status of upstate districts has remained consistent.
4 SCHAFFT
kindergarten and first grade (Wardwell, 1998). The surveys also gathered basic information on respondent perceptions of the relative socioeconomic status of mobile students, the effects of student mobility on the district, the usual distance of student moves into and out of the district, and the change in student transiency over time. Finally, the survey requested permission for follow-up telephone contact.
Eighty-six surveys were returned from the set of dis-advantaged districts for a 63% response rate. Among the wealthier districts, 76 surveys were returned for a 54% re-
sponse rate.6 Survey response is indicated in Figure 1. Once the survey administration was complete, follow-up phone interviews with administrators were conducted between March and April of 2002 in 51 of the responding districts, 41 of which were disadvantaged districts. I conducted in-terviews, which were semistructured and lasted between 20
Table 1 Characteristics of Poor and Wealthier Upstate Districts As Compared to All Other Upstate Districts
Upstate District Type
Disadvantageda Wealthierb All Others
CWR 2001-02 Median, total .47 1.08 .66 Median, respondents .47 1.14 - Minimum .21 .74 .38 Maximum .70 6.52 2.43 Percent FRPL Participationc Median, total 43 22 33 Median, respondents 43 23 - Minimum 19 0 2 Maximum 84 71 93
K-6 Enrollments, 2001-2002 Median, total 598 1,028 788 Median, respondents 552 934 - Minimum 105 40 28 Maximum 26,214 5,657 20,888
Population 2000 Median, total 5,673 12,692 8,794 Median, respondents 5,541 11,634 - Minimum 1,103 481 687 Maximum 292,648 95,716 219,766
Square Miles Median, total 85 56 66 Median, respondents 79 55 - Minimum 10 2 2 Maximum 379 602 459
N 136 141 255 Source: New York State Education Department Basic Education Data System data.aDefined as upstate school districts with CWR values falling in the bottom third quantile for all upstate school districts, each year, 1991-1999.bDefined as upstate school districts with CWR values falling in the top third quantile for all upstate school districts, each year, 1991-1999.cFree-and-reduced-price lunch program participation.
6School district characteristics including size and relative wealth were compared between groups of respondents and nonre-spondents. No evidence of response bias was detected.

STUDENT TRANSIENCY 5
and 60 minutes. Notes were taken during the interview and were immediately written up after interview completion. These notes were then compiled in NUD*IST, a software program designed to code and analyze text-based qualitative data. The quotes used in this report, unless otherwise noted, are taken from notes written during and immediately after these interviews. Site visits and additional interviews with district staff were subsequently completed in 10 of these study districts.
For this study, I examined student mobility through interdistrict student movement. Because of this, these data in fact underestimate actual student residential mobility: They account neither for student moves that do not involve a school change, nor for moves in which a student changes schools but does not change districts. About 16% of the school age population moves in a given year (U.S. Census Bureau, 2001). However, most residential moves do not involve a change of school, much less a change of school district. Some research has suggested that moves within
district boundaries may be at least twice as common as moves into or out of a district (Fitchen, 1994). Swanson and Schneider (1999), using data from the National Education Longitudinal Study, found that only about 36% of residential moves were accompanied by a school change for students in grades 8-10, and for students in grades 10-12 less than one quarter of residential moves were accompanied by a change of school. A 1994 study found that elementary students are about equally likely to make unscheduled school changes within a district as across districts (U.S. GAO, 1994).7 None-theless, data for the present study provide a comparative assessment of student mobility across these upstate districts responding to the survey.
Figure 1. Upstate New York school districts: Student transiency study
7These figures may be higher for elementary students than for others in higher grades since fewer elementary schools are consoli-dated. Because the school catchment areas are likely to be smaller, residential change may be more likely to result in school change.
!
!
!
!
!
!
!
! !
!
!
!
!
!
!
!
!
!
!
!!
!!
!
!
!
!
!
!
!
!
!
!
!
! !! ! !
!! !!
!
!
!
!
!
! !
!
!
!
!
!
!
!
!
!
!!
!!
!
!
!
!
!
!
!
!
!
!
!
!
!!
!
!
!
!
!
!
!
!
!
!
!
!
!
!
!
!
!
!
!
!
!
!
!!
! ! !
!
!!
!
!!
!
!
!
!
!
!
!
!
!
!
!
!
!!
!
!
!
!
!
!
!
!
!
!
!
!
!
!
!
! !
!
!!!
!
!
!
!!!
!!
!
!
!
!
!
!
!
100 0 10050 Miles
Upstate New York school districts, with responding districts inset
Wealthier Districts
Disadvantaged Districts
Upstate Districts
Rochester
BuffaloAlbany

6 SCHAFFT
Results
Incidence of Student Transiency in Poorer and Wealthier Districts
For districts responding to the survey, the median transfer rate and admission rate were each about 5% for the 2000-2001 academic year.8 This means that for a district with median transfer and admission rates, about 5% of the students enrolled at the beginning of the year would no longer be enrolled in the district by the end of the year, and approximately 5% of enrolled students at the end of the year had not been enrolled in the beginning of the year. However, reported transiency rates were highly variable, with some districts reporting annual admission and transfer rates of over 20% while other districts reported virtually no admis-sions or transfers at all.9 Admission rates were also strongly correlated with transfer rates (r = .88), and therefore even districts with high levels of student transiency tended to have only negligible net changes in enrollments from one year to the next.
One of the clearest patterns to emerge from the data is that student turnover disproportionately affects poorer districts. As Table 2 shows, the level of turnover in the dis-advantaged districts is nearly twice that of wealthier upstate districts.10 Additionally, disadvantaged districts were almost twice as likely to state that student turnover caused “signifi-cant” challenges, and almost half of the respondents from these districts stated that most newly enrolled students were likely to be of lower economic status than already enrolled students. This compares to only 28% of respondents from wealthier districts.
Regardless of district economic status, however, district administrators in both poorer and wealthier districts consis-
tently described the movement of low income students as be-ing characterized by both high frequency and short distance. Of the respondents who provided estimates of the usual distance of interdistrict student movement, 71% believed it was less than 30 miles.11 Respondents frequently used terms like “ping-ponging,” “bouncing,” and “shuffling” in reference to what they saw as back-and-forth short distance moves across school district and county lines.
While low-income movers were not interviewed as
8Admission rates and transfer rates were calculated by dividing the beginning of year enrollment by the number of admissions and the number of transfers in that academic year, and then multiply-ing by 100.
9Especially for smaller districts with less available resources, even low levels of turnover can have dramatic effects. The admis-sion of several unanticipated high-need, high-cost students can put severe strains on a district’s budget and overall resources.
10It is difficult to compare these figures with other studies of student transiency because typically the units of analysis used are either students or schools rather than school districts. A 1993 study found that students are about equally likely to make un-scheduled school changes within a district as across districts (U.S. GAO, 1994). However, Bruno and Isken (1996) reported average transiency rates (the number of students entering and leaving the district as a percentage of the total enrollment) in the Los Angeles Unified School District of 42.6%, and 23% in the Austin public school system. Alexander et al. (1996) found over a 5-year period that transiency rates in Baltimore city schools averaged between 14 and 21%.
11In a subsequent case study completed by the author of a disadvantaged district with an annual student turnover rate of over 30 percent, analysis of origin and destination districts relative to the study district revealed that the median distance of moves within upstate was only 11 miles, i.e., almost entirely to neighboring and adjoining districts.
Table 2Incidence and Consequences of Student Turnover: Disadvantaged and Wealthier Districts Compared
District Economic Status
Disadvantageda Wealthierb
Mean admission rate 7.2 (4.8)c 4.5 (3.1)
Mean transfer rate 7.8 (5.1) 4.3 (3.4)
Percent respondents stating turnover causes “significant” challenges for the district 19.0 10.3
Percent respondents stating that newly admitted students generally are of lower economic status than of already enrolled students in the district 46.4 28.2 aN = 86bN = 76cStandard deviation.

STUDENT TRANSIENCY 7
part of this study, the comments of survey respondents are consistent with the findings of previous research regarding the limited distance of residential movement associated with household economic insecurity. Transient households are not detached from place, despite the frequency of residen-tial relocation. Economic and social disruptions may spur residential movement. However, the resources of local social and informational networks, the desire not to leave an area, and the attachments to family and friends often restrict geographic range. More significantly, however, mobility is often geographically restricted simply by virtue of the greater financial cost, logistical complexity, and overall uncertainty associated with longer-distance moves (e.g., Fitchen, 1994).12
Causal Factors Associated With Chronic Student Mobility
Mostly students are moving within the area. For example, a family just moved into the district from (a nearby district). They weren’t able to pay the rent where they lived, and so they moved on into this district. We see that a lot. And then the same thing will happen: They’ll move back out to an-other district again. They move into trailers. There are also old farm houses. The farm is no longer a farm and so in desperation the family will rent the house. Often, these houses are in very bad repair and owned by absentee landlords. (Superintendent, Western New York)
Just as disadvantaged districts were most likely to ex-perience the highest rates of student turnover, interviewed respondents in 45 of 51 districts indicated that low socio-economic status of students was a major risk factor for high mobility. Comments like the following recurred in the course of interviews:
I’ve been here over 30 years in northern New York and in this five-district area. There is a constant amount of mobility especially in low-SES families. A lot of this is because of broken families. It’s not uncommon for a student to be here for one third of the year. Low-SES families tend to bounce around quite a bit. (Director of Instruction, Northern Ad-irondack Region)
There is a connection between economic status and mobility. The lower-SES kids tend to move more. They will bounce a lot, sometimes 3-4 times in a school year. (Principal, Central Upstate Region)
[The most frequent movers are] low SES, I don’t mean to characterize, but a lot of them are IEP.13
A lot of times I’ll get a special ed kid with a lot of needs and the school board will tell me, “don’t worry about it—in a couple of weeks they’ll be gone” and sure enough 6 weeks later they’ve gone to another district. (Superintendent, Central Upstate Region)
If I had to hazard a guess, I would say that it’s probably like 75% of the students who are mobile are in poverty—and we make that identification based on FRPL14 participation. (Superintendent, St. Lawrence Valley)
What I’m seeing is we get a lot of young poor families that move into the inexpensive housing in the district. (Superintendent, Southern Tier)
Table 3 shows the factors identified by interviewed respondents as contributing to the increased mobility of low-income families in their district.15 In interviews, re-spondents were encouraged to identify as many factors as they saw relevant. Factors are separated into local migration “pulls” and “pushes,” broken down by enrollment-turnover rate.16 This table further lists factors identified as related to increased mobility without necessarily functioning as either a migration “push” or “pull.”
The biggest difference between groups is that the avail-ability of low-cost housing was more frequently identified as a migrant draw by administrators in the high-turnover districts than in the low-turnover districts. Further, among districts with the highest turnover, poverty and impover-ishment were more frequently mentioned as causal factors in chronic student mobility. Regardless of the distinction among districts, the relationship between mobility and economic insecurity at both the household and the com-
12Similar factors may limit the geographic range of mobility in urban areas as well (e.g., Alexander et al., 1996).
13Individualized Education Plans are specially designed in-struction plans for students with learning disabilities.
14Free-and-reduced-price lunch.15This table only summarizes interview data from respondents
in the disadvantaged districts. In written comments from adminis-trators within the wealthier districts, similar factors were identified with higher levels of mobility, as well as the consequences of high mobility for the school district in terms of difficulties in planning, budgeting, and meeting the needs of students.
16Relative turnover levels were calculated by adding the ad-mission and the turnover rates and then calculating three quantiles. Districts with combined admission and turnover rates of less that 9.7 were characterized as having “low” turnover (N = 25), those with combined rates between 9.7 and 17.6, “medium” (N = 26) and those greater than 17.6, “high” (N = 26). Not all districts provided complete enrollment information on the returned surveys.

8 SCHAFFT
munity level clearly emerges. While Table 3 is broken into discrete causal factors, most respondents emphasized the deep interrelationships of these factors. For example, many respondents noted the following causal chain: Increased family economic insecurity leads to increased crises within families including heightened abuse, separation, and divorce. This, in turn, leads to custody issues and children moving without parents. As one superintendent from western New York put it, “Economic stress creates unstable family situ-ations. We see mothers who get together with a boyfriend and that boyfriend doesn’t want to move, so she moves and takes the kids and then that doesn’t work out so they move back again and then meet someone else and move in with that person and so on. We see a lot of that.”
Housing Stock and Mobility of Resource-Limited Households
As Table 3 shows, housing issues top both “push” and “pull” lists as causal factors for residential mobility of low-income families. Further, in 70% of districts where interviews were completed, administrators identified hous-ing-related issues as strongly connected to mobility (see also Crowley, 2003; Housing Assistance Council, 2002). A clear connection emerged from the interview data between the gradual impoverishment of households and communi-ties, and changes in housing stock leading to increased residential mobility. Many communities in upstate New York have seen a gradual shrinking of populations as local economies and job markets tighten. As residents leave the
Table 3Residential Mobility “Push and “Pull” Factors in Disadvantaged Districts with Low, Medium, and High Rates of Student Turnover, by Interview Mention
District Enrollment-Turnover Rate
Low Medium High Total
Local “Pulls” Access to low-cost housing 2 4 6 12 Availability of social services 1 2 3 6 Reputation of district 1 0 2 3 Services provided by district (e.g., special 0 1 2 3 education programming)
Local “Pushes” Eviction; Inability to pay rent and/or bills 4 5 2 11 Economic decline; loss of job base 2 3 3 8 Poor quality of housing stock 1 3 0 4 Legal authorities/Child Protective Services 2 1 0 3 Lack of affordable housing 0 1 0 1 Student behavioral issues 0 0 1 1 Dissatisfaction with district 1 0 0 1
Other Family and SES Factors Poverty and impoverishment 3 6 8 17 Divorce/separation/family crises 4 5 5 14 Kinship and other social network ties 2 2 2 6 Proximity to county lines or county seat 2 2 0 4 High percent foster child placement 1 1 2 4 Single-parent families 2 1 0 3 Domestic violence and abuse 0 1 1 2 Lack of connections to community 0 0 1 1
District N 13 12 13 38a
aThree of the disadvantaged districts in which interviews were completed provided incomplete enrollment change data. This table does not summarize interview data from those three districts.
STUDENT TRANSIENCY 9
area, housing prices drop and dwellings are converted into rental properties, often managed by absentee landlords. Under these circumstances, the quality of housing stock may noticeably deteriorate, which also leads to increased mobility as households move to escape unacceptable or unsafe living conditions.
While low-cost housing may in some cases initially attract poor families to an area (e.g., Fitchen, 1995), it may also perpetuate a more localized chronic mobility, espe-cially if the housing stock is of marginal quality. As one administrator said,
[i]t seems like they’re moving from district to dis-trict because of housing. . . . You should see some of the places they’re moving into. A lot of times the housing is in such disrepair! They get into conflicts with landlords because of this and they’ll move on because the housing is so bad.
Another administrator, noting what seemed to be a seasonal increase in mobility during the winter months, said “I know of one family that just moved because the water pipes kept freezing and the landlord wouldn’t do anything about it.” By contrast, among disadvantaged rural districts with markedly low student turnover, a common characteristic was the rela-tive lack of available housing, particularly among smaller, more isolated districts.
Regardless of the housing quality, however, many resi-dents struggle with simple affordability. In much of upstate New York, the employment available to most people with only a high school diploma is predominantly low-paid service sector work. Much of the work available to unskilled workers without education beyond a high school diploma pays the minimum wage or only slightly above, thrusting households into conditions of chronic economic vulnerability. A staff worker in a county-level housing advocacy organization emphasized how little financial cushion many people have and the effects on the ability to secure adequate housing:
I think what happens is the affordability. Look at the cost of rental units and the income. Calculate the budget of a single mom working at minimum wage and check the cost of the housing. And if you look at that closely, it’s not hard to figure out that this person is headed for financial disaster unless something happens. It’s impossible to make those numbers work. The wages available and the housing costs are not compatible. You end up com-promising at this point. There are people who are making choices between buying food and buying medicine. Those are hard choices. There are no other resources to offset [this situation] that they are aware of, so we see a lot of those folks in crisis because of expenses that have become uncontrol-
lable. You have a single mother in particular, and we work with a lot of those, ranging from 14 on up. It’s very difficult if a car breaks for example. $200 is a paycheck. That’s a hole right there and, ultimately, unless something happens to offset that somewhere, that person’s going to be in trouble. They have to make some hard choices. And gener-ally it’ll come down to rent. I see people behind in rent because they’ve had to pay a utility bill.
This is consistent with the most recent annual report of National Low Income Housing Coalition, which compares wages and rents for all states, counties, and MSAs in the U.S. The report uses data on rental costs to calculate a Housing Wage, which is equivalent to the amount that someone work-ing full time (40 hours per week) must earn per hour to be able to afford a two-bedroom unit at Fair Market rent.17 The report argues that the minimum wage, which has remained $5.15 per hour since 1997,18 is unable to provide a Housing Wage in any jurisdiction. In fact, 75% of states (containing 90% of the U.S. renting population) have a Housing Wage over twice the minimum wage. Of all states, New York is the fifth least affordable state with a Housing Wage of $18.24 for a two-bedroom home at Fair Market rent, amounting to 354% of the minimum wage.19
The Fiscal and Administrative Consequences of Student Transiency for Districts
Most of the community does not recognize this as an issue. But it creates a huge problem. The aid is frozen by the state: To pay for the needs of these kids, we will have to go to the local taxpayer. It’s a hard sell to the community at large that we have this unknown group that requires some substantial resources that don’t even exist to most people here but nonetheless are very real to us. (Superintendent, Southern Tier)
17The Housing Wage is defined as a wage 30% of which is equivalent to the cost of Fair Market rent, on the assumption that affordable housing costs consume no more than 30% of household income. Fair Market rent is equivalent to the 40th percentile of rental costs for the given area, on the assumption that this repre-sents a safe and adequate quality of housing (National Low Income Housing Coalition, 2002).
18The current value of minimum wage in constant dollars is worth about 70% of what it was worth in 1968 (National Low Income Housing Coalition, 2002).
19In upstate New York counties, the Housing Wage is lower than the statewide figure. For nonmetro New York counties for example, all of which are located upstate, the Housing Wage for a two-bedroom unit is $11.21. However, this is still over twice the minimum wage, and occurs in an area in which earning potentials are markedly lower as compared to downstate areas.
10 SCHAFFT
Student transiency can have tremendous fiscal and ad-ministrative impacts on school districts as they attempt to meet the needs of pupils disproportionately in need of special education and remedial services. Consistent with previous research findings on student transiency (e.g., Rumberger et al., 1999; U.S. GAO, 1994), administrators spoke at length about how highly mobile students not only tended to be low SES, but they also entered the district with high social and educational needs. Academic and behavioral problems were frequently associated with or identified as a consequence of high mobility. “[Low SES] students are highly mobile,” related one administrator.
These students have academic difficulties. This is caused because of the disruption, both academic and social caused by switching schools and residence. These kids have more difficulties making friends and socially integrating into the school. They also tend to have more behavioral problems.
District budgets are prepared for each successive year based on the enrollments and need of the previous year’s student body. Yet, residential mobility of high-needs students may place school districts in planning situations of extreme uncertainty. This is particularly true of smaller districts that have less fiscal resources at their disposal in which even small enrollment changes can have significant fiscal and administrative consequences. This creates particular vulnerability for many disadvantaged rural districts, even under circumstances in which actual student turnover may be low. A superintendent from a small, rural district with an enrollment of roughly 650 students had this to say,
There is increased pressure on school budgets. One sixth of our budget is targeted towards special needs kids. This year, we had budgeted $100,000 for expenses associated with kids we anticipated would move into the district. We figured that we could expect 4 special needs kids to move into the district. We had 10 actually move in, and we ended up needing to spend $250,000 to meet their needs, so we went $150,000 over our budget. We are a small district, and so this was significant.
These kinds of budget over-runs eventually are reflected in local tax levies. However, because of the lower overall wealth of disadvantaged districts, fiscal burdens of this type are not easily absorbed.
The consequence is that high-need and high-cost mo-bile students quickly begin to represent a distinct liability to financially strapped school districts—districts where the transiency of is likely to be the most pronounced. In response to whether the district had any programming in place to stabilize transient students, one of the interviewed admin-
istrators reacted: “Why would we have those programs in place? We don’t want those students to stay in our district!” The majority of administrators were not that blunt. How-ever, others acknowledged that the placement of students into special programming was often delayed because of the costs that would be incurred with that placement, coupled with the real chance that the student would soon move out of the district.
No Child Left Behind, Assessments, and the Rationalization of Education
A big challenge is simply nutrition. These kids can’t make it if they’re not eating properly. . . . For these kids, teaching is probably not our highest priority—and that may sound funny coming from a superintendent. Rather, the highest priority for these kids tends to be their social needs. Of course, we get killed by the state if our test scores aren’t high enough—that’s how our performance is as-sessed. But no one ever recognizes the kind of work we do with these kids. No one is really thanking us for it or recognizing it. (Superintendent, Northern Upstate NY)
Transient students represent liabilities to school dis-tricts in other regards as well. Of particular concern is that school districts with the least resources disproportionately experience high mobility of academically and socially dis-advantaged students. This has disturbing implications for the increased emphasis on school accountability through testing. The 2001 No Child Left Behind Act (NCLB) requires states to use testing as a means of holding local school systems accountable for the academic preparation provided to stu-dents, based on the assumption that student test scores from a given school reflect the academic preparation that school has been able to provide. Student transiency obviously complicates this assumption, however, and in high-mobility schools and districts, schools may be held “accountable” for underachieving and at-risk students who have disrupted academic experiences and who may have only been in the local school system for a brief time. As a superintendent from north central New York exclaimed, “We’re supposed to provide students with support to get through the regents ex-ams, but they’re not even our kids!” Because of this, NCLB may inadvertently create disincentives for schools to retain mobile, low-achieving students (Weckstein, 2003).
Regarding assessments, several respondents spoke about how this had affected both the social and work envi-ronments within schools. As a guidance counselor in a rural district stated,
I know that we have to do more, but I’m not sure that standards have been raised. There is a lot more
STUDENT TRANSIENCY 11
accountability in terms of testing. That’s a huge change. There’s kind of a grimness [now] . . . you’ve got 100 things in the air, and how are we going to keep them in the air? There used to be a lot more humor and fun. Working with students was a lot friendlier. But now we’re curriculum-driven. Every teacher is under pressure to produce so much, and they know that. We talk about this in staff meetings. It seems there was a kinder, gentler school 25 years ago. For a variety of reasons we’re not kinder and gentler. Schools are run in a much more business-like way with the bottom line in mind.
Transient students clearly challenge that bottom line, and the consequences for not meeting standards are signifi-cant, including potential staff turnover and the subsidization of students leaving to attend other, “nonfailing,” schools. Again, as schools are held to testing standards, those districts with the highest levels of mobility are at a distinct disad-vantage because of the over-representation of low-achieving students among those students most likely to be mobile.
Parra and Pfeffer (2002) argue that the school system is one of the few local institutions capable of meaningfully integrating new low income residents into the community. However, while having the stated intention of raising aca-demic standards, NCLB may in some circumstances under-mine the socially integrative capacities of school districts and reinforce the academic and social exclusion of already marginalized children.
Discussion
Student transiency and the chronic residential mobil-ity of resource limited households is both symptomatic of and a contributing factor to community and household disadvantage. The impacts of student transiency on school districts are serious. In economic decline, many districts in the upstate region have seen gradual enrollment decreases along with shrinking tax bases, leaving districts with dwin-dling resources. Those districts that face especially high or unpredictable levels of student turnover are placed in circum-stances in which they are likely to experience unpredicted budget overruns because of the high percentage of high-need students among the most mobile populations.
While national education policy is currently framed by the promise of leaving no child behind, evidence suggests that transient students are being left behind. As a guidance counselor working within a high-transiency district remarked about his district’s revolving door of students,
No one owns these kids. They have no political or economic power. The chances of reform happen-ing [for them] are certainly less than they might be for other groups. No one speaks on behalf of these
kids and they are less likely to advocate on behalf of themselves.
At the very least, this is a compelling reason to further document student transiency, and particularly in rural areas where it has so far received little attention.
First, there is a strong need for the systematic gathering of basic information on mobile students across a range of district types, both urban and rural. This information includes sociodemographic characteristics of mobile students, where students are coming from, where they are going to, the reasons for the movement, the proportion of school moves that are accompanied by residential moves, and whether transiency has increased or decreased over time. Second, research is needed on the impacts on schools and the effects of various school reform measures. Are school districts dif-ferentially affected by transiency as a function of district size, wealth, and urban proximity? Last, what programming appears to be effective in reducing transiency, or at least mitigating its more negative effects? Similarly, are there school reforms that may have the inadvertently increased student mobility, such as the provisions in NCLB allowing for transfers out of “failing” schools? In the short term, research leading to the institutional recognition of transient students as an identified and targetable student population would increase the chances for devising appropriate pro-gramming and garnering resources needed by schools and the communities they serve.
One such programmatic response at the federal level is the McKinney-Vento Homeless Assistance Act reautho-rized by NCLB. This act entitles homeless children to free and appropriate public education, allocating Title I funds toward that end. Yet, many transient students at any given time may not technically be homeless by the criteria of McKinney-Vento. Additionally, while McKinney-Vento’s reauthorization expands the definition of homelessness to include a wider range of homeless situations,20 it’s not clear how consistently the Act is implemented and enforced (Ju-lianelle & Foscarinis, 2003).
At the local level, programmatic options for schools may include staff development centered on the needs of mo-bile students, as well as focused outreach to mobile students and their families. Given that most mobility associated with student transiency is highly localized, increased interdistrict collaboration may also be indicated, at the very least in the streamlining of student record-sharing to facilitate placement and programming consistency for mobile students. Col-laborative activity could also extend to inter-district youth
20Legally “homeless” children include those who live in a dwelling that lacks basic services such as electricity or water, who live in temporarily in motels or emergency shelter, parks or public spaces, or who live in temporary arrangements with other families.

12 SCHAFFT
risk prevention programming and the development of deeper networks between schools and other local service-providing organizations. This does not imply school consolidation, however, which may only further risk eroding the social and civic resources of rural communities (Lyson, 2002).
Schools can take steps to lessen the incidence and severity of student transiency.21 However, these are not simply issues for schools and school districts. Rather, they are embedded within communities and broader processes of political and economic change. Any amount of school reform, no matter how sweeping, will not change the basic facts of the economic conditions experienced by so many families in rural New York and elsewhere in the U.S. While chronic residential mobility is a problem for families and communities, the real problem is economic insecurity that has been made significantly worse by increased income inequality, changes within labor and housing markets, and the removal of government-provided social supports. The 1996 Personal Responsibility and Work Opportuni-ties Reconciliation Act has put a 5-year cap on welfare aid disbursement, requiring participation in work or work related activities. And yet, minimum wage work virtually guarantees poverty and insecurity.22 While the impact has been significant in terms of the number of people moving off welfare, research has indicated that these changes have increased housing insecurity for many households (Hous-ing Assistance Council, 2002). “Personal responsibility” does not ensure escape from insecurity and the world of the working poor. Regardless of innovative educational reform, without employment opportunities offering a livable wage, without access to safe and affordable housing, and without functioning social support systems for families in distress, the social insecurity at the root of chronic residential mobility will unquestionably remain.
References
Albrecht, D. E., Albrecht, C. M., & Albrecht, S. L. (2000). Poverty in nonmetropolitan America: Impacts of in-dustrial, employment, and family structural variables. Rural Sociology, 65(1), 87-103.
Alexander, K. L., Entwisle, D. R., & Dauber, S. L. (1996). Children in motion: School transfers and elementary school performance. The Journal of Educational Re-search, 90(1), 3-12.
Branz-Spall, A. M., & Rosenthal, R., with Wright, A. (2003). Children of the road: Migrant students, our nation’s
most mobile population. The Journal of Negro Educa-tion, 72(1), 55-62.
Bruno, J. E., & Isken, J. (1996). Inter and intraschool site student transiency: Practical and theoretical implica-tions for instructional continuity at inner city schools. Journal of Research and Development in Education, 29(4), 239-252.
Capps, W. R., & Maxwell, M. E. (2002). Mobility. American School Board Journal, 189(5), 26-30.
Conniff, R. (1998). Bouncing from school to school. The Progressive, 62(11), 21-25
Crowley, S. (2003). The affordable housing crisis: Resi-dential mobility of poor families and school mobility of poor children. The Journal of Negro Education, 72(1), 22-38.
Dietz, R., & De Mott, M. (1999). Is upstate New York show-ing signs of a turnaround? Current Issues in Economics and Finance, 5(6).
Fitchen, J. M. (1994). Residential mobility among the rural poor. Rural Sociology, 59(3), 416-436.
Fitchen, J. M. (1995). Spatial redistribution of poverty through migration of poor people to depressed rural communities. Rural Sociology, 60(2), 181-201.
Hartman, C. (2002). High classroom turnover: How children get left behind. In Rights at risk: Equality in an age of terrorism (pp. 27-244). Washington DC: Poverty, and Race Research Action Council.
Hirschl, T. A. (1999). The significance of education in an era of labor market hardship. In P. C. Jobes, W. F. Stinner, & J. M. Wardwell (Eds.), Community, society and mi-gration: Noneconomic migration in America (pp. 3-16). New York: University Press of America.
Housing Assistance Council. (2002). Taking stock: Rural people, poverty, and housing at the turn of the 21st century. Washington, DC: Author.
Ingersoll, G., Scamman, J. P., & Eckerling, W. D. (1989). Geographic mobility and student achievement in an urban setting. Educational Evaluation and Policy Analysis, 11(2), 143-149.
Julianelle, P. F., & Foscarinis, M. (2003). Responding to the school mobility of children and youth experiencing homelessness: The McKinney-Vento Act and beyond. The Journal of Negro Education, 72(1), 39-54.
Kerbow, D., Azcoitia, C., & Buell, B. (2003). Student mo-bility and local school improvement in Chicago. The Journal of Negro Education, 72(1), 158-164.
Kuzniak, P. (1999). Social change in upstate New York cit-ies. In T. A. Hirschl & T. B. Heaton (Eds.), New York State in the 21st Century (pp. 123-140). Westport, CT: Praeger.
Lash, A. A., & Kirkpatrick, S. L. (1990). A classroom per-spective on student mobility. The Elementary School Journal, 91(2), 177-191.
21See, for example, the articles on school responses in Section III: Reform Strategies, in the special issue of the Journal of Negro Education, 72(1) dedicated to the topic of student transiency.
22The current value of the minimum wage in constant dollars is worth about 70% of what it was worth in 1968 (National Low Income Housing Coalition, 2002).
Lichter, D. T., & Costanzo, J. A. (1987). Nonmetropolitan underemployment and labor force composition. Rural Sociology, 32, 329-344.
Lyson, T. A. (2002). What does a school mean to a com-munity? Assessing the social and economic benefits of schools to rural villages in New York. Journal of Research in Rural Education, 17, 131-137.
McNamara, P. E., & Ranney, C. K. (1999). The distribution of income in New York State: Trends and implications for public policy. In T. A. Hirschl & T. B. Heaton (Eds.), New York State in the 21st Century (pp. 17-34). Westport, CT: Praeger.
National Low Income Housing Coalition. (2002). Rental housing for America’s poor families: Farther out of reach than ever (Annual Report). Retrieved June, 2003, from www.nlihc.org/oor2002
Office of Program Policy Analysis and Government Ac-countability. (1996). Improving student performance in high-poverty schools (Report No. 96-86). Tallahassee, FL: The Florida Legislature, Author.
Parra, P. A., & Pfeffer, M. J. (2002, September). The limits of social capital for immigrant integration in rural communities. Paper presented at the Workshop on So-cial Capital and Civic Involvement. Cornell University and the University of Turin, Italy. Cornell University, Ithaca, New York.
Pribesh, S., & Downey, D. B. (1999). Why are residential and school moves associated with poor school performance? Demography, 36(4), 521-534.
Rumberger, R. W., & Larson, K. A. (1998). Student mobility and the increased risk of high school drop out. American Journal of Education, 107,1-35.
Rumberger, R. W., Larson, K. A., Ream, R. K., & Palardy, G. J. (1999). The educational consequences of mobil-ity for California students and schools. PACE Policy Brief, 1(1).
Rumberger, R. W. (2003). The causes and consequences of student mobility. The Journal of Negro Education, 72(1), 6-21.
Sanderson, D. R. (2003). Veteran teachers’ perspectives on student mobility. Essays in Education, 4 (Winter). Re-trieved June 2003, from http://www.columbiacollegesc.edu/essays/vol.%204%20winter%202003/sanderson.pdf
Swanson, C. B., & Schneider, B. (1999). Students on the move: Residential and educational mobility in Ameri-ca’s schools. Sociology of Education, 72, 54-67.
Tucker, C. J., Marx, J., & Long, L. (1998). ‘Moving on’: Residential mobility and children’s school lives. Sociol-ogy of Education, 71, 111-129.
U.S. Census Bureau. (2001). Geographic mobility: March 1999 to March 2000 (Current Population Reports). Washington, DC: U.S. Government Printing Office.
U.S. General Accounting Office. (1994). Elementary school children: Many change schools frequently, harming their education (U.S. GAO/HEHS Report 94-45). Washington, DC: Author.
Wardwell. J. M. (1998). Community mobility and public school enrollments. In H. K. Schwarzweller & B. P. Mullan (Eds.), Research in rural sociology and devel-opment: Focus on migration (Research in Rural Soci-ology and Development Series, Vol. 7, pp. 131-154). Stamford, CT: Jai Press, Inc.
Weckstein, P. (2003). Accountability and student mobility under Title I of the No Child Left Behind Act. The Journal of Negro Education, 72(1), 117-125.
Wood, D., Halfon, N., Scarlata, D., Newacheck, P., & Nes-sim, S. (1993). Impact of family relocation on children’s growth, development, school function and behavior. Journal of the American Medical Association, 270(11), 1340-1338.
Wright, D. (1999). Student mobility: A negligible and con-founded influence on student achievement. The Journal of Educational Research, 92(6), 347-353.
STUDENT TRANSIENCY 13