THE IN THE OF REUBEN - SWFSC Home Page - SWFSC
19
212 Rapp. P.-v. Rbun. Cons. int. Explor. Mer, 173: 212-230. 1978. THE RELATION BETWEEN OCEANOGRAPHIC CONDITIONS AND LARVAL ANCHOVY FOOD IN THE CALIFORNIA CURRENT: IDENTIFICATION OF FACTORS CONTRIBUTING TO RECRUITMENT FAILURE REUBEN LASKER National Oceanic and Atmospheric Administration, National Marine Fisheries Service, Southwest Fisheries Center, P.O. Box 271, La Jolla, California 92038, U.S.A. Evidence is offered in this paper to suggest that monitoring the extent and aggregation of potential larval fish food particles over a spawning season along with pertinent environmental parameters may be a practical way to predict the relative degree of pelagic fish recruitment arid the strength of the resultant year class. To discover the extent, both horizontal and vertical, of larval anchovy feeding areas and how these change with time and a variety of oceanographic and meteorological conditions, a survey of inshore and offshore particle distribution was made off southern California from September 1974 through Sep- tember 1975. The temporal and spatial picture of the anchovy larva’s micro- and macro-cnvironmrnt was expected to suggest whether conditions were good for larval anchovy feeding and hewe whether good or bad recruitment might be expected on the basis of larval food distribution. In an earlier study it was shown that it is possible to establish whether a body of water is a good or poor feeding ground for first-feeding larval anchovy, Wgraulis mordux. Sufficiently high numbers (> than 30 particles/ml) of proper-size food organisms (cells approximately 40 pni diameter) have to he present for successful feeding. Food was abundant within 5 km off the California rhore in chlorophyll maximum layers prior to January 1975. Gyral circulation caused a widespread distribution of food throughout the Southern California Bight in .January. In February 1975, a major upwelling event occurred in this area. The proper-size food par- ticles, mostly dinoflagellates, which were abundant before the upwelling, were dissipated because of it. Smaller particles in the form of a 1-ariety of diatoms supplanted the dinoflagellates. Laboratory and field experiments have shown that regardless of their concentration, small diatoms do not provide the caloric requirements of first-feeding anchovy larvae. Upwelling continued through the early spring and summer months of 1975 and diatoms persisted. Early spring was the end of the anchovy spawning season. The data suggest that the timing of onset and the duration of upwelling are crucial determinants for survival of larvae and the resultant year classes of the northern anchovy. INTRODUCTION I t is known from well-studied fisheries, e.g., the Atlanto-Scandian herring (Clupea harengus) that there is often no correlation between the size of a spawning stock and the size of its resultant year class (Hjort, 1926). Although pelagic and benthic fishes can produce enough eggs to replace their own individuals lost by natural and fishing mortality, often there are popula- tion collapses which cannot be correlatcd with the amount of spawning. On the other hand, there are also examples of exceptionally large pelagic fish year classes which have been produced from relatively small spawning stocks (Simpson, 1956). Even when no fishery exists, great changes in the magnitude of pelagic fish populations may occur. For example, large fluctuations in the population size of the Pacific sardine (Sardinops caeruiea= S. sagax) and northern anchovy (Engraulis mordax) in the California Current have taken place recently (Smith, 1972) as well as over the last 150 years, as shown by Soutar and Isaacs (1974) from sedimentary records off California. An estimation of recruitment into an upcoming year class from the statistical information available on the size of the spawning stock can be unreliable. This was particularly evident when the Peruvian anchoveta (Engraulis ringens) fishery collapsed in 1973. The catch of anchovies fell drastically below the previous years’ catches, from 10 million metric tons annually to less than 5 million metric tons. The panel of experts on stock assessment of the Peruvian an- choveta recognized that two years of poor recruitment touched off the collapse of that fishery, in common with the decline and disappearance of other formerly
Transcript of THE IN THE OF REUBEN - SWFSC Home Page - SWFSC
212
Rapp. P.-v. Rbun. Cons. int. Explor. Mer, 173: 212-230. 1978.
THE R E L A T I O N BETWEEN O C E A N O G R A P H I C C O N D I T I O N S AND LARVAL A N C H O V Y F O O D I N THE C A L I F O R N I A C U R R E N T :
I D E N T I F I C A T I O N OF F A C T O R S C O N T R I B U T I N G TO R E C R U I T M E N T F A I L U R E
REUBEN LASKER National Oceanic and Atmospheric Administration, National Marine Fisheries Service,
Southwest Fisheries Center, P.O. Box 271, La Jolla, California 92038, U.S.A.
Evidence is offered in this paper to suggest that monitoring the extent and aggregation of potential larval fish food particles over a spawning season along with pertinent environmental parameters may be a practical way to predict the relative degree of pelagic fish recruitment arid the strength of the resultant year class.
T o discover the extent, both horizontal and vertical, of larval anchovy feeding areas and how these change with time and a variety of oceanographic and meteorological conditions, a survey of inshore and offshore particle distribution was made off southern California from September 1974 through Sep- tember 1975. The temporal and spatial picture of the anchovy larva’s micro- and macro-cnvironmrnt was expected to suggest whether conditions were good for larval anchovy feeding and hewe whether good or bad recruitment might be expected on the basis of larval food distribution.
In an earlier study it was shown that it is possible to establish whether a body of water is a good or poor feeding ground for first-feeding larval anchovy, Wgraul i s mordux. Sufficiently high numbers (> than 30 particles/ml) of proper-size food organisms (cells approximately 40 pni diameter) have to he present for successful feeding.
Food was abundant within 5 km off the California rhore in chlorophyll maximum layers prior to January 1975. Gyral circulation caused a widespread distribution of food throughout the Southern California Bight in .January. I n February 1975, a major upwelling event occurred in this area. The proper-size food par- ticles, mostly dinoflagellates, which were abundant before the upwelling, were dissipated because of it. Smaller particles in the form of a 1-ariety of diatoms supplanted the dinoflagellates. Laboratory and field experiments have shown that regardless of their concentration, small diatoms do not provide the caloric requirements of first-feeding anchovy larvae. Upwelling continued through the early spring and summer months of 1975 and diatoms persisted. Early spring was the end of the anchovy spawning season. T h e data suggest that the timing of onset and the duration of upwelling are crucial determinants for survival of larvae and the resultant year classes of the northern anchovy.
INTRODUCTION
I t is known from well-studied fisheries, e.g., the Atlanto-Scandian herring (Clupea harengus) that there is often no correlation between the size of a spawning stock and the size of its resultant year class (Hjort, 1926). Although pelagic and benthic fishes can produce enough eggs to replace their own individuals lost by natural and fishing mortality, often there are popula- tion collapses which cannot be correlatcd with the amount of spawning. On the other hand, there are also examples of exceptionally large pelagic fish year classes which have been produced from relatively small spawning stocks (Simpson, 1956).
Even when no fishery exists, great changes in the magnitude of pelagic fish populations may occur. For example, large fluctuations in the population size of the Pacific sardine (Sardinops caeruiea= S. sagax) and
northern anchovy (Engraulis mordax) in the California Current have taken place recently (Smith, 1972) as well as over the last 150 years, as shown by Soutar and Isaacs (1974) from sedimentary records off California.
An estimation of recruitment into an upcoming year class from the statistical information available on the size of the spawning stock can be unreliable. This was particularly evident when the Peruvian anchoveta (Engraulis ringens) fishery collapsed in 1973. The catch of anchovies fell drastically below the previous years’ catches, from 10 million metric tons annually to less than 5 million metric tons. The panel of experts on stock assessment of the Peruvian an- choveta recognized that two years of poor recruitment touched off the collapse of that fishery, in common with the decline and disappearance of other formerly

The relation between oceanographic conditions and larval anchovy food in the California Current 2 13
SANTA MONICA
L l l l I l l 1 I 1 1 ~ ~ 1 I I I - l I I I I I I I I I I I I I I I 1 1 I I I 1 I I I 1 I 1 1 I I 30' 1200 50' 119" 30' 118" 30' 117"
Figure 182. Basic sampling stations for the Southern California Bight. Inshore stations are located 1, 2 and 4 km from theshore.
great fisheries such as the Atlanto-Scandian herring, the Pacific sardine, the Hokkaido herring and the Japanese sardine (Murphy, 1974).
'Thus despite the ability of fishery scientists to re- cognize the failure of recruitment into a fishery after- the-fact, there is still a lack of understanding of the mechanisms that determine year-class strength in pelagic fish populations. To manage a fishery, fishery scientists would like to be able to predict whether and to what degree a n y particular spawning will result in successful recruitment. For maximum eeono- mic exploitation, managers would like to know how small a spawning stock may be to ensure subsequently a reasonably large year class.
I n a n earlier study (Lasker, 1975), I showed from a combination of laboratory and field work that there a re criteria for characterizing a body of water as a good or poor feeding ground for first-fceding larval anchovy, Eigraulis mordax. The present study describes the results of a n environmental survey of the California Current based on this earlier work and delimits the area and time when first-feeding anchovy larvae can feed sufficiently to ensure survival.
Evidence is offered to suggest that monitoring the extent and aggregation of potential larval fish food particles over a spawning season along with selected environmental parameters may be a practical way to predict the relative degree of anchovy recruitment and the strength of the resultant year class. Sette (1943) in a prescient article anticipated that a me- teorological-oceanographic connection might be used to predict recruitment. Data given in this paper add strength to his premise.
THE NORTHERN ANCHOVY, ENGRAULIS MORDAS
T h e northern anchovy (Etigraulis mordax) spawns in the California C u r r m t , a broad sluggish (12 km/ day) southward moving current along the U.S. west coast and Baja California, Mexico (Kramer and Ahlstrom, 1968) which is characterized by gyres (Jones, 1971). T h e central sub-population of the northern anchovy, recently estimated a t 3 to 5 million metric tons in its spawning area of 80000 km2 (Smith, 1972) in 1974-1975, supported a 40000 metric ton

214 Reuben Lasker
i ! . .ANCHOVY EGGS ! ,,,I j MTHERNCALIFORNIA BIGHT I id
OCT *N APR JUL OCT JAN
MONTH
Figure 183. Annual spawning cycle (appearance of anchovy eggs) in the Southern California Bight; 8 year average from 1953 to 1960 (from Lasker and Smith, in press).
fishery in Mexico and a 110000 metric ton fishery in California. Mexico has announced its intention to exploit this resource at 500000 tons annually (Keir and Melcer, 1975).
The anchovy is highly fecund and a mature female is capable of producing thousands of eggs at a single spawning. Yet the larvae produced from eggs die at an exponential rate in the sea. Lasker and Smith (in press) have shown that on the average there is only
W
0.06% survival at 20 days of larval age for the north- ern anchovy, with 40 or more additional days still to go until metamorphosis, depending on temperature. Various explanations for this enormous mortality haw been suggested. Hjort's hypothesis (1914), that for a larva to survive it must have the correct food in the right density when it starts to feed and that thc success of a subsequent year class depends on this, has not been disproven and continues to be one of the most reasonable cxplanations for differential larval survival (May, 1974). Hjort's idea as restated by May (1974) is that the strength of a year class is determined by the availability of planktonic food shortly arter the larva's yolk-sac has been rxhausted.
Laboratory work on northern anchovy has showti that relatively high densities of food particles are needcd by first-feeding anchovy larvae to accouii t for: 1) their inefficient ability to capture food during the first fcw days of feeding (Hunter, 1972), 2) their relatively high metabolic requirement (Vlymcn, 1974),
Figure 184. Spatial and temporal distribution of first-fceding northri n anchovy larvnr iii the Southern California Bight and offshore zone. Symbols identify particular cruises as indicated on the abscissa.

The relation between oceanographic conditions and larval anchovy food in the California Current 21 5
Figure 185. Temperature profiles during five cruisrs from November 1974 to April 1975. Line 87 extends from Santa Monica Ray, California to offshore.
3) a small mouth size restricting the maximum par- ticle size that can be taken, and 4) the cessation of feeding a t night (Arthur, 1976). Hunter (in press) has calculated that approximately 230 food particles of about 50 pm in diameter (e.g., the size of the un- armoured dinoflagellate, Gymnodinium splendens) would have to be consumed per day by a first-feeding anchovy larva to meet its mctabolic requirement.
TEST xr SEA OF HJORT’S HYPOTHESIS
I n a n earlier investigation (Lasker, 1975), labora- tory-hatched first-feeding anchovy larvae were al- lowed to feed in natural sea water in March and April 1974 and in various densities of Gymnodinium sflendens in the laboratory. Both experiments showed that a full or partial filling of the gut over a n 8-hour period
required between 20 and 40 cells per millilitre in the larva’s environment. Cells smaller than 30 pm in “effective diameter”‘ were taken only occasionally (Laaker, 1975). Sufficiently high numbers of proper- size food organisms were found chiefly in well- developed chlorophyll maximum layers adjacent to the California coastline. A stormy period was effective in eliminating thc chlorophyll maximum layer and in diluting the potcntial food organisms (in this case the unarmourcd dinoflagellate, Gymnodinzum splendens) below the critical density needed for feeding. An unusual finding was that the dinoflagellate popu- lation extended for a t least 100 km along the shore.
Coulter Counter (Model Ta) was used to record the volumes of individual particles. Drsplte the fact that particles are varied in shape, in this study, sue5 were recorded by “effective diameter” as if all particles sampled were spheres.
~

216 Reuben Lasker
Figure 186. Temperature profiles during five cruises from November 1974 to April 1975. Line 90 extends from Dana Point, to offshore between Santa Catalina and San Clemente Islands.
The seaward extent of this huge “patch” was not ascertained (Lasker, 1975; Kiefer and Lasker, 1975).
The threshold for larval anchovy successful first- feeding was therefore defined as the presence of at least 30 cells/ml of particles 30 to 50 pm in effective diameter. Successful recruitment depends on the existence of sufficient areas containing such particles at proper densities and co-occurring with first-feeding anchovy larvae.
OBJECTIVES
To discover the extent, both horizontal and vertical, of larval anchovy feeding areas and how these change with time and a variety of oceanographic and me- teorological conditions, a survey ofinshore and offshore particle distributions was made off southern California
from September 1974 through September 1975. This period spanned a complete anchovy spawning season which normally occurs from January to May (Fig. 183). The temporal and spatial picture of the anchovy larva’s micro- and macro-environment was expected to suggest whether conditions were good for larval anchovy feeding and hence whether good or bad recruitment might be expected on the basis of larval food distribution.
Specifically, the following WCI’C nicasured: 1) thc extent, persistence and patchiness or organisms causing chlorophyll maximum layers, 2) the rclationship of these organisms to the distribution of first-feeding anchovy larvae, 3) the concentration of > 20 pm “effective diameter” particles and their size distri. bution, 4) the relationship of phyto- and microzoo- plankton patches to environmental conditions, e.g.,

The relation between oceanographic conditions and larval anchovy food in the California Current 2 17
Figure 187. Temperature profiles during fivc cruises from November 1974 to April 1975. Line '33 extends from 1)el Mar, California to offshore.
storms and upwelling, and 5 ) the nutritional value of the dominant larval anchovy food organisms.
METHODS
An intensive sampling pattern in the inshore zone (Fig. 182) was established during the regular Cali- fornia Cooperative Oceanic Fisheries Investigations (CalCOFI) survey using the RV "llavid Starr Jordan". This was done to determine the scaward extent of chlorophyll maximum layers shalloww than 30 m. Thirty metres depth was chosen bccausr Ahl- strom (1959) (data summarized by Hunter and Sanchez, 1976) showed that over 800,: of northern anchovy larvae smaller than 12 m m long are found
in water shalloiver than 30 m, while most yolk-sac and newly feeding larvae a re nearer the surface. Cruises of the RV "David Starr Jordan" were hrld about monthly from September 1974 through Scp- tembcr 1975.
A 3/4 1i.p. - 110 1' submersiblc centrifugal pump2 was used with 30 m of 2.54 cm imide diameter flexible hose dcployed over thc ship's side to detect chlorophyll and particle concentrations. A stream of water was ducted to a 'l'iirner fliiorometer onboard and thc chlorophyll depth profile recorded. Samples of water (200 ml) wrre taken from just under the surface and from the chlorophyll maximum layer for particle
. ~~
Prosser Industries, Inc., 900 E. Ball Road, Anaheim, Cali- fornia 92803 Pump No. 9-9 I 1-7.
218 Reuben Lasker
JANUARY, 24 'I975 FEBRUARY 22 1975 MARCH 21 1975
SURFACE ISOTHERMS "C
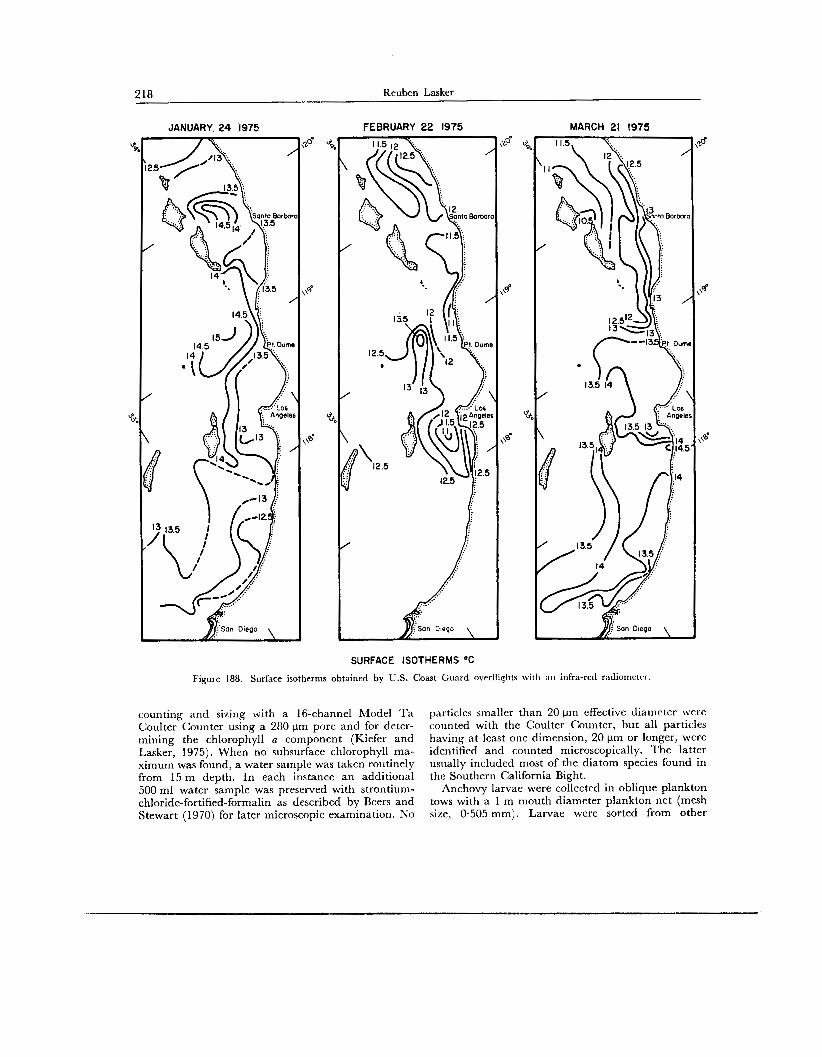
Figure 188. Surface isotherms obtained by U.S. Coast Guard overflights with a11 infra-red radiomctrr.
counting and sizing with a 16-channel Model l a Coulter Counter using a 280 ym pore and for deter- mining the chlorophyll a component (Kiefer and Lasker, 1975). When no subsurface chlorophyll ma- ximum was found, a water sample was taken routinely from 15 m depth. I n each instance a n additional 500 ml water sample was preserved with stroritium- chloride-fortified-formalin as described by Beers and Stewart (1970) for later microscopic examination. No
particles smaller than 20 prn effective diameter wcrc counted with the Coulter Counter, but all particles having a t least one dimension, 20 pm or longer, were identified and counted microscopically. T h e latter usually included most of the diatom species found in the Southern California Bight.
Anchovy larvae were collected in oblique plankton tows with a 1 m mouth diameter plankton net (mesh size, 0-505 mm) . Larvae were sorted from other

The relation between oceanographic conditions and larval anchovy focd in the California Current 2 19
SALINITY Wed LINE 90
Figure 189. IsohaIii~c\ along line 90, November 1974 to March 1q75.
plankton, measured and counted. Details of thcsc operations are given by Kramer et a1 (1972). Larval anchovy concentrations are given as numbers of larvae under 10 m z of sea surface.
Salinities and temperatures with depth were rc- corded a t each station with a Plessey STD. In Sep- tember 1974, February 1975 and June 1975, cruisrs by the Food Chain Research Group of the Scripps Institution of Oceanography occupied thrce regular CalCOFI transects and their information supplements that obtained by the R V "Jordan".
T h e CalCOFI basic station plan (Anon, 1963) shows the major stations occupied on every CalCOFI cruise. T h e three transects studied most intensively in this investigation were Lines 87, 90 and 93. T h e
relative positioiis of thcse threc transrcts are also shown in Figure 182.
OCEANOGRAPHY OF TIlE SOL'THERN CALlFORSlA
HIGHT DURING THE 1974-1973 NORTHERN ANCIIOVY
SPAWNING SEASON
Annual sfiawnirig seasun T h e distribution and aggregation of larval food,
composed of microplankton :> 30 pin effective dia- meter, is grcatly affected by currents, turbulencc, upwelling and downwclling. Therefore, oceanic con- ditions in the Southern California Bight were closely monitored during the 1974-1975 spawning of the

220 Reuben Lasker
I A a i g + & k i & + i ~ i ~ ~ ~ ~ ~ ~ ~ ~ ~ ~ g ~ ~ ~ ~ ~ ~ ~ ~ ~ ~ ~ o ~ o ~ ~ ~ o ~ o ~ ~ ~ o ~ o N N t O N N t O N N t O
DECEMBER JANUARY FEBRUARY MARCH APRIL MAY JUNE JULY AUGUST 1974 - 1975
Figure 190. North and south wind miles at San Clemente Island. Wind miles were calculated by multiplying hours and wind speed. Major upwelling was noted on February 22 after about a week of northerly winds.
northern anchovy. Usually, spawning by the northern anchovy occurs over the winter and early spring months, but mostly during February, March and April (Fig. 183). This temporal spawning pattern was repeated in 1974-1975 (Fig. 184). The February- March 1975 spawning in the Southern Califoi nia Bight was substantially greater than it had been in the previous five years (Smith, pers. comm.).
When plankton tows were made to samplc anchovy larvae and their food, vertical profiles of water tem- perature and salinity were taken simultaneously. A weather station on San Clemente Island provided wind and storm data.
WATER TEMPERATURES OF THE SOUTHERN CALIFORNIA BIGHT
Stable water temperatures were characteristic of the Southern California Bight from Scptembcr 1974 through early December 1971. For example, surfacc temperatures over the entire Bight were beheen 15°C and 17°C along the three major transects in thr Right, lines 87, 90 and 93 (Figs 185, 186 and 187) the first week of December. A sharp thermocline extrnded from the shore out to approximately 10 km and thc entire length of the bight, about 300 km. Surface cooling was particularly evident when the 12-17 January cruise was held. A decp (25-50 m) mixed layer of 12" to 13°C developed along line 87, and at 13" to 14°C along lines 90 and 93. In February, 11°C was common inshore and was indicative of a major upwelling event (Fig. 188).
SALINITY STRUCTURE OF THE SOUTHERN CALIFORNIA BIGHT
Southern California Bight water was generally less saline in mid-January (33.3-33*40/00 S) inshore than it was in early December (33.5-33450/00). No strong upwelling was evident. The hyposaline condition (33.3-33.4°/,0j (Fig. 189) can be explained bya south- ward flow next to the coast, associated with a clock- wise gyre typical of winter circulation in the southern part of the Bight (Jones, 1971).
UPWELLING
Strong upwclling began in February in the Bight aftrr the onset of northerly winds (Fig. 190) and was clearly evident from the appearance of depressed tempcratures (1 1"-12"C) inshore coincident with the apprarance of diatoms (see following section).
A series of storms with strong southerly winds started on 3 March and lasted one week. The appear- ance of higher salinities inshore indicated a northerly flow of water and convergence (downwelling) through- out the Bight. After this stormy period, upwelling recommenced as shown by the generally coldrr water inshorc and the upward thrust of the colder ( 1 1" and 12°C) isotherms in April (Figs 185, 186 and 187). Similar upwelled conditions prevailed through the following spring and summer months.
These data show that there was a typical winter circulation in the Southern California Bight. Generally calm conditions presaged the annual anchovy spawn- ing cycle. January in particular was not stormy but

The relation between oceanoeraDhic conditions and larval anchovy food in the California Current 22 1
SEP OCT ' NOV DEC
1974
VI
W
W
0 o_ . O
s VI . VI
W
W
g m 2
JAN ' FEE MAR ' APR ' MAY ' J U N JUL ' AUG
1975
UPWELLING INDEX WEEKLY MEANS 33.N 119"W
Figure 191. Upwelling index, September 1974-September 1975, calculated at Sari Clemente Island for the Southern California Bight. Upwelling is given as flow of water in m3 s-l 100 m-l of coastline (Bnkun, 1975).
there was sufficient water circulation and surface cool- ing in the Bight to obliterate the thermocline and, as will be seen from the following section, tc distributr potential larval fish food throughout the Bight. North- west winds (Fig. 190) prior to the 26 February to 3 March sampling cruise presumably caused diver- gence of water from the inshore zone resulting in a significant upwelling which was reversed in the days that followed. This alternation of upwelling and re- laxation over a 2-week period was associated with a thorough mixing of the upper isothermal (13O-14"C) layer. Two weeks later, in early April, upwelling was firmly established once more and continued through- out the rest of the spring and summer. This alternation of upwelling and relaxation, as shown by tcmperaturc profiles, is also r e k c t c d by Bakun's (1975) upwelling index for the 3" square encompassing the Southern California Bight and measured a t 33"2'N 118"36'M', a t the northern tip of San Clemente Island, 55 m elrvation (Fig. 19 1 ). Infra-red satellite photographs of the Southern California Bight and Baja California showed that upwelling had commenced a t least as early as 21 February 1975 and extended as far south as Vizcaino Bay a t that time, 723 km from Los Ange- les, California. This encompassed virtually the entirc larval anchovy's feeding grounds.
POTENTIAL LARVAL ANCHOVY FOOD PARTICLES IN THE SOUTHERN CALIFORNIA BIGHT, 1974-1975
I n March 1974, a t the height of the 1973-1974 anchovy spawning season, the unarmoured dinoflagel-
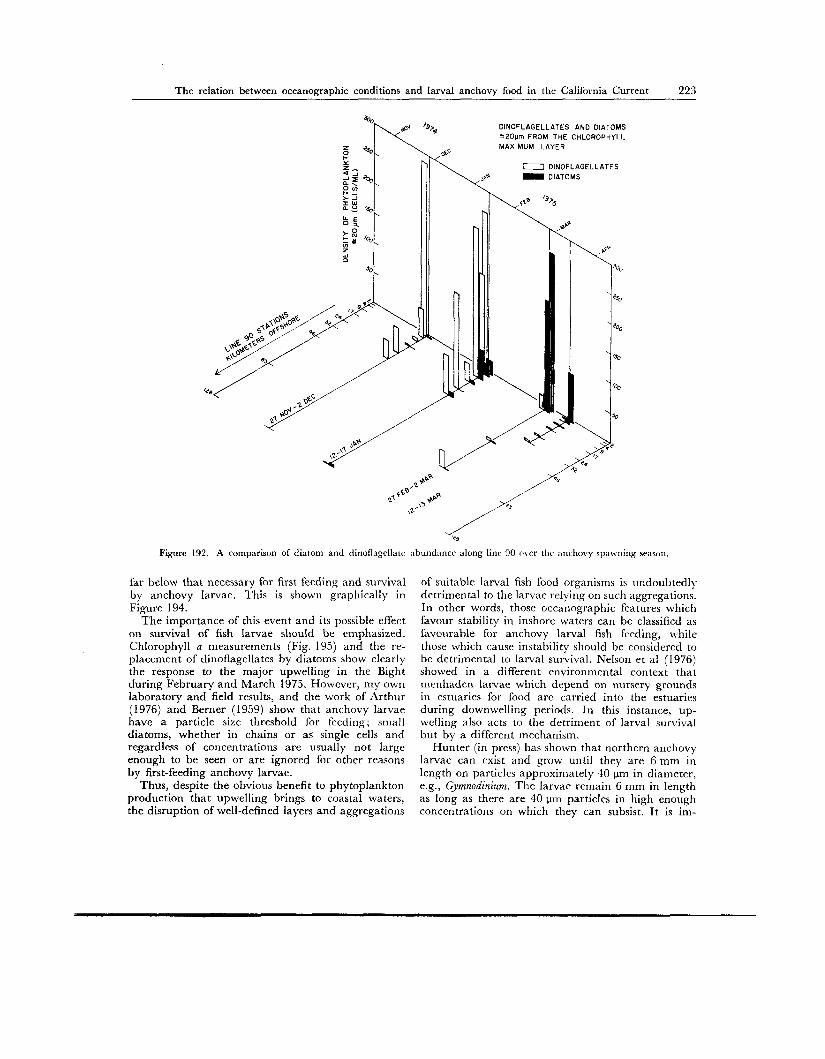
late Gymnodbiium splendens (30-50 ym effective dia- meter) was the dominant organism inhabiting inshore chlorophyll maximum layers (Lasker, 1975). By Sep- tember 1974, in the same inshore areas, the common red tide organism, the armoured dinoflagellate Goilyau- luxpolyedra dominated the chlorophyll maximum layers. G. splendens was no longer seen. T h e areal extent and temporal persistence of G. poCyedra was striking; an apparently continuous layer about 300 km long, and 5 km wide, extended from a t least Point Conception to San Diego ranging in concentration from 20 to 2000 cells/ml in the chlorophyll maximum until January 1975 when G. polyedra in relatively high con- centrations was distributed throughout the Southern Chlifornia Bight. Table 14 a n d Addendum summarize phytoplankton and microzooplankton species and relative densities along line 90 from September 1974 through .July 1975. T h e spatial and temporal distri- bution of dinoflagellates and diatoms is shown graphic- ally in Figure 192.
From September 1974 until early February 1975, G. polyedru was the numerically abundant organism in the size range eaten most often by first-fceding anchovy larvae. 'The high number of particles dis- played d o not occur throughout the watcr column, but rather appear either a t the surfacc or in well- defined chlorophyll maximum layers, most 15-20 ni below the surface. I n January (Fig. 193), G. polyedm was no longer confined to within a few kilometres of the shore, but was prevalent in high concentrations: i.e. > 35 cells/ml, throughout the Bight, presumably distributed by the usual winter gyral movement of

222 Reuben Lasker ~~ ~
Table 14. Species composition and relative numerical abundance of phytoplankton and microzooplankton along line 90 from September 1974 through September 1975. All stations were within 9.5 km. Stations and depths selected for this table had the highest overall concentrations of organisms. Note the dis- appearance of Gonyaulax PoCyedra and the appearance of diatoms after the early February sampling, presum- ably as a result of a major upwelling event.
Key; Cellslml: 0.1-0-9 (+); 1-9 (++); 10-99 ( + - I + ) ; 100-999 ( + + - I + ) .
CATF
OISTAhCE FROM
SHORF (KM)
AllD
OCPTII ( E l )
scp t2>3:?0.'74 0 03 kill
( 3 ~ 1 No',. :j:o:~19;!'
1 85 kiii ( 1 1 . 5 m )
9.45 km (14"))
0.91 knl
Cr.6-26, ' 7 5 1.85 km
ian.12-Feb.3'75
Feb. 26-Mar. 3' 75.
( In,)
(]Om)
1.85 km (17.5n)
lay 15-26,'75 4.08 kn
Kpr. 1-3,'75
! I s m ) h e 16-24,'7b
0.93 kni (12 d
Jme24-July 7,'7! 4.08 km
;ept.6-14,'72
0.93 km
( 10 no
(Surface)
'ept. 11-22 . '75
( 2 2 m) 1.85 km
DINOFLAGELLATE 5 DlATCllS
-++
I
water3 (Schwartzlose, 1963) and favourable conditions for reproduction. First-feeding anchovy larvae ap- peared in the Bight in January. Twenty-five first- feeding larvae of 253 examined in that month had discrete particles in their intestines ; sixteen of the twenty-five contained Conyaula~.~ Five weeks later, as
. ~~ ~
8 Advection of southerly water cannot he dismissed as a possibility.
4 While particle size and density are limiting characteristics for larval anchovy survival, the nutritive value of the food par-
a result of an upwelling which cncompassed the entire Bight, the number of particles with effective diameters of 30 pin and largcr over the entire area was reduced tides may also be an impcirtaiit factor. A number of feeding experiments with 1;iboratory cultured G. pobcdrn and laboratory hatched E . rnordm larvae showed that first-feeding larvae did not grow well on G.po[vedm as a sole diet, whereas they can on the unarnioured dinoflagellate Gyrntiodiniurn splendens (Scura and .Jcrde, 1977). A dominant, but nutritionally inadequate, food for anchovy larvae provides an additional cause for unfavour- able survival of an anchovy year class.
The relation between oceanographic conditions and larval anchovy food in the California Current 223
DINOFLAGELLATES AND DIATOMS r20Pl FROM THE CHLOROPHYLL MAXIMUM LAYER
D DINOFLAGELLATES - DIATOMS
%- Figure 192. A comparison of diatom and dinoflagellate ‘lbundance along line 90 over the anchovy spawning S C ~ S O I I .
far below that necessary for first feeding and survival by anchovy larvae. This is shown graphically in Figure 194.
T h e importance of this event and its possible effect o n survival of fish larvae should be emphasized. Chlorophyll a measurements (Fig. 195) and the re- placement of dinoflagellates by diatoms show clearly the response to the major upwelling in the Bight during February a n d March 1975. However, my own laboratory a n d field results, and the work of Arthur (1976) and Berner (1959) show that anchovy larvae have a particle size threshold for feeding; small diatoms, whether in chains or as single cells and regardless of concentrations a re usually not large enough to be seen or are ignored for other reasons by first-feeding anchovy larvae.
Thus, despite the obvious benefit to phytoplankton production that upwelling brings to coastal waters, the disruption of well-defined layers a n d aggregations
of suitable larval fish food organisms is undoubtedly detrimental to the larvae rrlying on such aggregations. In other words, those oceanographic features which favour stability in inshore waters can be classified as favourable for anchovy larval fish fceding, while those which cause instability should be considered to be detrimental to larval survival. Nelson et a1 (1976) showed in a different environmmtal context that menhaden larvae which depend on nursery grounds in estuaries for food are carried into the estuaries during downwelling periods. In this instance, up- welling also acts to the detriment of larval survival but by a different mechanism.
Hunter (in press) has shown that northern anchovy larvae can exist and grow until they a re 6 m m in length on particles approximately 40 pm in diameter, e.g., Gymnodinium. T h e larvae remain 6 m m in length as long as there are 40 pm particles in high enough concentrations on which they can subsist. I t is im-

Reuben Lasker 224
30'
340
NOVEMBER 26-DECEMBER 4, 1974-
-
- 30 1' 1 . . ' 1 , I I I ~ , I ' - r v - T r r T v
SURFACE CHLOROPHYLL MAXIMUM 1 MARCH 6-17, 1975
CHLO~OPHYLL MAX AT OEPTW 1
I-
30' ~
33' -
30' -
Y
Figure 193. The distribution of maximum counts of 30-50 pm particles in the Southern California Bight from November 26 1974 to March 17 1975. Note the inshore prrvalrnce of these particks in late Novembrr and their widespread distribution in January.
possible for them, because of physical limitations, to capture enough of these small particles once they have attained this size to d o a n y more than maintain their metabolic requirement. However, should larger par- ticles become available to them, enabling them to grow larger than 6 mm, this larger size precludes a n ability to resort solely to small particles once again and the larva becomes locked into eating larger par- ticles to meet its metabolic requirements. T h e im- plications of this are profound, i.e. from 6 m m on, anchovy larvae must encounter relatively high den- sities of larger particles to ensure their survival, yet
these densities have not often been found in the sea. I n other words, high densities of niicrozooplankters larger than 50 pm in diameter must exist, but a re not reported in the literature.
Counts of micronauplii were made for samples taken along line 90 with a plankton pump to see if minimum numbers, as calculated by Vlymen (1977), would be found during the spawning season of the anchovy. Concentrations of nauplii as high as this were encountered rarely. For example, only two in- shore water samples taken from the chlorophyll maxi- m u m layer, 0.9 km aport, showed 280 and 1 17 micro-

The relation between oceanographic conditions and larval anchovy food in the California Current 225
DATA FROM COULTER COUNTER MODEL T,
PARTICLE SIZE = 30-50 urn DIAMETER
-X MICROSCOPE COUNTS OF Gonvaulax polvedra
Figure 194. Spatial and temporal distribution of the highest number of 30-50 pm diameter ~ I I tirles found in the water columns throughout the Southern California Bight from September 1974 through September 1975. Note the high inshore particle con- rentrations in December and ,January.
zooplankters per litre, respectively. Both samples had the same size frequency distribution of organisms which included nauplii, copepod, post-nauplii and po- lychaete larvae. Nauplii were present in the greatest number in each sample (Fig. 196). Upwelling regions, as described in this paper, when they stimulate re- productive activity in copepods and other small plankters provide the necessary forage for anchovy larvae larger than 6 m m in length. If a larva grows to a larger size despite a dilution of its initial food during the upwelling process, the chances for survival may increase if regions of high naupliar and other microzooplankton densities a re established in the wake of a n upwelling event.
Throughout this study, concentrations of phyto- plankton and zooplankton have bcen reported as they were taken with a plankton pump, which undoubtedly reduces concentrations of organisms a t the opening of the pump and as water travels through the pipe to the shipboard Iahoratory. Thus, the key to defining microstratification, clumping and patchiness is the solution of a sampling problem for the particles which serve as food for fish larvae. Without doubt, there will be many areas found in the larval anchovy spawning ground which emulate the highest concentrations of organisms we have sampled with the techniques a t hand. T h e spatial distribution and temporal persist- ence of high larval food concentrations is a n important
15

226 Reuben Lasker
CHLOROPHYLL a PROFILES
SOUTHERN CALIFORNIA BIGHT
2’
a w
Figure 195. Chlorophyll a profiles for line 90 from November 1974 through early April 1975. High chlorophyll n in February is due to a diatom bloom (see Table 14).
area of study for elucidating the stock and recruitment relationship.
ACKNOWLEDGEMENTS
Thanks to Dr Richard W. Eppley, Mr Richard A. Schwartzlose and Ms Marcia Pollock who assisted me in all aspects of this work. I wish to acknowledge a grant from the Marine Research Committee of Cali- fornia for the purchase of a Coulter Counter and to the Brookhaven National Laboratory of ERDA for their generous monetary support. MARMAP (Marin Resources Monitoring, Assessment and Prediction) Contribution No. 123.
SUMMARY
1) Northern anchovy larvae require at first feeding, relatively high densities of 30-50 vm particles for metabolism and growth. During the 1975 anchovy spawning season, dinoflagellates met these conditions in the main inshore spawning area of the anchovy off California.
2) Stable oceanographic conditions which foster stratification are needed to maintain high densities of dinoflagellates.
3) When particle sizes and concentrations were mo- nitored over a complete anchovy spawning season in the Southern California Bight, it was seen that up- welling and storms could disrupt dinoflagellate layers. In February 1975, a massive upwelling throughout the Southern California Bight diluted dinoflagellate concentrations far below that needed by first-feeding anchovy larvae for metabolism and growth. 4) Despite the obvious value of upwelling to total
algal productivity the diatoms which are first pro- duced in numbers are too small or unacceptable behaviourally as food for first-feeding anchovy larvae.
5) Anchovy larvae can sustain themselves and grow to 6 mm on small particles. Once this size is attained further growth depends on large particles being eaten. Once larger particles are eaten the larva cannot rely on small particles any longer but must continue to seek and find large ones to maintain its metabolism.

The relation between oceanographic conditions and larval anchovy food in the California Current 227 ~
I COPEPOD
NAUPLI I ' POST NAUPLIAR ' POLYCHAETE COPEPODS
LARVAE 601- I 50 I n I
W I D T H OF ORGANISM (pm.)
Figure 196. Width frequency distribution of two samples of microzooplankton t iken in March 1976, 0.8 km apart within 2 knl of the shore. Closed circles indicate the sample taken nearest the shore.
6) Microzooplankters are generally larger than 40 pm in width but were rarely found in high enough concentration to serve as food for larger anchovy larvae.
7) The most dominant dinoflagellate present during the 1975 anchovy spawning season was found to be nutritionally deficient in laboratory experiments.
8) The presence of a nutritionally inadequate do- minant food as well as a massive upwelling in the midst of the anchovy spawning season suggests in- adequate feeding conditions for the 1975 year class of anchovy during larval development. If this hypo- thesis is correct, the 1975 year class of the northern anchovy will be a relatively poor one.
ADDENDUM A R ~ S U M E OF PHYTOPLANKTON DISTRIBUTION FROM SEPTEMBER 1974 THROUGH SEPTEMBER 1975 September 1974
In the cruise period 13-20 September 1974, micro- scope counts revealed that Gonyaulax polyedra was the dominant species of phytoplankton in the Southern California Bight, with the highest density (about 2000/ml) in Santa Monica Bay (line 87), 67/ml off Dana Point (line 90) and 20/ml off Del Mar (line 93). G. polyedra was concentrated in the inshore zone along
line 87, within 5-6 km offshore and within 3.7 kin for lines 90 and 93.
Other organisms common in the Bight a t the same timt. were the dinoflagellates Ceratium furca and Prorocentrum micans. C. furca averaged 10/ml on line 87 with a maximum of 27/ml. Lines 90 and 93 never had more than 2/ml of C. furca in September 1974. Prorocentrum micans averaged 5 5/ml for lines 87, 90 and 93. The maximum P. micans for line 87 was - 15/ml; - 10/ml for line 90 and - 6/ml for line 93.
Diatoms larger than 20 pm in effective diameter were not found at every station. Assorted diatom species were occasionally found in low concentrations ( 5 2/ml) along lines 87, 90 and 93. Highest densities were found on line 90, 1 km offshore with a maximum of 7/ml and 1-9 km offshore on line 93 with a maxi- mum of 15/ml.
The density of G. polyedra in Santa Monica Bay was high enough to be seen as a red tide, 1 and 2 km offshore, with chlorophyll a concentrations of 27 and 36 mg/m3 respectively. There was an average chloro- phyll a content of 0.73 mg/m3 along lines 90 and 93.
October 1974 On a special 1-day cruise 1 month later on 17 Oc-
tober 1974 off Dana Point (line 90), plankton pump samples were taken only from the inshore zone within
15.

228 Reuben Lasker
a boundary extending 9 km offshore to delineate the seaward extent of the G. pol3)edra aggregations. G. po- l3)edra was still the dominant species with C. furca second in number as it had been the previous month near line 90. Gonyaulax was concentrated within the first 7.4 km from shore, with a maximum number of 57/ml. However, it dropped off quickly in number at about 8.3 km offshore. Ceratium furca was also con- centrated within the first 7.4 km offshore with a maximum of 29/ml dropping off sharply at 8.3 km to 5 2/ml.
Diatoms larger than 20 pm effective diameter re- mained sparse (_< 2.5/ml), except for two inshore stations which had densities of 20/ml and 6/ml, half of which were species of Nitzschia.
November-December 1974 to
19 December 1974 showed that Gonyaulax polyedra remained the dominant species in the Southern California Bight. The number of G.polyedra was uniformly high at all the inshore stations, with den- sities of around 100/ml. Santa Monica Bay (line 87) again had the highest concentrations (870/ml).
C. furca continued to be found in small numbers, - < 5/ml over the entire Bight. No other dinoflagellates were in notably high concentrations.
of the number of dinoflagellates in the same size rarige along lines 83 (off Ventura, California) and 90, while line 87 had 8% diatoms to dinoflagellates.
The average chlorophyll a content for each line was 5 1 mg/m3, with the exception of line 87, which averaged 1.63 mg/m3. The maximum chlorophyll a for each transect was less than 4.0 mg/m3, again with the exception of line 87, which had a maximum of 10.37 mg/m3. As indicated in the previous section describing the oceanography of the Southern California Bight, no turbulent conditions were prevalent which could have disrupted the dinoflagellate concentrations.
JanuarpFebruary 1975 In the following month during 12 January to
3 February 1975, G.polyedra was not only found in high concentrations (- 100/ml) a t the inshore sta- tions, but occurred as far as 25 km offshore along lines 87 and 90, in relatively high numbers (see Fig. 193).
Diatoms5 increased moderately in number in the Species of Chaetaceros and Mtzschia were the most common
diatoms over the whole Bight. With respect to chain diatoms, each crll was counted microscopically as a single organism in those species whose single cell size was > 20 pm in any dimen- sion. Species with cells < 20 pm long were counted by chains. For example, because Chaetaceros cells are less than 20 pm long, the concentration per millilitre reflects the number of Chnsto- ceros chains, not individual cells in each chain.
A month later, sampling from 26 November
Diatoms were, on the average, less than 1
-~ -
entire Bight averaging 55/ml in chlorophyll maximum layers on line 81.5, 46/ml along line 87, and 17/ml along line 90. Diatoms became fewer in number beyond Station 90.30 (17 km from shore).
The average chlorophyll a content throughout the Southern California Bight was higher than in De- cember. Transects north of Dana Point had an average of about 2mg/ms chlorophyll a and < 1*5mg/m3 south of Dana Point. The maximum chlorophyll content, depending on the transect, varied from 1.5 to 4.3 mg/m3 (Fig. 195).
Water circulation in January favoured the hori- zontal distribution ofG.polyedra throughout the South- ern California Bight resulting in a large increase in areal distribution of this potential larval fish-food organism.
26 February-3 A4arch 1975 By the sampling period 26 February to 3 March,
there had been a sharp decline in the C.polyedra populations. Less than 10/ml were found within 18.5 km off the shore along lines 87, 90 and 93, while in general cell numbers above 25 cells/ml were only found far offshore (46 km) (Fig. 193).
Diatoms were higher in number than in January and were concentrated in the inshore zone. Various species of Nitzschia were most abundant in the Bight: N. paciJica, delicatissima, pugens and others. Species of' Chaetoceros were also common at stations where diatoms were > 80/ml, while the number of dinoflagellates was less than one quarter the number of diatoms. Line 90 had about 200 diatom cells or chains within 4 km offshore, while line 93 had 52 cells or chains per millilitre about 2 km offshore. This was the result of the strong upwelling period during February (see section on oceanography) characterized by cold water close inshore.
The chlorophyll a content became significantly higher inshore, The average chlorophyll a for lines 87, 90 and 93 were from 3 to 5*5mg/m3. Line 87 had the highest maximum value of 15 mg/m3 about 2 k m offshore. Lines 90 and 93 had the highest maximum value of 15 mg/m3 about 2 km offshore, and maxima of 5 and 8 mg/m3 respectively within 2 km offshore (see Fig. 195).
6-26 March 1975 The 6 March to 26 March cruise period was the
height of the northern anchovy spawning season (see following section). However, G. polyedra continued to diminish in number during March and reached a low concentration of 3/ml along line 90. This was charac- teristic of dinoflagellate conccntrations throughout the entire Bight.
The diatoms Chaetoceros and Nitzschia species re-

The relation between OceanoeraDhic conditions and larval anchovv food in the California Current 229
mained common although in lower number than in the previous weeks. Along line 90, the diatom con- centration peaked at 2 km offshore at 81 cells or chains per millilitre dropping to an average of 2/ml for the next 23.7 km offshore. The diatom populations on each sampled transect showed similar species com- position and numbers (Table 14).
1-3 April 1975 In early April, G. polyedra had virtually disappeared
from the Southern California Bight and the entire region was dominated by diatoms. The number of diatoms increased from March in the inshore zone. On line 87, a station -2 km offshore had a count of 76 diatoms/ml with a great deal of detritus < 20 pm in diameter in the water. At -3.5 km offshore, diatoms increased to 858/mI. On line 88.5 at a station -5 km offshore, the density of diatoms was 480/ml increasing to > 1000/ml about 8 to 9-5 km offshore. Line 90 had diatoms > 1000/ml 2 km offshore with small detritus 10-30 pm. Diatomsdropped to -300/ml, 4 km offshore and then to < 271/ml from 9-32 km offshore. Line 95 had over 3600 diatoms/ml within 3-7 km offshore. About 3500/ml of these diatoms were a chain diatom identified as a species of Leptoqlindricus (diameter 4-7 p). Species of Chaetoceros and Thalassio- thrixjrauenfeldii were the most common and abundant species of the Bight, with the exception of Leptocylin- dricus which was found in dense concentrations only along line 93. Of the total number of cells with dia- meters from 16.0 to 161 pm, the majority of cells (40-60%) fell in the 16-20 pm size range for lines 87, 90 and 93. Cells with effcctive diameters of 30- 50 pm, i.e. the size required by anchovy larvae at first feeding were frequently high, i.e. > 30 particles; ml in the Bight; but these were due to diatom chains and are not eaten by anchovy larvae (Lasker, 1975).
Dinoflagellates were less than 2% the number of diatoms at each station along lines 87, 88.5, 90 and 93 except for those at which the numbers of diatoms dropped to 5 27/ml. At these stations, both diatoms and dinoflagellates were similarly low in density.
The average chlorophyll a content in the beginning of April was -25% lower than the February-March cruises for line 90 with 2.4mg/m3 and line 93 with 3-8 mg/m3. Maximum chlorophyll values for lincs 90 and 93 were -8 and 6 mg/ni3, respcctively. Line 87 decreased also from an average of -5.5 rilg/m3 in February-March to -2 mg/m3 in April. From line 88.5 through 91.5, the average chlorophyll was around 2-5 mg/mS with a maximum of 7-8 mg/m3.
15-26 Afay 1975 Not a single G. polyedra was identified along line 90
during the May cruise.
Particle counts for 30-50 ym particles were even lower than during the April 1975 cruise. For example, along line 87 there was an average of 7/ml to 25 km offshore. Line 90 averaged only 17/ml within 4 km offshore. Line 93 had particle counts averaging 10/nil within 26 km offshore.
The diatom “bloom” of early April had dissipated by mid-May. On line 90, diatoms were 18/ml 2 km offshore. Further offshore the number of diatoms dropped to < 3/ml to as far as 32 km offshore.
Dinoflagellate concentrations were very low, < 7/ml, averaging < 2/ml for line 90. Not one species of dinoflagellates was especially common ; mostly mis- cellaneous unarmoured dinoflagellates were present.
The average chlorophyll a content for the Bight was < 1.5 mg/m3 during this period.
16 June-5 Juh 1975 Between 16 and 24 June particle counts for 30-
50 pm particles were 5 40/ml for lines 87, 90 and 93 with the exception of a station on line 87, about 1 km offshore which had 129/ml. Microscope counts of water from this station showed a large number of armoured dinoflagellates : Ceratium dens, C. furca, Dino- physis sp. and Peridinium sp.
On lines 90 and 93, dinoflagellates numbered, on the average, 3*5/ml with a maximum inshore of 12/ml. Species of Prorocentrum, Ceratium, Gymnodinium, and Peridinium were identified.
Within 2 km offshore there was an average of 44 diatoms/ml. At 46 and 83 km, diatoms averaged in number about 90/ml. Chain diatoms, Chaetoceros and Nitzschia, comprised the inshore diatoms. Farther offshore (46-83 km), Nitzschia was most numerous.
The chlorophyll a content had increased since the mid-May cruise. Line 87 had an average of -5 mg/m3; line 90, an average of 3 mg/m3. Line 93 remained about the same with an average of 2 mg,/ms.
The particle counts, species identification and chlorophyll a measurements were repeated for the entire Bight from 24 June through 7 July 1975. No major differences were seen in any of the measure- ment parameters.
6-22 September 1975 No cruises were held during late July or August.
In September, low numbers of 30-50 pm particles prevailed. Very low dinoflagellate counts were charactcristic.
20 October-2 Nooember 1975 Repeating the pattern of the previous year, a
dinoflagellate bloom was evident in October. All along the coast from line 83 down to line 95, micro- scope counts revealed Gymnodinium uberrimum (40-

230 Reuben Lasker
60 pm) to be the dominant organism. G. uberrimum numbered 40-50/ml along line 90 within 4 km offshore and was present in lesser concentrations (2-4/ml) out to 32 km offshore. Line 95 had 64/ml 4 km offshore. At a nearshore station on line 83, the density of G. uberrimum was 1363/m1.
Diatoms were slightly higher than during the 13-22 September cruise, especially in the inshore zone. Line 90 had a maximum of 15/ml. Line 83 had 28/ml. Nitzschia was the most common species.
There appeared to be an unusually high number of coccolithophores along line 90 from 9 km to 17 km offshore. The density of these organisms was 15- 19/ml. In past cruises, coccolithophores did not number more than -5/ml.
REFERENCES Ahlstrom, E. H. 1959. Vertical distribution of pelagic fish eggs
and larvae off California and Baja California. Fish. Bull. US., 60: 107-46.
Anon. 1963. CalCOFI Atlas of 10-meter temperatures and salini- ties 1949 through 1959. Calif. Coop. Oceanic Fish. Invest. Atlas No. 1.
Arthur, D. K. 1976. Food and feeding of larvae of three fishes occurring in the California Current, Sardinops sagax, Engruulis mordaw and Trachurus .ymmetricus. Fish. Bull. U S , 74: 1-14.
Bakun, A. 1975. Daily and weekly upwelling indices, west coast of North America, 1967-73. NOAA Tech. Rept. NMFS Spec. Sci. Rpt. Fisheries No. 693, 114 pp.
Beers, J. R. & Stewart, G. L. 1970. The preservation of acanthar- ians in fixed plankton samples. LimnoI. Oceanogr., 15: 82.5- 27.
Berner, L., Jr. 1959. The food of the larvae of the northern an- chovy Engmulis mordax. Bull. inter-Am. Trop. tuna Commn, 4: 1-22.
Hjort,J. 1914. Fluctuations in the great fisheries of northern Europe viewed in the light of biological research. Rapp. P.-v. Reun. Cons. perm. int. Explor. Mer, 20: 1-228.
Hjort, J. 1926. Fluctuations in the year classes of important food fishes. J. Cons. perm. int. Explor. Mer, 1 : 5-38.
Hunter, J.R. 1972. Swimming and feeding behavior of larval anchovy, Engrauh mordax. Fish. Bull. U.S., 70: 821-48.
Hunter, J. R. Behavior and survival of northern anchovy En- graulis mordax larvae. Calif. Coop. Oceanic Fish. Invest. Rep., 19. (In press).
Hunter, J. R. & Sanchez, C. 1976. Diel changes in swim-bladder inflation of the larvae of the northern anchovy, Engrnulis mordm. Fish. Bull. US.. 74: 847-55.
Jones, J. H. 1971. General circulation and water characteristics in the Southern California Bight. So. Calif. Coastal Water Rcs. Proj., Los Angeles, California, 37 pp.
Keir, R. S. & Melcer, J. 1975. Application of modern technology and management methods to the assessment of fisheries re- sources in Mexico. Inst. of Electrical & Electronics Enginerrs, Publ. 75 CHO 995-1 Dec, 480-83.
Kiefer, D. A. & Lasker, R. 1975. Two blooms of Gymnodinium splendens, an unarmored dinoflagellate. Fish. Bull. U.S., 73:
Kramer, D. & Ahlstrom, E. H. 1968. Distributional atlas of fish larvae in the California Current region: Northern anchovy, Engruulis mordax Girard, 1961 through 1965. Calif. Coop. Oceanic Fish. Invest. Atlas No. 9, 269 p.
Kramer, D., Kalin, M. J., Stevens, E. G., Thrailkill, .J. R. & Zweifel, J. R. 1972. Collecting and processing data OG fish eggs and larvae in the California Current Region. NOAA Tech. Rept. NMFS Circular No. 370, 38 p.
Lasker, R. 1975. Field criteria for survival of anchovy larvae: the relation between inshore chlorophyll maximum layers and successful first feeding. Fish. Bull. U.S., 73: 45362.
Lasker, R. & Smith, P. E. Estimation of the effects of environ- mental variations on the eggs and larvae of the northern an- chovy. Calif. Coop. Oceanic Fish. Invest. Rep., 19. (In press).
May, R. C. 1974. Larval mortality in marine fishes and the rritical period concept. In The Early Life History of Fish, pp. 3-19. Ed. by J. H. S. Blaxter. Springer-Verlag, Berlin, 765 pp.
Murphy, G. T. (Chairman) 1974. Report of the fourth session of the panel of experts on stock assessment on Peruvian an- choveta. Instituto drl Mar del Prrli (CallBo), Boletin 2 : 605- 719.
Nelson, M'. R., Ingham, M. C. & Schaaf, \V. E. 1977. Larval transport and year-class strength of Atlantic menhaden. Fish. Bull. U.S., 75: 23-41.
Schwartilose, R. A. 1963. Nearshore currents of the western United States and Baja California as mrasured by drift bottles. Calif. Coop. Oceanic Fish. Invest. Rrp., 9 : 15-22.
Scura, E. D. & Jerde, C.W. 1977. Various spccies of phyto- plankton as food for larval northern anchovy, Engradis mot- dnr. and relative nutritional value of the dinoflagellates Cym- nodinium splendens and Gonyaulax po!wdra. Fish. Bull. US.. 75 : 579-83.
Sette, 0. E. 1943. Studies on the Pacific pilchard or sardine (Snrdinops caerulen). I. Structure of a research program to determine how lisliing affects the resourcr. US. Dept. Interior, Fish & Wildl. Serv., Spec. Sri. Kept., 19: 1-27.
Simpson, A. C. 1956. The pelagic phase. In Sea Fisheries- their investigation in the anited Kingdom. Ed. by M. Graham. Edward Arnold (Publ.) Ltd., 487 pp.
Smith, P. E. 1972. The increase in spawning biomass of northern anchovy, Engraulis mordnx. Fish. Bull. U.S., 70: 849-74.
Soutar, A. & Isaacs, J. D. 1974. Abundance of pelagic fish during the 19th and 20th centuries as recorded in anaerobic sediment off the Californias. Fish. Bull. U.S., 72: 257-73.
Vlymen, W. J . 1974. Swimming energetics of the larval anchovy, kngraulis mordnx. Fish. Bull. US . , 7 2 : 885-99.
Vlymen, \V. J. 1977. A mathematical model of the relationship between larval anchovy (Engraulis mordax) growth, prry micro- distribution, and larval behavior. Env. Biol. Fish., 2 : 211-33.
675-78.
Printed in Denmark by Bianco Luno AIS