The Impoverishing Effect of Ill Health: Evidence from ... fileThe impoverishing effect of ill...
39
WWW.DAGLIANO.UNIMI.IT CENTRO STUDI LUCA D’AGLIANO DEVELOPMENT STUDIES WORKING PAPERS N. 243 April 2008 The Impoverishing Effect of Ill Health: Evidence from Western Balkans Mariapia Mendola * Caryn Bredenkamp ** Michele Gragnolati ** * University of Milano Bicocca and Centro Studi Luca d’Agliano ** The World Bank
Transcript of The Impoverishing Effect of Ill Health: Evidence from ... fileThe impoverishing effect of ill...

WWW.DAGLIANO.UNIMI.IT
CENTRO STUDI LUCA D’AGLIANO DEVELOPMENT STUDIES WORKING PAPERS
N. 243
April 2008
The Impoverishing Effect of Ill Health: Evidence from Western Balkans
Mariapia Mendola * Caryn Bredenkamp ** Michele Gragnolati **
* University of Milano Bicocca and Centro Studi Luca d’Agliano
** The World Bank

The impoverishing effect of ill health: Evidence from the Western Balkans*
Mariapia Mendola† University of Milan Bicocca
Caryn Bredenkamp§
The World Bank
Michele Gragnolati‡ The World Bank
March 2008
Abstract
This paper investigates the extent to which the health systems of the Western Balkans (Albania, Bosnia and Herzegovina, Montenegro, Serbia and Kosovo) have succeeded in providing financial protection against adverse health events. We examine disparities in health status, health care utilization and out-of-pocket payments for health care (including informal payments), and explore the impact of health care expenditures on household economic status and poverty. Data are drawn from LSMS surveys and methodologies include ‘catastrophic-health’ analysis, poverty incidence analysis adjusted for health payments, and multivariate regression analysis. On balance, we find that economic status is significantly associated with health care-seeking behavior in all transition economies and the cost of illness can increase the incidence and depth of poverty. The impoverishing effect of health expenditures is most severe in Albania and Kosovo, followed by Serbia, Bosnia and Herzegovina and Montenegro. Moreover, health care costs seem to place a heavier burden on the weakest strata of the population, such as children and people with chronic illness, with serious consequences for the breaking out of the illness-poverty vicious circle.
Keywords: Health system, Health care expenditure, Poverty, Western Balkans JEL Codes: H51, I10, I32, P36
* The authors wish to thank Ruslan Yemtsov and Rodica Cnobloch for their very helpful advice on the use of the data and poverty lines, Marinella Leone for excellent research assistance and participants in the International Conference on Comparative Development at the New Delhi Indian Statistical Institute for insightful comments. The findings, interpretations, and conclusions expressed in this paper are entirely those of the authors and do not necessarily represent the views of the organizations to which they are affiliated. The usual disclaimers apply. † Department of Economics, Università di Milano Bicocca, P.za dell'Ateneo Nuovo 1, 20126 Milano, Italy and Centro Studi Luca d'Agliano. E-mail: [email protected].§ The World Bank, MSN G7-701, 1818 H Street NW, Washington DC 20433, USA. E-mail: [email protected]. ‡ The World Bank Country Office, Fra Andjela Zvizdovica 1, Tower B/17, 71000 Sarajevo, Bosnia and Herzegovina. Email: [email protected]

1. Introduction
Major illness is widely acknowledged as one of the most sizeable and least predictable shocks to
economic well-being. Adverse health events impose both a direct cost, in terms of the price of
accessing health care, and an indirect cost, in terms of the loss of income associated with reduced
labor supply and productivity. In the absence of an adequate system of social protection, then,
illness can take a large toll on household well-being. Resource-poor households may be
compelled to trade the future welfare of all its members against current access to health care for
one of them, or opt for inappropriate, ineffective care or an insufficient quantity of care, and in so
doing, risk a vicious circle of poverty and illness (Gertler and Gruber 2002).
Health is a component of well-being so that if health affects household poverty, failure to
recognise the incidence (as well as the intensity) of out-of-pocket health payments could result in
misinterpretation of trends in poverty over time or of differences between countries (Deaton,
2003). Since out-of-pocket payments are the most important means of financing health care in
most developing countries, measuring the impoverishing effect of adverse health events may help
to make the leap from poverty reduction goals to welfare policy implications (see Krishna 2007).
The objective of this paper is to assess the extent to which the current health systems of the
Western Balkans are able to protect households from the impoverishing effects of adverse health
events. The four Western Balkan countries of Albania, Bosnia and Herzegovina, Serbia, and
Montenegro, and the province of Kosovo have all undergone significant transitions in the past
decade or two, which have followed a series of regional conflicts.4 After an initial phase focused
on macroeconomic stabilization and reconstruction, reforms are now focusing on enhancing
economic growth, promoting employment generation, and encouraging the containment and
4 Kosovo is a province of Serbia, administered by the United Nations, under UNSC resolution 1244. Its Provisional Institutions of Self-Government have recently declared independence from the Republic of Serbia, which contested the act, and, as the Republic of Kosovo, received partial recognition. For the purposes of this paper, Kosovo is treated as a separate unit of analysis. The Former Yugoslav Republic of Macedonia is excluded from the analysis because its last LSMS-type household survey was conducted in 1996. Since then, only household budget surveys have been completed but they do not contain the type of health expenditure data needed for comparative analysis.

3
efficiency of public spending5. In the health sector, all countries of the Western Balkans have
either initiated or are contemplating major reforms. The main challenge is to make progress
towards achieving health system objectives, namely improving population health status while
providing protection against the financial costs of illness and reducing poverty.
We use recent household surveys from Albania, Bosnia and Herzegovina, Montenegro, Serbia
and Kosovo in order to estimate the effect of health care expenditures on economic status and
poverty, as well as to explore economic inequalities in health status, health care utilization and
health care expenditure.
There is abundant anecdotal evidence on the economic impacts of adverse health shocks in both
developed and developing countries (Narayan, 2000; WHO, 2002). There is a lack of systematic
evidence, though, on poverty estimates adjusted for health care payments, especially in transitions
economies. Monitoring wellbeing and poverty as dependent on both income and health is of
crucial importance as to inform welfare policy decisions.
The idea that absolute income (and poverty) matters for health status has been developed decades
ago by providing cross-country evidence of a concave relationship between national income and
life expectancy (Preston, 1975). The same non-linearity has been observed much later within
(developed) countries by showing the protective effect of income and its diminishing returns (i.e.
as income increases, the shadow price of health care declines more for worse off people) (Strauss
and Thomas, 1998, Deaton, 2003).
On the other hand, the seminal work of Grossman (1972) has been very important in showing that
health status is the result of investing in ‘health capital’, which produces an outcome of healthy
time. This is to say that health matters for income as well. Beyond this, much of the economics
literature has been focused on the identification of the direction of causality, and often ‘third’
5 For an overview of the main patterns and historical trends of the health systems in the Western Balkans, see Bredenkamp and Gragnolati, 2007.
4
factors (such as age, sex, education) have been identified as important in the health-poverty nexus
(e.g. Case, 2001, Smith 2005). Gertler and Gruber (2002) provide evidence that illness reduces
labor supply and household income in Indonesia. Similarly Wagstaff (2005) finds evidence that
health shocks are associated with a reduction in consumption in Vietnam, in particular for
uninsured and better-off households (because the poor are ‘health-care rationed’). Dercon and
Krishnan (2000) show that in Ethiopia the consumption risks associated with health shocks are
not borne equally by all household members (see also Krishna, 2006). In addition, estimates are
available for at least six Latin American countries6 (Baeza and Packard 2005), China (Lindelow
and Wagstaff, 2005), Thailand (Limwattananon 2007), and fourteen Asian countries and
territories7 (Van Doorslaer et al. 2007). A recent WHO article, using survey data from 89
countries, finds that 3% of households in low-income countries, 1.8% of households in middle-
income countries and 0.6% of households in high-income countries incur catastrophic health
expenditures (Xu et al. 2007)8.
We add to this literature by providing new empirical evidence on the impoverishment impact of
health spending on poverty in five key transition economies of the Western Balkans, measuring
the actual costs of ill health and providing poverty estimates adjusted for health care payments.
To the best of our knowledge, the estimates presented here are the first available for the Western
Balkans.
The rest of the paper is organized as follows. In section 2 we discuss the institutional setting and
present our five survey data. Section 3 reports descriptive statistics of economic disparities in
health status, health care utilization and out-of-pocket payments for health care (including
informal payments) across countries and socio-economic groups. In section 4 we present the
‘catastrophic impact analysis’ of health care expenditure and the effects of these payments on
6 These include Argentina, Chile, Columbia, Ecuador, Honduras and Mexico. 7 These include, among others, Bangladesh, China, India, Nepal, Vietnam, Sri Lanka, Thailand, Malaysia and Kyrgyz Republic. 8 They consider catastrophic expenditure as having occurred when a household spends 40% of its capacity to pay (defined as total spending minus estimated food needs) on out-of-pocket health payments.

5
household economic status and poverty measures. Finally, in section 5 a set of country-specific
probit regressions are used to model the relationship between health status, health care utilization
and poverty. Section 6 concludes, suggesting implications for policy.
2. Data, measurement and context
2.1 Data
Data are drawn from recent household surveys, either official Living Standards and Measurement
Surveys (LSMS) or surveys that are considered LSMS equivalents. The typical health module
provides information on (i) health status, (ii) the utilization of health services, (ii) health
expenditures, and (iv) insurance status. The depth of the health section varies somewhat across
the surveys considered, with the most detailed information available for Albania and the least
detailed for Montenegro, but an effort has been made to recode data so that variables are as
homogenous as possible across data sets.
Data for Albania are from 2005, for Bosnia and Herzegovina from 2004, for Montenegro from
2004, for Serbia from 2003, and for Kosovo from 2000. Sample size, for the sample on which
there were observations for all variables included in the probit analyses, is 15,434 individual in
Albania, 2,325 in Bosnia and Herzegovina, 8,205 in Montenegro, 7,871 in Serbia, and 16,013 in
Kosovo. Throughout the analysis, sample weights are used to produce population estimates at the
country-level. Summary statistics for key variables are presented in the Appendix, Table A1.
2.2 Measurement
Health status is a complicated, multi-faceted phenomenon that is measured with substantial error,
especially when health status is derived from subjective responses by individuals in a sample
survey. The degree of measurement error may also vary systematically by factors such as the age
and gender of the respondent and the nature of the illness. In these surveys, health status measures
6
are self-reported, and a distinction is made between the severity of illness, namely chronic and
sudden/acute9.
Information is available in all surveys on the utilization and costs of different types of health
services, as well as medicines, although the types of services listed sometimes differs across
surveys. Also, information on health insurance is not available for Serbia and Kosovo (which has
no social health insurance scheme).
In most places (i.e. in Albania, Serbia and Kosovo), the questionnaires distinguish between
formal health payments, transportation costs and informal health expenses. Yet, although specific
questions were included in the LSMS on both formal charges for consultations and the value of
unofficial ‘gifts’ (in cash or in kind) made to the medical staff, it is likely that at least some
respondents may not know whether the formal charges they paid were ‘official’ or not. Under-
estimation of out-of-pocket payments for drugs and medical supplies is less likely because all
LSMS surveys distinguish between payments for drugs covered under a prescription and other
drugs.
A last source of heterogeneity across the health modules in the household surveys is the period
under analysis. Most questions refer to health-related events in the past 4 weeks, but some refer to
the past 12 or 14 months. An effort has been made to homogenize the time span, but imputed
figures should be treated with caution because health care utilization due to a sudden illness
shock may vary over time.
There are many approaches to measuring living standards, including direct approaches (e.g.
income, expenditure, or consumption) and proxy measures (e.g. the construction of asset indices).
We use total per capita expenditure as the main living standards measure, a decision that is driven
by data availability. In order to obtain this measure, households are ranked by real total
expenditure (consisting of all types of consumption by the households including food, non-food,
utilities and education expenses, as well as the use value of durable goods owned by the
9 The actual survey questions on health status, health care utilization and health insurance are given in Table A2.

7
household), adjusted for household size. Quintile measures of living standards, in which
households are classified into five equal-sized per capita consumption quintiles, are also used.
The concepts “poor” and “non-poor”, when used in this paper, refer to those below and above the
National Poverty Lines calculated in local currency units (LCU) by the World Bank Poverty
Assessment team (and henceforth referred to as the PA poverty line).
2.3 Context
This paper defines the Western Balkans as the four South Eastern European countries of Albania,
Bosnia and Herzegovina, Serbia and Montenegro, and the province of Kosovo. With the
exception of Albania, all of these countries were part of the former Socialist Federal Republic of
Yugoslavia (SFRY). The health system of the former Yugoslavia, referred to as the Stampar
model, was unique in Eastern Europe because it was funded from compulsory social insurance
contributions rather than the state budget. This financing mode persists in the new states and
social health insurance is the dominant form of health financing in Serbia, Montenegro, and
Bosnia and Herzegovina. The heritage of Albania’s health care system is very different. Based on
the former Soviet Semashko model, it was historically funded directly from the central
government budget, with central health allocations for different health inputs and for each health
care institution made according to population-based norms. Health insurance was only introduced
in 1995 and does not play as prominent a role in health financing as in other countries of the sub-
region. Kosovo has drafted a health insurance law, but there is not yet a health insurance fund in
the country and all health expenditure is financed from the general budget and user fees, with
some additional, but declining, off-budget donor support (Bredenkamp and Gragnolati, 2007).
Three main financing sources can be identified in the health sector. These include social health
insurance (i.e. compulsory contributions in the form of payroll taxes), governmental revenues (in
the form of direct and indirect taxes) and out-of-pocket payments (paid directly by the patient at
the point of service). In some countries, out-of-pocket expenditures may be inflated by informal

8
payments to health care providers. Informal payments are usually defined as payments in cash or
kind that recipients are not authorized to receive under the conditions of their contract or under
the statutes of the governing bodies of their parent organizations (Chawla 2005), but in some
places, informal payments can also take the form of genuine gifts given by patients to providers
in appreciation of their services.
A fourth potential source of financing is voluntary health insurance (which can be provided by
the public insurance provider or by the private sector) but this is not well-developed in the sub-
regions of the Western Balkans.
Table 1 reports the share of health care financing by different sources. The share of public health
care financing, including both social health insurance and general revenues, in total health care
revenues is substantial in at least some countries of the sub-region (in 2005 was equivalent to
around 70% in Serbia and Montenegro). Still, this was less than the share of public resources in
most of the EU-15 countries as well as in two comparator and former SFRY countries, Croatia
and Slovenia, where it was 81% and 77% respectively. Almost all remaining health care
expenditure is in the form of private out-of-pocket expenditures. In Albania and in Bosnia and
Herzegovina, more than half of total health care financing is in the form of out-of-pocket
payments made by households, potentially rendering the health systems in these countries less
accessible to the poor.
TABLE 1: Share of health care financing derived from different sources Public Private Tot. SHI General revenues OOP Private insurance Donors Western Balkans Albania 10.8 32.7 56.4 0.0 0.1 100 B.Hi 46.6 2.1 51.2 0.0 0.0 100 Kosovo 0.0 37.0 61.0 0.0 2.1 100 Serbia and Montenegro 52.6 16.9 27.6 2.9 0.0 100 Comparators Croatia 71.9 9.5 17.5 1.1 0.0 100 Slovenia 70.4 6.6 10.0 13.0 0.0 100 Source: WHO NHA database (from Bredenkamp and Gagnolati, 2007) Note: The definition of “private insurance” includes all prepaid, private risk-pooling plans; Kosovo data are for 2004.

9
3. Disparities in health status, health care utilization and health expenditure in the Western Balkans: descriptive statistics
There is substantial cross-country variation in self-reported morbidity, including both chronic and
sudden illness. Table 2 shows that while only 6% of Montenegrins report a chronic health
condition, about 14% of Albanians, 22% of Serbians, and 25% of people living in Bosnia and
Herzegovina do. For those countries for which data are available, the pattern of sudden morbidity
reveals a similar ranking, with the lowest incidence of sudden illness in Montenegro (7%),
followed by Albania (8%) and Serbia (14%).
There is substantial variation in the proportion of the population that sought any type of health
care in the four weeks prior to the survey. As few as 9% of the population of Montenegro sought
any type of health care in the four weeks prior to the survey, but the figure rises to 14% in
Albania, hovers around a fifth of the population in Kosovo and Serbia, and reaches almost a third
of the population in Bosnia and Herzegovina10. Around 4-5% of people in each country reported
being hospitalized in the previous year. Health care utilization appears to be higher in countries
with a higher incidence of illness, but since morbidity data is self-reported the causality could lie
in either direction. Again, rates vary by age and gender, with women more likely to seek medical
care than men, but gender differentials in health-seeking behavior disappear once differential
morbidity is controlled for.
As many as 95% of Montenegrin households are covered by health insurance. The figures are
much lower in Bosnia and Herzegovina (60%) and especially in Albania (37%), despite social
health insurance schemes.
10 Part of the reason why the figure for Montenegro may be lower than for other countries is that the survey was conducted only in May, and may be biased downwards by seasonal variations in the incidence of illness. This should be borne in mind throughout the whole analysis.
10
3.1 Demographic and geographic disparities in morbidity and healthcare utilization
Health status varies by age and gender in each country. Not surprisingly, both chronic and sudden
morbidity increase with age. Women generally report higher levels of chronic disease and sudden
morbidity than men in the same age group. Yet, male children (under the age of 15 years) in all
countries generally have a higher reported incidence of both chronic and sudden disease than
females in all countries. One explanation for this finding is that male children have intrinsically
poorer health status than female children. However, since it is the parent or guardian who reports
the health status of individuals below 15 years old, an alternative explanation is that the health
status of young males is systematically perceived more ‘carefully’ than that of female children,
which may have consequences for female health into adulthood.
Overall, there are only very small differences in reported chronic illness between people living in
rural areas and people living in urban areas (results not shown), but the incidence of sudden
illness is higher in rural areas than in urban areas in Albania and Serbia. There are no clear
systematic differences in health care utilization between urban and rural areas that hold across
countries. Utilization of outpatient health services appears to be greater among the urban
population than the rural population. Hospitalization does not vary much across urban and rural
area in Albania and Montenegro: in Bosnia and Herzegovina, hospitalization is greater in rural
areas, and in Kosovo, it is greater in urban areas. Health insurance coverage differs significantly
between urban and rural regions in both Albania and Bosnia and Herzegovina, but not in
Montenegro.

11
TABLE 2: Self-reported morbidity and health care utilization by age and gender (%)
Suffers from a chronic illness or disability*
Been ill in last 4 weeks
Sought (outpatient) medical care in last month**
Hospitalized in the last year***
Has health insurance
Men 0-15 2.46 11.65 9.77 2.84 36.10 16-64 12.48 4.22 8.46 2.83 33.36 65+ 55.54 16.65 39.24 9.39 69.80 Women 0-15 1.68 9.87 8.38 2.06 35.87 16-64 15.95 7.84 14.97 5.60 33.42 65+ 63.72 15.82 43.83 6.81 63.95 Total 14.38 8.36 13.50 4.04 36.95
Albania
Obs. (unweighted) 17,304 17,304 17,304 17,304 17,304
Men 0-15 3.41 na 15.79 0.00 66.74 16-64 15.78 na 17.76 3.23 56.43 65+ 59.87 na 48.16 11.12 64.32 Women 0-15 0.00 na 12.61 0.00 70.93 16-64 20.30 na 37.46 5.47 60.25 65+ 76.02 na 54.95 5.59 61.73 Total 25.37 na 30.73 4.80 59.16
Bosnia and Herzegovina
Obs. (unweighted) 9331 9331 9331 9331 9331
Men 0-15 5.40 4.60 6.03 Na 93.85 16-64 5.50 5.90 7.91 Na 95.68 65+ 15.00 18.00 15.73 Na 95.26 Women 0-15 4.80 3.40 7.01 Na 93.01 16-64 5.10 6.30 9.05 Na 95.50 65+ 23.00 23.00 19.98 Na 95.72 Total 6.30 6.60 8.61 Na 94.95
Montenegro
Obs. (unweighted) 8889 8889 8889 8889 8889
Men 0-15 4.17 11.78 17.37 3.96 Na 16-64 15.83 9.94 12.72 2.68 Na 65+ 56.98 23.56 37.43 11.19 Na Women 0-15 2.88 10.26 16.09 2.57 Na 16-64 20.54 15.11 21.61 4.66 Na 65+ 66.75 28.64 44.17 8.51 Na Total 22.12 14.35 20.73 4.52 Na
Serbia
Obs. (unweighted) 8027 8027 8027 8027 8027
Men 0-15 na na 13.79 3.62 Na 16-64 na na 18.33 24.82 Na 65+ na na 5.49 4.83 Na Women 0-15 na na 15.02 3.13 Na 16-64 na na 20.36 21.12 Na 65+ na na 5.72 6.01 Na Total na na 17.85 4.82 Na
Kosovo
Obs. (unweighted) 17917 17917 17917 17917 17917 * The precise definition of morbidity concepts differs somewhat across survey instruments. Table A2 in the Appendix lists the actual questions asked in survey. **Percentages refer to the past 4 weeks for all except Bosnia and Herzegovina where they refer to the past 14 months. ***Percentages refer to the past 12 months for all except Bosnia and Herzegovina where they refer to the past 14 months.

12
3.2 Economic disparities
In Table 3, the relationship between the economic status of the household, on the one hand, and
health status and health seeking behavior, on the other hand, is examined. One cannot generalize
about the relationship between economic status and health care utilization. While in Serbia and
Kosovo, there is not much variation in hospital utilization across consumption quintiles, in
Albania and Bosnia and Herzegovina health care utilization falls slightly as economic status
increases. Utilization of treatment for acute care is more closely related to economic status than
utilization of hospital care, and in all countries utilization of outpatient care tends to increases as
economic status improves. The extent of variation across quintiles differs from place to place,
though: it is very small in Albania, in Serbia and Kosovo, but nearly doubles in Montenegro.
In Albania, Serbia and Montenegro (i.e. the three countries for which sudden illness data are
available) the incidence of sudden illness falls as economic status rises, in general, but in Serbia
and Montenegro, the incidence of acute illness rises sharply again in the richest quintile where a
very high incidence of illness is reported. This result could be explained by the possibility that
those in the richest quintile are more knowledgeable about their health status because they can
afford to have their illnesses diagnosed. There is no clear variation in the incidence of chronic
illness across quintiles. This may be the direct consequence of the difficulties of access to
preventive health services by poor people, leaving them more vulnerable to illness. Yet, factors
that influence illness perception and health seeking behavior are complex. One argument
proposed in the literature is that the very poor, lacking the resources to access medical care easily,
define illness more narrowly than those able to afford treatment (Falkingham, 2004). The poor
may also defer health care utilization until their illness is severe.

13
There is a very strong direct relationship between economic status and health insurance in all
countries for which the information is available: a greater percentage of people in the upper
quintiles have health insurance than in the lower quintiles.
An examination of the relationship between economic status and the type of health care utilized
(Table 4) shows that, with occasional exceptions, the poor systematically use less of almost every
type of health service that those who are better-off. These services include both public and private
care, such as public ambulatory care, providers of alternative medicine, inpatient hospital care,
private doctors, private nurses and dentists. A noteworthy exception is Montenegro where a
greater percentage of the poor than the rich utilize hospital care, but this could be the result of the
fact that the hospital care variable for Montenegro also includes outpatient care, for which private
doctors are a substitute. With the exception of Montenegro, the consumption of non-prescription
medicine is also significantly higher among the non-poor than the poor; for some countries, the
magnitude of difference is substantial, e.g. in Serbia where consumption is double.
3.3 Geographic and economic disparities in out-of-pocket expenditures
Out-of-pocket expenditures constitute a fairly large share of total health care expenditure in the
Western Balkans. The magnitude of out-of-pocket expenditure is driven by factors such as the
level of co-payments, the prevalence of informal payments, the use of private providers and
coverage by social health insurance. In some countries, and for some population groups, the
magnitude of these expenditures is sufficient to have a substantial impoverishing effect on
households.
The available data enable one to distinguish between expenditure at different types of health care
facilities, such as public, private, inpatient and out-patient, and also between different types of
expenditures, namely general health care expenditure (including primarily medicines, along with

14
treatment and laboratory costs), transportation expenditure and informal expenditures (which are
unofficial, but typically not voluntary)11.
TABLE 3: Self-reported morbidity and health care utilization, by economic status (%)
Quintiles of per capita consumption Poorest 2 3 4 Richest
Suffer chronic illness 13.41 15.39 14.29 15.07 14.30 Suffer sudden illness 8.69 8.69 8.42 7.69 7.65 Sought medical assistance / outpatient* 11.75 15.24 13.58 14.05 13.86 Hospitalized in the last year** 4.38 4.47 3.87 3.54 3.34
Albania
People with health insurance 27.77 34.79 43.01 42.37 47.10
Suffer chronic illness 26.00 24.00 25.00 28.00 26.00 Sought medical assistance / outpatient* 22.34 26.81 32.46 34.29 39.61 Hospitalized in the last year** 4.41 4.78 4.55 5.98 4.20
Bosnia and Herzegovina
People with health insurance 47.84 56.87 59.05 62.35 71.72
Suffer chronic illness 5.30 5.10 7.50 5.10 8.50 Suffer sudden illness 8.00 8.00 6.50 4.10 7.20 Sought medical assistance / outpatient* 7.50 8.12 8.27 5.67 14.30
Montenegro
People with health insurance 95.22 94.57 93.22 94.10 97.98
Suffer chronic illness 21.34 22.76 24.13 20.80 21.55 Suffer sudden illness 15.02 15.11 13.22 12.05 16.37 Sought medical assistance / outpatient* 18.88 20.48 21.79 20.56 22.07
Serbia
Hospitalized in the last year** 4.67 3.94 5.23 4.57 4.17
Sought medical assistance / outpatient* 17.75 16.44 17.42 18.42 19.73 Kosovo Hospitalized in the last year** 4.68 4.51 4.26 4.82 5.42
*Percentages refer to the past 4 weeks for all except Bosnia and Herzegovina where they refer to the past 14 months. **Percentages refer to the past 12 months for all except Bosnia and Herzegovina where they refer to the past 14 months.
11 Distinguishing between formal and informal payments for health services is challenging. Although the LSMS includes specific questions to distinguish between official charges for consultations and the value of unofficial ‘gifts’ made to the medical staff, it is likely that some respondents could have been unclear whether ‘charges’ demanded by medical personnel prior the consultation were ‘official’ (i.e. legally sanctioned) or not (alternatively, people report paying an official fee, which is likely to be in fact unofficial

TABLE 4: Type of health care utilization by poverty status using PA poverty lines (%)
Albania Bosnia and
Herzegovina Montenegro Serbia Kosovo
Non-poor Poor
Non-poor Poor
Non-poor Poor
Non-poor Poor
Non-poor Poor
Public ambulatory 9.53** 8.28** 36.67*** 27.96*** 70.41 61.6 22.74** 17.03** 15.98** 14.70**
Hospital (outpatient) 3.54 3.58 na na na na na na na Na Popular doctor/ alternative medicine 0.37** 0.16** 2.44*** 0.95*** na na 1.01 0.58 na Na
Private doctor 1.39* 0.99* 8.39*** 4.34*** 3.41 0.54 2.37*** 0.48*** 2.83 2.88
Private nurse 1.38 1.41 0.67 0.26 1.08 0.00 na na 1.00 1.15
Health service abroad na na na na na na 0.13 0.00 na Na
Other na na 15.49*** 10.78*** 3.90* 0.00 na na 2.75 2.84 Non-prescription medicines 16.32*** 12.4*** 42.98*** 36.49*** 0.02** 0.01** 22 .48*** 10.24*** 10.28*** 8.52***
Hospital (inpatient)* 3.93 4.37 4.99 3.93 21.20*** 37.86*** 5.09 3.94 5.1 4.69
Dentist 22.03*** 12.44*** 28.13*** 19.00*** 0.02*** 0.00*** 7.54*** 2.72*** na Na
PA Poverty Line 5145,33 New Lek/pc /per month
2223.146 KM/pc/ per year
90.34 Euro/pc/ per month
4111.31 Dinars/pc/ per month
106.689 DM/pc/per month
Note: *In Montenegro, the data include outpatient care at hospitals.
* significant at 10%; ** significant at 5%; *** significant at 1%
The amount paid for health care services varies across types of expenditures and regions (results
not reported). While publicly-provided health care is generally less expensive than private care,
health care expenditure at public facilities can be considerable, especially for poor people living
in rural or remote regions. On average, people living in rural areas spend more on public health
care and inpatient hospitalization than people living in urban areas. Moreover, people living
outside the city bear significantly higher transportation costs and make larger informal payments.
Several factors may explain the difference in public health expenditure by people in urban areas
compared to those in the countryside. Data show that in all countries (except Bosnia and
Herzegovina), people living in rural areas have higher rates of inpatient utilization. Higher out-of-
pocket payments in rural areas could also be explained by the fact that insurance coverage tends
to be lower in rural areas, at least for the countries for which data are available. Another
possibility is that people in urban areas have lower health expenditure in the public sector because
they use private facilities instead – indeed, data show that people in urban areas spend more on
private health care, on average, than those in rural areas. Structural factors affecting the
16
availability of health care and the costs of health care inputs may also result in a lower cost of
health care in urban areas than in rural areas12.
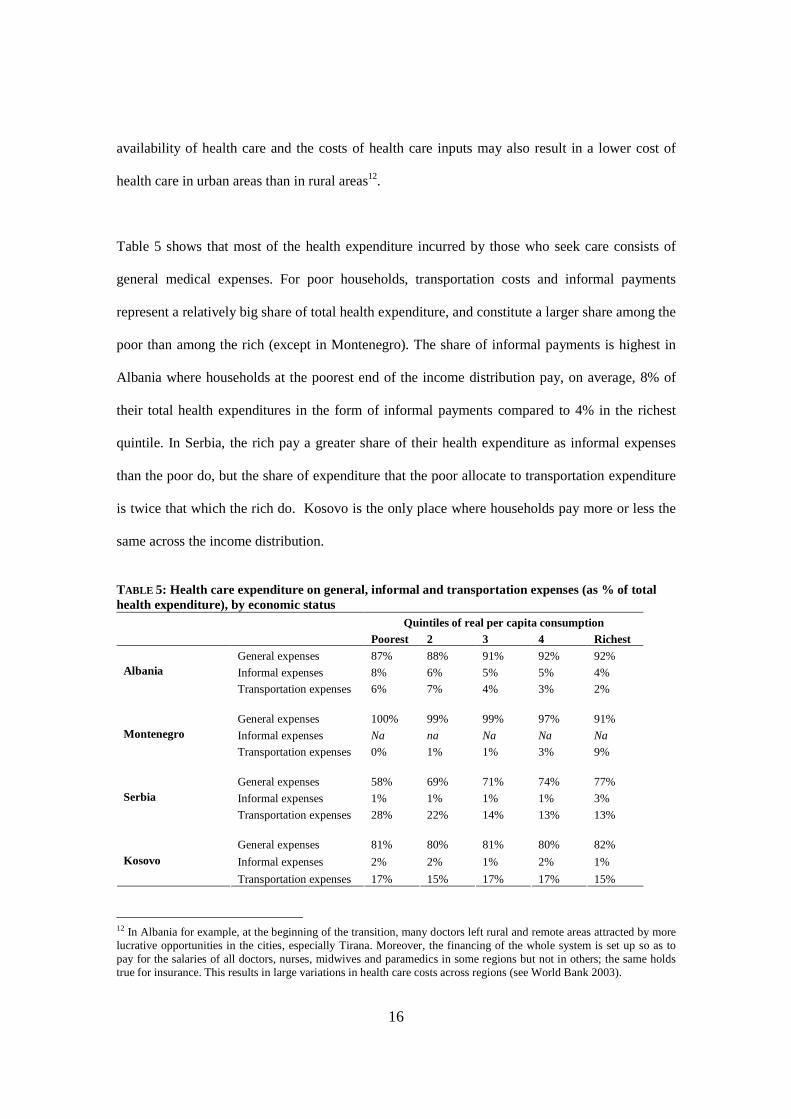
Table 5 shows that most of the health expenditure incurred by those who seek care consists of
general medical expenses. For poor households, transportation costs and informal payments
represent a relatively big share of total health expenditure, and constitute a larger share among the
poor than among the rich (except in Montenegro). The share of informal payments is highest in
Albania where households at the poorest end of the income distribution pay, on average, 8% of
their total health expenditures in the form of informal payments compared to 4% in the richest
quintile. In Serbia, the rich pay a greater share of their health expenditure as informal expenses
than the poor do, but the share of expenditure that the poor allocate to transportation expenditure
is twice that which the rich do. Kosovo is the only place where households pay more or less the
same across the income distribution.
TABLE 5: Health care expenditure on general, informal and transportation expenses (as % of total health expenditure), by economic status
Quintiles of real per capita consumption Poorest 2 3 4 Richest
General expenses 87% 88% 91% 92% 92%
Informal expenses 8% 6% 5% 5% 4% Albania
Transportation expenses 6% 7% 4% 3% 2%
General expenses 100% 99% 99% 97% 91%
Informal expenses Na na Na Na Na Montenegro
Transportation expenses 0% 1% 1% 3% 9%
General expenses 58% 69% 71% 74% 77%
Informal expenses 1% 1% 1% 1% 3% Serbia
Transportation expenses 28% 22% 14% 13% 13%
General expenses 81% 80% 81% 80% 82%
Informal expenses 2% 2% 1% 2% 1% Kosovo
Transportation expenses 17% 15% 17% 17% 15%
12 In Albania for example, at the beginning of the transition, many doctors left rural and remote areas attracted by more lucrative opportunities in the cities, especially Tirana. Moreover, the financing of the whole system is set up so as to pay for the salaries of all doctors, nurses, midwives and paramedics in some regions but not in others; the same holds true for insurance. This results in large variations in health care costs across regions (see World Bank 2003).

17
Total health expenditure can be considerable especially for the poor. In Table 6, we present health
expenditure as a percentage of total gross expenditure, by per capita consumption quintile13. On
average, households belonging to the bottom fifth of the consumption distribution spend less in
level but more in percentage terms on total health care (including transportation costs and
informal payments) than households in the richest quintiles. In Albania the poorest spend about
half of what the richest spend for health care, but these expenses represent twice the share of total
expenditure. In Kosovo, as well, the highest burden of health expenditure is borne by the poorest
quintile of the population: the poor spend about the same as the rich on health care, but this
expense represents 13 percent of their total consumption compared to 4 percent for the richest. By
contrast, in Bosnia and Herzegovina, Serbia and Montenegro, the poor spend much less than the
rich for health care and the share of total household expenditure devoted to health care is more
similar across quintiles.
13 There are methodological issues concerning the construction of both the consumption aggregate and per capita monthly health expenditure. The former is given in the datasets but the methodology to construct the figure may differ across countries; the latter is constructed by the aggregation of individual responses at household level and thereafter adjusted for the value for the household size. Total gross consumption is the sum of the two.

TABLE 6: Health-care expenditure as % of gross expenditure* (among those who seek care), by quintile Albania Bosnia and Herzegovina
Poorest 2 3 4 Richest TOT Poorest 2 3 4 Richest TOT General official exp 7% 6% 6% 5% 4% 5% Na Na na na na na Informal exp. 1% 1% 1% 0% 0% 0% Na Na na na na na Transport exp. 1% 0% 0% 0% 0% 0% Na Na na na na Na TOT health exp. 8% 7% 7% 5% 4% 6% 2.3% 1.6% 1.6% 1.5% 1.2% 1.7% Health exp (monthly, pc) 449.68 665.99 737.28 748.23 939.80 709.58 4.16 3.95 5.07 6.49 7.71 5.1992 Tot gross exp. (monthly, pc) 4708.04 7182.29 9354.40 12171.27 20008.06 10755.93 157.99 231.65 301.82 398.29 643.05 315.9 Tot net exp. (excluding health), pc 4258.37 6516.30 8617.12 11423.04 19068.27 10046.36 153.83 227.71 296.75 391.80 635.35 310.7
Montenegro Serbia Continued: Poorest 2 3 4 Richest TOT Poorest 2 3 4 Richest TOT General official exp 0.8% 0.8% 1.2% 1.2% 1.1% 1.0% 3.8% 3.9% 4.3% 2.8% 3.3% 3.6% Informal exp. Na na Na na na na 0.03% 0.01% 0.02% 0.02% 0.07% 0.03% Transport exp. 0.0% 0.0% 0.0% 0.0% 0.0% 0.0% 0.62% 0.57% 0.36% 0.28% 0.18% 0.41% TOT health exp. 0.8% 0.8% 1.2% 1.2% 1.1% 1.1% 4.4% 4.4% 4.6% 3.1% 3.6% 4.1% Health exp (monthly, pc) 0.74 1.08 2.16 3.73 4.72 2.81 216.99 350.19 483.55 372.16 703.26 417.33 Tot gross exp. (monthly, pc) 84.81 131.33 174.34 229.35 398.28 225.69 3912.35 6134.71 8190.05 10508.48 17548.36 9022.11 Tot net exp. (excluding health), pc 84.07 130.24 172.17 225.62 393.56 222.87 3695.35 5784.52 7706.50 10136.33 16845.10 8604.78
Kosovo Continued: Poorest 2 3 4 Richest TOT General official exp 11% 8% 6% 5% 3% 7% Informal exp. 0% 0% 0% 0% 0% 0% Transport exp. 2% 1% 1% 1% 0% 1% TOT health exp. 13% 9% 7% 6% 4% 8% Health exp (monthly, pc) 12.14 10.14 10.7 10.09 11.21 10.88 Tot gross exp. (monthly, pc) 63.47 92.59 120.42 157.77 272.66 141.71 Tot net exp. (excluding health), pc 51.34 82.46 109.71 147.69 261.45 130.83 *Total per capita health expenditure was added to total per capita household expenditure to obtain gross expenditure figures. However, the consumption quintile distribution does not include health expenditure
19
4. ‘Catastrophic’ health care payments and their ‘impact’ on poverty
Illness can induce a sizable and unpredictable shock to a household’s living standards How far the
health systems of the Western Balkans are successful in providing financial protection against adverse
health events? How far large and unpredictable health payments can expose households to
considerable (catastrophic) financial risk and result in household impoverishment? In order to answer
these questions two different methodologies are used to assess the financial impact of health care
expenditures on households wellbeing: (i) the incidence and intensity of catastrophic health care
payments, and (ii) the effect of out-of-pocket payments on poverty headcount and poverty gap
measures. The analysis of ‘catastrophic’ expenditure on health care involves measuring the extent to
which health costs incurred exceed or fall short of different threshold levels, i.e. the degree of
‘catastrophe’ experience by a household, and the impact on poverty measures. The second approach
relies on the conception of fairness in payments for health care in that spending on health care should
not push households into poverty—or deepen existing poverty (see Wagstaff and van Doorslaer 2003).
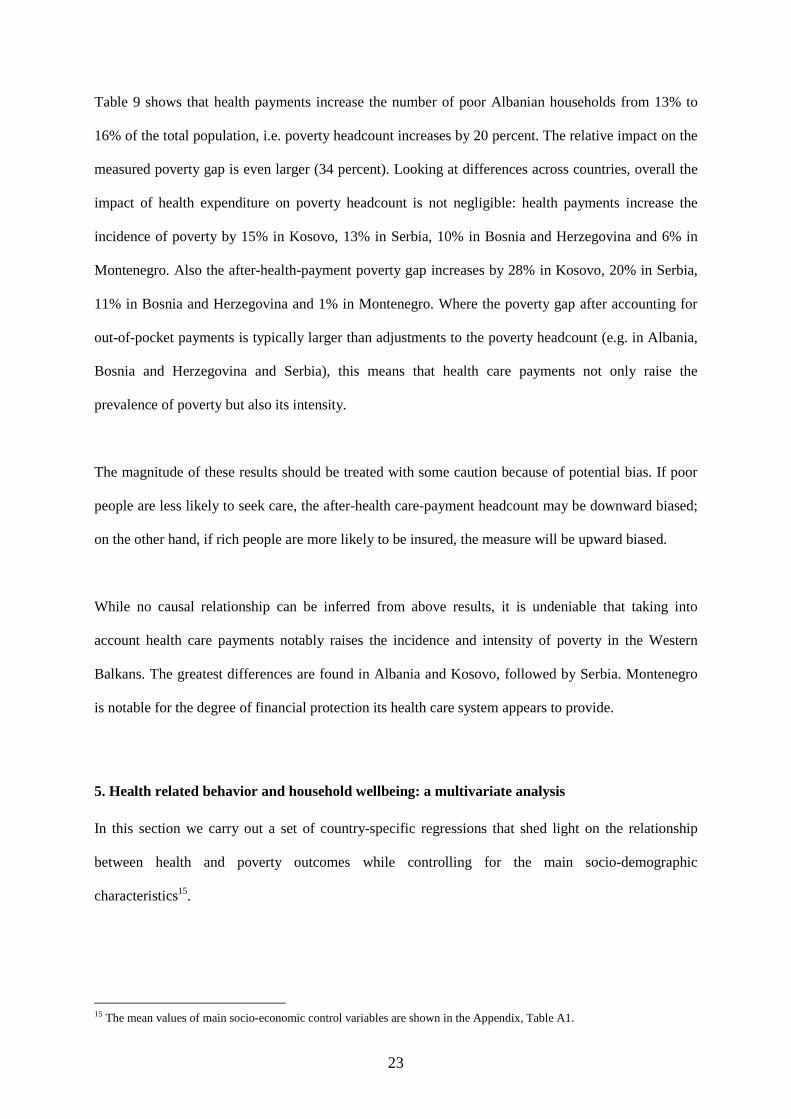
Table 7 presents the incidence (headcount) and the intensity (gap) of catastrophic out-of-pocket
payments. The headcount is the percentage of individuals whose health care costs, expressed as a
proportion of income, exceed a given discretionary fraction of their income, z; the mean gap is the
average amount by which payments as a proportion of income exceed the threshold z. The incidence
and intensity of the occurrence, though, are related through the mean positive gap (MPG) which is
defined as the gap over the headcount14. The sensitivity of the analyses to different threshold levels is
tested.
14 The headcount, H, only captures the incidence of any catastrophes occurring, while the gap, G, also captures the intensity of the occurrence. They are related through the mean positive gap which is defined as
H
GMPG = . Because this implies MPGHG *= , it means that the overall ‘mean catastrophic gap’ equals the fraction with
catastrophic payments times the mean positive gap.

20
TABLE 7: Catastrophic impact of out-of-pocket payment – at various threshold levels Out-of-pocket health expenditure Threshold level z (as % of tot expenditure per capita) 5% 10% 15% 25%
Headcount 36.55% 20.79% 12.58% 5.12% Mean gap 3.58% 2.19% 1.36% 0.52% Albania Mean positive gap 9.79% 10.53% 10.81% 10.16%
Headcount 7.83% 3.10% 1.29% 0.35% Mean gap 0.47% 0.21% 0.12% 0.04%
Bosnia and Herzegovina
Mean positive gap 6.00% 6.77% 9.30% 11.43%
Headcount 5.84% 1.14% 0.70% 0.15% Mean gap 0.23% 0.12% 0.07% 0.04% Montenegro Mean positive gap 3.94% 10.53% 10.00% 26.67%
Headcount 23.83% 12.22% 7.64% 3.52% Mean gap 2.28% 1.44% 0.97% 0.46% Serbia Mean positive gap 9.58% 11.76% 12.67% 13.12%
Headcount 44.73% 26.32% 15.35% 6.73%
Mean gap 4.59% 2.87% 1.86% 0.83% Kosovo Mean positive gap 10.26% 10.90% 12.08% 12.29%
The table shows that in Albania, for instance, as much as 5% of the sample recorded out-of-pocket
payments (as proportion of income) that exceeded 25% of their pre-payment income, with an average
degree of 0.5%. Decreasing the threshold level to 10% raises the proportion of the population with
catastrophic payments to almost 21%, while the mean gap rises to 2%. As expected, both the incidence
and intensity are larger when catastrophe is defined at a lower threshold. As thresholds increase, the
MPG increases in all countries. It is therefore clear that most of the increase in the MPG is due to a
modest decline in the mean gap relative to the headcount as the threshold is raised. The ‘catastrophic’
effect of health costs manifests itself more as an increase in poverty incidence than a deepening of
poverty among those who are already poor.
The variation in catastrophic health payments across Balkan countries is also illustrated graphically in
Figure 1 which shows, for each country, the share of health expenses or out-of-pocket payments
(OOP) by cumulative percentage of population, ranked by decreasing payment fraction. The horizontal
axis in Figure 1 shows the cumulative share of the sample, ordered by the health expenditure ratio,
beginning with individuals with the smallest ratio, while the vertical axis shows the oop as a
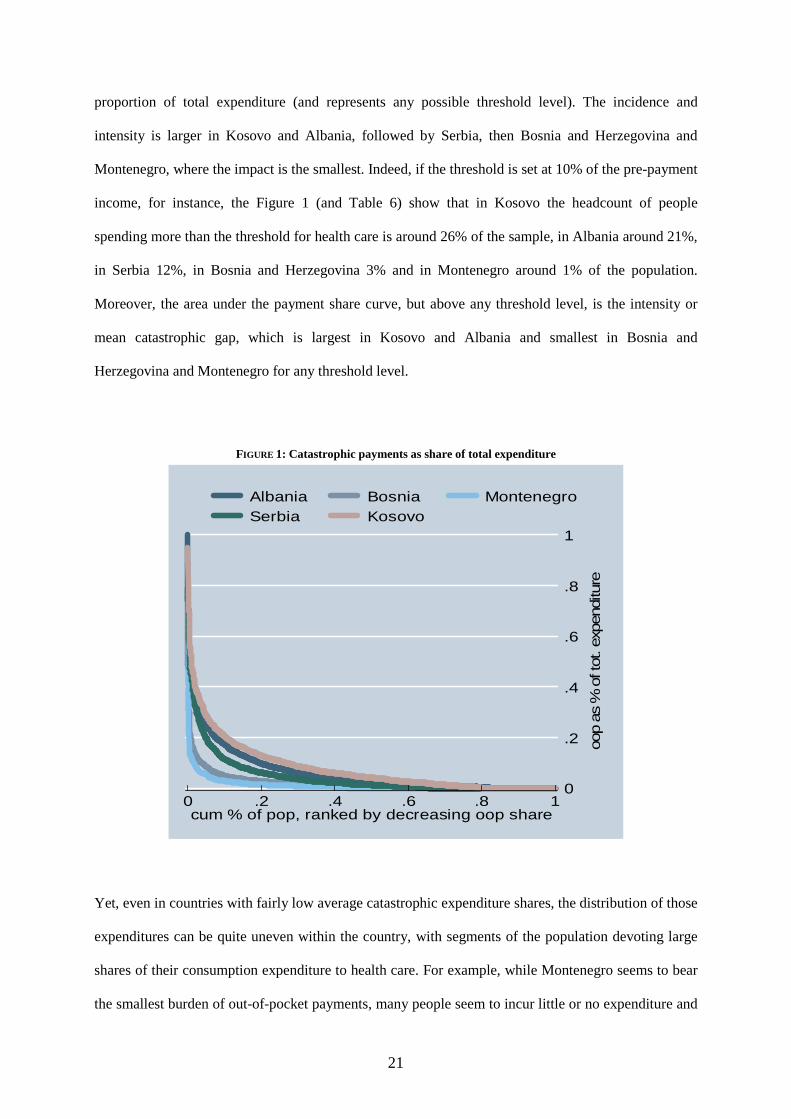
21
proportion of total expenditure (and represents any possible threshold level). The incidence and
intensity is larger in Kosovo and Albania, followed by Serbia, then Bosnia and Herzegovina and
Montenegro, where the impact is the smallest. Indeed, if the threshold is set at 10% of the pre-payment
income, for instance, the Figure 1 (and Table 6) show that in Kosovo the headcount of people
spending more than the threshold for health care is around 26% of the sample, in Albania around 21%,
in Serbia 12%, in Bosnia and Herzegovina 3% and in Montenegro around 1% of the population.
Moreover, the area under the payment share curve, but above any threshold level, is the intensity or
mean catastrophic gap, which is largest in Kosovo and Albania and smallest in Bosnia and
Herzegovina and Montenegro for any threshold level.
FIGURE 1: Catastrophic payments as share of total expenditure
0
.2
.4
.6
.8
1
oop
as %
of t
ot. e
xpen
ditu
re
0 .2 .4 .6 .8 1cum % of pop, ranked by decreasing oop share
Albania Bosnia MontenegroSerbia Kosovo
Yet, even in countries with fairly low average catastrophic expenditure shares, the distribution of those
expenditures can be quite uneven within the country, with segments of the population devoting large
shares of their consumption expenditure to health care. For example, while Montenegro seems to bear
the smallest burden of out-of-pocket payments, many people seem to incur little or no expenditure and

22
a few sick individuals have very high expenditure on health care. This can be seen in Table 8 where,
for all distributions of out-of-pocket health payments as a share of total expenditure, the mean
substantially exceed the median and the coefficients of variation are large, in particular in Montenegro.
TABLE 8: Out-of-pocket payments for health care (as % of total expenditure) Mean Median Coeff. of variation* Albania 6% 3% 1.44
Bosnia and Herzegovina 2% 0% 2.16
Kosovo 8% 4% 1.33
Montenegro 1% 0% 2.84
Serbia 4% 1% 1.96
*Coefficient of variation is equal to the standard deviation divided by the mean
4.1. Effect of out-of-pocket payments on poverty measures
In Table 9, we use a second approach to assess the poverty impact of health care payments. It consists
of comparing the poverty measures before and after health care spending is taken into consideration.
Given data availability, we use the PA Poverty Lines, calculated in local currency (LCU), by the
World Bank Poverty Assessment team as national poverty lines. A comparison of poverty headcounts
and poverty gaps before and after health care spending provides a sense of the impoverishing effect of
health expenditure, in terms of the additional number of people classified as poor or the deepening
poverty among the poor (see Wagstaff and van Doorslaer 2003).
TABLE 9: Poverty impact of out-of-pocket payments (using PA poverty line)
Albania Bosnia and Herzegovina* Montenegro Serbia Kosovo
Poverty headcount
1 Pre-payment headcount 13.40% 17.75% 7.20% 9.37% 40.86%
2 Post-payment headcount 16.20% 19.48% 7.60% 10.61% 47.12%
3 Poverty impact- percentage point change (2-1) 2.80% 1.73%
0.40% 1.24%
6.26%
4 Percentage change 20.90% 9.75% 5.59% 13.23% 15.32%
Poverty gaps
5 Pre-payment poverty gap 138.33 83.16 1.33 76.75 12.40
6 Post-payment poverty gap 185.14 92.03 1.36 91.85 15.82
7 Poverty impact (5-6) 46.81 8.87 0.03 15.10 3.42
8 Percentage change 34% 11% 1% 20% 28%
*Poverty is measured on annual basis (instead of monthly
23
Table 9 shows that health payments increase the number of poor Albanian households from 13% to
16% of the total population, i.e. poverty headcount increases by 20 percent. The relative impact on the
measured poverty gap is even larger (34 percent). Looking at differences across countries, overall the
impact of health expenditure on poverty headcount is not negligible: health payments increase the
incidence of poverty by 15% in Kosovo, 13% in Serbia, 10% in Bosnia and Herzegovina and 6% in
Montenegro. Also the after-health-payment poverty gap increases by 28% in Kosovo, 20% in Serbia,
11% in Bosnia and Herzegovina and 1% in Montenegro. Where the poverty gap after accounting for
out-of-pocket payments is typically larger than adjustments to the poverty headcount (e.g. in Albania,
Bosnia and Herzegovina and Serbia), this means that health care payments not only raise the
prevalence of poverty but also its intensity.
The magnitude of these results should be treated with some caution because of potential bias. If poor
people are less likely to seek care, the after-health care-payment headcount may be downward biased;
on the other hand, if rich people are more likely to be insured, the measure will be upward biased.
While no causal relationship can be inferred from above results, it is undeniable that taking into
account health care payments notably raises the incidence and intensity of poverty in the Western
Balkans. The greatest differences are found in Albania and Kosovo, followed by Serbia. Montenegro
is notable for the degree of financial protection its health care system appears to provide.
5. Health related behavior and household wellbeing: a multivariate analysis
In this section we carry out a set of country-specific regressions that shed light on the relationship
between health and poverty outcomes while controlling for the main socio-demographic
characteristics15.
15 The mean values of main socio-economic control variables are shown in the Appendix, Table A1.

24
In Table 10, we estimate a probit model of the likelihood of being poor as a function of individual
health related variables, i.e. health status, medical care utilization and health insurance, controlling for
other factors such as demographic characteristics, education, ethnicity, and region. This model
provides simple correlation effects as causal impacts of variables of interest (in particular health
utilization) are seriously affected by potential endogeneity bias. Yet, including both health use and
health shocks in the regression provides an indication of both the direct effect (cost) of health demand
and the indirect effect (in terms of forgone earnings) of illness shocks16. The coefficients in the tables
that follow report the marginal effect of an infinitesimal change (or discrete change in the case of
dummy variables) in each independent variable on the outcome probability.
Results show that the likelihood of poverty is, in general, higher among those who have experienced
ill health. In both Albania and Bosnia and Herzegovina, the probability of poverty is higher among
those who have experienced a chronic illness, and in Montenegro and Serbia the probability of poverty
is higher among those who have experienced sudden illness than among those who have not. Also,
everywhere (except Kosovo where an effect could not be detected), health care utilization and health
insurance is negatively associated with poverty. This may suggest that having health insurance and
health care utilization protect households from poverty. However, the signs on these variables might
be downward biased by the fact that poor people are more likely to be ill, less likely to seek health
care and less likely to be insured. In other words, there is a reverse causality between poverty and
health-related variables that does not allow us to draw inferential conclusions about the actual impact
of health care demand on poverty.
In order to further explore the latter issue about the importance of economic status in shaping the
health seeking behavior of people living in the Western Balkans, we estimate a health demand model
as a function of socio-economic variables, individual health status indicators, a set of demographic
16 The presentation of these correlation effects is purposefully useful for the subsequent presentation of the health demand model estimation.

25
characteristics, and regional and ethnicity fixed effects as to control for (unobservable) aggregate
determinants.17
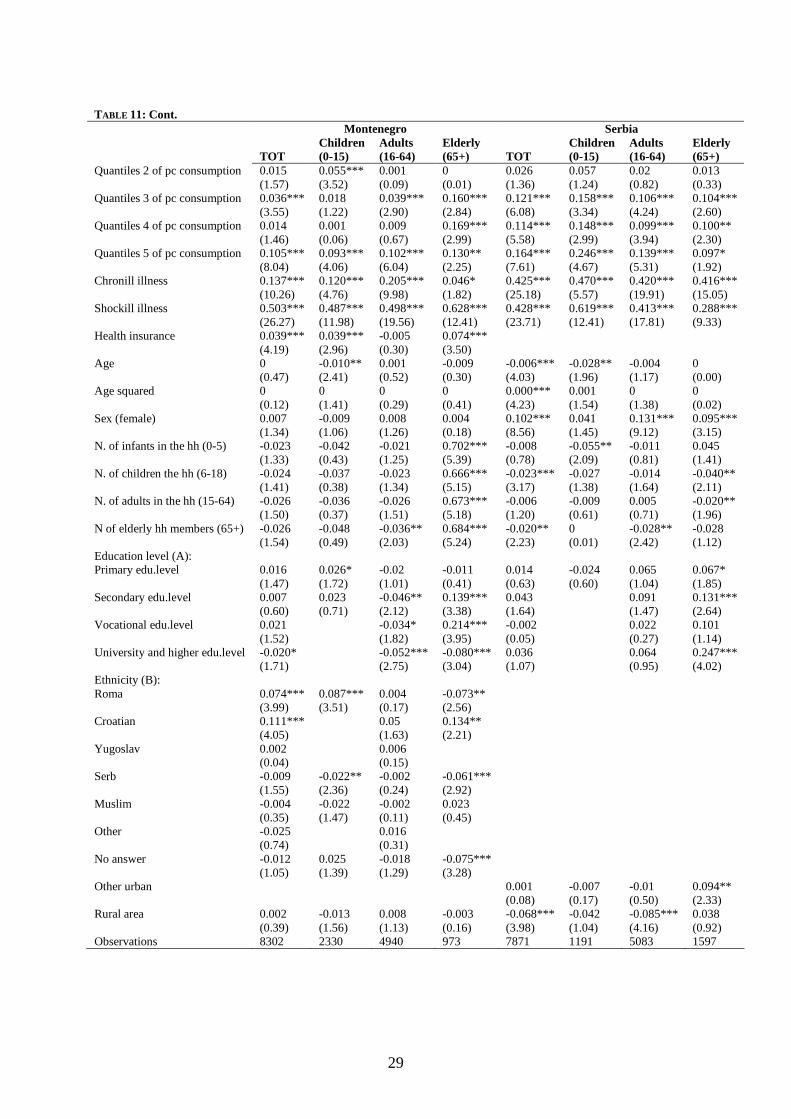
Table 11 presents the results of a probit model of health care utilization for the whole population of
each Balkan country (where the dependent variables is equal to 1 if individuals report to have used any
medical service in the last month), and for sub-populations of different ages so as to capture age-
specific variation in health-related variables. Overall, we find that health status, economic status,
education, and demographic household characteristics are significantly predictors of health behavior.
Not surprisingly, those who have experience ill health (both chronic and sudden) are more likely to
seek care. Having health insurance also significantly increase the person’s probability to use health
care (at least for those countries for which insurance data are available). 18
Economic status, as measured by consumption quintiles in the reported specification, is positively and
significantly associated with the probability of seeking care, and in most cases the coefficients
increase across the expenditure quintiles. This is to say that individuals in the richest quintiles are
significantly more likely to use health care services than anybody else, and the likelihood to seek care
increases with income. In Albania, for example, people in the richest quintile have almost 10% higher
probability of seeking health care than individuals in the poorest quintile; the same probability is 13%
higher in Bosnia and Herzegovina, 10% in Montenegro, and 16% in Serbia. Kosovo is the only case
where we fail to find a significant effect of economic status on health care utilization, but this is also
the only case where control variables for health status are not available (and negative income effects
may reflect the negative correlation between health status and well-being). These results are robust to
alternative regression specifications (e.g. a quadratic and cubic consumption variable specification and
the inclusion of a dummy variable for poverty status) showing that a marginal increase in household
well-being increases the health care demand (at a decreasing rate), and that being poor significantly
hinder health seeking behavior.
17 The Western Balkan countries were born to a large extent on an ethnic basis so that ethnic minorities in each country are very much characterized with respect to the ethnic majority. Including a set of ethnicity dummies contribute in capturing unobservable characteristics that may lead to an estimation bias. 18 Of course, the insurance variable may suffer potential endogeneity bias, but it is reassuring that excluding it does not lead to different results.

26
Furthermore, controlling for all other factors, females are generally more likely to seek care than
males. The probability of health care utilization increases also with the level of education, as the latter
may affect both the perception of one’s health status (i.e. one’s diagnostic ability) and the ability to
access health facilities. Interesting results are obtained with respect to the ethnicity variable, as some
ethnic groups seem significantly more or less likely to seek care than others. In Albania, for example,
Roma are significantly less likely and the Greek are significantly more likely to seek medical
assistance than the Albanians. Finally, differences in health-seeking behavior may also reflect the
variation in the availability of health providers across regions. Results show that people living in rural
(remote) and sub-urban regions are less likely to seek care than those in the main urban centers.
These effects, including the income effect, do not hold across all age categories, though. Specifically,
it appears that the lack of economic resources may hamper the care-seeking behavior for children
more than that of adults (see, for example the model for Albania and Montenegro), hindering a
intergenerational breaking out of the illness-poverty vicious circle.
Lastly, we plot the effect of the economic status on the predicted probability of health seeking
behavior by severity of illness (i.e. by differentiating between people suffering from a chronic long-
lasting illness and those who reported a recent sudden injury or health shock). In all countries for
which such information is available, the health seeking probability increases (at a decreasing rate) as
income increases, but chronically ill individuals are systematically less likely to seek care than those
who experience sudden health shocks. More specifically, differences by severity of illness are much
larger at low levels of income, suggesting those who suffer more from the economic costs of illness
are the weaker sub-population group of the poorer with chronic illness (this is especially the case in
Montenegro).

27
TABLE 10: Poverty and health correlations: Probit regression marginal effects Albania Bosnia Montenegro Serbia Kosovo Chronic illness 0.031** 0.070*** -0.01 -0.004 (2.46) (3.52) (0.55) (0.43) Acute illness 0.024* 0.142*** 0.041*** (1.86) (6.07) (3.79) Health use -0.047*** -0.046*** -0.001*** -0.054*** 0.013 (5.96) (2.6) (3.06) (6.84) (1.38) Health insurance -0.040*** -0.074*** 0.091*** (5.1) (3.31) (5.98) Age 0.006*** -0.001 0.002** 0.003*** -0.002*** (7.03) (0.65) (2.13) (3.93) (3.2) Age squared -0.000*** 0 -0.000** -0.000*** 0.000*** (6.94) (0.4) (2.13) (3.21) (3.06) Sex (female) 0 -0.01 0.016** -0.001 0.01 (0.02) (0.66) (2.07) (0.1) (1.18) N. of infants in the hh (0-5) 0.079*** 0.096 -0.016*** 0.024*** (16.95) (1.26) (2.68) (7.02) N. of children the hh (6-18) 0.066*** 0.034** 0.098 0.025*** 0.027*** (22.85) (2.38) (1.29) (6.99) (12.47) N. of adults in the hh (15-64) 0.024*** 0.041*** 0.077 0.013*** -0.012*** (10.36) (7.1) (1.01) (4.71) (5.81) N of elderly hh members (65+) 0.030*** 0.072*** 0.073 0.043*** 0.034*** (5.44) (10.48) (0.96) (9.76) (5.34) Education level (A): Primary edu.level -0.075*** 0.017 -0.025** -0.031 (5.71) (1.14) (2.37) (0.69) Secondary edu.level -0.157*** -0.019 -0.085*** -0.051 (11.15) (1.2) (6.78) (1.11) Vocational edu.level -0.184*** 0.011 -0.060*** -0.052 (12.61) (0.56) (2.96) (1.06) University and higher edu.level -0.216*** -0.078*** -0.089*** -0.031 (11.64) (4.66) (7.09) (0.64) Ethnicity (B): Roma 0.429*** 0.472*** 0.464*** (7.63) (16.47) (12.12) Greek -0.160*** (4.35) Croat -0.017 (0.2) Serb 0.001 0.140*** (0.07) (8.88) Moslem/B 0.064*** 0.046 (3.98) (1.58) Macedonian 0.037 (0.62) Vllahe 0.450*** (4.65) Turk -0.172*** (4.22) Albanian 0.01 (0.24) Other 0.148* -0.099** -0.03 (1.83) (2.11) (0.16) No answer 0.091*** (5.16) Region (C): Other urban 0.101*** -0.036* 0.095*** (6.8) (1.81) (7.54) Rural area 0.145*** 0.066*** 0.011 0.104*** 0.028*** (11.61) (4.02) (1.36) (8.5) (3.3) Observations 15435 2325 8205 7871 16007
Absolute value of z statistics in parentheses; * significant at 10%; ** significant at 5%; *** significant at 1% (A) None education is omitted in each country regression. (B) Albanian ethnicity is omitted in Albania; Montenegran in Montenegro; Albanian in Kosovo. (C) Tirana is omitted in Albania; city is omitted in Bosnia; Belgrado is omitted in Serbia; urban is omitted in Montenegro and Kosovo.

28
TABLE 11: Socio-economic correlates of health seeking behavior: Probit regression marginal effects Albania Bosnia
TOT Children (0-15)
Adults (16-64)
Elderly (65+) TOT
Children (0-15)
Adults (16-64)
Elderly (65+)
Quantiles 2 of pc consumption 0.054*** 0.081*** 0.030* 0.105*** 0.041 0.104 0.071** -0.149** (4.42) (4.15) (1.90) (2.71) (1.45) (0.94) (2.22) (2.28) Quantiles 3 of pc consumption 0.058*** 0.079*** 0.048*** 0.014 0.077*** -0.13 0.105*** -0.071 (4.56) (3.78) (2.96) (0.35) (2.82) (0.75) (3.36) (1.24) Quantiles 4 of pc consumption 0.071*** 0.093*** 0.068*** -0.005 0.061** -0.603 0.086*** -0.062 (4.92) (3.71) (3.75) (0.10) (2.10) (1.35) (2.61) (0.99) Quantiles 5 of pc consumption 0.098*** 0.133*** 0.095*** -0.052 0.136*** -0.069 0.174*** -0.063 (6.03) (4.53) (4.76) (0.97) (4.84) (0.35) (5.43) (0.97) Chronill illness 0.437*** 0.523*** 0.417*** 0.439*** 0.243*** 0.240*** 0.239*** (30.38) (9.64) (24.73) (15.29) (11.49) (9.49) (6.35) Shockill illness 0.441*** 0.583*** 0.326*** 0.279*** (27.89) (23.53) (14.01) (7.47) Health insurance 0.065*** 0.068*** 0.061*** 0.054* 0.102*** 0.097*** 0.095 (6.74) (4.44) (4.91) (1.70) (3.64) (3.09) (1.44) Age 0.009*** -0.026*** 0.004* 0.05 -0.001 -0.003 -0.007 (8.15) (3.45) (1.79) (1.37) (0.57) (0.57) (0.12) Age squared -0.000*** 0.002*** 0 0 0 0 0 (6.56) (4.43) (1.49) (1.43) (0.13) (0.24) (0.10) Sex (female) 0.085*** 0.051*** 0.114*** -0.052* 0.164*** 0.289* 0.175*** 0.110*** (9.91) (3.65) (10.58) (1.70) (9.03) (1.68) (8.27) (3.36) N. of infants in the hh (0-5) -0.016*** -0.030*** -0.004 -0.079*** (2.59) (2.59) (0.53) (3.91) N. of children the hh (6-18) -0.020*** -0.023*** -0.014*** 0.001 -0.005 -0.027 -0.007 0.111* (5.33) (3.33) (2.92) (0.10) (0.30) (0.19) (0.33) (1.95) N. of adults in the hh (15-64) -0.019*** -0.005 -0.032*** -0.007 -0.009 0.005 0.003 -0.051*** (6.41) (0.97) (8.09) (0.66) (1.14) (0.07) (0.32) (4.29) N of elderly hh members (65+) -0.022*** 0.001 -0.037*** -0.064** 0.014 -0.221** 0.026** -0.018 (3.17) (0.11) (4.01) (2.38) (1.45) (2.00) (2.29) (0.93) Education level (A): Primary edu.level 0.082*** 0.085*** 0.182*** 0.089** (4.73) (3.09) (3.75) (2.51) Secondary edu.level 0.095*** 0.123 0.179*** -0.031 (4.33) (1.54) (3.55) (0.34) Vocational edu.level 0.114*** 0.287* 0.206*** 0.128** (4.71) (1.70) (4.06) (1.99) University and higher edu.level 0.169*** 0.258*** 0.077 (6.01) (4.95) (0.82) Ethnicity (B): Roma -0.122** -0.079 -0.083 (2.27) (1.07) (1.14) Greek 0.328*** 0.221*** 0.367*** 0.273*** (7.63) (3.00) (6.48) (3.48) Macedonian -0.031 -0.117 0.081 -0.298 (0.42) (1.01) (0.85) (1.12) Vllahe -0.079 -0.168 -0.067 0.159 (0.81) (1.12) (0.50) (0.73) Other -0.178* 0.22 -0.312*** -0.26 (1.88) (1.12) (2.61) (0.87) Other urban -0.059*** -0.017 -0.062*** -0.183*** 0.024 0.049 0.025 0.023 (4.02) (0.71) (3.41) (3.50) (1.00) (0.63) (0.87) (0.64) Rural area -0.023 -0.043* -0.001 -0.111** 0.011 0.11 0.012 -0.015 (1.61) (1.81) (0.07) (2.34) (0.55) (1.26) (0.49) (0.43) Observations 15535 4397 9732 1405 2325 28 1813 482
29
TABLE 11: Cont. Montenegro Serbia
TOT Children (0-15)
Adults (16-64)
Elderly (65+) TOT
Children (0-15)
Adults (16-64)
Elderly (65+)
Quantiles 2 of pc consumption 0.015 0.055*** 0.001 0 0.026 0.057 0.02 0.013 (1.57) (3.52) (0.09) (0.01) (1.36) (1.24) (0.82) (0.33) Quantiles 3 of pc consumption 0.036*** 0.018 0.039*** 0.160*** 0.121*** 0.158*** 0.106*** 0.104*** (3.55) (1.22) (2.90) (2.84) (6.08) (3.34) (4.24) (2.60) Quantiles 4 of pc consumption 0.014 0.001 0.009 0.169*** 0.114*** 0.148*** 0.099*** 0.100** (1.46) (0.06) (0.67) (2.99) (5.58) (2.99) (3.94) (2.30) Quantiles 5 of pc consumption 0.105*** 0.093*** 0.102*** 0.130** 0.164*** 0.246*** 0.139*** 0.097* (8.04) (4.06) (6.04) (2.25) (7.61) (4.67) (5.31) (1.92) Chronill illness 0.137*** 0.120*** 0.205*** 0.046* 0.425*** 0.470*** 0.420*** 0.416*** (10.26) (4.76) (9.98) (1.82) (25.18) (5.57) (19.91) (15.05) Shockill illness 0.503*** 0.487*** 0.498*** 0.628*** 0.428*** 0.619*** 0.413*** 0.288*** (26.27) (11.98) (19.56) (12.41) (23.71) (12.41) (17.81) (9.33) Health insurance 0.039*** 0.039*** -0.005 0.074*** (4.19) (2.96) (0.30) (3.50) Age 0 -0.010** 0.001 -0.009 -0.006*** -0.028** -0.004 0 (0.47) (2.41) (0.52) (0.30) (4.03) (1.96) (1.17) (0.00) Age squared 0 0 0 0 0.000*** 0.001 0 0 (0.12) (1.41) (0.29) (0.41) (4.23) (1.54) (1.38) (0.02) Sex (female) 0.007 -0.009 0.008 0.004 0.102*** 0.041 0.131*** 0.095*** (1.34) (1.06) (1.26) (0.18) (8.56) (1.45) (9.12) (3.15) N. of infants in the hh (0-5) -0.023 -0.042 -0.021 0.702*** -0.008 -0.055** -0.011 0.045 (1.33) (0.43) (1.25) (5.39) (0.78) (2.09) (0.81) (1.41) N. of children the hh (6-18) -0.024 -0.037 -0.023 0.666*** -0.023*** -0.027 -0.014 -0.040** (1.41) (0.38) (1.34) (5.15) (3.17) (1.38) (1.64) (2.11) N. of adults in the hh (15-64) -0.026 -0.036 -0.026 0.673*** -0.006 -0.009 0.005 -0.020** (1.50) (0.37) (1.51) (5.18) (1.20) (0.61) (0.71) (1.96) N of elderly hh members (65+) -0.026 -0.048 -0.036** 0.684*** -0.020** 0 -0.028** -0.028 (1.54) (0.49) (2.03) (5.24) (2.23) (0.01) (2.42) (1.12) Education level (A): Primary edu.level 0.016 0.026* -0.02 -0.011 0.014 -0.024 0.065 0.067* (1.47) (1.72) (1.01) (0.41) (0.63) (0.60) (1.04) (1.85) Secondary edu.level 0.007 0.023 -0.046** 0.139*** 0.043 0.091 0.131*** (0.60) (0.71) (2.12) (3.38) (1.64) (1.47) (2.64) Vocational edu.level 0.021 -0.034* 0.214*** -0.002 0.022 0.101 (1.52) (1.82) (3.95) (0.05) (0.27) (1.14) University and higher edu.level -0.020* -0.052*** -0.080*** 0.036 0.064 0.247*** (1.71) (2.75) (3.04) (1.07) (0.95) (4.02) Ethnicity (B): Roma 0.074*** 0.087*** 0.004 -0.073** (3.99) (3.51) (0.17) (2.56) Croatian 0.111*** 0.05 0.134** (4.05) (1.63) (2.21) Yugoslav 0.002 0.006 (0.04) (0.15) Serb -0.009 -0.022** -0.002 -0.061*** (1.55) (2.36) (0.24) (2.92) Muslim -0.004 -0.022 -0.002 0.023 (0.35) (1.47) (0.11) (0.45) Other -0.025 0.016 (0.74) (0.31) No answer -0.012 0.025 -0.018 -0.075*** (1.05) (1.39) (1.29) (3.28) Other urban 0.001 -0.007 -0.01 0.094** (0.08) (0.17) (0.50) (2.33) Rural area 0.002 -0.013 0.008 -0.003 -0.068*** -0.042 -0.085*** 0.038 (0.39) (1.56) (1.13) (0.16) (3.98) (1.04) (4.16) (0.92) Observations 8302 2330 4940 973 7871 1191 5083 1597

30
TABLE 11: Cont. Kosovo TOT Children (0-15) Adults (16-64) Elderly (65+) Quantiles 2 of pc consumption 0.013 0.002 0.014 0.067 (1.28) (0.10) (0.95) (1.48) Quantiles 3 of pc consumption -0.004 -0.009 -0.005 -0.001 (0.34) (0.56) (0.35) (0.01) Quantiles 4 of pc consumption -0.026** -0.044*** -0.022 -0.017 (2.35) (2.62) (1.47) (0.35) Quantiles 5 of pc consumption -0.001 -0.022 0 -0.022 (0.10) (1.11) (0.02) (0.41) Age 0.005*** 0.009* 0.012*** -0.042 (8.01) (1.82) (5.70) (1.05) Age squared -0.000*** -0.001* -0.000*** 0 (2.68) (1.77) (3.50) (0.95) Sex (female) 0.004 0.006 0.011 -0.086*** (0.62) (0.57) (1.22) (2.74) N. of infants in the hh (0-5) 0.006* 0 0.001 -0.008 (1.89) (0.02) (0.16) (0.50) N. of children the hh (6-18) 0 0.002 -0.002 0.003 (0.25) (0.74) (0.86) (0.30) N. of adults in the hh (15-64) -0.010*** 0.004 -0.016*** -0.003 (5.36) (1.50) (6.58) (0.29) N of elderly hh members (65+) -0.017*** -0.017** -0.018** 0.070** (3.09) (2.00) (2.35) (2.36) Education level (A): Primary edu.level 0.025 -0.047 0.112* -0.996 (0.62) (0.90) (1.74) (1.46) Secondary edu.level 0.022 -0.027 0.095 -0.861 (0.52) (0.53) (1.39) (1.45) Vocational edu.level 0.033 -0.047 0.133* -0.54 (0.72) (0.84) (1.79) (1.53) University and higher edu.level 0.049 -0.012 0.123* -0.517 (1.08) (0.21) (1.68) (1.41) Ethnicity (B): Roma 0.026 0.063 -0.003 -0.083 (0.94) (1.59) (0.08) (0.53) Croatian -0.036 -0.004 0.008 (0.51) (0.04) (0.04) Yugoslav 0.057 (0.18) -0.82 Serb -0.007 -0.011 -0.017 0.003 (0.48) (0.40) (0.98) (0.07) Muslim -0.069*** -0.108** -0.058* -0.116 (2.86) (2.20) (1.86) (1.59) Turk 0.015 -0.011 0.052 -0.113 (0.43) (0.22) (1.01) (0.79) Other -0.007 -0.02 (0.04) (0.12) Rural area -0.017** -0.018 -0.009 -0.057* (2.32) (1.49) (0.94) (1.75) Observations 16018 5418 9557 1042 Absolute value of z statistics in parentheses; * significant at 10%; ** significant at 5%; *** significant at 1% (A) None education is omitted in each country regression. (B) Albaniane ethnicity is omitted in Albania and Kosovo; Montenegrinan in Montenegro. (C) Tirana is omitted in Albania; 'city' is omitted in Bosnia; Belgrado is omitted in Serbia; 'urban' is omitted in Montenegro and Kosovo.

31
FIGURE 2: Predicted probabilities of health seeking behaviour by severity of illness
.75
.8.8
5.9
.95
1P
r.(s
eek
heal
th c
are)
0 20000 40000 60000 80000 100000Pc consumption
chronic ill sudden ill
Albania
0.2
.4.6
.81
Pr.
(see
k he
alth
car
e)
0 500 1000Pc consumption
chronic ill sudden ill
Montenegro
.5.6
.7.8
.91
Pr.
(see
k he
alth
car
e)
0 20000 40000 60000 80000Pc consumption
crhonic ill sudden ill
Serbia
32
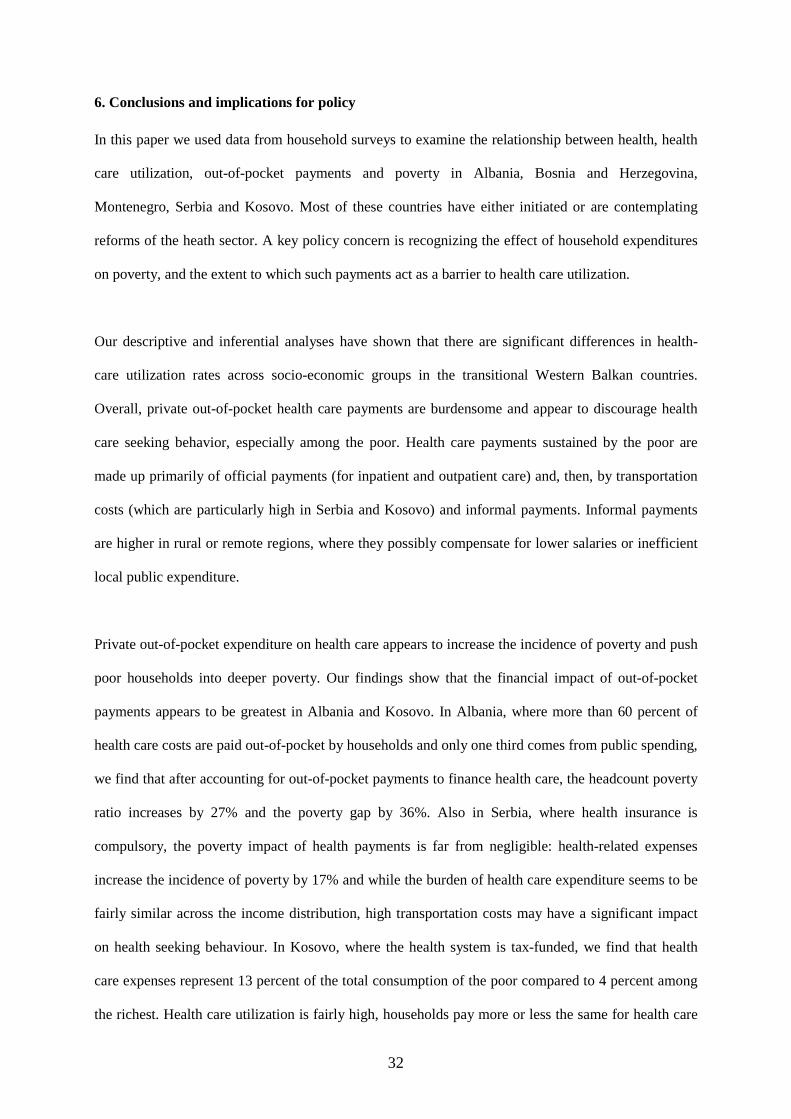
6. Conclusions and implications for policy
In this paper we used data from household surveys to examine the relationship between health, health
care utilization, out-of-pocket payments and poverty in Albania, Bosnia and Herzegovina,
Montenegro, Serbia and Kosovo. Most of these countries have either initiated or are contemplating
reforms of the heath sector. A key policy concern is recognizing the effect of household expenditures
on poverty, and the extent to which such payments act as a barrier to health care utilization.
Our descriptive and inferential analyses have shown that there are significant differences in health-
care utilization rates across socio-economic groups in the transitional Western Balkan countries.
Overall, private out-of-pocket health care payments are burdensome and appear to discourage health
care seeking behavior, especially among the poor. Health care payments sustained by the poor are
made up primarily of official payments (for inpatient and outpatient care) and, then, by transportation
costs (which are particularly high in Serbia and Kosovo) and informal payments. Informal payments
are higher in rural or remote regions, where they possibly compensate for lower salaries or inefficient
local public expenditure.
Private out-of-pocket expenditure on health care appears to increase the incidence of poverty and push
poor households into deeper poverty. Our findings show that the financial impact of out-of-pocket
payments appears to be greatest in Albania and Kosovo. In Albania, where more than 60 percent of
health care costs are paid out-of-pocket by households and only one third comes from public spending,
we find that after accounting for out-of-pocket payments to finance health care, the headcount poverty
ratio increases by 27% and the poverty gap by 36%. Also in Serbia, where health insurance is
compulsory, the poverty impact of health payments is far from negligible: health-related expenses
increase the incidence of poverty by 17% and while the burden of health care expenditure seems to be
fairly similar across the income distribution, high transportation costs may have a significant impact
on health seeking behaviour. In Kosovo, where the health system is tax-funded, we find that health
care expenses represent 13 percent of the total consumption of the poor compared to 4 percent among
the richest. Health care utilization is fairly high, households pay more or less the same for health care

33
across the income distribution and, unlike in other places, in Kosovo the results from the regression
analysis show that economic status is not significant in shaping health care demand. This could be the
result of relative equity in access to health care and relative inequality in the ex-ante or pre-payment
income distribution (as can be observed from the net expenditure distribution by quintiles)19. Finally,
Bosnia and Herzegovina and, especially, Montenegro seem more able to provide households with
financial protection against illness. However, in Montenegro the incidence of illness is low, as are
health care utilization rates. Therefore, while on the one hand the health system seems to offer greater
financial protection, this result may be affected by a smaller demand for health care.
Finally, multivariate analysis of the socio-economic correlates of health demand show that health
status, economic status, education, and demographic household characteristics are significant
predictors of health care seeking behavior. In particular, being economically better off is significantly
associated with the probability of seeking care and in Albania people in the richest quintile have
almost 10% higher probability of seeking health care than individuals in the poorest quintile; the same
probability is 13% higher in Bosnia and Herzegovina; 10% in Montenegro; and 16% in Serbia.
Kosovo is the only case where we fail to find a significant effect of economic status on health care
utilization (but this is also the only country where control variables for health status are not available).
Finally, our findings show that the lack of economic resources may place a heavier burden on the
weakest strata of the population, in particular children and people with chronic illness, with serious
consequences for a future breaking out of the illness-poverty vicious circle.
As countries in the sub-region continue the process of health system reform, one area that will have to
receive attention is how to protect vulnerable groups from the impoverishing effects of health care
expenditure. Some areas that could be considered include revisiting the user fee structure – both its
design and implementation – to consider different exemption criteria, the progressivity of co-payment
schedules and the interaction between formal and informal payments; examining the constraints on the
expansion of health insurance to uncovered groups, such as agricultural workers and the informally
19 It is worth bearing in mind that the data used for Kosovo in this paper were collected in 2000 during a period of great political volatility before the Ministry of Health was established (February 2002).
34
employed; ensuring a more equitable geographic distribution of health care facilities or subsidizing
transport for the rural poor so as to reduce the high transportation costs; and exploring the potential
role of private sector providers and insurers in expanding access to care (see also Gertleer and Gruber,
2002; van Doorslaer et al., 2007). Protecting households from the impoverishing effects of adverse
health events ought to be a key objective of health systems in all countries and the achievement of it,
within the constraint of ensuring financial efficiency and sustainability, will lead to important welfare
gains in terms of both health access and poverty reduction.
35
References
Baeza, C., and T. G. Packard. 2005. Beyond Survival: Protecting Households from the Impoverishing Effects of Health Shocks in Latin America. Washington, DC: World Bank. Bredenkamp, C. and Gragnolati, M. 2007. Sustainabilty of Health care Financing in the Western Balkans: an overview of progress and challenges. Policy Research Working Paper series # 4374, Washington, D.C.: The World Bank Case, Anne, 2001, “Does money protect health status? Evidence from South African pensions,” Working Paper No. 8496, NBER, Cambridge, MA. Deaton, Angus, 2003, “Health, inequality, and economic development,” Journal of Economic Literature, 41, 113–58. Dercon, S. and P. Krishnan. 2000. In Sickness and in health: risk-sharing within households in rural Ethiopia. Journal of Political Economy 108(4): 688-727. Falkingham, J. 2004. Poverty, out-of-pocket payments and access to health care: evidence from Tajikistan”. Social Science & Medicine 58: 247–258. Gertler, P. and J. Gruber. 2002. Insuring consumption against illness. American Economic Review 92(1): 51-76. Grossman, M. 1972. On the concept of health capital and the demand for health. Journal of Political Economy 80(2): 223-55. Krishna, A. 2007. “For reducing poverty faster: target reasons before people source”, World Development, 35: 1947-1960. Krishna, A. 2006. “Pathways out of and into poverty in 36 villages of Andhra Pradesh, India”, World Development, 34(2): 271-288. Limwattananon, S, V. Tangcharoensathien and P. Prakongsai. 2007. Catastrophic and poverty impacts of health payments: results from national household surveys in Thailand. Bulletin of the World Health Organization 85: 600–606. Lindelow, M. and A. Wagstaff. 2005. Health shocks in China: are the poor and uninsured less protected? Policy Research Working Paper series #3740. Washington, D.C.: The World Bank Narayan, D., 2000. Voices of the Poor: Can anyone hear us?, NewYork: Oxford University Press Strauss, J. and D. Thomas. 1998. Health, Nutrition, and Economic Development. Journal of Economic Literature 36(2): 766-817. O'Donnell O., van Doorslaer, E., Rannan-Eliya R.P., Somanathan A., Adhikari S., 2007. "The Incidence of Public Spending on Health care: Comparative Evidence from Asia," World Bank Economic Review, 21(1): 93-123. Preston, Samuel H., 1975, “The changing relation between mortality and level of economic development,” Population Studies, 29, 231–48.

36
Pritchett, Lant, and Lawrence H. Summers, 1996, “Wealthier is healthier,” Journal of Human Resources, 31(4), 841–68. Van Doorslaer, E, O O’Donnell, R Rannan-Eliya et al (23 authors). 2007. Catastrophic expenditures on health care in Asia”. Health Economics., Feb.21. Wagstaff, A. 2005. The Economic Consequences of Health Shocks. World Bank Policy Research Working Paper WPS3644. Washington DC: World Bank. Wagstaff, A. and E. van Doorslaer. 2003. Catastrophe and Impoverishment in Paying for Health Care: With Applications to Vietnam 1993-98. Health Economics, 12 (11): 921-934. World Bank. 2003. Albania Poverty Assessment. Washington DC: World Bank World Bank. 2006. Albania Health Sector Note, Human Development Sector Unit, South East Europe Country Unit (Report No. 32612-AL). Washington DC: World Bank World Bank. Online. Quantitative Techniques for Health Equity Analysis. www.worldbank.org WHO, 2002. Dying for Change: Poor People’s Experience of Health and Ill-Health, World Health Organization and The World Bank, Washington DC. Xu, K. D.B. Evans, G. Carrin, A. M. Aguilar-Rivera, P. Musgrove and T. Evans. 2007. Protecting households from catastrophic health spending. Health Affairs, 26(4): 972-983

37
APPENDIX
TABLE A1: Summary statistics for individual and household characteristics
Albania Bosnia and Herzegovina Kosovo Montenegro Serbia
Age 30.82 42.30 27.32 27.86 38.32
No. of infants in the hh (0-5) 0.53 0.00 1.23 1.06 0.32
No. of children the hh (6-17) 1.48 0.26 2.29 2.09 0.81
No. of adults in the hh (18-64) 3.28 3.04 4.37 5.18 2.92
No. of elderly hh members (65+) 0.45 1.26 0.44 0.67 0.60
Female 50% 50.30% 50.73% 49.60% 50.89%
Region of living:
Capital city 11.84% 52.47% 37.58% 64.97% 19.72%
Other urban 28.21% 15.85% 37.46%
Rural 59.95% 31.68% 62.42% 35.03% 42.83%
Education level:
None 15.74% 11.60% 1.07% 21.94% 14.83%
Primari 55.88% 15.49% 59.65% 19.10% 36.11%
Secondary 13.62% 57.02% 29.06% 28.14% 38.77%
Vocational 9.86% 1.05% 4.89% 13.16% 1.86%
Higher 4.89% 13.22% 5.34% 17.67% 8.43%
Ethnicity:
Albanian 97.43% 88.12%
Greek 1.08%
Bosnian 35.80%
Serbian 38.51% 6.97% 29.98%
Croatian 22.84% 1.48%
Muslim 1.92% 6.60%
Roma 1.68% 4.86%
Montenegran 49.64%
Turk 1.00%

38
TABLE A2: Variations in the definition of concepts across the LSMS surveys
Albania (2005) Bosnia and
Herzegovina (2004)
Montenegro (2004) Serbia (2003) Kosovo (2000)
Chronic illness
Do you suffer from a chronic illness or disability that has lasted more than 3 months (including severe depression)?
Do you have any chronic diseases?
Do you have chronic diseases?
Has doctor told you about having chronic disease?
na
Illness shock
During the last 4 weeks have you had any (sudden) illness or injury? (such as flu, diarrhea, a fracture, etc..)
na
Did you have any acute symptom, diseases or injury in the last 30 days?
Did you have any acute symptom, diseases or injury in last month?
na
Medical assistance (outpatient)
During the past 4 weeks, did you visit any … (list of medical services)?
During the last 14 months how many times did you visit (list of medical services)?
During the last 30 days have you consulted with health practitioner or visited a health facility? (list of first visit- and second visit-providers)
Have you visited…(list of public and private medical services) …during last month?
During the past 4 weeks, did you visit any… (list of medical services) to obtain health care?
Hospitalization (inpatient)
During the past 12 months, have you stayed in a hospital or maternity, hospital or a private clinic in Albania or abroad?
During the past 14 months, did you stay in hospital or spa?
na Did you stay in hospital in the last 12 months?
During the past 12 months, have you stayed at a public hospital (inc. humanitarian and military overnight)?
Insurance /license
Do you have a health license?
Do you have health insurance?
Are you covered by health insurance either directly or through another member of your household?
na na


![Ill] · Ill]](https://static.fdocuments.in/doc/165x107/5f1dea4dfd32f01ae52b75ed/ill-ill.jpg)
![Untitled-1 [] · 2020. 10. 9. · Thi Ill I Il Ill Olli Ill Ill 1 Ill ill Ill Il Ill ill Ill 11 Ill](https://static.fdocuments.in/doc/165x107/60d272307160da1c310a85a5/untitled-1-2020-10-9-thi-ill-i-il-ill-olli-ill-ill-1-ill-ill-ill-il-ill.jpg)