The Importance of Water Conservation Measurement …wrp.co.za/sites/default/files/presentations/2...
38
The Importance of Water Conservation Measurement Water Demand Management & Strategy Water and Sanitation Presented By: Nina Viljoen Date: 23 August 2013
Transcript of The Importance of Water Conservation Measurement …wrp.co.za/sites/default/files/presentations/2...
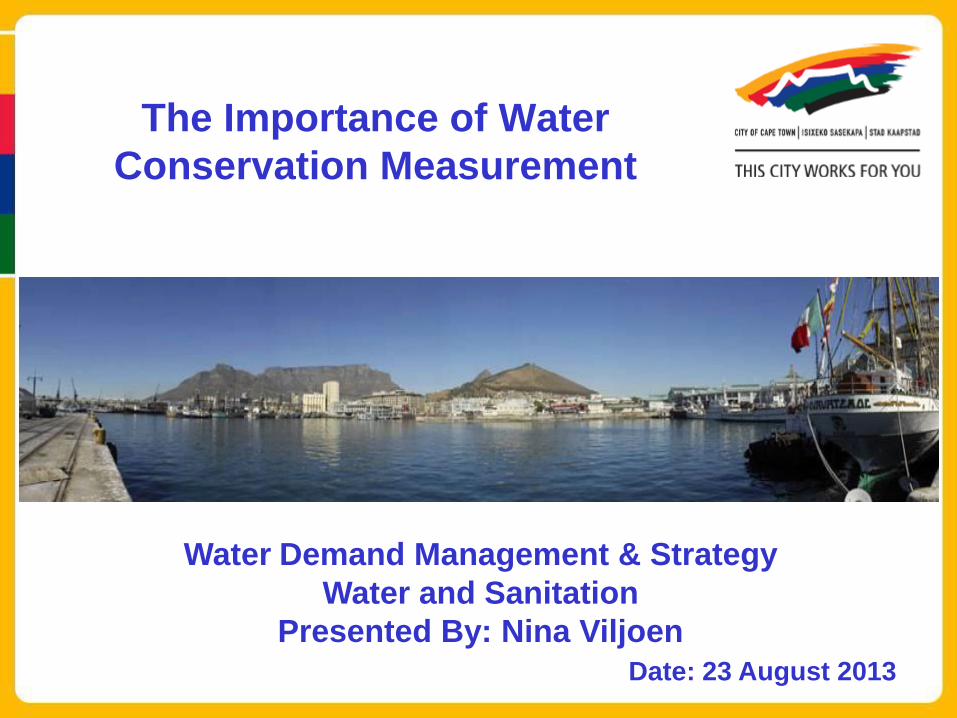
The Importance of Water
Conservation Measurement
Water Demand Management & Strategy
Water and Sanitation
Presented By: Nina Viljoen
Date: 23 August 2013
"Measurement is the first step that leads to
control and eventually to improvement. If
you can't measure something, you can't
understand it. If you can't understand it, you
can't improve it.“
- H. James Harrington

Cape Town is receiving low volumes of rainfall (average of 500 mm per
annum).
High evaporation occurs (approx. 85% of mean annual precipitation).
Highly variable and spatial distribution of rainfall.
Stream flows in most rivers are at relatively low levels for most of the year,
Infrequent high flows that do occur happen over limited and often
unpredictable periods.
Introduction

Cape Town’s Rainfall Figures
The City of Cape Town established a dedicated Water Demand
Management Branch in 2007.
This Branch consists mainly of two sections:
A technical section;
A Water Conservation and social awareness section.
The role of the Water Conservation and social awareness section is to
raise awareness about Water Conservation and influence behaviour
change through the education of consumers.
Aim is to increase knowledge levels about water saving.
Introduction (cont.)

It is imperative that awareness and education activities and
interventions are implemented in order to ensure water is used
efficiently and wastage is minimised.
The effectiveness of any awareness campaign is ultimately measured
by the results of the implemented measures.
It is however very difficult to assess the impact on behaviour change.
It is therefore essential to look at measuring techniques in order to
assess conservation initiative impact and successes.
Measuring the Impact of Water
Conservation Initiatives

Raw data refers to all collected statistics, opinions, facts or
forecasts which have not been analysed.
Analysed data refers to the results of the collected data via
different techniques for future decision making.
By analysing data we can receive valuable information and
predictions.
The Difference Between Raw
and Analysed Data

The Purpose of Gathering Information
Information collecting can help to:
Measure basic attitudes of groups.
Measure the true opinions of various groups.
Improve campaign/project effectiveness.
Pre-test messages and proposed communication channels.
Achieving two-way communication.
Reveal problem areas before they develop into crisis.
Identify current public interests and concerns.
Achieve credibility.

Selecting a Successful Measurement
Program
Steps that should be followed to complete a successful
measurement program:
Deciding on what need to be assessed.
Selection of an evaluation design to fit the program.
Choosing the methods of measurement.
Deciding on the target audience and sample areas/sizes
Determining when to conduct the assessment.
Gather, analyze, and interpret the data in visual form.

Measuring Techniques
The two major types of measuring techniques used by the City
are:
Survey questionnaires: Pre-and post interventions
Comparison of before and after results
Analysis of change in perceptions/attitudes in order to
assess campaign impact
Water Consumption: Pre-and post interventions
Six month before and after
Long term historic and current trend comparison
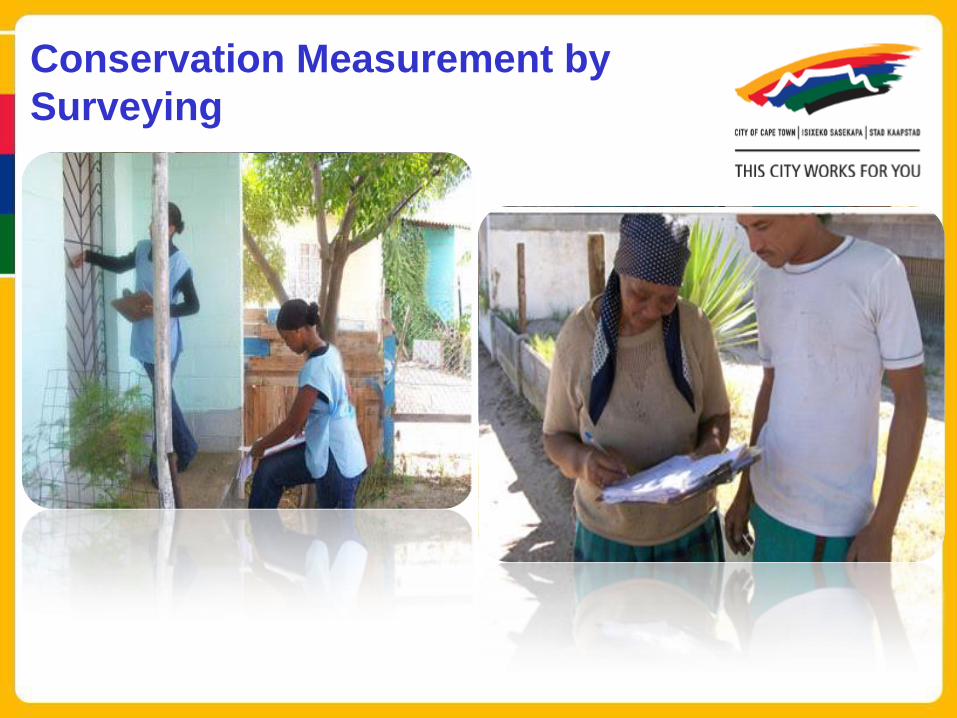
Conservation Measurement by
Surveying

The Basic Survey - Assessment of
Knowledge and Attitudes
The fundamental principles of survey research are:
To use it in a scientific way at a reasonable cost
To realise benefits of interviewing a representative sample instead of
an entire population.
Survey research can provide valuable information on:
Knowledge, attitude and behaviour before & after an intervention
Community demographics
Preferred or most suitable educational material
Political or other challenges affecting the initiative
The results can provide information on the level of effectiveness.

Water Conservation measurement can:
Facilitate the initiation of water conservation interventions.
Help identify possible reasons for high consumption.
Help initiate the development of education media focusing on high
consumption suburbs.
Help identify residential high consumptive categories.
Enables the quantification of results to show success.
Facilitates the adjustment of the campaign direction.
Provide the City with a water consumption referencing system.
Measuring the Impact of Water
Conservation Initiatives (cont.)

Types of Surveying
Various types of surveys can be used in Water Conservation
measurement:
Mail surveys
Telephonic surveys
Door-to-door surveys
On-line surveys
The City’s Water Conservation Section mostly uses the door-to-door
method.
In challenging conditions a combination of survey methods can be used.
Survey Layout and Design
According to the Statistics Act: 1999 and the Law Reform Act 19:1973
(Privacy and data protection);
A declaration of confidentiality must be included in written form on a
survey sheet.
A separate declaration of confidentiality sheet must be provided for
the respondents signature.
Avoid too long or many questions.
Use close-ended questions rather than open-ended.
Keep to the topic or relevance of the survey

Declaration of
Confidentiality
Question Area
Tick Box Area
Additional
Comments Area
Official Use Area
Suburb: ________________________________
NO. QUESTIONS
Please Tick √
Yes No
1
2
3
4
5
6
7
8
13 ADDITIONAL COMMENTS:
For Official Use
HouseholdLow Income (RDP, Informal) Officer Name: Date:
Shopping Centre ___________________________ ______________
Library Middle Income
Clinic
Business High Income
Other: ____________________________________
K E E P S A V I N G W A T E R(Sub-council 4: Water Saving Survey)
ANSWERS
Declaration of Confidentiality
We would like to request a few minutes of your time to assist in this water saving research. This survey is investigating the knowledge levels of the public on
the saving of water . Your participation is voluntarily and your personal details are not required. Your answers will be treated as confidential.
The Basic Survey Sheet Outlay

CONSENT WATER CONSERVATION SURVEY
Date..…/..…/20...
NATURE AND PURPOSE OF THE SURVEY
…………………………………………………………………………………………………………………………………………………………………………. ……………………………………………………………………………………………………………………………………………………………..………..…
SURVEY RESEARCH PROCESS
• Interviews and the completion of questionnaires will be conducted.
• The interviews and questionnaires will take approximately 5 minutes of your time. • The five minute interview will be conducted in order to enhance and support the questionnaire results. • Participation is voluntary and no personal details are required.
CONFIDENTIALITY
The information you provide will be treated as highly confidential. If water account or any other related
information is voluntarily released by participants during interviews it will be treated as highly confidential
and any documents will be destroyed after completion of this research study.
WITHDRAWAL CLAUSE
I understand that may I may withdraw from this survey at any time. I therefore participate voluntarily until
such time as I request otherwise.
INFORMATION (contact information of Water Conservation Official))
If you have any further questions, you may contact the Water Conservation Official………..……… at…………………
CONSENT
I, the undersigned, ………………………………………………(full name) have read the above information relating to the
survey and declare that I understand it. I hereby declare that I agree voluntarily to participate in the survey.
I further undertake to make no claim against the City of Cape Town in respect of damages to my person or
reputation that may be incurred as a result of the survey initiative or through the fault of other participants.
Signed at ………………………………… on ………………………………… Signature of participant: .................................................
Participation Consent

The Benefits of Surveying
Assesses effectiveness of campaign strategy.
Assesses current knowledge, attitudes and perception levels.
Provides information on social benefits.
One on one opportunity to engage with community.
Opportunity for discussion and sharing information.
Gathering of area and community information.
Testing of new material and ideas.
Promoting team work and spirit.

Water Consumption Measurement

Water Consumption Measurement
Pre-and post intervention water consumption measurement provides
information on:
Historic water consumption trends.
The level of change after intervention.
The identification of high consumption areas.
Effective monitoring and reporting.
Enables understanding of residential water-usage behavior patterns.
Facilitates assessment of impact of patterns on water demand
management.
Provides data that can be correlated with future trends.
Supports demand forecasting.
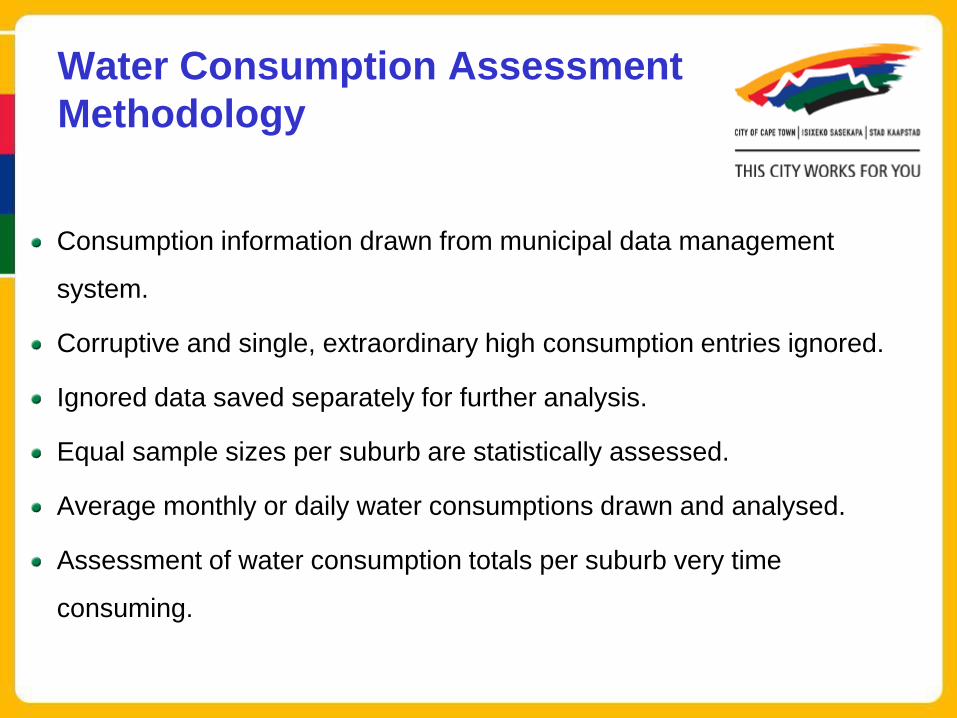
Water Consumption Assessment
Methodology
Consumption information drawn from municipal data management
system.
Corruptive and single, extraordinary high consumption entries ignored.
Ignored data saved separately for further analysis.
Equal sample sizes per suburb are statistically assessed.
Average monthly or daily water consumptions drawn and analysed.
Assessment of water consumption totals per suburb very time
consuming.

The Importance of Visual Graphs
and Tables
Graphs and tables represents the results visually in order for:
The information to become clear and understandable.
Any trends to be highlighted.
The saving of valuable time.
Campaign/project strategies to be easily monitored.
It allows for quick and effective corrective measures.
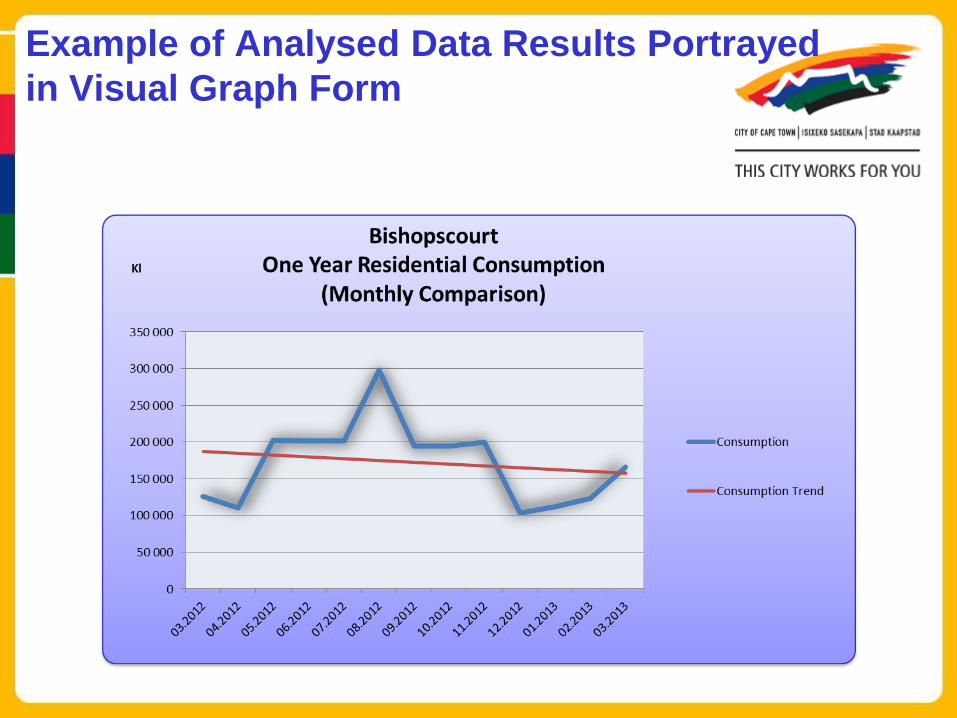
Example of Analysed Data Results Portrayed
in Visual Graph Form

Example of Analysed Data Results
Portrayed in Visual Graph Form (Cont.)

Example of Analysed Data Results
Portrayed in Visual Table Form
Elsiesriver
Daily Average Consumption Categories (Simple Random Sample of 100 Properties)
Consumption
Category (Kl)
Number of
Properties
0.100 - 0.500 38
0.501 - 0.999 42
1.000 - 1.999 13
2.000 - 2.999 2 20%
3.000 - 3.999 2
>4.000 3

Sampling Methods
Two main sampling methods can be used:
Probability (random) sampling where:
Each unit of the population has equal chance of being included.
Non-probability sampling where:
Judgement of researcher influences the selection of sample
units.
The bigger the sample the more statistically valid are the results.
Sample estimate should be assessed at confidence level that will
provide good estimation that it is within the true population value.
Some Key Findings:
Consumption Analysis
Clear seasonal consumption patterns.
Assumptions of the potential impact of climate change and related
rainfall changes:
Climate change predictions of seasonal shifts.
Increased water consumption due to prolonged dry months.
Website publishing of visual graphs can potentially lead to a drop in
water usage.

Key Finding – Identification of Clear
Wet and Dry Seasonal Patterns
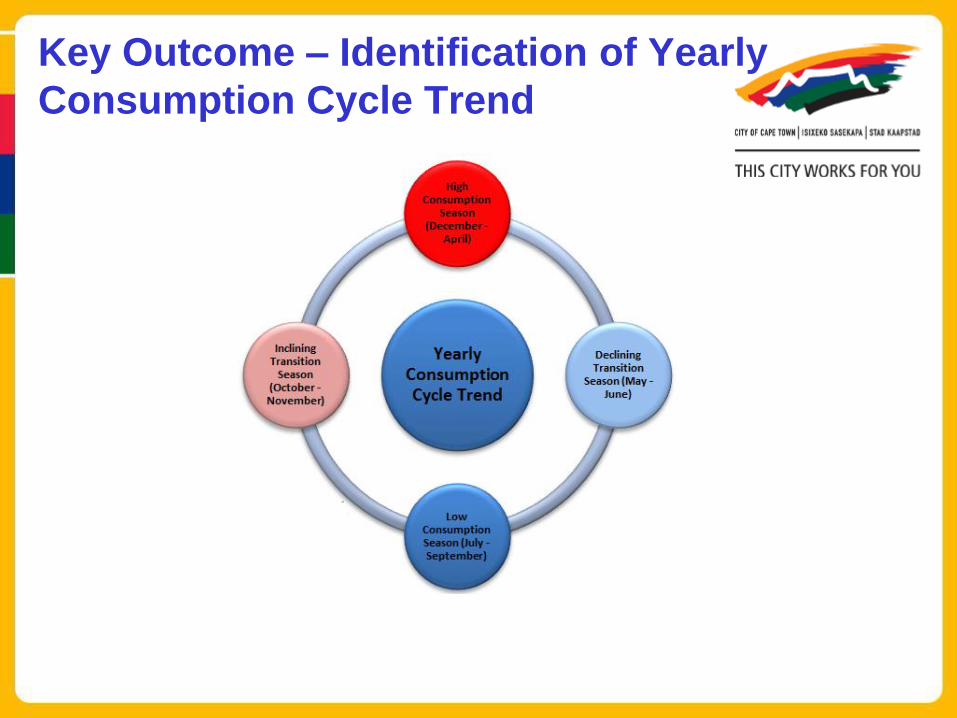
Key Outcome – Identification of Yearly
Consumption Cycle Trend

Consumption Measurement Reveals
Water Saving Success in the South
Water Conservation campaign interventions - Southern Peninsula
suburbs.
Campaign interventions included media releases, material distribution,
radio advertisements as well as door to door visits.
The campaign effectiveness were very difficult to measure.
Water consumption measurement were implemented as main
measurement strategy.
The results revealed significant water savings with positive conclusions
on behaviour change.
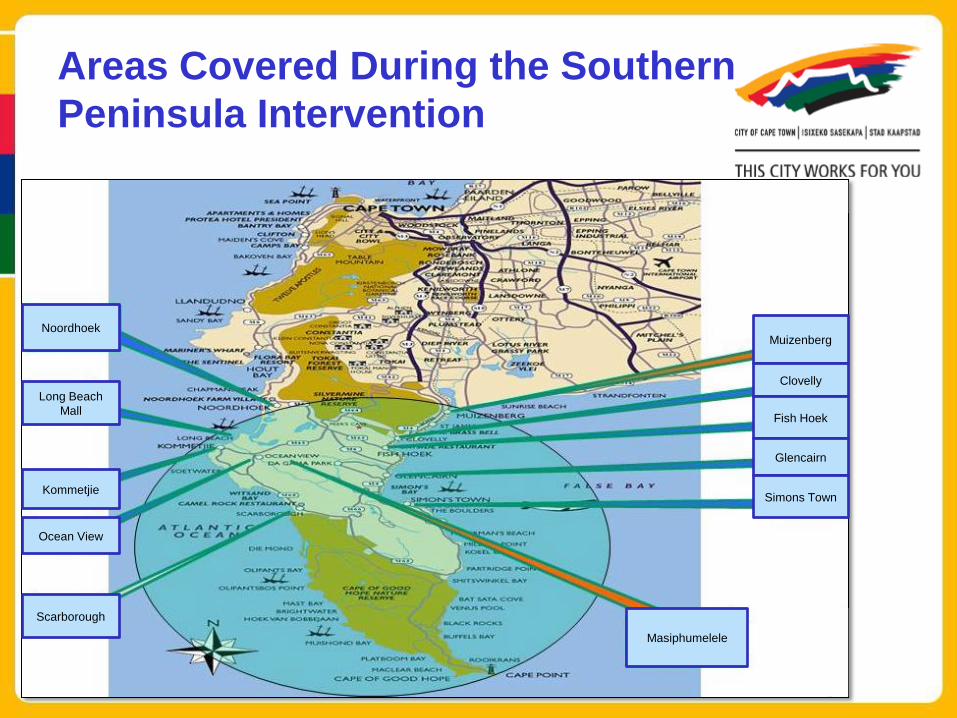
Areas Covered During the Southern
Peninsula Intervention
Muizenberg
Clovelly
Fish Hoek
Glencairn
Simons Town
Masiphumelele
Scarborough
Ocean View
Kommetjie
Long Beach
Mall
Noordhoek

Water Saving Success in the South
Suburb Number of
Properties
Analysed
Direct Short Term Impact (6 months before and 6
months after intervention)
Percentage
Drop in
Consumption Pre-intervention
Average
Consumption
(5.2010-11.2010)
(Kl)
Post-
intervention
Average
Consumption
(11.2010-
5.2011) (Kl)
Drop in
Average
Consumption-
Amount of
Water Saved
(Kl)
Fish Hoek &
Sun Valley
411 317 617.23 105 361.92 212 255.31 66.82%
Noordhoek 605 459 318.16 144 657.47 314 660.69 68.50%
Glencairn, Da
Gama & Dido
Valley
1 023 280 201.42 160 444.95 119 756.47 42.73%
Muizenberg 1 724 244 981.31 81 427.07 163 554.24 66.76%
Masiphumelele 1 128 589 596.02 311 528.08 278 067.94 47.16%
Simonstown 734 77 460.46 42 465.17 34 995.29 45.17%
Kommetjie 1 049 175 551.36 65 634.48 109 916.88 62.61%
Total (Kl): 2 144 725.96 911 519.14 1 233 206.82 57.50%

Current Measurement Projects
The City of Cape Town’s current water conservation measurement
projects:
The City wide implementation of pre-and post campaign surveys.
The drawing of pre-and post consumption data of surveyed areas.
The identification of areas with extraordinarily high consumptions
through data comparison.
Analysing consumptive data of the informal car wash industry.
Analysing any consumption data for reporting as required.

Current Measurement Projects (cont.)
The City’s Water and Sanitation Department are managing a “Keep
Saving Water” website.
This website contains valuable information on all aspects of water saving.
It also contains a “Consumption Analysis” page.
High consumption suburbs are identified and visual graphs are displayed.
This provides a water consumption monitoring platform where residents of
identified suburbs can keep track of their consumption.
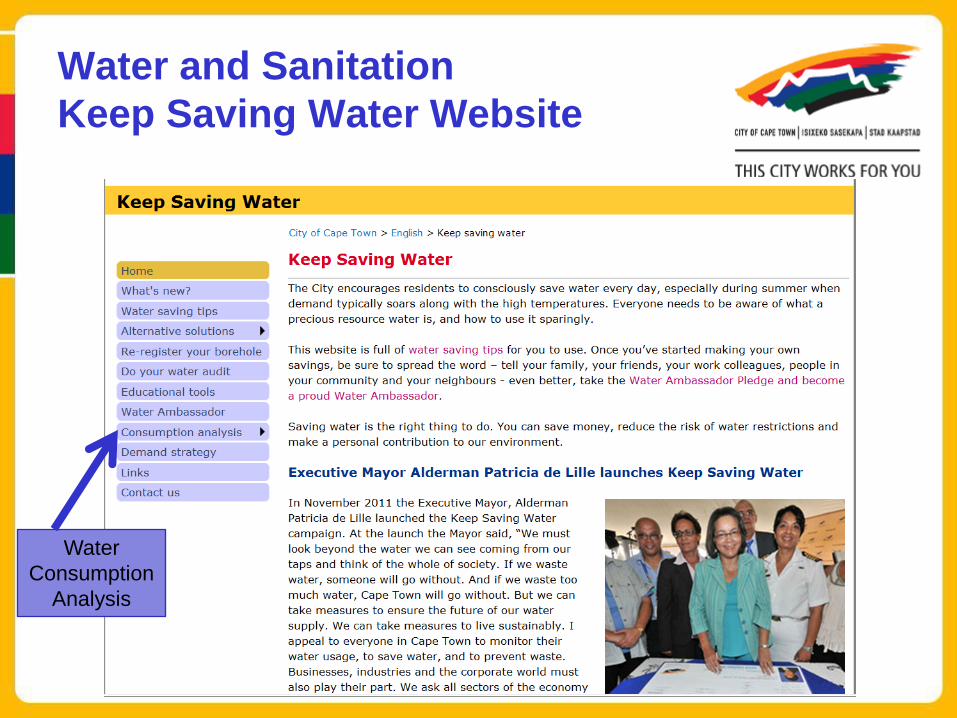
Water and Sanitation
Keep Saving Water Website
Water
Consumption
Analysis
Potential Future Measurement
Opportunity
Potential future opportunity includes:
Educational opportunity
Comparison opportunity
Project initiation
Regulatory opportunity

Good measurement has potential to improve program quality over
the long term.
Can reveal savings and effectiveness of difficult to measure
conservation programmes.
Proper measurement is crucial in any Water Conservation &
Demand Management initiative and serves as an indicator of the
level of achievement in meeting the City Water Demand
Management & Water Conservation long term strategy objectives.
Conclusion
Thank you!