The Importance of Lipids to Biofilm Formation - ULisboa · The Importance of Lipids to Biofilm...
109
The Importance of Lipids to Biofilm Formation Carlos Júnio Caridade Rodrigues Thesis to obtain the Master of Science Degree in Biotechnology Supervisor: Doctor Carla da Conceição Caramujo Rocha de Carvalho Examination Committee Chairperson: Professor Isabel Maria de Sá Correia Leite de Almeida Supervisor: Doctor Carla da Conceição Caramujo Rocha de Carvalho Members of the Committee: Doctor Pedro Carlos de Barros Fernandes November 2014
Transcript of The Importance of Lipids to Biofilm Formation - ULisboa · The Importance of Lipids to Biofilm...

The Importance of Lipids to Biofilm Formation
Carlos Júnio Caridade Rodrigues
Thesis to obtain the Master of Science Degree in
Biotechnology
Supervisor: Doctor Carla da Conceição Caramujo Rocha de Carvalho
Examination Committee
Chairperson: Professor Isabel Maria de Sá Correia Leite de Almeida
Supervisor: Doctor Carla da Conceição Caramujo Rocha de Carvalho
Members of the Committee: Doctor Pedro Carlos de Barros Fernandes
November 2014


I
Acknowledgements
I would like to thank all those who directly or indirectly contributed to this thesis and
supported me during the last year.
First, I would like to express my thanks to my supervisor Dr. Carla de Carvalho for the
proposal of this thesis, the support and guidance along the last year. For sure, the
knowledge acquired with her in the last year will contribute for my future career.
I would like to say thank you to the BEBL group and the department of Bioengineering
for receiving me in their laboratories and for support in the thesis.
I would like to acknowledge Fundação para a Ciência e a Tecnologia (FCT) for partially
funding this studies through the project “Defects Detection in Microfabrication With
Bacterial Cells" (PTDC/EME-TME/118678/2010).
I would like also to say thank you to my colleagues of the Master degree in Biotechnology
that helped me in this journey. Especially to Fábio Gonçalves that shared the laboratory
with me.
At last but no less important, I would like to express my gratitude to my family and friends
that were indispensable to achieve my final thesis work.
Thank you!


II
Abstract
In nature, most of the microorganisms grow attached to surfaces as biofilms, which are
communities of cells encased in an extracellular matrix conferring protection against
environmental hazards. Biofilms are responsible for industrial problems and are related
to hospital infections. The Rhodococcus and Mycobacterium genera, unlike other
microorganisms, produce an extracellular matrix rich in lipids. The aim of this work was
the elucidation of the role of the lipids of Rhodococcus erythropolis DCL14 during cell
attachment to surfaces and biofilm formation. Adhesion assays were performed to
identify the variations in physicochemical cell surface properties. The type of surface, the
medium and the carbon source used for biofilm growth influenced its architecture. On
tubular surfaces, the decrease of cell hydrophobicity was connected to the contact angle
of the surface tested. Also, the biofilm formation was influenced by the growth phase of
the initial cells, as well, by the presence of limonene. In a biofilm reactor, the cells showed
surface charge and membrane composition similar to planktonic cells along time. The
development of a flow cell system allowed the visualization of biofilm behaviour and
architecture in situ and in real time. Moreover, strongly adherent cells increased the
saturation of the membrane and the surface charge compared to weakly adherent cells.
Under specific conditions, the increase of 10-methyl branched fatty acids on cell
membrane correlated with the increase of biofilm formed on several surfaces. The results
obtained in this study may contribute to a greater understanding of the complexity of
biofilms.
Keywords: biofilm, lipids, surface charge, adhesion, flow cell


III
Resumo
Na natureza, a maioria dos microorganismos crescem aderidos a superfícies como
biofilmes, que são comunidades de células envoltas numa matriz extracelular que
confere proteção contra agressões ambientais. Os biofilmes são responsáveis por
problemas industriais e estão relacionados com infeções hospitalares. Os géneros
Rhodococcus e Mycobacterium, ao contrário de outros microorganismos produzem uma
matriz extracelular rica em lípidos. O objectivo deste trabalho foi elucidar o papel dos
lípidos de Rhodococcus erythropolis DCL14 durante a adesão celular e a formação de
biofilmes em superfícies. Ensaios de adesão foram realizados para identificar variações
nas propriedades físico-químicas da superfície celular. O tipo de superfície, o meio e a
fonte de carbono onde os biofilmes cresceram influenciaram a sua arquitetura. Nas
superfícies tubulares, o decréscimo da hidrofobicidade celular foi relacionada com o
ângulo de contacto da superfície. A formação de biofilme foi também influênciada pela
fase de crescimento das células iniciais, e pela presença de limoneno. Num reactor, as
células do biofime apresentaram carga superficial e composição de membrana
semelhantes às células plantónicas ao longo do tempo. A construção de um sistema de
flow cell permitiu a visualização do comportamento do biofilme e a sua arquitetura in situ
e em tempo real. Além disso, células fortemente aderidas aumentaram a saturação da
membrana celular e a carga da superfície comparativamente a células fracamente
aderidas. Em condições específicas, o aumento na membrana celular de ácidos gordos
10-metil ramificados correlacionou-se com o aumento do biofilme formado em várias
superfícies. Os resultados obtidos neste estudo poderão contribuir para compreender
melhor a complexidade dos biofilmes.
Palavras-chave: biofilme, lípidos, carga da superfície, adesão, flow cell

IV
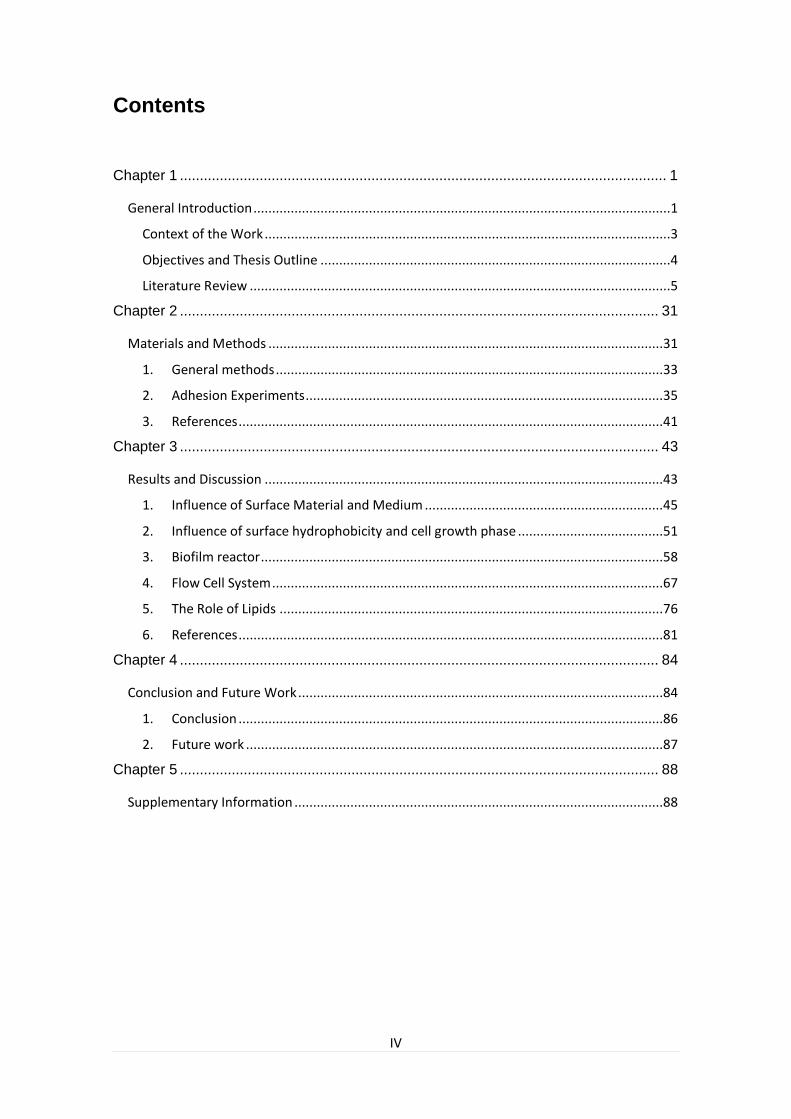
Contents
Chapter 1 .......................................................................................................................... 1
General Introduction ................................................................................................................1
Context of the Work .............................................................................................................3
Objectives and Thesis Outline ..............................................................................................4
Literature Review .................................................................................................................5
Chapter 2 ........................................................................................................................ 31
Materials and Methods ..........................................................................................................31
1. General methods ........................................................................................................33
2. Adhesion Experiments ................................................................................................35
3. References ..................................................................................................................41
Chapter 3 ........................................................................................................................ 43
Results and Discussion ...........................................................................................................43
1. Influence of Surface Material and Medium ................................................................45
2. Influence of surface hydrophobicity and cell growth phase .......................................51
3. Biofilm reactor ............................................................................................................58
4. Flow Cell System .........................................................................................................67
5. The Role of Lipids .......................................................................................................76
6. References ..................................................................................................................81
Chapter 4 ........................................................................................................................ 84
Conclusion and Future Work ..................................................................................................84
1. Conclusion ..................................................................................................................86
2. Future work ................................................................................................................87
Chapter 5 ........................................................................................................................ 88
Supplementary Information ...................................................................................................88


V
List of Figures
Figure 1.1 – Steps of biofilm development. ..................................................................... 7
Figure 1.2 – The original Robbins’ device (RD) and the modified RD (MRD). ............. 20
Figure 1.3 – Scheme of a Rotating annular reactor ...................................................... 20
Figure 1,4 – Scheme of a Rotating Disk Reactor.......................................................... 21
Figure 1.5 - Flow cell under optical microscope with recirculating flow system. .......... 22
Figure 1.6 – The basis of confocal laser scanning microscopy. ................................... 24
Figure 2.1 – Schematic illustration of the recirculation tube system. ........................... 37
Figure 2.2 – Biofilm reactors in operation. .................................................................... 38
Figure 2.3 – Schematic illustration of the flow cell construction and cover bonding with
liquid PDMS. ................................................................................................................... 39
Figure 2.4 – Final flow cell with adapters installed. ...................................................... 39
Figure 2.5 - Schematic illustration of the flow cell system setup. ................................. 40
Figure 3.1 – Fatty acid composition of cells collected from biofilm and liquid medium.46
Figure 3.2 – Degree of saturation of cells collected from the biofilm and planktonic cells.
........................................................................................................................................ 47
Figure 3.3 – Percentage of area occupied by the biofilm in the images presented in
Figure S1 of Chapter 5. .................................................................................................. 48
Figure 3.4 – Percentage of area occupied by the biofilm in the images presented in
Figure S3 of the Chapter 5. ............................................................................................ 49
Figure 3.5 – Influence of the percentage of 10MBFAs on the area occupied by biofilm.
........................................................................................................................................ 50
Figure 3.6 – Contact angles formed by sessile liquid drops on a smooth homogeneous
solid surface. ................................................................................................................... 51
Figure 3.7 – Correlation between the contact angle and the FAs with more (>C16) or
less (<C16) than sixteen carbons in their structure. ...................................................... 53
Figure 3.8 – Fatty acid composition of the cells attached to the inside surface of tubes
in the recirculation reactor system with ethanol (0.25% v/v) as carbon source. ........... 55
Figure 3.9 – Lipid weight of cells adherent to the tube surfaces at the end of system
operation. ........................................................................................................................ 56
Figure 3.10 – Fatty acid composition of the cells attached to the inside surface of tubes
in the recirculation reactor .............................................................................................. 57
Figure 3.11 – Lipid weight of cells adherent to the tube surfaces at the end of the system
operation using propionic acid (0.25% v/v) or propionic acid with limonene (0.25% v/v)
as carbon sources. ......................................................................................................... 58
VI
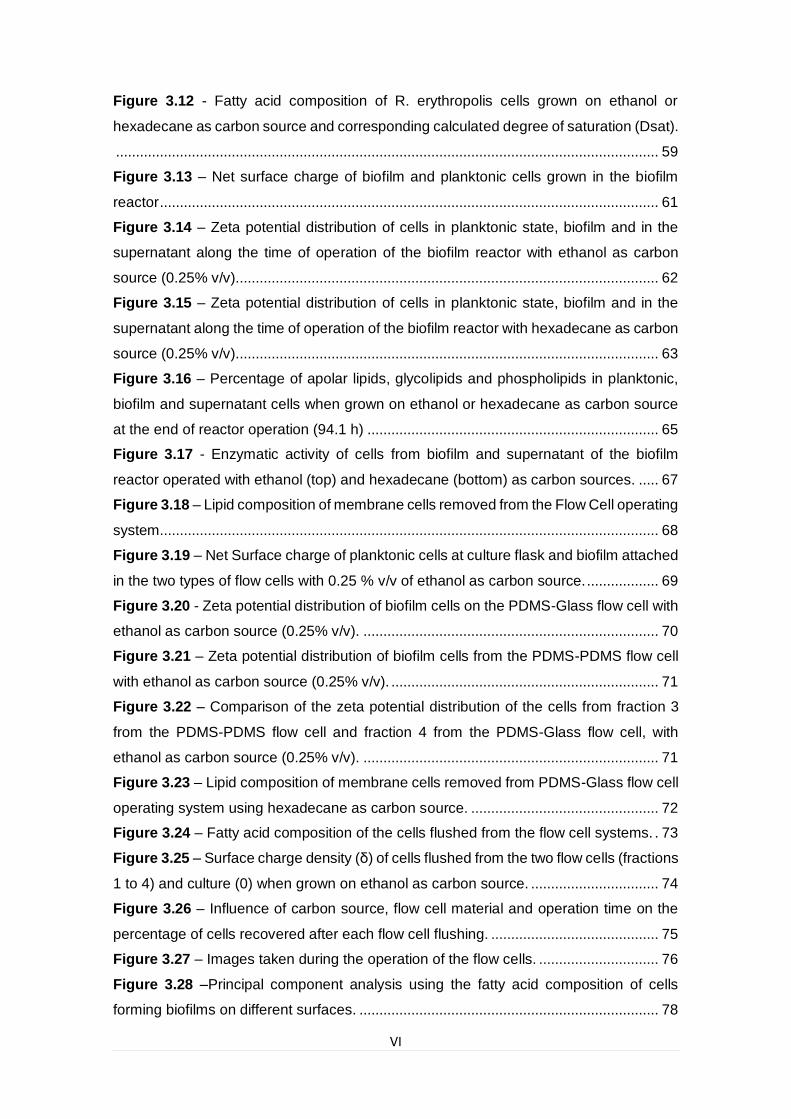
Figure 3.12 - Fatty acid composition of R. erythropolis cells grown on ethanol or
hexadecane as carbon source and corresponding calculated degree of saturation (Dsat).
........................................................................................................................................ 59
Figure 3.13 – Net surface charge of biofilm and planktonic cells grown in the biofilm
reactor ............................................................................................................................. 61
Figure 3.14 – Zeta potential distribution of cells in planktonic state, biofilm and in the
supernatant along the time of operation of the biofilm reactor with ethanol as carbon
source (0.25% v/v). ......................................................................................................... 62
Figure 3.15 – Zeta potential distribution of cells in planktonic state, biofilm and in the
supernatant along the time of operation of the biofilm reactor with hexadecane as carbon
source (0.25% v/v). ......................................................................................................... 63
Figure 3.16 – Percentage of apolar lipids, glycolipids and phospholipids in planktonic,
biofilm and supernatant cells when grown on ethanol or hexadecane as carbon source
at the end of reactor operation (94.1 h) ......................................................................... 65
Figure 3.17 - Enzymatic activity of cells from biofilm and supernatant of the biofilm
reactor operated with ethanol (top) and hexadecane (bottom) as carbon sources. ..... 67
Figure 3.18 – Lipid composition of membrane cells removed from the Flow Cell operating
system. ............................................................................................................................ 68
Figure 3.19 – Net Surface charge of planktonic cells at culture flask and biofilm attached
in the two types of flow cells with 0.25 % v/v of ethanol as carbon source. .................. 69
Figure 3.20 - Zeta potential distribution of biofilm cells on the PDMS-Glass flow cell with
ethanol as carbon source (0.25% v/v). .......................................................................... 70
Figure 3.21 – Zeta potential distribution of biofilm cells from the PDMS-PDMS flow cell
with ethanol as carbon source (0.25% v/v). ................................................................... 71
Figure 3.22 – Comparison of the zeta potential distribution of the cells from fraction 3
from the PDMS-PDMS flow cell and fraction 4 from the PDMS-Glass flow cell, with
ethanol as carbon source (0.25% v/v). .......................................................................... 71
Figure 3.23 – Lipid composition of membrane cells removed from PDMS-Glass flow cell
operating system using hexadecane as carbon source. ............................................... 72
Figure 3.24 – Fatty acid composition of the cells flushed from the flow cell systems. . 73
Figure 3.25 – Surface charge density (δ) of cells flushed from the two flow cells (fractions
1 to 4) and culture (0) when grown on ethanol as carbon source. ................................ 74
Figure 3.26 – Influence of carbon source, flow cell material and operation time on the
percentage of cells recovered after each flow cell flushing. .......................................... 75
Figure 3.27 – Images taken during the operation of the flow cells. .............................. 76
Figure 3.28 –Principal component analysis using the fatty acid composition of cells
forming biofilms on different surfaces. ........................................................................... 78

VII
Figure 3.29 – PLS analysis of the relation between the FA composition of cellular
phospholipids and the amount of biofilm formed. .......................................................... 80

IX
List of Tables
Table I – Variables affecting the cell attachment and biofilm formation (adapted from
[22]). ................................................................................................................................ 14
Table II – Contact angles of the tubes used in the recirculation tube system. ............. 37
Table III – Tubes used in the recirculation biofilm reactor system and their respective
contact angle measured in the laboratory. ..................................................................... 52
Table IV – Enzymes present in the enzymatic kit used (API ZYM®, BioMérieux). ....... 65
Table V – Fatty acid composition of adhered cells in different surfaces used for the
PCA. ................................................................................................................................ 77
Table VI – Normalized volume of the biofilm formed on each surface, used as
response vector for the PLS analysis. ........................................................................... 79


XI
Abbreviations
10MBFAs – 10-methyl branched fatty acids
Al – Aluminium
AMPs – Antimicrobial peptides
Bap – Biofilm associated surface proteins
BCFAs – Saturated iso- and anteiso-methyl branched fatty acids
CaP – Calcium phosphate
CLSM – Confocal laser scanning microscopy
CSTR – Continuous flow stirred-tank reactor
Cu – Copper
DAPI – 4',6-diamidino-2-phenylindole
DFO-Ga – Desferrioxamine-gallium
DMAFAs – Dimethylacetals fatty acids
DNA – Extracellular deoxyribonucleic acid
eDNA – Extracellular deoxyribonucleic acid
EDTA – Ethylenediamine tetraacetic acid
EPS – Extracellular polymeric substances
FA(s) – Fatty acid(s)
FAMEs – Fatty acid methyl esters
Fe – Iron
FID – Flame ionization detector
GC – Gas chromatograph
GFP – Green fluorescent protein
HSFAs – Hydroxy substituted fatty acids
MH – Muller-Hinton medium
MIC – Minimum inhibitory concentration
MM – Mineral medium
MUFAs – Mono-unsaturated fatty acids
OD – Optical density
Pb – Lead
PCA – Principal components analysis
PDMS – Polydimethylsiloxane
PE – Polyethylene
PET – Polyethylene terephthalate
PLS – Partial least squares
PTFE – Polytetrafluoroethylene
PUFAs – Poly-unsaturated fatty acids
RNA – Ribonucleic acid
ROS – Reactive oxide species
SCBFAs – Saturated cyclopropyl-branched fatty acids
SEM – Scanning electron microscopy
SSFAs – Saturated straight chain fatty acids
SWNTs – Single-walled carbon nanotubes
TAGs – Triacylglycerols
TEM – Transmission electron microscopy
Zn – Zinc


Chapter 1
General
Introduction
Context of the Work .............................................................................................................3
Objectives and Thesis Outline ..............................................................................................4
Literature Review .................................................................................................................5
1. The Importance of Actinomycetes............................................................................5
2. Biofilms .....................................................................................................................6
2.1. The Discover of Biofilms ...................................................................................6
2.2. Biofilm Development and Life Cycle .................................................................7
2.3. The Biofilm Extracellular Matrix .......................................................................8
2.4. Factors Affecting Cell Attachment and Biofilm Formation ..............................11
3. Combating Biofilms ................................................................................................14
3.1. The Problem and Challenges ..........................................................................15
3.2. New Solutions and Strategies .........................................................................16
4. Studying Biofilms in Laboratory ..............................................................................18
4.1. Growing Biofilms ............................................................................................19
4.2. Monitoring Biofilms ........................................................................................22
5. References ..............................................................................................................25

Chapter 1 General Introduction
3 | P a g e
Context of the Work
Microorganisms are found in most of the surfaces of the world, from the most remote
areas, such as deserts and volcanoes, to our food and body. It is estimated that 99% of
microbes are on the surfaces in biofilms [1]. Biofilms are characterized by communities
of cells that are encased in an extracellular matrix that protect the cells against
environmental aggressions and are among the most successful forms of life in nature.
Only a small number of studies regarding biofilms are focused on gram positive bacteria.
One of the genus of interest to study is the Rhodococcus genus which comprise strains
(e.g. Rhodococcus erythropolis) that could be used in bioremediation processes to
degrade xenobiotics and which have recently be related to hospital infections (e.g.
Rhodococcus equi) because of their natural tolerance against antibiotics and
disinfectants. These bacteria belong to the actinomycete group, and to the mycolata
taxon which contains bacterial species with mycolic acids on their cell walls and produce
an extracellular matrix rich in lipids. Few studies have addressed the importance and
role of lipids on cell adhesion and consequently on the formation and development of a
mature biofilm.
Previous work conducted at the Institute for Biotechnology and Bioengineering (IBB),
showed the capacity of R. erythropolis DCL14 to adapt the fatty acid composition of their
cell membrane to different carbon sources [2]. In other study, the use of carveol and
carvone to influence the fatty acid composition of the cell membrane was shown to
reduce R. erythropolis biofilm [3]. In 2009, the comparison of surface membrane
properties in planktonic and biofilm cells was assessed using different alkanes as
carbon source [4]. Different alterations between the two life styles were observed,
including production of surface active compounds and substrate-dependent
alterations of physicochemical cell surface properties.
The studies proposed in this work derived from the need to further understand
the role and importance of lipids in biofilms. The elucidation of their role could
contribute to better bioremediation processes and to the control of biofilm related
medical infections.

Chapter 1 General Introduction
4 | P a g e
Objectives and Thesis Outline
In order to elucidate the role of lipids during cell attachment to surfaces and biofilm
formation, the objectives of the master studies were the following:
i. to develop a system allowing in vivo visualization of lipids during cell adhesion
to surfaces (including design of a microreactor allowing fluorescence
microscopy imaging and testing of adequate fluorophores);
ii. to understand the molecular events that determine the attachment of
previously planktonic cells;
iii. to determine the identity of the lipids produced by the cells during the
formation of the matrix;
To achieve such goals, the work included the following tasks: the development of flow
chamber and microscale reactors for biofilm development and monitoring; the
assessment of cell morphology and lipid localization by fluorescence microscopy and
image analysis; evaluation of cell surface properties; and, lipid extraction and fatty acid
analysis by gas chromatography.
This thesis is divided in 5 Chapters:
Chapter 1 - the context of this work, the objectives and the literature review, focusing
the current knowledge of biofilms, the strategies to demote their formation and
techniques to study bacterial biofilms are presented.
Chapter 2 - the general methodologies used in this thesis are listed, including the
experiments for studying bacterial adhesion and biofilm formation on different surfaces
and the effect of the fatty acid composition of the cell membrane. The experiments used
included a 6-well plate assay, a recirculation tube system, biofilm reactors and flow cell
systems.
Chapter 3 - the results from the experiments conducted during the master thesis studies
and their discussion are presented.
Chapter 4 – summary of the principle conclusions derived from the thesis and
presentation of suggestions for future work.
Chapter 5 – supplementary information is presented.

Chapter 1 General Introduction
5 | P a g e
Literature Review
1. The Importance of Actinomycetes
Actinobacteria is a phylum comprising gram-positive bacteria able to cause important
infections (e.g. Mycobacterium tuberculosis, M. leprae, Corynebacterium diphtheria) but
also able to produce secondary metabolites industrially important (e.g. antibiotics) and
to convert and degrade recalcitrant xenobiotics.
The principal contribution to the drug discovery and development in the last seven
decades came from microbial natural products [5]. The foundation for development of
microbial natural products as drugs started with the discovery of penicillin in 1928 by
Fleming [6] and its progressive introduction into medicine in the 1940s [7]. The first
antibiotics from actinomycetes were reported in the same decade (1940, actinomycin [8];
1942, streptothricin [9]; 1943, streptomycin [10]). In the end of the last century, numerous
compounds have been reported with medical applications, acting as antibacterial,
antifungal, antiparasitic, and/or anticancer agents [11].
Of the total bioactive secondary metabolites reported, 45% are produced by
actinomycetes and from these, the principal producer are the species of the genus
Streptomyces (75%) [5, 12]. This data reveal the importance of actinomycetes in
combating infectious diseases.
Despite the problematic cases of antibiotic-resistance bacteria, it is believed that the
utility of natural products as sources of novel structures is still alive and the anti-infective
area depends on natural products and their structures [13]. Indeed, in the last years new
efforts have been done to found new and unexploited actinomycetes. Scientists are
looking for rare actinomycetes in remote areas, such as in marine environments, volcanic
zones, glaciers, extreme arid and salted areas, with the objective of finding new
therapeutical agents [14].
In addition to antibiotic production, actinomycetes have great potential for bioremediation
processes. For instance, Alvarez et al. described a strategy using three actynomycete
strains to clean up soils contaminated with organic pollutants, such as crude oil [15]. In
other study, a Streptomyces sp. M7 strain was used to degrade an organochlorine
pesticide (γ-HCH) with carcinogen potential [16]. The potential of Rhodococcus
erythropolis for bioremediation applications has been described in several studies [2, 17,
18], including a study by de Carvalho et al. describing the capability of Rhodococcus
Chapter 1 General Introduction
6 | P a g e
erythropolis to utilize C5 to C16 n-alkane hydrocarbons as sole source of carbon and
energy [4].
In nature, most cells grow as biofilms which are communities of cells embedded in a
“sticky” matrix (discussed further in this work) and not in planktonic state as normally
studied in laboratory [19]. In fact, Morikawa [20] drew attention to the need of new
cultivation strategies, particularly strategies mimicking the natural habitats of
microorganisms, with niche-mimicking bioreactors that can be used to elicit the
production of secondary metabolites by apparent nonproducers.
Actinomycetes, in particular Rhodococcus and Mycobacterium, unlike other
microorganisms, produce an extracellular matrix rich in lipids including long chain fatty
acids and mycolic acids [21]. As Ojha et al. [21] showed, the influence of lipids in
Mycobacterium tuberculosis biofilm formation can lead to the development of new
strategies against the infections caused by this microorganism. In the same direction,
understanding the influence of lipids in adhesion and biofilm formation on actinomycete
producers of antibiotics or enrolled in bioremediation processes, such as
R. erythropolis, can lead to new discoveries and applications in these areas.
2. Biofilms
2.1. The Discover of Biofilms
In the seventeenth century, Antonie van Leeuwenhoek observed in his primitive
microscope some kind of life that he called “animalcules”. The isolates, removed from
his own teeth that contained these “animalcules” are what we know today as bacteria of
the dental plaque. This first documented study of dental plaque can be considered the
first evidence of the existence of microbial biofilms [22].
After the brilliant work of Antonie van Leeuwenhoek, only in 1940 some advances were
carried out in biofilm research. Heukelekian and Heller [23] observed that bacterial
growth and activity were substantially enhanced by the incorporation of a surface to
which these organisms could attach: the called “bottle effect” for marine microorganisms
was observed. Also, Zobell noted that aquatic bacteria were more numerous on the solid
surfaces of sample containers than as single suspended cells [24].
Despite these two documented studies on biofilms, the interest in the physical and
chemical properties of biofilm only began in 1960s and early 1970s. Using electron
microscopy Jones et al. [25] showed that biofilms are composed of different

Chapter 1 General Introduction
7 | P a g e
microorganisms and also concluded that the extracellular matrix was mainly composed
by polysaccharides. Characklis referred to biofilms as tenacious and highly resistant after
his studies on microbial slimes present in industrial water [26]. In 1978, Costerton et al.
showed that many bacteria spent the majority of their life in sessile communities attached
to surfaces and proposed some mechanisms of microbial adherence [27]. Further
studies of diverse areas in biofilms focused on the composition of the polymer matrix [28,
29].
Researchers have been defining biofilms in various ways. Characklis and Marshall
(1990) defined a biofilm as consisting of “cells immobilized at a substratum and
frequently embedded in an organic polymer matrix of microbial origin” [30]. In 1995,
Costerton et al. defined biofilms as “matrix-enclosed bacterial populations adherent to
each other and/or to surfaces or interfaces” and presented the “basic model” for biofilms
[31]. In this model, microorganisms form microcolonies that are surrounded by an
extracellular matrix interspersed with open water channels. Other way of defining biofilms
is in terms of what they are not: single cells homogeneously dispersed in fluids [32].
In the last decade, significant advances in the understanding of the behaviour of biofilms
have been achieved and will be addressed further in this work.
2.2. Biofilm Development and Life Cycle
Most studies regarding bacteria were made using planktonic cells. However, bacteria are
predominantly attached to surfaces in an extracellular matrix that we refer as biofilms.
The formation of a biofilm is divided in the following steps: migration of planktonic cells
into a surface proximity, attachment of cells to a surface, growth of biofilm and
detachment of portions of the biofilm for colonization of new surfaces (Figure 1.1) [30,
33-35].
Figure 1.1 – Steps of biofilm development. 1 – Interaction of
planktonic cells with
surface,
2 - attachment of cells to
the surface.
3- Growth of biofilm.
4- Detachment of
cells/portions of biofilm.
(Adapted from Ref [36])
Chapter 1 General Introduction
8 | P a g e
During the first step, cells interact with surfaces by Wan der Waals, hydrophobic and
electrostatic forces that are dependent on the nature and the distance between cells and
surfaces [37]. When cells adhere to surfaces (step2) they start to grow and to produce
an extracellular polymeric substance (EPS) which will form a matrix. The biofilm structure
further increases with the attachment of cells and other particulate matter leading to a
complex and dynamic structure originating a mature biofilm (step 3). The detachment of
portions of biofilm and of daughter cells into the bulk water allow the colonization of new
surfaces (step 4) [30]. Depending on environmental conditions or strain, biofilms can
have a “mushroom shape” or a “carpet-like” form [35].
The heterogeneous structure of biofilms include some characteristics such as cell
clusters, void spaces, water channels to supply nutrients and remove wastes, and slime
streamers that are affected by flow of the fluid surrounding the biofilm [38].
2.3. The Biofilm Extracellular Matrix
The principal characteristic of biofilms is the production of sticky polymeric substances
in which microbial cells are embedded. When compared planktonic cells, this is the most
obvious difference. EPS protects the cells against several environment aggressions such
as fluctuating pH [39], exposure to UV light [40], dehydration [41] and antimicrobial
agents [42, 43]. EPS is difficult to characterize because their composition varies
depending on the organisms present in the biofilm and on environmental parameters
[35]. The principal composition of EPS in most of the bacterial species are
polysaccharides, but they may also contain proteins, nucleic acids, lipids and other
biopolymers such as humic substances [44]. In most biofilms, the matrix can account for
over 90% of the dry mass, whereas the microbial cells account for less than 10% [44].
The EPS determines a life style very different from planktonic cells. In terms of
architecture, the biofilms can be smooth and flat, rough, fluffy or filamentous [44].
Water
Water is by far the largest component of the biofilm matrix, reaching up to 97% of the
mass [44, 45]. The EPS matrix provides a highly hydrated environment that dries slower
than its surroundings and therefore protects the biofilm cells against fluctuations in water
potential and desiccation [46]. In fact, desiccation seems to be one of the environmental
conditions under which EPS provides evident global benefits to both EPS producers and
other members of the biofilm community. Besides, the EPS matrix can also act as a
Chapter 1 General Introduction
9 | P a g e
molecular sieve, sequestering cations, anions, apolar compounds and particles from the
water phase [47].
Exopolysaccharides
Polysaccharides are the most studied components of the EPS matrix since they
constitute the major fraction in most bacterial species [48]. Most of them are
characterized by long molecules, linear or branched, with a molecular mass of 0.5×10⁶
Daltons to 2×10⁶ Daltons [44]. Exopolysaccharides can be classified as
homopolysaccharide or heteropolysaccharide depending on their structure. The
homopolysaccharides are composed by sucrose-derived glucans and fructans,
produced by the Streptococci in oral biofilms and cellulose produced by
Gluconacetobacter xylinus, Agrobacterium tumefaciens, Rhizobium spp. and other
species [44]. Nevertheless, a big percentage of exopolysaccharides are
heteropolysaccharides composed by a mixture of neutral and charged sugar residues.
Some of the most well-known, such as alginate or xanthan are negatively charged
(polyanionic) [44]. Few are positively charged (polycationic), such as intercellular
adhesin, which is composed of β-1,6-linked N-acetylglucosamine with partly
deacetylated residues, produced by Staphylococcus aureus and S. epidermidis and
related to medical infections [49].
Different exopolysaccharides can be found between strains of a single species. For
example, P. aeruginosa strains produce at least three different expolysaccharides
(alginate, Pel and Psl) that contribute for biofilm development and architecture [50].
Several polysaccharides are attached to the cell surface and form complex networks as
fine strands. Also, polymer strands can interact with each other, forming a viscous
aqueous solution with gel-like properties [35].
Extracellular Proteins
The percentage of extracellular proteins in the matrix can vary widely relatively to other
biopolymers. Enzymatic proteins are involved in the degradation of biopolymers that
include water-soluble polymers (e.g. polysaccharides, proteins and nucleic acids), water-
insoluble compounds (e.g. cellulose, chitin and lipids) and organic particles trapped in
biofilms [51]. According to Flemming et al. [44] the low-molecular-mass products may
be used as carbon source by cells. Other enzymes are involved in the detachment of
bacteria from biofilms, through the degradation of structural EPS, contributing to cell
Chapter 1 General Introduction
10 | P a g e
dispersion and colonisation of new surfaces [44]. Moreover, some enzymes are involved
in infectious processes actuating as virulence factors. On the other hand, lectins (non-
enzimatic proteins) are essential for the formation and stabilization of the matrix and
constitute a bridge between the EPS and bacterial surface [44]. Some studies described
these binding proteins in dental biofilms of Streptococcus mutans [52], matrices of
activated flocs [53] and on outer membrane of Azospirillum brasiliense [54].
Biofilm associated surface proteins (Bap) are other type of extracellular proteins. These
high-molecular-mass proteins are present on the cell surface of many species promoting
biofilm formation [55].
Extracellular DNA (eDNA)
Biofilms of various origins have been found to contain eDNA as an integral part of EPS,
although the amount produced, its origin, and its localization can vary even between
closely related species [44]. In genus Rhodovulum, eDNA is important for microbial
aggregation, allowing flocculation of bacteria. When this marine photosynthetic bacteria
was treated with nucleolytic enzymes the result was deflocculation, but with enzymes
directed to the degradation of proteins and polysaccharides the bacteria kept the
flocculation ability [56]. In P. aeruginosa, eDNA is fundamental for biofilm formation,
acting as intercellular connector, stabilizing the biofilm. Once grown in the presence of
DNase I, biofilm formation was inhibited [57]. The eDNA has also antimicrobial activity,
causing cell lysis by chelating cations that stabilize lipopolysaccharide and the bacterial
outer membrane [58].
The origin of eDNA comes mainly from lysed cells, although the excretion of DNA is also
an hypothesis. In an aquatic bacterium, biofilm eDNA presents major similarities in
banding patterns with genomic DNA but also some significant differences suggesting
that eDNA is not the result of autolysis but obviously of some active production and
transport system. [59]. In a study aimed at evaluating eDNA in single and multispecies
biofilms (involving Pseudomonas aeruginosa, P. putida, R. erythropolis and Variovorax
paradoxus), the authors concluded that eDNA production was species dependent and
the phylogenetic information present in the DNA pool was distinct from either total or
cellular DNA [60].
Chapter 1 General Introduction
11 | P a g e
Lipids and Biosurfactants
Some species produce EPS with hydrophobic properties. For example, a Rhodococcus
sp. strain, that possesses a capsule but no fimbriae, can adhere to Teflon and colonizes
waxy leaf surfaces using EPS with hydrophobic properties [61].
In activated sludge, lipids were found in the matrix (around 1.8%) of yeasts, fungi, sulfate-
reducing bacteria, gram-positive and gram-negative bacteria, and, in lesser quantities,
of mycobacteria [62]. Lipopolysaccharides are involved in microbial adherence of
Thiobacillus ferrooxidans to pyrite surfaces [63], and Serratia marcescens that produces
extracellular lipids with surface-active properties [64]. Other lipids with surface-active
EPS include surfactin, viscosin and emulsan, which can disperse hydrophobic
substances and make them bioavailable. They may be useful for microbial enhanced oil
recovery and for bioremediation of oil spills [44]. In Rhodococcus erythropolis DCL14,
the surface tension of the culture supernatant decreased with increasing chain length of
the alkane that cells were using as sole carbon and energy source, reaching 23 and 37
mN/m when the cells used n-hexadecane in planktonic and biofilm state, respectively [4].
Ron and Rosenberg [65] referred that biosurfactants are produced by diverse
microorganisms with different characteristics and therefore may have different roles
during the growth of the producers. The same author suggested numerous roles of
biosurfactants, including antimicrobial activity, virulence factors and binding of heavy
metals.
2.4. Factors Affecting Cell Attachment and Biofilm Formation
The adhesion of bacterial cells to a surface in a solid-liquid interface is a key stage during
biofilm formation. The adhesion is affected by some factors such as: substratum,
conditioning films forming on substratum, hydrodynamics, and various properties of both
cell and material surfaces [22].
Substratum Effects
Busscher and Weerkamp [37] described the process of interaction between cells and
solid surfaces. According to him, at large (>50nm) and intermediated separation
distances (10-20nm), adhesion is mediated by macroscopic surface properties as
surface free energy and surface charge, respectively. At large separation distances, only
van der Waals forces operate because the distance between cells and surface is too

Chapter 1 General Introduction
12 | P a g e
large to opposite surfaces be recognized. At intermediated distances in addition to Wan
der Waals forces, electrostatic repulsion is also present. In this state the adhesion is
reversible. Changes in bacteria, such as production of adhesion probes and hydrophobic
groups repel water and exposed surfaces. The same authors suggested that the “major
role of hydrophobicity in bacterial adhesion is therefore its capacity to remove water
between contacting areas, enabling dehydrated parts to interact directly through short-
range interactions”. This enables the overcome of the potential energy barrier and
therefore molecular interactions (<1.5nm) (e.g. ionic, hydrogen and chemical bonds) to
take place. These specific interactions lead to irreversible adhesion [37].
Characteristics of the solid surface are important for the cell attachment process. The
roughness of a surface influences the biofilm formation [30]. In rough surfaces, the area
of contact with cells is larger and shear forces are diminished, so microbial colonization
increase as the roughness of the solid surface increases [22]. The physicochemical
properties of the surface may also exert a strong influence on the rate and extent of
attachment. Hydrophobic, nonpolar surfaces such as Teflon and other plastics have
been shown to be more rapidly colonized by microorganism than other hydrophilic
materials such as glass or metals [66-68]. In fact, the interaction between two
hydrophobic entities is favoured because they can enter into closer contact through the
decrease of the water in between [69].
Conditioning Films
Conditioning films occur mainly in nature when a material surface is exposed in an
aqueous medium. The surface becomes conditioned or coated by polymers from the
medium, affecting the cell attachment [22]. The role of the conditioning film in biofilm
development relies on its ability to modify the physico-chemical properties of the
substratum, as well as providing a concentrated nutrient source and important trace
elements. This will affect the rate and extent of microbial attachment [34]. In aquatic or
terrestrial environments, the conditioning layer has been shown to consist of complex
polysaccharides, glycoproteins and humic compounds [70, 71]. In Humans, a well-
studied case of conditioning biofilm is the dental plaque in oral diseases. The enamel of
teeth is conditioned by a “pellicle” composed of albumin, glycoproteins, lipids, lysozyme,
phosphoproteins and other components of saliva and gingival crevicular fluids [72]. In
biomaterials for human use, a number of host-produced conditioning films such as blood,
tears, urine, saliva, intravascular fluid, and respiratory secretions can be used to
influence the attachment of bacteria [73].

Chapter 1 General Introduction
13 | P a g e
Hydrodynamics
The cell attachment is affected by the flow velocity of the medium in which they are. The
area immediately adjacent to the substratum/liquid interface (boundary layer) is
dependent on the linear velocity of the fluid. The higher the linear velocity, the thinner is
the boundary layer. Thus, cell attachment is facilitated at higher linear velocities (up to a
certain value) because cells, as particles in a liquid, have to travel a minor distance [22].
Whereas at very low linear velocities, the boundary layer is larger, affecting the contact
of cells with the surface. In this case, the association with the surface will depend in
large part on cell size and cell motility [22]. Higher linear velocities would therefore be
expected to equate to more rapid association with the surface, at least until velocities
become high enough to exert substantial shear forces on the attaching cells, resulting in
detachment of these cells [22].
Characteristics of the Aqueous Medium
The characteristics of the aqueous medium that influence the rate of microbial
attachment to a substratum are the pH, nutrient concentration, ionic strength, and
temperature. Several studies have shown a seasonal effect on bacterial attachment and
biofilm formation in different aqueous systems [74, 75]. Fletcher and Loeb [76] suggested
that the increase of cations affect the attachment of Pseudomonas flourescens to glass
surfaces, presumably by reducing the repulsive forces between the negatively charged
bacterial cells and the glass surfaces. In other study, Cowan et al. [77] noted the
influence of different nutrient concentrations on the adhesion of multiple species biofilms.
Cell Properties
As previously stated, hydrophobicity play an important role in cell attachment. Bacterial
membranes have structures such as fimbriae, proteins, and flagella that contribute for
hydrophobicity of cell surface as reported by Rosenberg and Kjelleberg [69]. The same
authors showed that fimbriae contain a high proportion of hydrophobic amino acid
residues playing a role in cell surface hydrophobicity and attachment, probably by
overcoming the initial electrostatic repulsion barrier that exists between the cell and
substratum [78]. Mycolic acids of organisms (Corynebacterium, Nocardia, Rhodococcus
and Mycobacterium) contribute to the high hydrophobicity of cells, which increases with
the increase of mycolic acid chain length as stated by Bending et al. [68]. de Carvalho
and de Fonseca [3] showed that hydrophobicity increases linearly with the percentage
Chapter 1 General Introduction
14 | P a g e
of fatty acids with more than 16 carbons in R. erythropolis cell membrane. The use of
terpenes (carvone and carveol) promoted a decrease in the percentage of fatty acids
with more than 16 carbons and subsequently a decrease in cell hydrophobicity. Which
resulted in the dispersion of cells previously in an aggregated form. In other study, de
Carvalho et al. studied the physicochemical cell surface properties of R. erythropolis
demonstrating that biofilm cells are more hydrophobic compared with planktonic cells
utilizing the same carbon source [4].
By comparing motile and non-motile strains of Pseudomonas fluorescens, Korber et al.
[79] found that motility increases the success of attachment in both numbers and speed,
suggesting an important role of flagella in the early stages of bacterial attachment, by
overcoming the repulsive forces associated with the substratum. Another important
factor for cell attachment is the production of EPS and lipopolysaccharides that are
associated to the bacterial cell surface and serve as adhesive or adsorbents to cells and
seem to be more useful in colonization of hydrophilic surfaces [22].
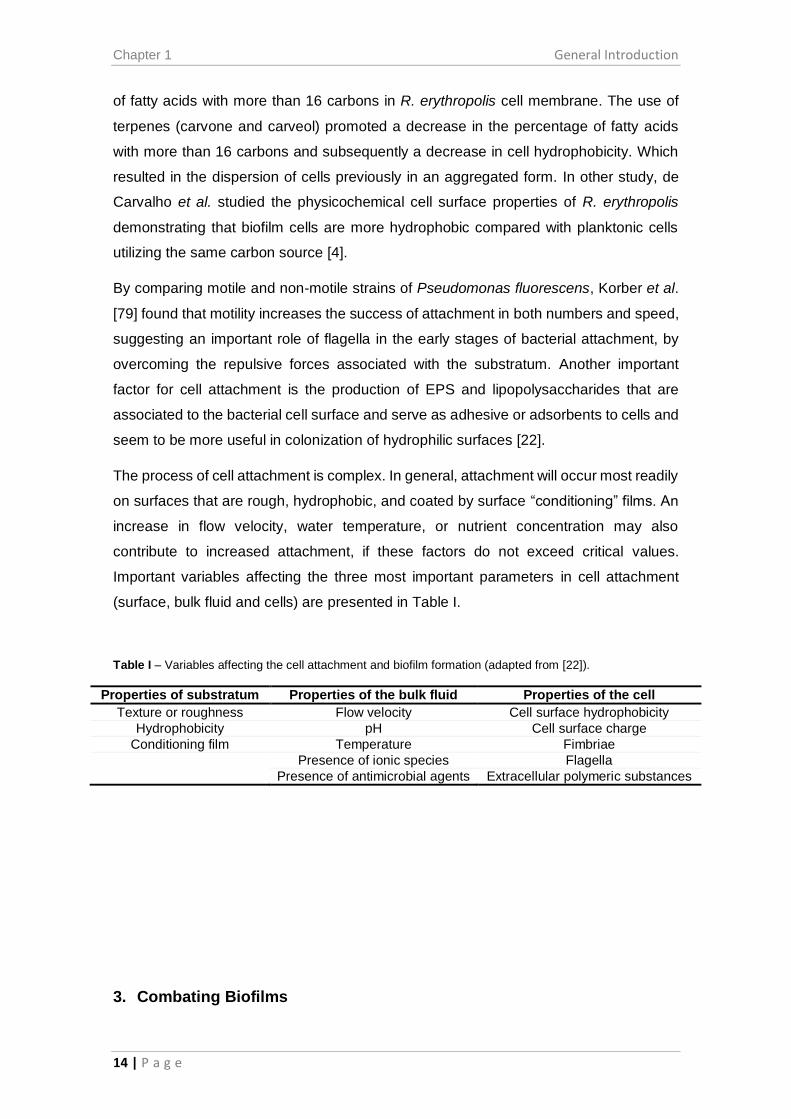
The process of cell attachment is complex. In general, attachment will occur most readily
on surfaces that are rough, hydrophobic, and coated by surface “conditioning” films. An
increase in flow velocity, water temperature, or nutrient concentration may also
contribute to increased attachment, if these factors do not exceed critical values.
Important variables affecting the three most important parameters in cell attachment
(surface, bulk fluid and cells) are presented in Table I.
Table I – Variables affecting the cell attachment and biofilm formation (adapted from [22]).
Properties of substratum Properties of the bulk fluid Properties of the cell
Texture or roughness Flow velocity Cell surface hydrophobicity
Hydrophobicity pH Cell surface charge
Conditioning film Temperature Fimbriae
Presence of ionic species Flagella
Presence of antimicrobial agents Extracellular polymeric substances
3. Combating Biofilms
Chapter 1 General Introduction
15 | P a g e
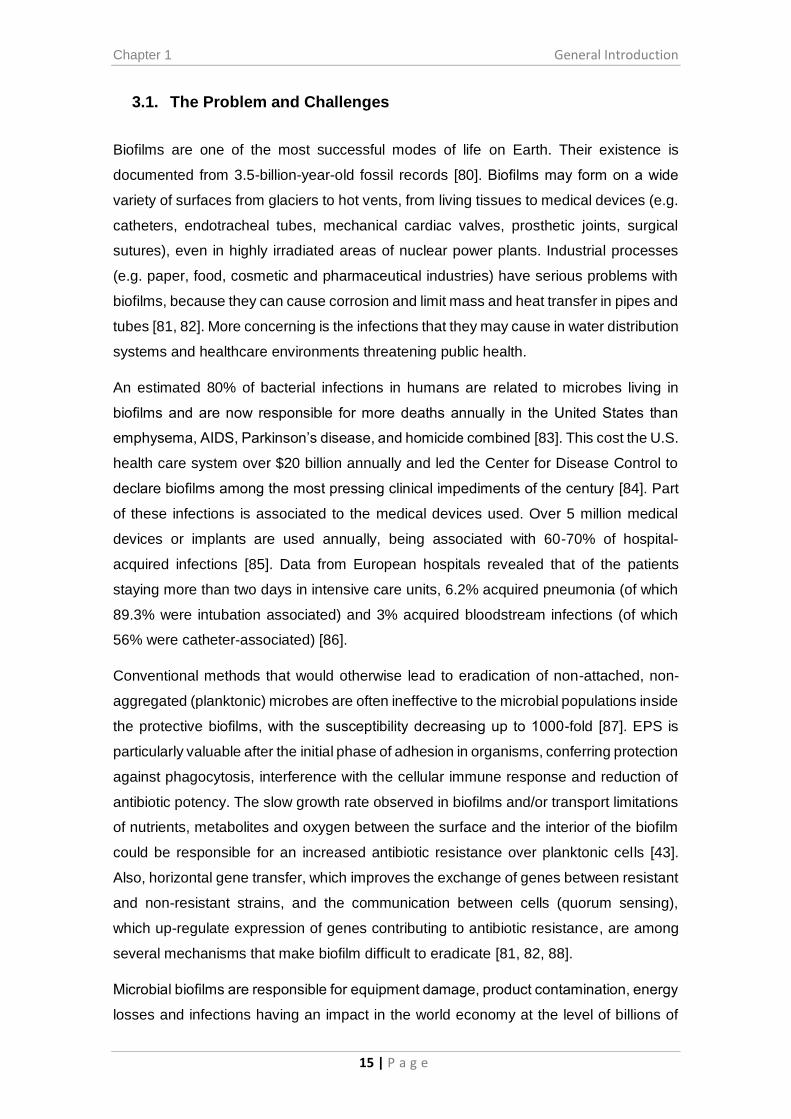
3.1. The Problem and Challenges
Biofilms are one of the most successful modes of life on Earth. Their existence is
documented from 3.5-billion-year-old fossil records [80]. Biofilms may form on a wide
variety of surfaces from glaciers to hot vents, from living tissues to medical devices (e.g.
catheters, endotracheal tubes, mechanical cardiac valves, prosthetic joints, surgical
sutures), even in highly irradiated areas of nuclear power plants. Industrial processes
(e.g. paper, food, cosmetic and pharmaceutical industries) have serious problems with
biofilms, because they can cause corrosion and limit mass and heat transfer in pipes and
tubes [81, 82]. More concerning is the infections that they may cause in water distribution
systems and healthcare environments threatening public health.
An estimated 80% of bacterial infections in humans are related to microbes living in
biofilms and are now responsible for more deaths annually in the United States than
emphysema, AIDS, Parkinson’s disease, and homicide combined [83]. This cost the U.S.
health care system over $20 billion annually and led the Center for Disease Control to
declare biofilms among the most pressing clinical impediments of the century [84]. Part
of these infections is associated to the medical devices used. Over 5 million medical
devices or implants are used annually, being associated with 60-70% of hospital-
acquired infections [85]. Data from European hospitals revealed that of the patients
staying more than two days in intensive care units, 6.2% acquired pneumonia (of which
89.3% were intubation associated) and 3% acquired bloodstream infections (of which
56% were catheter-associated) [86].
Conventional methods that would otherwise lead to eradication of non-attached, non-
aggregated (planktonic) microbes are often ineffective to the microbial populations inside
the protective biofilms, with the susceptibility decreasing up to 1000-fold [87]. EPS is
particularly valuable after the initial phase of adhesion in organisms, conferring protection
against phagocytosis, interference with the cellular immune response and reduction of
antibiotic potency. The slow growth rate observed in biofilms and/or transport limitations
of nutrients, metabolites and oxygen between the surface and the interior of the biofilm
could be responsible for an increased antibiotic resistance over planktonic cells [43].
Also, horizontal gene transfer, which improves the exchange of genes between resistant
and non-resistant strains, and the communication between cells (quorum sensing),
which up-regulate expression of genes contributing to antibiotic resistance, are among
several mechanisms that make biofilm difficult to eradicate [81, 82, 88].
Microbial biofilms are responsible for equipment damage, product contamination, energy
losses and infections having an impact in the world economy at the level of billions of

Chapter 1 General Introduction
16 | P a g e
dollars [88]. Therefore, novel strategies based on a more fulfilling understanding of the
biofilm phenomenon are urgently needed.
3.2. New Solutions and Strategies
At the present, different approaches are being developed to prevent and destroy biofilms.
Investigators have focused their knowledge in the different phases of formation of biofilm
to propose combating strategies. Some of the strategies addressed in this work are
based on the reviews of Yang et al. [88] and de Carvalho [81, 82].
Modification of Surfaces
Some examples of strategies directed to the process of adhesion with the objective of
prevent microbial biofilm colonization, invasion and formation on surfaces will be
discussed below.
Antimicrobial agents can be immobilized on surfaces, through non-covalently binding,
covalently immobilization and entrapment on polymer matrices to kill attaching
organisms [88]. For example, peptides (oligopeptides, polypeptides or peptidomimetics),
metallic compounds (metals and alloys based), composite ceramic materials (including
oxides, carbides or nitrides of transition elements) could be applied safely in medical
implants and catheters, surgical tools and garments, and in bandages to make efficient
antimicrobial coatings [89]. In this regard, Gobin [90] invented a coating material that
inhibit biofilm formation from catheters with the application of an antimicrobial agent and
biofilm-degrading enzyme embedded in a matrix material. In other study, Kazemzadeh
Narbat et al. presented a study were antimicrobial peptides (AMPs) were loaded in a
matrix of calcium phosphate (CaP) coated with titanium, using a simple soaking
technique, and antimicrobial activity against both Gram-positive (Staphylococcus
aureus) and Gram-negative (P. aeruginosa) was revealed [91].
Other approaches try to use non-biocidal agents (e.g. peptides, aptamers and bovine
lactoferrin) to block microbial attachment to human cells. These agents interact with
binding structures of microbes (e.g. pili) and efficiently inhibit invasion [88]. For example,
Wu et al. [92] described the use of a 12-mer peptide (RQERSSLSKPVV), which binds to
the structural protein PilS of the type IVB pili of Salmonella typhi, resulting in inhibition of
adhesion or invasion of human monocyte THP-1 cells.
Chapter 1 General Introduction
17 | P a g e
In the area of physico-chemistry, modified surfaces with anti-adhesive properties have
been developed. For example, electropolished stainless steel was shown to significantly
reduce attachment and biofilm formation by bacterial cells than the sand-blasted and
sanded stainless steel surfaces [93]. Also, adhesion and biofilm formation by
Staphylococcus epidermidis, Deinococcus geothermalis, Meiothermus silvanus and
Pseudoxanthomonas taiwanensis species were almost inhibited in hydrophilic or
hydrophobic coated stainless steel surfaces by adding diamond-like carbon or certain
fluoropolymers [94].
Materials produced by nanotechnology have gained attention in recent years. New
coatings, such as single-walled carbon nanotubes (SWNTs) have been studied to enable
permanent, non-leaching antibacterial surfaces [95]. Moreover, carbon nanotubes can
be used as nanocomposites, e.g. polymers and biomolecules that may be used for
preventing biofouling or to promote the formation of desired biofilms [96].
Microbial species coexist and interact extensively with each other in natural biofilms. So,
biological approaches have great potential in promoting cell detachment. Many bacteria
are capable of synthesizing and excreting chemicals that inhibit biofilm formation by other
species [84, 88]. For example, some studies showed the influence of biosurfactants that
are synthesized and excreted by many bacteria, which inhibit attachment of their
competitors [97, 98]. Also, the secretion of enzymes (amylases, hydrolases,
glycosidases, lipases, proteases and deoxyribonucleases) by some bacteria inhibit the
colonization of the same surface by other bacteria [99]. Microorganisms, metabolites and
enzymes can thus be added to surfaces to prevent biofilm formation.
Strategies Targeting the Biofilm
Since quorum sensing controls bacterial biofilm differentiation and maturation, inhibiting
quorum sensing will difficult or prevent biofilm establishment. Therapies involving
antibiotics, quorum sensing vaccines and inhibitors have been studied and may prove
efficient in i. decreasing the translation of quorum sensing-directed toxins or ii.
prematurely activate the quorum sensing response to alert the host immune system of
the presence of low cell density bacteria [100]. For example, some methods were
developed to control and treat infections in patients using immunoglobulin or similar
receptor molecules that have affinity and specificity for acyl-homoserine lactone
signalling molecules decreasing the extra-cellular concentrations of the quorum sensing
molecules [101].

Chapter 1 General Introduction
18 | P a g e
Phages are an alternative to antibiotics for the treatment of biofilms. They are
inexpensive and specific against a host or against a narrow host range, and will not affect
the normal microflora of the environment where they are applied [85, 88]. Many phages
produce depolymerises able to hydrolyse the extracellular polymers of the biofilms [82].
For instance, Ahiwale et al. [102] showed the ability of a T7-like lytic phage to prevent
and disperse biofilms of P. aeruginosa. Nevertheless, the use of phage therapy is limited
by some disadvantages, including the specificity to infect the bacterial targets, the
possibility of virulence genes to incorporate the genome of bacteria, and the possibility
of bacteria acquire resistance to phages [103].
Siderophore-mediated iron uptake and signalling are required by some biofilms for
structure development and maturation. Siderophore-antibiotic conjugates may be used
as ‘Trojan Horses’ to combat pathogenic bacteria as explained by de Carvalho and
Fernandes [104]. Banin et al. [105] used the combination of a siderophore with an
antibiotic that caused a massive destruction of the mature biofilm. In other study, the use
of a conjugate desferrioxamine-gallium (DFO-Ga) killed planktonic cells and blocked
biofilm formation by P. aeruginosa [106].
Several strategies are being studied around the world with the single objective of
developing new ways to control biofilms in industrial and clinical settings. However,
dealing with natural biofilms formed by multi-species is more complicated than when
biofilms are formed by single-species in model systems. The need of a good method to
combat biofilms remains. As stated previously in this work, biofilm is very problematic in
hospital infections and cause several losses in industrial processes. Nevertheless,
several victories have been achieved as our knowledge about these cell aggregates
improved, as described above. The biofilms are present in many and unpredictable
surfaces on Earth and certainly they will stay for many years. The objective is not to
completely eradicate biofilms, because they are useful in many applications (e.g.
bioremediation, waste water treatment), but instead to control biofilm in problematic
areas while using them to solve other problems.
4. Studying Biofilms in Laboratory
Chapter 1 General Introduction
19 | P a g e
The importance of biofilms in hospital infections and the biofouling problems in industry
led to the development of several methods to study biofilm adhesion and formation. In
the last decades our knowledge of biofilms has developed and today there are a number
of methods for growing and analysing biofilms in laboratory [107-110]. The use of each
method will be dependent of the goal of the study. For instance, to study the first events
of biofilm adherence to surfaces, the use of microtiter plate may be a good method. If
the objective is to study the effect of hydrodynamics on biofilm formation, it is more
appropriate to use a flow cell system mounted on a microscope. Different methods may
be used simultaneously. Normally, microscopes are used with other techniques for the
study of growing biofilms.
Some of the techniques/apparatus used for in vitro growing and monitoring biofilms are
described below.
4.1. Growing Biofilms
Multi-well Plates
Assays perfumed on microtiter plates (comprising 6, 24, 96 or more wells) permit the
study of biofilm formation. Bacteria are incubated and adhere to the bottom of the wells.
After incubation, the medium is removed so that only adherent bacteria (in the biofilm)
remain in the well. Afterwards, a dye such as crystal violet is added for visualization
or/and quantification of the biofilm [111]. This method could be used in different plates
for the study of different surfaces. For example, Bonsaglia et al. has shown recently the
production of biofilm by Listeria monocytogenes in different materials (polystyrene, glass
and stainless steel) and temperatures using such cheap technique [112].
The microtiter plate assay is also useful in molecular genetic studies in order to screen
large libraries to find mutants with the ability to form biofilms. For example, Friedman and
Kolter [113] used a similar assay that led to the identification of two loci, pel and psl, that
are involved in the production of carbohydrate-rich components of the Pseudomonas
aeruginosa biofilm matrix. The system has also been variously adapted to measure other
parameters of biofilm growth, including the time taken for re-growth following the
application of biocides, which permit the comparison of MICs for planktonic and adherent
populations against a wide range of antimicrobials [114].
Robbins Device

Chapter 1 General Introduction
20 | P a g e
The Robbins device (Figure 1.2-RD) is a simple, widely-used, successful method to
establish and analyse surface associated biofilms in tubes or pipes with a reasonably
rapid and turbulent fluid flow. It is a multiport sampling device with evenly spaced
sampling ports, the samples being mounted on removable plugs to fit flush with the inside
surface of the pipe. Multiple biofilm samples cultivated during varying periods of time can
be removed and analysed independently without disturbing the balance of the system. A
popular modification of the Robbins device is to use a rectangular flow chamber section
with a removable top containing sample plugs with experimental substrata glued onto
the end for studying adhesion and biofilm growth on catheter sections (Figure 1.2 – MRD)
[115].
Figure 1.2 – The original Robbins’ device (RD) and the modified RD (MRD).
Roto-Torque (Rotating Annular reactor)
The Roto-Torque is a CSTR reactor, essentially a chemostat, having an internal cylinder
with angled holes which rotates at controlled speeds creating very turbulent flow and
hence generating considerable and uniform shear forces in the annular fluid volume
(Figure 1.3).
The outside wall has up to 12 removable slides attached which enable analysis of biofilm
growth and properties. The effect of shear forces on biofilm growth and properties can
be examined, and used to limit biofilm thickness [115].
Figure 1.3 – Scheme of a Rotating annular reactor (from Ref[115])
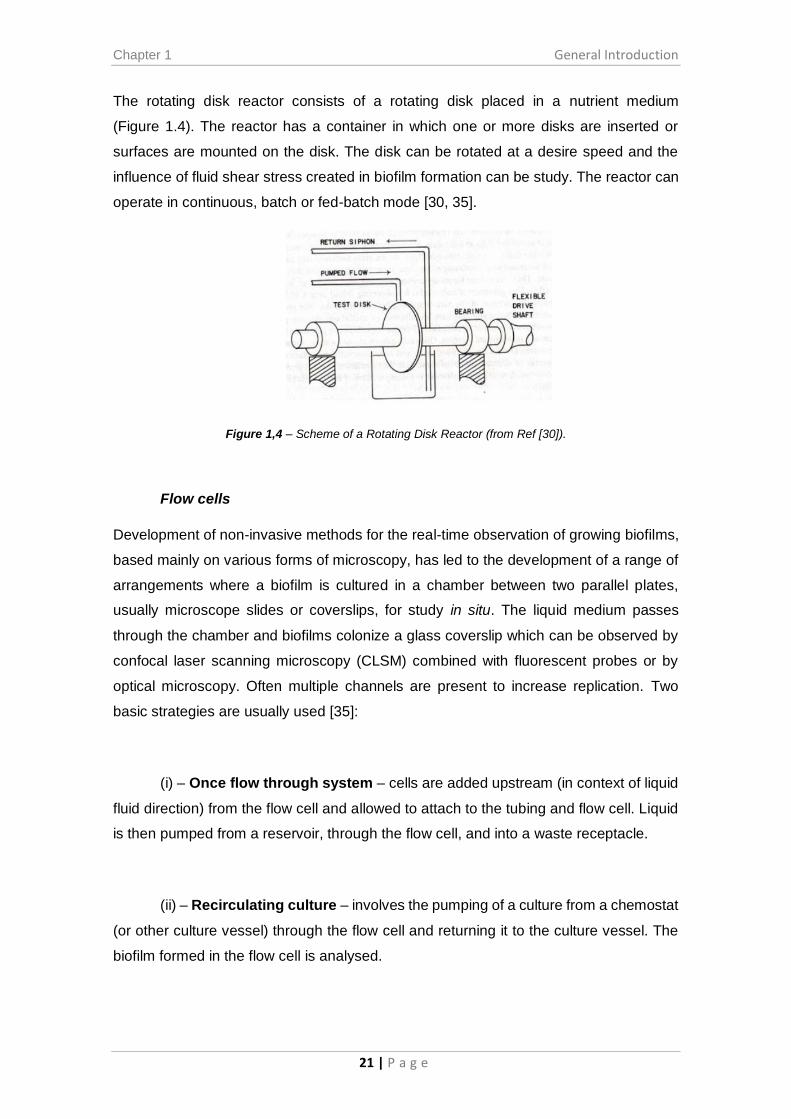
Rotating Disk Reactor
Chapter 1 General Introduction
21 | P a g e
The rotating disk reactor consists of a rotating disk placed in a nutrient medium
(Figure 1.4). The reactor has a container in which one or more disks are inserted or
surfaces are mounted on the disk. The disk can be rotated at a desire speed and the
influence of fluid shear stress created in biofilm formation can be study. The reactor can
operate in continuous, batch or fed-batch mode [30, 35].
Figure 1,4 – Scheme of a Rotating Disk Reactor (from Ref [30]).
Flow cells
Development of non-invasive methods for the real-time observation of growing biofilms,
based mainly on various forms of microscopy, has led to the development of a range of
arrangements where a biofilm is cultured in a chamber between two parallel plates,
usually microscope slides or coverslips, for study in situ. The liquid medium passes
through the chamber and biofilms colonize a glass coverslip which can be observed by
confocal laser scanning microscopy (CLSM) combined with fluorescent probes or by
optical microscopy. Often multiple channels are present to increase replication. Two
basic strategies are usually used [35]:
(i) – Once flow through system – cells are added upstream (in context of liquid
fluid direction) from the flow cell and allowed to attach to the tubing and flow cell. Liquid
is then pumped from a reservoir, through the flow cell, and into a waste receptacle.
(ii) – Recirculating culture – involves the pumping of a culture from a chemostat
(or other culture vessel) through the flow cell and returning it to the culture vessel. The
biofilm formed in the flow cell is analysed.

Chapter 1 General Introduction
22 | P a g e
Flow cells can be used in versatile systems for study of cell attachment and biofilm
formation. They can be operated in different configurations, allowing the study of different
variables, such as the influence of flow rate, nutrients or time of colonization (i.e. time to
colonize a new surface). At the same time, they allow the use of a microscope for real
time monitoring of the process (Figure 1.5).
Figure 1.5 - Flow cell under optical microscope with recirculating flow system. Developed at IBB – Institute for Biotechnology and Bioengineering, Centre for Biological and Chemical
Engineering, Instituto Superior Técnico, Lisboa, Portugal.
4.2. Monitoring Biofilms
Optical Microscopes
Optical microscopy is a fundamental tool for both bacterial enumeration and biofilm
observation. A standard laboratory microscope with ×10, ×25, ×40, and ×100 objectives
is ideal for bacterial adhesion studies. Transmitted light microscopy and fluorescence
microscopy may be used to observe bacteria directly or through a histologic section, as
biofilm can be embedded in paraffin and cut into conventional histologic sections. The
substratum surfaces have to be translucent for transmitted light microscopy but
fluorescence microscopy allows the observation of cells on non-fluorescent opaque
surfaces. Normally bacteria are stained with dyes such as Gram stain, crystal violet, or
Nile red. Microscopy has been used with bacterial flow chambers or slide cultures to
observe living attached bacterial in real time [115].

Chapter 1 General Introduction
23 | P a g e
Electron Microscopy
Scanning and transmission electron microscopy (SEM and TEM) have proved invaluable
for examining the adhesion pattern of bacteria and the structure of biofilms. They offer
the advantage of high-magnification spatial images of how the single bacterium is located
and interact within the biofilm [116]. However, because these microscopes operate in
vacuum and generally require samples to be coated with metals, samples have to be
previously fixed and dehydrated. Also, the procedure requires expensive electron
microscopes which are not present in all laboratories or departments of investigation.
Furthermore, the sample preparation procedure is more time consuming comparing to
other methods. Most of the scientists use electron microscope for analysis and
characterization of biofilms in medical devices [117]. Despite the disadvantages of
electron microscopy, and because of its excellent resolution properties, the electron
microscope will continue to be an important tool for the biofilm scientist [107].
Confocal Laser Scanning Microscopy
Confocal laser scanning microscopy (CLSM) has revolutionized the morphological
observation of adherent bacteria and biofilm (1980s) permitting the examination of wet
biofilms in situ [118]. The equipment combines laser illumination, confocal imaging, plan-
apochromatic objectives, and computer based image processing to generate high-
resolution, three-dimensional images of the specimen. The basis of confocal microscopy
is showed in Figure 1.6. Illumination from a light source is reflected by a dichroic reflector
into an objective lens and brought to a focus in the sample. This focused point is scanned
in a horizontal (XY) plane. Emitted fluorescent light is collected by the same lens, passes
back through the dichroic reflector and on to the confocal aperture. Only light from the
plane of focus passes through the aperture into the detector [119]. Thus, out of focus
light is rejected and an optical section is generated.
The use of CLSM requires that the organisms in the biofilms be stained with fluorescent
stains or express genes encoding fluorescent proteins (e.g., GFP). The stains are
designed to emit light at specific wavelengths and can be used to probe specific cellular
functions. For example, nucleic acid stains such as DAPI (4,6-diamidino2-phenylindole),
acridine orange, and Syto 9 will stain the DNA and RNA of all cells regardless of their
viability. Other stains, such as Nile red can be used to stain lipids.
Despite resolution being lower than SEM and TEM, CLSM permits the visualization of
the biofilm structure. The distribution of bacteria or the thickness of the biofilm can be

Chapter 1 General Introduction
24 | P a g e
examined in situ and under the original hydrated conditions. Also as a feature of CLSM,
samples can be sectioned optically to reveal the three-dimensional structure. Moreover,
with various types of time-lapse photomicroscopy the dynamics of a biofilm can be study
in real-time.
Other advantage is the use of programs created specifically for CLSM (e.g. COMSTAT)
that enables statistical comparisons of biofilms and reproducibility between laboratories
[35].
Figure 1.6 – The basis of confocal laser scanning microscopy. (Adapted from ref [120])
Chapter 1 General Introduction
25 | P a g e
5. References
1. Dalton HM, March PE: Molecular genetics of bacterial attachment and biofouling.
Curr Opin Biotechnol 1998, 9(3):252-255.
2. de Carvalho C, Parreno-Marchante B, Neumann G, da Fonseca MMR, Heipieper HJ:
Adaptation of Rhodococcus erythropolis DCL14 to growth on n-alkanes, alcohols
and terpenes. Applied Microbiology and Biotechnology 2005, 67(3):383-388.
3. de Carvalho C, de Fonseca MMR: Preventing biofilm formation: promoting cell
separation with terpenes. Fems Microbiology Ecology 2007, 61(3):406-413.
4. de Carvalho CCCR, Wick LY, Heipieper HJ: Cell wall adaptations of planktonic and
biofilm Rhodococcus erythropolis cells to growth on C5 to C16 n-alkane
hydrocarbons. Applied Microbiology and Biotechnology 2009, 82(2):311-320.
5. Demain AL, Sanchez S: Microbial drug discovery: 80 years of progress. The Journal
of antibiotics 2009, 62(1):5-16.
6. Fleming A: On the antibacterial action of cultures of a penicillium, with special
reference to their use in the isolation of B. influenzae. 1929. Bulletin of the World
Health Organization 2001, 79(8):780-790.
7. Chain E, Florey HW, Gardner AD, Heatley NG, Jennings MA, Orr-Ewing J, Sanders AG:
PENICILLIN AS A CHEMOTHERAPEUTIC AGENT. The Lancet 1940, 236(6104):226-
228.
8. Waksman SA, Woodruff HB: Bacteriostatic and Bactericidal Substances Produced
by a Soil Actinomyces. Experimental Biology and Medicine 1940, 45(2):609-614.
9. Waksman SA: Production and Activity of Streptothricin. J Bacteriol 1943, 46(3):299-
310.
10. Comroe JH, Jr.: Pay dirt: the story of streptomycin. Part I. From Waksman to
Waksman. The American review of respiratory disease 1978, 117(4):773-781.
11. Butler MS: The Role of Natural Product Chemistry in Drug Discovery†. Journal of
Natural Products 2004, 67(12):2141-2153.
12. Lam KS: New aspects of natural products in drug discovery. Trends in microbiology
2007, 15(6):279-289.
13. Newman DJ, Cragg GM: Natural Products As Sources of New Drugs over the 30
Years from 1981 to 2010. Journal of Natural Products 2012, 75(3):311-335.
14. Tiwari K, Gupta RK: Diversity and isolation of rare actinomycetes: an overview. Crit
Rev Microbiol 2013, 39(3):256-294.
15. Alvarez VM, Marques JM, Korenblum E, Seldin L: Comparative Bioremediation of
Crude Oil-Amended Tropical Soil Microcosms by Natural Attenuation,
Bioaugmentation, or Bioenrichment. Applied and Environmental Soil Science 2011,
2011:10.
16. Fuentes M, #xed, S. a, Brice, #xf1, o GE, Saez JM, Benimeli CS, Diez M, #xed et al:
Enhanced Removal of a Pesticides Mixture by Single Cultures and Consortia of
Free and Immobilized Streptomyces Strains. BioMed Research International 2013,
2013:9.
17. de Carvalho CCCR: Adaptation of Rhodococcus erythropolis cells for growth and
bioremediation under extreme conditions. Research in Microbiology 2012,
163(2):125-136.
18. de Carvalho CCR, Marques MC, Hachicho N, Heipieper H: Rapid adaptation of
Rhodococcus erythropolis cells to salt stress by synthesizing polyunsaturated
fatty acids. Applied Microbiology and Biotechnology 2014, 98(12):5599-5606.
19. Costerton JW, Cheng KJ, Geesey GG, Ladd TI, Nickel JC, Dasgupta M, Marrie TJ:
Bacterial Biofilms in Nature and Disease. Annual Review of Microbiology 1987,
41(1):435-464.

Chapter 1 General Introduction
26 | P a g e
20. Morikawa M: Beneficial biofilm formation by industrial bacteria Bacillus subtilis and
related species. Journal of bioscience and bioengineering 2006, 101(1):1-8.
21. Ojha AK, Baughn AD, Sambandan D, Hsu T, Trivelli X, Guerardel Y, Alahari A, Kremer
L, Jacobs WR, Hatfull GF: Growth of Mycobacterium tuberculosis biofilms
containing free mycolic acids and harbouring drug-tolerant bacteria. Molecular
Microbiology 2008, 69(1):164-174.
22. Donlan RM: Biofilms: microbial life on surfaces. Emerging infectious diseases 2002,
8(9):881-890.
23. Heukelekian H, Heller A: Relation between Food Concentration and Surface for
Bacterial Growth. J Bacteriol 1940, 40(4):547-558.
24. Zobell CE: The Effect of Solid Surfaces upon Bacterial Activity. J Bacteriol 1943,
46(1):39-56.
25. Jones HC, Roth IL, Sanders WM: Electron Microscopic Study of a Slime Layer.
Journal of Bacteriology 1969, 99(1):316-325.
26. Characklis WG: Attached microbial growths—II. Frictional resistance due to
microbial slimes. Water Research 1973, 7(9):1249-1258.
27. Costerton JW, Geesey GG, Cheng KJ: How bacteria stick. Scientific American 1978,
238(1):86-95.
28. Costerton JW, Colwell RR: Native Aquatic Bacteria: Enumeration, Activity and
Ecology/Stp 695: The Society; 1979.
29. Costerton JW, Irvin RT, Cheng KJ: The Bacterial Glycocalyx in Nature and Disease.
Annual Review of Microbiology 1981, 35(1):299-324.
30. Characklis WG, Marshall KC: Biofilms: Wiley; 1990.
31. Costerton JW, Lewandowski Z, Caldwell DE, Korber DR, Lappin-Scott HM: Microbial
biofilms. Annu Rev Microbiol 1995, 49:711-745.
32. Stoodley P, Boyle JD, Dodds I, Lappin-Scott HM: Consensus model of biofilm
structure. In: Biofilms: Community Interactions and Control: 3rd meeting of the Biofilm
Club. Edited by Wimpenny JWT, Handley PS, Gilbert P, Lappin-Scott HM, Jones M; 1997:
1-9.
33. Stoodley P, Sauer K, Davies DG, Costerton JW: Biofilms as complex differentiated
communities. Annu Rev Microbiol 2002, 56:187-209.
34. Percival S, Malic S, Cruz H, Williams D: Introduction to Biofilms. In: Biofilms and
Veterinary Medicine. Edited by Percival S, Knottenbelt D, Cochrane C, vol. 6: Springer
Berlin Heidelberg; 2011: 41-68.
35. Ghannoum MA, O'Toole GA: Microbial biofilms: ASM Press; 2004.
36. Montana State University, Center for Biofilm Engineering. What are Biofilms?
Acessed in 2014 on http://www.biofilm.montana.edu/
37. Busscher HJ, Weerkamp AH: Specific and non-specific interactions in bacterial
adhesion to solid substrata. FEMS Microbiology Letters 1987, 46(2):165-173.
38. Potera C: Studying slime. Environmental health perspectives 1998, 106(12):A604-606.
39. Svensater G, Larsson UB, Greif EC, Cvitkovitch DG, Hamilton IR: Acid tolerance
response and survival by oral bacteria. Oral microbiology and immunology 1997,
12(5):266-273.
40. Espeland EM, Wetzel RG: Complexation, Stabilization, and UV Photolysis of
Extracellular and Surface-Bound Glucosidase and Alkaline Phosphatase:
Implications for Biofilm Microbiota. Microb Ecol 2001, 42(4):572-585.
41. Le Magrex-Debar E, Lemoine J, Gelle MP, Jacquelin LF, Choisy C: Evaluation of
biohazards in dehydrated biofilms on foodstuff packaging. International journal of
food microbiology 2000, 55(1-3):239-243.
42. Mah TF, O'Toole GA: Mechanisms of biofilm resistance to antimicrobial agents.
Trends in microbiology 2001, 9(1):34-39.
43. Stewart PS, Costerton JW: Antibiotic resistance of bacteria in biofilms. Lancet 2001,
358(9276):135-138.
Chapter 1 General Introduction
27 | P a g e
44. Flemming HC, Wingender J: The biofilm matrix. Nature Reviews Microbiology 2010,
8(9):623-633.
45. Lens P: Biofilms in Medicine, Industry and Environmental Biotechnology:
Characteristics, Analysis and Control: IWA Publishing; 2003.
46. Potts M: Desiccation tolerance of prokaryotes. Microbiol Rev 1994, 58(4):755-805.
47. Flemming H-C, Leis A: Sorption Properties of Biofilms. In: Encyclopedia of
Environmental Microbiology. John Wiley & Sons, Inc.; 2003.
48. Wingender J, Strathmann M, Rode A, Leis A, Flemming HC: Isolation and biochemical
characterization of extracellular polymeric substances from Pseudomonas
aeruginosa. Methods in enzymology 2001, 336:302-314.
49. Gotz F: Staphylococcus and biofilms. Mol Microbiol 2002, 43(6):1367-1378.
50. Ryder C, Byrd M, Wozniak DJ: Role of polysaccharides in Pseudomonas aeruginosa
biofilm development. Current Opinion in Microbiology 2007, 10(6):644-648.
51. Wingender J, Neu TR, Flemming HC: Microbial Extracellular Polymeric Substances:
Characterization, Structure, and Function: Springer; 1999.
52. Lynch DJ, Fountain TL, Mazurkiewicz JE, Banas JA: Glucan-binding proteins are
essential for shaping Streptococcus mutans biofilm architecture. FEMS Microbiol
Lett 2007, 268(2):158-165.
53. Higgins M, Novak J: Characterization of Exocellular Protein and Its Role in
Bioflocculation. Journal of Environmental Engineering 1997, 123(5):479-485.
54. Mora P, Rosconi F, Franco Fraguas L, Castro-Sowinski S: Azospirillum brasilense Sp7
produces an outer-membrane lectin that specifically binds to surface-exposed
extracellular polysaccharide produced by the bacterium. Archives of microbiology
2008, 189(5):519-524.
55. Lasa I, Penades JR: Bap: a family of surface proteins involved in biofilm formation.
Res Microbiol 2006, 157(2):99-107.
56. Watanabe M, Sasaki K, Nakashimada Y, Kakizono T, Noparatnaraporn N, Nishio N:
Growth and flocculation of a marine photosynthetic bacterium Rhodovulum sp.
Applied Microbiology and Biotechnology 1998, 50(6):682-691.
57. Yang L, Barken KB, Skindersoe ME, Christensen AB, Givskov M, Tolker-Nielsen T:
Effects of iron on DNA release and biofilm development by Pseudomonas
aeruginosa. Microbiology 2007, 153(Pt 5):1318-1328.
58. Mulcahy H, Charron-Mazenod L, Lewenza S: Extracellular DNA chelates cations and
induces antibiotic resistance in Pseudomonas aeruginosa biofilms. PLoS
pathogens 2008, 4(11):e1000213.
59. Bockelmann U, Janke A, Kuhn R, Neu TR, Wecke J, Lawrence JR, Szewzyk U: Bacterial
extracellular DNA forming a defined network-like structure. FEMS Microbiol Lett
2006, 262(1):31-38.
60. Steinberger RE, Holden PA: Extracellular DNA in single- and multiple-species
unsaturated biofilms. Applied and Environmental Microbiology 2005, 71(9):5404-5410.
61. Neu TR, Poralla K: An amphiphilic polysaccharide from an adhesive Rhodococcus
strain. FEMS Microbiology Letters 1988, 49(3):389-392.
62. Conrad A, Suutari MK, Keinanen MM, Cadoret A, Faure P, Mansuy-Huault L, Block JC:
Fatty acids of lipid fractions in extracellular polymeric substances of activated
sludge flocs. Lipids 2003, 38(10):1093-1105.
63. Sand W, Gehrke T: Extracellular polymeric substances mediate
bioleaching/biocorrosion via interfacial processes involving iron(III) ions and
acidophilic bacteria. Res Microbiol 2006, 157(1):49-56.
64. Matsuyama T, Nakagawa Y: Surface-active exolipids: analysis of absolute chemical
structures and biological functions. Journal of Microbiological Methods 1996,
25(2):165-175.
65. Ron EZ, Rosenberg E: Natural roles of biosurfactants. Environ Microbiol 2001,
3(4):229-236.
Chapter 1 General Introduction
28 | P a g e
66. Fletcher M, Loeb GI: Influence of substratum characteristics on the attachment of a
marine pseudomonad to solid surfaces. Appl Environ Microbiol 1979, 37(1):67-72.
67. Pringle JH, Fletcher M: Influence of substratum wettability on attachment of
freshwater bacteria to solid surfaces. Appl Environ Microbiol 1983, 45(3):811-817.
68. Bendinger B, Rijnaarts HH, Altendorf K, Zehnder AJ: Physicochemical cell surface and
adhesive properties of coryneform bacteria related to the presence and chain
length of mycolic acids. Appl Environ Microbiol 1993, 59(11):3973-3977.
69. Rosenberg M, Kjelleberg S: Hydrophobic Interactions: Role in Bacterial Adhesion.
In: Advances in Microbial Ecology. Edited by Marshall KC, vol. 9: Springer US; 1986: 353-
393.
70. Chamberlain AHL: The Role of Adsorbed Layers in Bacterial Adhesion. In: Biofilms
— Science and Technology. Edited by Melo LF, Bott TR, Fletcher M, Capdeville B, vol.
223: Springer Netherlands; 1992: 59-67.
71. MARSHALL KC, STOUT R, MITCHELL R: Mechanism of the Initial Events in the
Sorption of Marine Bacteria to Surfaces. Journal of General Microbiology 1971,
68(3):337-348.
72. Marsh PD, Bradshaw DJ: Dental plaque as a biofilm. Journal of Industrial Microbiology
1995, 15(3):169-175.
73. Mittelman MW: Adhesion to biomaterials. In: Bacterial adhesion: molecular and
ecological diversity. Edited by M F: New York: Wiley-Liss,Inc.; 1996: 89-127.
74. Donlan RM, Pipes WO, Yohe TL: Biofilm formation on cast iron substrata in water
distribution systems. Water Research 1994, 28(6):1497-1503.
75. Fera P, Siebel MA, Characklis WG, Prieur D: Seasonal variations in bacterial
colonisation of stainless steel, aluminium and polycarbonate surfaces in a sea
water flow system. Biofouling 1989, 1(3):251-261.
76. Fletcher M: Attachment of Pseudomonas fluorescens to glass and influence of
electrolytes on bacterium-substratum separation distance. J Bacteriol 1988,
170(5):2027-2030.
77. Cowan MM, Warren TM, Fletcher M: Mixed‐species colonization of solid surfaces in
laboratory biofilms. Biofouling 1991, 3(1):23-34.
78. Corpe WA: Microbial surface components involved in adsorption of
microorganisms onto surfaces. In: Adsorption of microorganisms to surfaces. Edited
by Bitton G, Marshall KC: Wiley; 1980: 105-144.
79. Korber D, Lawrence J, Sutton B, Caldwell D: Effect of laminar flow velocity on the
kinetics of surface recolonization by Mot+ and Mot− Pseudomonas fluorescens.
Microb Ecol 1989, 18(1):1-19.
80. Hall-Stoodley L, Costerton JW, Stoodley P: Bacterial biofilms: from the Natural
environment to infectious diseases. Nat Rev Micro 2004, 2(2):95-108.
81. de Carvalho CCCR: Biofilms: recent developments on an old battle. Recent patents
on biotechnology 2007, 1(1):49-57.
82. de Carvalho CCCR: Biofilms: new ideas for an old problem. Recent patents on
biotechnology 2012, 6(1):13-22.
83. Klevens R, Morrison MA, Nadle J, et al.: INvasive methicillin-resistant
Staphylococcus aureus infections in the united states. JAMA 2007, 298(15):1763-
1771.
84. Blackledge MS, Worthington RJ, Melander C: Biologically inspired strategies for
combating bacterial biofilms. Curr Opin Pharmacol 2013, 13(5):699-706.
85. Bryers JD: Medical biofilms. Biotechnol Bioeng 2008, 100(1):1-18.
86. ECDC. Annual epidemiological report on communicable diseases in Europe. European
Centre for Disease Prevention and Control. Revised edition. Stockholm p, 2009.
87. Smith AW: Biofilms and antibiotic therapy: Is there a role for combating bacterial
resistance by the use of novel drug delivery systems? Adv Drug Deliv Rev 2005,
57(10):1539-1550.

Chapter 1 General Introduction
29 | P a g e
88. Yang L, Liu Y, Wu H, Song ZJ, Hoiby N, Molin S, Givskov M: Combating biofilms. FEMS
Immunol Med Microbiol 2012, 65(2):146-157.
89. O'Shaughnessey WS, Zhang Z, Hencke M, Wood K, Squier T, Loose CR: Non-leaching
non-fouling antimicrobial coatings. In.: Google Patents; 2009.
90. Gobin AS: Silk fibroin coating. In.: Google Patents; 2009.
91. Kazemzadeh-Narbat M, Kindrachuk J, Duan K, Jenssen H, Hancock RE, Wang R:
Antimicrobial peptides on calcium phosphate-coated titanium for the prevention of
implant-associated infections. Biomaterials 2010, 31(36):9519-9526.
92. Wu HY, Zhang XL, Pan Q, Wu J: Functional selection of a type IV pili-binding peptide
that specifically inhibits Salmonella typhi adhesion to/invasion of human
monocytic cells. Peptides 2005, 26(11):2057-2063.
93. Arnold JW, Bailey GW: Surface finishes on stainless steel reduce bacterial
attachment and early biofilm formation: scanning electron and atomic force
microscopy study. Poultry science 2000, 79(12):1839-1845.
94. Raulio M, Jarn M, Ahola J, Peltonen J, Rosenholm JB, Tervakangas S, Kolehmainen J,
Ruokolainen T, Narko P, Salkinoja-Salonen M: Microbe repelling coated stainless
steel analysed by field emission scanning electron microscopy and
physicochemical methods. Journal of industrial microbiology & biotechnology 2008,
35(7):751-760.
95. Vecitis CD, Zodrow KR, Kang S, Elimelech M: Electronic-Structure-Dependent
Bacterial Cytotoxicity of Single-Walled Carbon Nanotubes. ACS Nano 2010,
4(9):5471-5479.
96. Upadhyayula VK, Gadhamshetty V: Appreciating the role of carbon nanotube
composites in preventing biofouling and promoting biofilms on material surfaces
in environmental engineering: a review. Biotechnology advances 2010, 28(6):802-
816.
97. Zeraik AE, Nitschke M: Biosurfactants as agents to reduce adhesion of pathogenic
bacteria to polystyrene surfaces: effect of temperature and hydrophobicity. Current
microbiology 2010, 61(6):554-559.
98. Luna JM, Rufino RD, Sarubbo LA, Rodrigues LR, Teixeira JA, de Campos-Takaki GM:
Evaluation antimicrobial and antiadhesive properties of the biosurfactant Lunasan
produced by Candida sphaerica UCP 0995. Current microbiology 2011, 62(5):1527-
1534.
99. Kaplan JB: Therapeutic potential of biofilm-dispersing enzymes. The International
journal of artificial organs 2009, 32(9):545-554.
100. Martin CA, Hoven AD, Cook AM: Therapeutic frontiers: preventing and treating
infectious diseases by inhibiting bacterial quorum sensing. European journal of
clinical microbiology & infectious diseases : official publication of the European Society
of Clinical Microbiology 2008, 27(8):635-642.
101. Charlton K, Porter A, Thornthwaite L: Methods for reducing biofilm formation in
infectious bacteria. In.: Google Patents; 2005.
102. Ahiwale S, Tamboli N, Thorat K, Kulkarni R, Ackermann H, Kapadnis B: In vitro
management of hospital Pseudomonas aeruginosa biofilm using indigenous T7-
like lytic phage. Current microbiology 2011, 62(2):335-340.
103. Donlan RM: Preventing biofilms of clinically relevant organisms using
bacteriophage. Trends in microbiology 2009, 17(2):66-72.
104. Fernandes P, de Carvalho CCCR: Siderophores as “Trojan Horses”: tackling
multidrug resistance? Frontiers in microbiology 2014, 5.
105. Banin E, Lozinski A, Brady KM, Berenshtein E, Butterfield PW, Moshe M, Chevion M,
Greenberg EP, Banin E: The potential of desferrioxamine-gallium as an anti-
Pseudomonas therapeutic agent. Proceedings of the National Academy of Sciences
2008, 105(43):16761-16766.

Chapter 1 General Introduction
30 | P a g e
106. Budzikiewicz H: Siderophore-antibiotic conjugates used as trojan horses against
Pseudomonas aeruginosa. Current topics in medicinal chemistry 2001, 1(1):73-82.
107. Donlan RM, Costerton JW: Biofilms: survival mechanisms of clinically relevant
microorganisms. Clinical microbiology reviews 2002, 15(2):167-193.
108. Merritt JH, Kadouri DE, O'Toole GA: Growing and Analyzing Static Biofilms. In:
Current Protocols in Microbiology. John Wiley & Sons, Inc.; 2005.
109. Coenye T, Nelis HJ: In vitro and in vivo model systems to study microbial biofilm
formation. Journal of Microbiological Methods 2010, 83(2):89-105.
110. McBain AJ: Chapter 4: In vitro biofilm models: an overview. Advances in applied
microbiology 2009, 69:99-132.
111. Coffey BM, Anderson GG: Biofilm formation in the 96-well microtiter plate. Methods
in molecular biology (Clifton, NJ) 2014, 1149:631-641.
112. Bonsaglia ECR, Silva NCC, Fernades Júnior A, Araújo Júnior JP, Tsunemi MH, Rall VLM:
Production of biofilm by Listeria monocytogenes in different materials and
temperatures. Food Control 2014, 35(1):386-391.
113. Friedman L, Kolter R: Two genetic loci produce distinct carbohydrate-rich structural
components of the Pseudomonas aeruginosa biofilm matrix. J Bacteriol 2004,
186(14):4457-4465.
114. Das JR, Bhakoo M, Jones MV, Gilbert P: Changes in the biocide susceptibility of
Staphylococcus epidermidis and Escherichia coli cells associated with rapid
attachment to plastic surfaces. J Appl Microbiol 1998, 84(5):852-858.
115. Smith A: Handbook of Bacterial Adhesion: Principles, Methods and Applications:
Y. H. An and R. J. Friedman, Eds.Humana Press, Torowa, NJ, USA. 2000.ISBN 0-8
9603-794-0, US$135.00. Journal of Antimicrobial Chemotherapy 2001, 47(3):369-370.
116. Alhede M, Qvortrup K, Liebrechts R, Hoiby N, Givskov M, Bjarnsholt T: Combination of
microscopic techniques reveals a comprehensive visual impression of biofilm
structure and composition. FEMS Immunol Med Microbiol 2012, 65(2):335-342.
117. El-Baky RMA: Application of Scanning Electron Microscopy for the Morphological
Study of Biofilm in Medical Devices; 2012.
118. Handbook Of Biological Confocal Microscopy: Springer US; 2006.
119. Smith CL: Basic Confocal Microscopy. In: Current Protocols in Microbiology. John
Wiley & Sons, Inc.; 2005.
120. Signoretti FG, Endo MS, Gomes BP, Montagner F, Tosello FB, Jacinto RC: Persistent
extraradicular infection in root-filled asymptomatic human tooth: scanning
electron microscopic analysis and microbial investigation after apical
microsurgery. Journal of endodontics 2011, 37(12):1696-1700.
Chapter 2 Materials and
Methods
1. General methods ........................................................................................................33
1.1. Growth of cells ...................................................................................................33
1.1. Extraction, methylation and analysis of bacterial fatty acids ..............................33
1.2. Zeta Potential .....................................................................................................34
1.3. Enzymatic Assay..................................................................................................34
1.4. Principal Components Analysis (PCA) .................................................................34
1.5. Partial Least Squares (PLS) coefficients determination.......................................35
2. Adhesion Experiments ................................................................................................35
2.1. Growth of Biofilms on 6-well plates ...................................................................35
2.1.1. Growth of biofilms ......................................................................................35
2.1.2. Fatty acid analysis.......................................................................................35
2.1.3. Visualization of lipids using Nile Red ...........................................................36
2.1.4. Image processing ........................................................................................36
2.2. Recirculation Tube System .................................................................................36
2.2.1. Contact angle measurement .......................................................................37
2.3. Biofilm Reactor ...................................................................................................38
2.4. Flow cell system..................................................................................................39
2.4.1. Fabrication and Design ...............................................................................39
2.4.2. System operation ........................................................................................40
2.4.3. Biofilm analysis ...........................................................................................40
2.4.4. Surface charge density ................................................................................41
3. References ..................................................................................................................41


Chapter 2 Materials and Methods
33 | P a g e
1. General methods
1.1. Growth of cells
Rhodococus erythropolis DCL14 cells were grown in 100 mL Erlenmeyer flasks closed
with rubber bungs, containing 20 mL of mineral medium and 0.25% (v/v) of absolute
ethanol (Panreac) or hexadecane (Sigma-Aldrich, 99%) as carbon source. The mineral
medium contained the following compounds per litre of demineralised water: 0.01 g
EDTA, 0.002 g ZnSO4 · 7H2O, 0.001 g CaCl2 ·2H2O, 0.005 g FeSO4 · 7H2O, 0.0002 g
Na2MoO4 · 2H2O, 0.0002 g CuSO4 · 5H2O, 0.0004 g CoCl2 · 6H2O, 0.001 g MnCl2 · 4H2O,
0.1 g MgCl2 · 6H2O, 2 g (NH4)2SO4, and 1.55 g K2HPO4 and 0.85 g NaH2PO4 · H2O for
buffering (to obtain 50 mM, pH 7.0, in the final medium). All chemicals were from Sigma-
Aldrich. The cultures were incubated at 28°C and 200 rpm overnight in a refrigerator
Agitorb incubator (Aralab, Portugal).
1.1. Extraction, methylation and analysis of bacterial fatty acids
The cell culture samples were centrifuged at 10,000 rpm for 5 min. The supernatant was
discharged and the pellet was resuspended in 1 mL of distilled water, to wash the cells,
and centrifuged again under same conditions. The supernatant was removed and the
pellet was stored at -20°C when not used immediately. The fatty acids from the cell
pellets were extracted and simultaneously methylated using the Instant FAME kit from
MIDI, Inc. A 6890N gas chromatograph (GC) from Agilent Technologies (Palo Alto, CA,
USA), with a FID detector and a 7683 B series injector, equipped with a 25 m long Agilent
J&W Ultra 2 capillary column from Agilent was used to analyse the fatty acid methyl
esters (FAMEs). The MIDI Sherlock software package (version 6.2) was used to program
and control the GC. The same software identified the FAMEs using MIDI calibration
standards. The identity of the peaks was confirmed by using a qualitative standard of
bacterial fatty acid methyl esters and one of polyunsaturated fatty acids, both from
Supelco, and a methyl cis-11-octadecenoate standard solution from Sigma-Aldrich. To
better understand the differences observed in the lipid composition of the cells, the fatty
acids (FA) were grouped into the different classes according to their chemical structure:
saturated straight chain (SSFAs), mono-unsaturated (MUFAs), poly-unsaturated
(PUFAs), saturated iso- and anteiso-methyl branched (BCFAs) and 10-methyl branched
(10MBFAs), saturated cyclopropyl-branched (SCBFAs), dimethylacetals (DMAFAs) and
hydroxy substituted (HSFAs) fatty acids. The degree of saturation of the fatty acids of
Chapter 2 Materials and Methods
34 | P a g e
the cell membrane was defined as the ratio between the total straight chain and mono-
unsaturated fatty acids.
1.2. Zeta Potential
Concomitantly to sampling for FAMEs (section 1.2), 40 µL of cells were collected after
washing with distilled water and suspended in 2 mL of KNO3 (10 mM). The
electrophoretic mobility of the R. erythropolis cell suspensions was determined in a
Doppler electrophoretic light scattering analyser (Zetasizer Nano ZS, Malvern
Instruments Ltd.) using a clear disposable zeta cell. The zeta potential was calculated
using the electrophoretic mobility as an indirect measure of cell surface charge,
according to the method of Helmholtz and Smoluchowski [1]. Calculations were
automatically made using the Zetasizer software version 7.03, from Malvern Instruments
Ltd.
1.3. Enzymatic Assay
The enzymatic activities of cell samples recovered at the end of operation of the biofilm
reactor were assessed using the API ZYM® kit from BioMérieux (France), according to
the kit’s instructions.
1.4. Principal Components Analysis (PCA)
The fatty acid composition of the phospholipids of the cells that adhered to metallic (Al,
Fe, Zn, Cu and Pb) and non-metallic (PS, PE, PET, Butyl rubber, PTFE, Glass, Glass
mosaic, Gas tubing, Marprene, Silicone, Soft silicone, Teflon) surfaces was used to build
a data matrix. The lipids were added as percentage of saturated straight, unsaturated,
10-methyl branched, branched and polyunsaturated fatty acids. The data was
normalised to mean 0 and variance 1, as suggested by Everitt and Dunn [2] and the
principal components were calculated by single value decomposition (SVD) using the
statistical software MINITAB® Release 14.1 (Minitab Inc., USA).

Chapter 2 Materials and Methods
35 | P a g e
1.5. Partial Least Squares (PLS) coefficients determination
The percentages of each FA type (SSFAs, MUFAs, PUFAs, BCFAs, 10MBFAs,
SCBFAs, DMAFAs and HSFAs) in the phospholipids of cells that had adhered to metallic
and non-metallic surfaces were used to build a matrix containing the predictors, whilst
the biofilm formed (normalized to vary between 0 and 1) was used as the response
vector. Data points were standardized to mean 0 and variance 1 [2]. The PLS
coefficients regarding the analysis of the relation between the FA composition of the cell
phospholipids and the biofilm formed were determined using the statistical software
MINITAB® Release 14.1 (Minitab Inc., USA).
2. Adhesion Experiments
2.1. Growth of Biofilms on 6-well plates
2.1.1. Growth of biofilms
Biofilms were grown in 6-well plates containing 3 mL of Mueller-Hinton (Fluka) or mineral
medium. In the latter case, 0.5% (v/v) of absolute ethanol (Panreac) was added as
carbon source. Different surfaces were added to the bottom of the wells to study the
adhesion of cells to them. The surfaces to be tested were the following: i. the metals
aluminium (Al), iron (Fe), zinc (Zn), copper (Cu) and lead (Pb), and ii. the non-metals
butyl rubber, polytetrafluoroethylene (PTFE), polyethylene (PE), polyethylene
terephthalate (PET), glass and glass mosaic. For each medium, a well containing cell
suspension but no additional material was used as reference (blank). The plates were
inoculated with 1ml of a previously grown cell suspension of R. erythropolis, and were
incubated at 28°C and 40 rpm for 48 hours.
2.1.2. Fatty acid analysis
After 48 h, 1 mL of cell suspension from the middle of the well (referred to as planktonic
cells further on in the text) was collected and placed in a 1.5 mL eppendorf tube
(Eppendorf, Germany). Simultaneously, 1 mL of cells adherent to the surfaces (referred
as biofilm) were collected by scrapping with a micropipette and added to microtubes (1.5
mL from Eppendorf). FAMEs were produced from the samples as described in section
1.2.
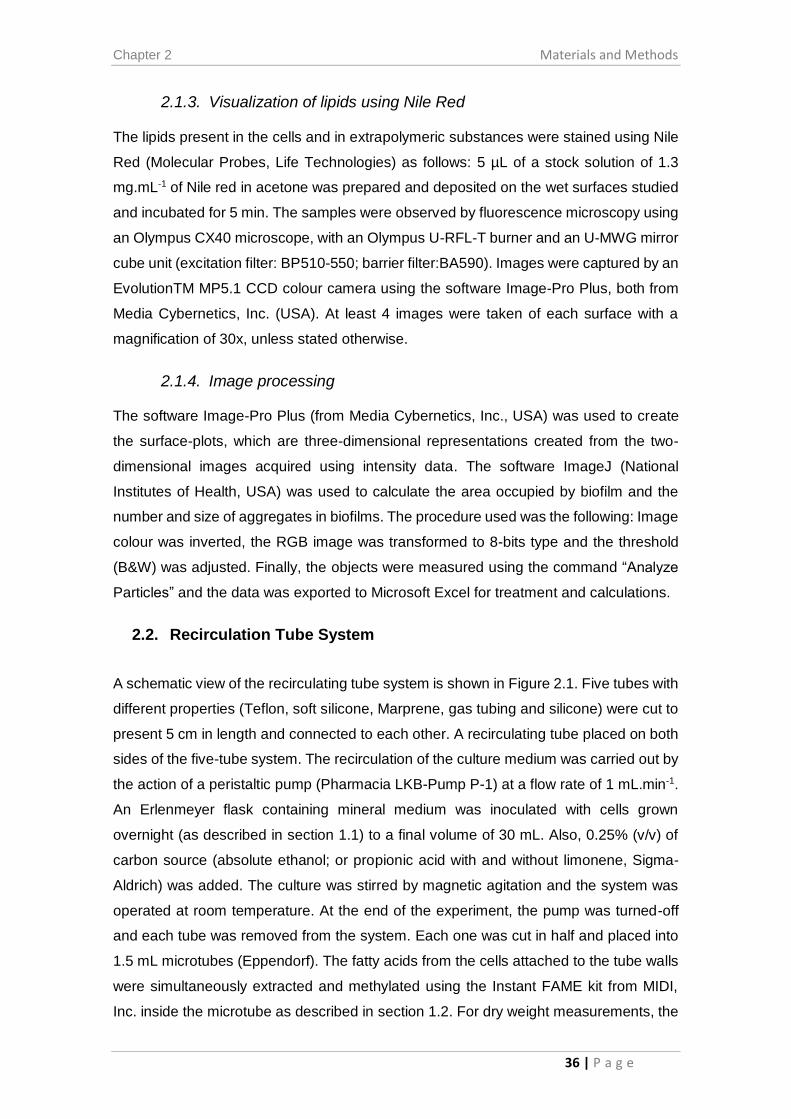
Chapter 2 Materials and Methods
36 | P a g e
2.1.3. Visualization of lipids using Nile Red
The lipids present in the cells and in extrapolymeric substances were stained using Nile
Red (Molecular Probes, Life Technologies) as follows: 5 µL of a stock solution of 1.3
mg.mL-1 of Nile red in acetone was prepared and deposited on the wet surfaces studied
and incubated for 5 min. The samples were observed by fluorescence microscopy using
an Olympus CX40 microscope, with an Olympus U-RFL-T burner and an U-MWG mirror
cube unit (excitation filter: BP510-550; barrier filter:BA590). Images were captured by an
EvolutionTM MP5.1 CCD colour camera using the software Image-Pro Plus, both from
Media Cybernetics, Inc. (USA). At least 4 images were taken of each surface with a
magnification of 30x, unless stated otherwise.
2.1.4. Image processing
The software Image-Pro Plus (from Media Cybernetics, Inc., USA) was used to create
the surface-plots, which are three-dimensional representations created from the two-
dimensional images acquired using intensity data. The software ImageJ (National
Institutes of Health, USA) was used to calculate the area occupied by biofilm and the
number and size of aggregates in biofilms. The procedure used was the following: Image
colour was inverted, the RGB image was transformed to 8-bits type and the threshold
(B&W) was adjusted. Finally, the objects were measured using the command “Analyze
Particles” and the data was exported to Microsoft Excel for treatment and calculations.
2.2. Recirculation Tube System
A schematic view of the recirculating tube system is shown in Figure 2.1. Five tubes with
different properties (Teflon, soft silicone, Marprene, gas tubing and silicone) were cut to
present 5 cm in length and connected to each other. A recirculating tube placed on both
sides of the five-tube system. The recirculation of the culture medium was carried out by
the action of a peristaltic pump (Pharmacia LKB-Pump P-1) at a flow rate of 1 mL.min-1.
An Erlenmeyer flask containing mineral medium was inoculated with cells grown
overnight (as described in section 1.1) to a final volume of 30 mL. Also, 0.25% (v/v) of
carbon source (absolute ethanol; or propionic acid with and without limonene, Sigma-
Aldrich) was added. The culture was stirred by magnetic agitation and the system was
operated at room temperature. At the end of the experiment, the pump was turned-off
and each tube was removed from the system. Each one was cut in half and placed into
1.5 mL microtubes (Eppendorf). The fatty acids from the cells attached to the tube walls
were simultaneously extracted and methylated using the Instant FAME kit from MIDI,
Inc. inside the microtube as described in section 1.2. For dry weight measurements, the
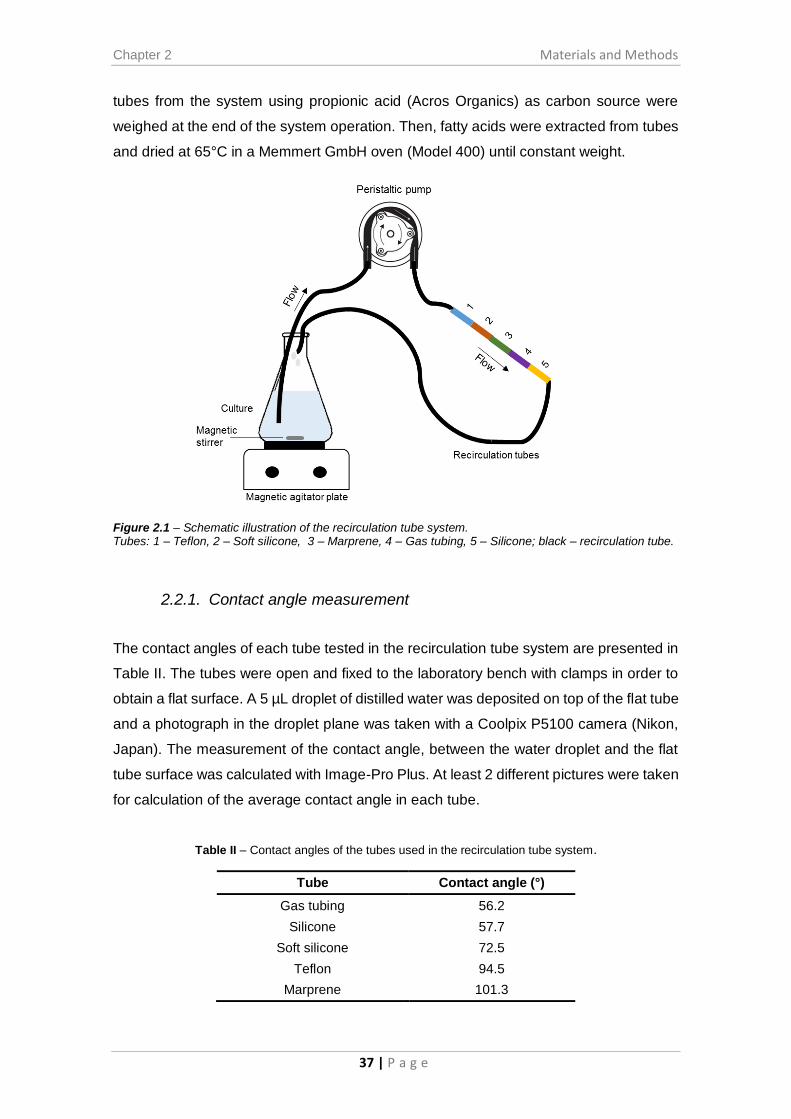
Chapter 2 Materials and Methods
37 | P a g e
tubes from the system using propionic acid (Acros Organics) as carbon source were
weighed at the end of the system operation. Then, fatty acids were extracted from tubes
and dried at 65°C in a Memmert GmbH oven (Model 400) until constant weight.
Figure 2.1 – Schematic illustration of the recirculation tube system. Tubes: 1 – Teflon, 2 – Soft silicone, 3 – Marprene, 4 – Gas tubing, 5 – Silicone; black – recirculation tube.
2.2.1. Contact angle measurement
The contact angles of each tube tested in the recirculation tube system are presented in
Table II. The tubes were open and fixed to the laboratory bench with clamps in order to
obtain a flat surface. A 5 µL droplet of distilled water was deposited on top of the flat tube
and a photograph in the droplet plane was taken with a Coolpix P5100 camera (Nikon,
Japan). The measurement of the contact angle, between the water droplet and the flat
tube surface was calculated with Image-Pro Plus. At least 2 different pictures were taken
for calculation of the average contact angle in each tube.
Table II – Contact angles of the tubes used in the recirculation tube system.
Tube Contact angle (°)
Gas tubing 56.2
Silicone 57.7
Soft silicone 72.5
Teflon 94.5
Marprene 101.3

Chapter 2 Materials and Methods
38 | P a g e
2.3. Biofilm Reactor
Four microscope slides were cleaned with ethanol 70%, attached at the top by a wire
and dipped in a beaker with 400 mL of mineral medium and 40 mL of inoculum (grown
as described in section 1.1). The carbon source used was 0.25 % (v/v) of n-hexadecane
(Sigma-Aldrich®, 99%) or absolute ethanol (Panreac). The reactors were closed in the
top with aluminium paper and stirred by magnetic agitation (see Figure 2.2). The glass
slides were removed from the reactor along time and placed inside a 50 mL centrifuge
tube. 3 mL of H2O MiliQ was poured over the slide and the tube was vortexed (Heidolph
Reax 2000) to remove the cells attached to the slide. Once the glass was cell free, the
liquid containing the cells was transferred to 1.5 mL microtubes (Eppendorf). Also, 1 mL
of culture sample were collected from the reactor to 1.5 mL microtubes (Eppendorf). In
both cases fatty acids analysis were proceeded as described in section 1.2. Also, at the
end of reactor operation, samples of the material that had formed on the top of the culture
(see Figure 2.2) were collected and its FAMES analysed (as described in section 1.2).
Moreover, due to the high biomass observed at the end of operation, samples from
culture, glass surface and supernatant were collected and used for lipid extraction and
fractioning as described by de Carvalho and Caramujo [3]. Briefly, the total lipids were
extracted to chloroform, added to a 500 mg silica gel column, and fractioned by serial
elution with chloroform (apolar lipdis), acetone (neutral lipids) and methanol
(phospholipids). Other samples were used for semiquantification of enzymatic activity as
described in section 1.5.
Figure 2.2 – Biofilm reactors in operation. Left – hexadecane used as carbon source, Right – ethanol used as carbon source.
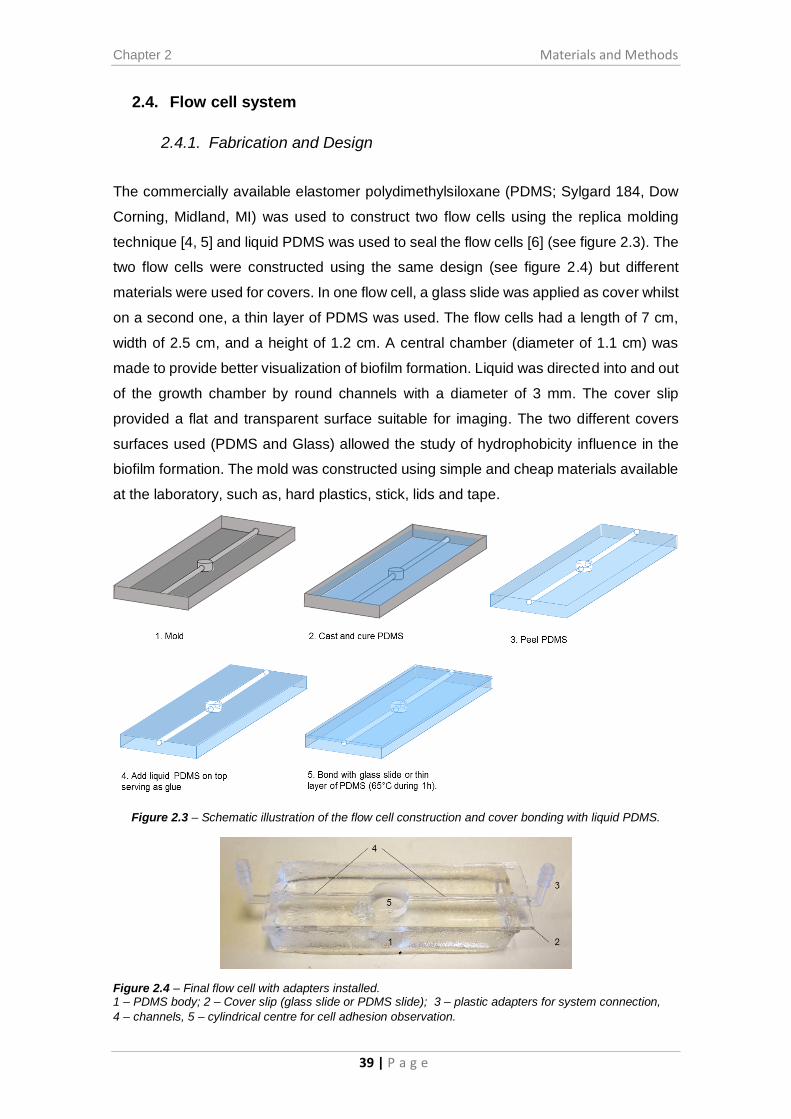
Chapter 2 Materials and Methods
39 | P a g e
2.4. Flow cell system
2.4.1. Fabrication and Design
The commercially available elastomer polydimethylsiloxane (PDMS; Sylgard 184, Dow
Corning, Midland, MI) was used to construct two flow cells using the replica molding
technique [4, 5] and liquid PDMS was used to seal the flow cells [6] (see figure 2.3). The
two flow cells were constructed using the same design (see figure 2.4) but different
materials were used for covers. In one flow cell, a glass slide was applied as cover whilst
on a second one, a thin layer of PDMS was used. The flow cells had a length of 7 cm,
width of 2.5 cm, and a height of 1.2 cm. A central chamber (diameter of 1.1 cm) was
made to provide better visualization of biofilm formation. Liquid was directed into and out
of the growth chamber by round channels with a diameter of 3 mm. The cover slip
provided a flat and transparent surface suitable for imaging. The two different covers
surfaces used (PDMS and Glass) allowed the study of hydrophobicity influence in the
biofilm formation. The mold was constructed using simple and cheap materials available
at the laboratory, such as, hard plastics, stick, lids and tape.
Figure 2.3 – Schematic illustration of the flow cell construction and cover bonding with liquid PDMS.
Figure 2.4 – Final flow cell with adapters installed. 1 – PDMS body; 2 – Cover slip (glass slide or PDMS slide); 3 – plastic adapters for system connection,
4 – channels, 5 – cylindrical centre for cell adhesion observation.

Chapter 2 Materials and Methods
40 | P a g e
2.4.2. System operation
To monitor cell adhesion in real time, each of the flow cells described above was placed
under a microscope as illustrated in Figure 2.5. The culture of cells grown as described
in section 1.1 was recirculated through the flow cell using a peristaltic pump (Pharmacia
LKB-Pump P-1). Magnetic stirring was used for oxygenation and mixture of the culture.
The lipids present in the biofilms were stained using Nile Red (Molecular Probes, Life
Technologies) as follows: a stock solution of 1.3 mg/mL of Nile red in acetone was
prepared, 5 µL were added to the cell culture and the system was left for incubation 5
min, just before the initiation of the system operation. The samples were observed by
fluorescence microscopy as described in section 2.1.2.
2.4.3. Biofilm analysis
At the end of operation, the flow cell was disconnected from the system and the biofilm
formed inside the flow cell was removed as follows: 1 mL of distilled water was applied
with a micropipette (Finnpipette model 4500 Labsystems) in one of the entries, the liquid
being recovered at the other side of the flow cell in a microtube (1.5 mL, Eppendorf®).
The process was repeated to collect biofilm samples in different sequential fractions. The
FAMEs production and analysis was proceeded as described in section 1.2.
Figure 2.5 - Schematic illustration of the flow cell system setup.

Chapter 2 Materials and Methods
41 | P a g e
2.4.4. Surface charge density
The surface charge density was determined, according to [7], by the equation: σ = ηu/d
in which u was the electrophoretic mobility, obtained from the zeta Potential
measurements (as described in section 1.3), η was the viscosity of the solution, and d
was the diffuse layer thickness [8]. The diffuse layer thickness was determined from the
formula [9] 𝑑 = √𝜀.𝜀0.𝑅.𝑇
2.𝐹2.𝐼 , where R was the gas constant, T was the temperature, F was
the Faraday number, I was the ionic strength of KNO3 (10 mM), and 𝜀. 𝜀0 was the
dielectric permittivity of the medium.
3. References
1. Hiemenz PC, Rajagopalan R: Principles of Colloid and Surface Chemistry, Third
Edition, Revised and Expanded: Taylor & Francis; 1997.
2. Everitt BS, Dunn G: Applied Multivariate Data Analysis. Oxford University Press; New
York, NY 1992.
3. de Carvalho C, Caramujo M-J: Fatty Acids as a Tool to Understand Microbial
Diversity and Their Role in Food Webs of Mediterranean Temporary Ponds.
Molecules 2014, 19(5):5570-5598.
4. Duffy DC, McDonald JC, Schueller OJ, Whitesides GM: Rapid Prototyping of
Microfluidic Systems in Poly(dimethylsiloxane). Anal Chem 1998, 70(23):4974-4984.
5. Weibel DB, Diluzio WR, Whitesides GM: Microfabrication meets microbiology. Nature
reviews Microbiology 2007, 5(3):209-218.
6. Wu H, Huang B, Zare RN: Construction of microfluidic chips using
polydimethylsiloxane for adhesive bonding. Lab Chip 2005, 5(12):1393-1398.
7. Dobrzynska I, Skrzydlewska E, Figaszewski ZA: Effects of novel dinuclear
cisplatinum(II) complexes on the electric properties of human breast cancer cells.
The Journal of membrane biology 2014, 247(2):167-173.
8. Krysiński P, Tien HY: Membrane electrochemistry. Prog Surf Sci 1986, 23:17-412.
9. Barrow GM: Physical chemistry McGraw-Hill, Inc, New York 1996.


Chapter 3 Results and
Discussion
1. Influence of Surface Material and Medium ................................................................45
2. Influence of surface hydrophobicity and cell growth phase .......................................51
3. Biofilm reactor ............................................................................................................58
Zeta potential .................................................................................................................60
Lipid Fractioning .............................................................................................................64
Enzymatic Profile ............................................................................................................65
4. Flow Cell System .........................................................................................................67
5. The Role of Lipids .......................................................................................................76
6. References ..................................................................................................................81


Chapter 3 Results and Discussion
45 | P a g e
The process of bacterial adhesion and growth on biofilms is still not very well understood
although the many studies performed. In this complex process many factors have to be
taken into consideration, including the physicochemical characteristics of bacteria
(hydrophobicity, surface charge), the properties of the substratum (chemical
composition, surface charge, hydrophobicity and roughness) and the environmental
conditions (e.g. temperature, pH, time of exposure, nutrients, the presence of
antimicrobials and fluid flow conditions). Some of these parameters were addressed in
the present study and the results and their discussion are detailed in this chapter.
1. Influence of Surface Material and Medium
The biofilm growth of R. erythropolis cells on 6-well plates was promoted for 48 hours on
different surfaces immersed in liquid medium to evaluate the changes occurring in lipid
composition of the cells during adhesion. The samples collected from the bottom of the
6 well-plates were expected to be composed of cells and aggregates from the biofilm
and were designated as biofilm cells. On the other hand, samples collected from the cell
suspension were expected to contain cells in planktonic state or cells that have detached
from the biofilm and were called planktonic cells.
The biofilm and planktonic cells were mainly composed of saturated straight fatty acids
(SSFAs) at least 34.8% and mono-unsaturated fatty acids (MUFAs) with a minimum of
27.7% (Figure 3.1). These fatty acids (FAs) are the main regulators of membrane
dynamic composition and fluidity [1]. In gram-positive bacteria, as R. erythropolis, 10-
methyl branched fatty acids (10MBFAs) occur in large percentage [2] and in this case
were 17.4% of total lipids. In Muller-Hinton (MH) medium, the percentage of 10MBFAs
is higher in cells attached (biofilm) to non-metallic surfaces (minimum of 21.3% with the
exception of the butyl rubber) than in those adherent to metallic surfaces (maximum of
18.8%) (Figure 3.1). These results suggest that bacteria have changed their lipid
composition as response to the surface. Metals have anti-microbial properties known
since ancient times [3]. By decreasing the 10MBFAs, the biofilm cells are probably trying
to stabilize the membrane upon aggression of metal ions. In mineral medium (MM), the
variation of FAs composition in biofilm cells was minimum when compared to those in
planktonic state. The exception were observed in the case of planktonic cells in contact
with Zn and Al where the 10MBFAs were not detect (0%) or were present at very low
percentage (0.5%), respectively.

Chapter 3 Results and Discussion
46 | P a g e
MH medium
Bio
film
cel
ls
Non-metals Metals
Pla
nkt
on
ic c
ells
Mineral medium
Bio
film
cells
Non-metals Metals
Pla
nkto
nic
cells
Figure 3.1 – Fatty acid composition of cells collected from biofilm and liquid medium.
MH, Mueller-Hinton. Butyl r., butyl ruber. Glass m., glass mosaic. SSFAs
–saturated straight chain fatty acids, MUFAs – monounsaturated fatty acids, BCFAs – branched-chain
fatty acids, 10MBFAs – 10-methyl branched fatty acids, PUFAs – polyunsaturated fatty acids.
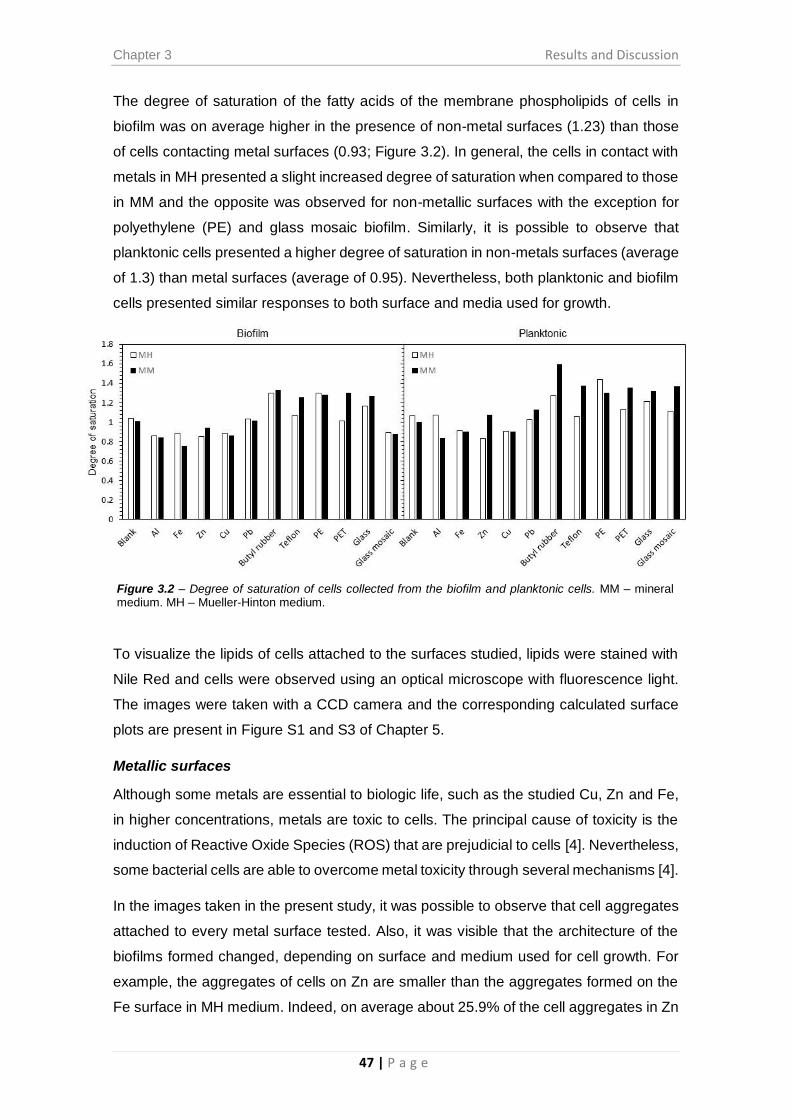
Chapter 3 Results and Discussion
47 | P a g e
The degree of saturation of the fatty acids of the membrane phospholipids of cells in
biofilm was on average higher in the presence of non-metal surfaces (1.23) than those
of cells contacting metal surfaces (0.93; Figure 3.2). In general, the cells in contact with
metals in MH presented a slight increased degree of saturation when compared to those
in MM and the opposite was observed for non-metallic surfaces with the exception for
polyethylene (PE) and glass mosaic biofilm. Similarly, it is possible to observe that
planktonic cells presented a higher degree of saturation in non-metals surfaces (average
of 1.3) than metal surfaces (average of 0.95). Nevertheless, both planktonic and biofilm
cells presented similar responses to both surface and media used for growth.
To visualize the lipids of cells attached to the surfaces studied, lipids were stained with
Nile Red and cells were observed using an optical microscope with fluorescence light.
The images were taken with a CCD camera and the corresponding calculated surface
plots are present in Figure S1 and S3 of Chapter 5.
Metallic surfaces
Although some metals are essential to biologic life, such as the studied Cu, Zn and Fe,
in higher concentrations, metals are toxic to cells. The principal cause of toxicity is the
induction of Reactive Oxide Species (ROS) that are prejudicial to cells [4]. Nevertheless,
some bacterial cells are able to overcome metal toxicity through several mechanisms [4].
In the images taken in the present study, it was possible to observe that cell aggregates
attached to every metal surface tested. Also, it was visible that the architecture of the
biofilms formed changed, depending on surface and medium used for cell growth. For
example, the aggregates of cells on Zn are smaller than the aggregates formed on the
Fe surface in MH medium. Indeed, on average about 25.9% of the cell aggregates in Zn
Figure 3.2 – Degree of saturation of cells collected from the biofilm and planktonic cells. MM – mineral medium. MH – Mueller-Hinton medium.

Chapter 3 Results and Discussion
48 | P a g e
had a size between 25 and 50 pixels and 24.9% of the cell aggregates in Fe had 100 to
200 pixels in size. The majority of aggregates had a size between 25 and 50 pixels in
MM and between 50 and 200 pixels in size on MH medium (see Figure S2 of Chapter
5).
Furthermore, the percentage of area occupied by biofilm was on average larger in MM
(25%) than in MH medium (14.6%) (Figure 3.3). This observation suggests that the
different medium and carbon source influences the composition of the cell membranes
and biofilm content in lipids. In a study presented by de Carvalho et al. it was shown that
R. erythropolis DCL14 adapt their membrane fatty acids according to the carbon sources
used for growth, which that also affected the growth rate [5]. An exception, where the
MH broth promoted a larger biofilm, was the case of biofilm formed in a Fe surface: the
area occupied by cells reaching a percentage of 27.2% of the total image area in MH
medium compared to the 9.6% in MM (Figure 3.3). Besides, it was notorious the change
in the shape of the biofilm formed in the Fe surface in the two media (Figure S1 of
Chapter 5). Despite the abundance of carbon source in MH medium, the
R. erythropolis cells preferred MM and ethanol as carbon source, contrarily to what has
been observed with other species [6].
Interestingly, the percentage of biofilm formed on the Zn surface (57.3%) was higher
than even that of the blank assay (42.2%) where the cells adhered to the polystyrene of
the well (Figure 3.3). On the other hand, the smallest area of biofilm was achieved on a
Cu surface. This result was expected because of the antimicrobial properties of copper
[7, 8]. Warnes et al. [9] proposed that the mechanisms involved in copper toxicity for
enterococci are the direct or indirect action of copper ions released from the surface and
the generation of superoxide species. In the same study biofilms were able to develop in
Figure 3.3– Percentage of area occupied by the biofilm in the images presented in Figure S1 of Chapter 5. MH – Mueller-Hinton medium.
MM – mineral medium.

Chapter 3 Results and Discussion
49 | P a g e
copper surfaces mainly if they were wet, emphasizing the importance of maintaining
hospital copper surfaces dry to increase the success of biofilm eradication.
During the experiments made in the present study, it was possible to observe that
R. erythropolis was able to grow on different metal surfaces although they are known to
inhibit bacterial growth. This was not a surprise because of the large array of enzymes
they contain and their capacity of adaptation to extreme conditions. In several studies de
Carvalho and co-workers described the extraordinary capacity of R. erythropolis to make
numerous bioconversions and degradations and adapt to extreme condition [5, 7, 10].
Non-metallic surfaces
The infections caused by biofilms formed in medical devices are very problematic,
resulting in financial losses and human fatalities annually [11-13]. Part of these medical
devices is made of different plastics and glass. To assess if R. erythropolis form biofilm
in these types of surfaces, different materials were tested, namely butyl rubber, teflon,
PE, polyethylene terephthalate (PET), glass and glass mosaic (Figure S3 of the Chapter
5). As seen previously with metals, it is noticeable the changes in biofilm area and shape
according to the non-metallic surfaces and to the medium used.
Butyl rubber (5.1%, MH; 4.3%, MM) and glass mosaic (1.3%, MH; 2.2%, MM) in both
media promoted only small areas of biofilm (Figure 3.4). The plastic surfaces PET
(12.2%, MH; 9.2%, MM) and PE (11.8%, MH; 13.9%, MM) promoted a similar percentage
of occupied area in both two media. This is also observable in the images taken, although
for MH medium the size of biofilm aggregates on PET (between 50 to 200 pixels and 300
to 500 pixels) are larger when compared to those formed on PE (25 to 100 pixels) (Figure
S4 of the Chapter 5). Besides, it is possible to verify that the biofilm aggregates in MM
had between 0 to 25 pixels and between 50 to 100 pixels in contrast to those formed in
Figure 3.4 – Percentage of area occupied by the biofilm in the images presented in Figure S3 of the Chapter 5. MH – Mueller-Hinton medium. MM – mineral medium
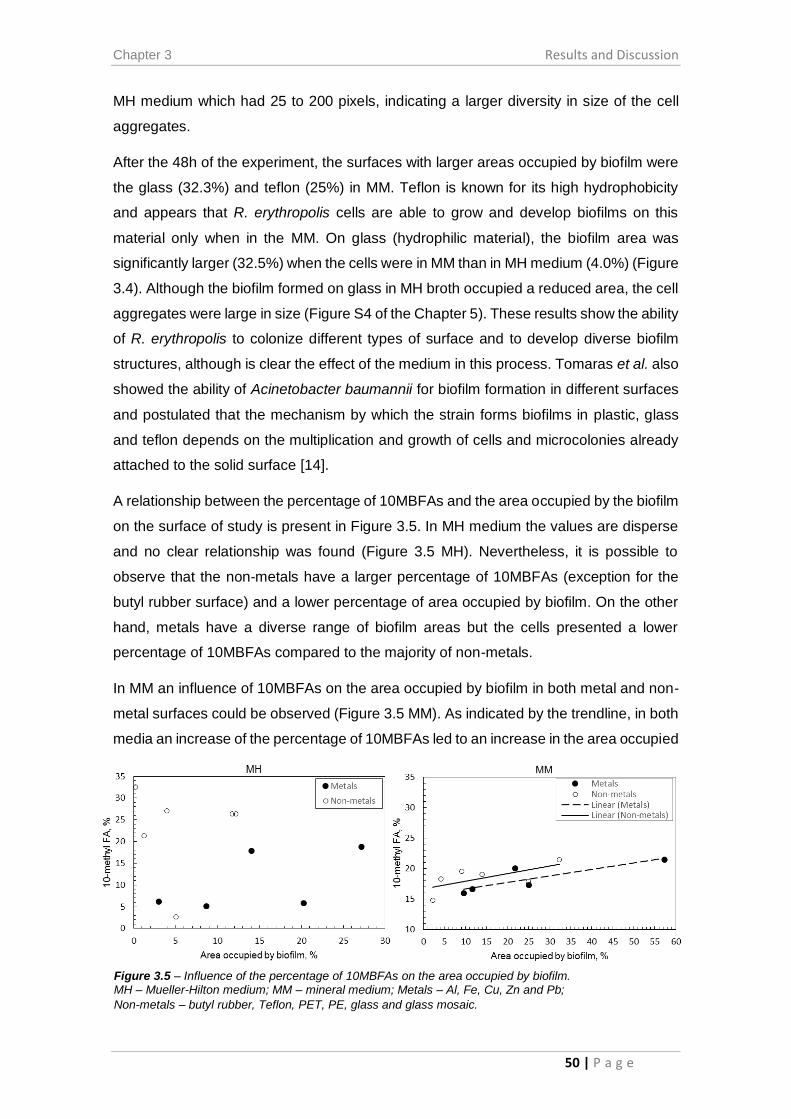
Chapter 3 Results and Discussion
50 | P a g e
MH medium which had 25 to 200 pixels, indicating a larger diversity in size of the cell
aggregates.
After the 48h of the experiment, the surfaces with larger areas occupied by biofilm were
the glass (32.3%) and teflon (25%) in MM. Teflon is known for its high hydrophobicity
and appears that R. erythropolis cells are able to grow and develop biofilms on this
material only when in the MM. On glass (hydrophilic material), the biofilm area was
significantly larger (32.5%) when the cells were in MM than in MH medium (4.0%) (Figure
3.4). Although the biofilm formed on glass in MH broth occupied a reduced area, the cell
aggregates were large in size (Figure S4 of the Chapter 5). These results show the ability
of R. erythropolis to colonize different types of surface and to develop diverse biofilm
structures, although is clear the effect of the medium in this process. Tomaras et al. also
showed the ability of Acinetobacter baumannii for biofilm formation in different surfaces
and postulated that the mechanism by which the strain forms biofilms in plastic, glass
and teflon depends on the multiplication and growth of cells and microcolonies already
attached to the solid surface [14].
A relationship between the percentage of 10MBFAs and the area occupied by the biofilm
on the surface of study is present in Figure 3.5. In MH medium the values are disperse
and no clear relationship was found (Figure 3.5 MH). Nevertheless, it is possible to
observe that the non-metals have a larger percentage of 10MBFAs (exception for the
butyl rubber surface) and a lower percentage of area occupied by biofilm. On the other
hand, metals have a diverse range of biofilm areas but the cells presented a lower
percentage of 10MBFAs compared to the majority of non-metals.
In MM an influence of 10MBFAs on the area occupied by biofilm in both metal and non-
metal surfaces could be observed (Figure 3.5 MM). As indicated by the trendline, in both
media an increase of the percentage of 10MBFAs led to an increase in the area occupied
Figure 3.5 – Influence of the percentage of 10MBFAs on the area occupied by biofilm. MH – Mueller-Hilton medium; MM – mineral medium; Metals – Al, Fe, Cu, Zn and Pb;
Non-metals – butyl rubber, Teflon, PET, PE, glass and glass mosaic.

Chapter 3 Results and Discussion
51 | P a g e
by the biofilm in the solid surface studied. MH medium is a rich medium, and cells have
a lot of nutrients at their disposal. On the contrary, mineral medium is an elementary
medium and cells are expected to present lower metabolic activity. This behaviour could
be responsible for the data presented in Figure 3.5, where biofilm area and the
percentage of 10MBFAs are more correlated in mineral medium and not so scattered as
in MH medium. Cells in MM do not have many nutrients available, and one of the best
ways to overcome the lack of nutrients is to develop a community of cells that can
cooperate for the benefit of the group [15]. This is probably one of the reasons for a larger
area of biofilm formed by R. erythropolis cells in most of the surfaces in MM when
compared to the MH medium, contrarily to what is observed in most species.
Other important factor for cell adhesion is the chemical nature of the substratum to which
the cells adhere. On metals, the highest percentage of area occupied by the R.
erythropolis biofilm was achieved in a Zn surface (57.3%) and in non-metals on a glass
surface (32.3%). Other characteristic observed in the growth of biofilms was their
architecture. In some surfaces the change in architecture was notable as in the case of
the iron surface (see Figure S1 of the Chapter 5). Moreover, the size of the aggregates
also indicated the influence of surface on biofilm architecture. For instance, two plastic
surfaces could promote similar areas occupied by biofilm in both media (Figure 3.4) but
the cells formed aggregates of different sizes (PET and PE, Figure S4 of the Chapter 5).
2. Influence of surface hydrophobicity and cell growth phase
The contact angle of a liquid drop resting on a flat, horizontal solid surface is defined as
the angle formed by the intersection of the liquid-solid interface and the liquid-vapour
interface ([16]; Figure 3.6). When the contact angle is less than 90° the liquid drop
spreads along the surface indicating that the surface is wettable and hydrophilic. Contact
angles larger than 90° mean that the surface is unfavourable to wetting and is
hydrophobic; on these surfaces the fluid will minimize its contact with the surface and
form a compact liquid droplet. The contact angle of the surfaces is correlated with the
formation and adhesion of microbial biofilms to them [17, 18]
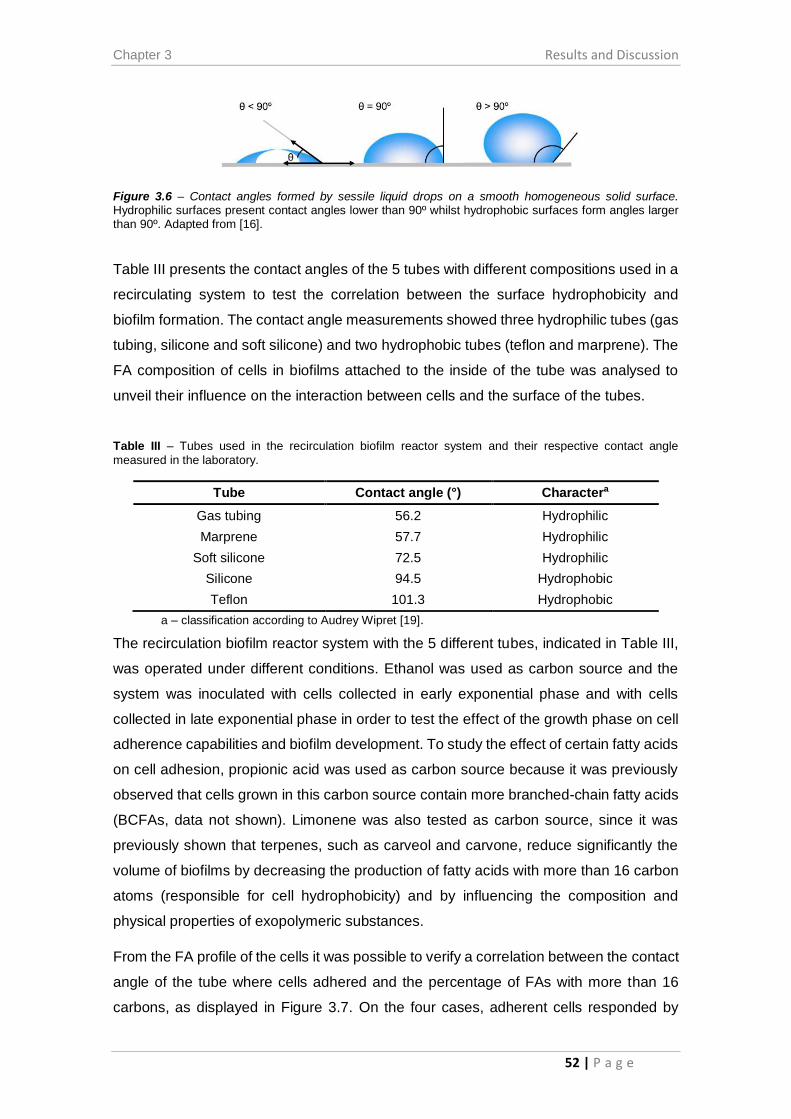
Chapter 3 Results and Discussion
52 | P a g e
Figure 3.6 – Contact angles formed by sessile liquid drops on a smooth homogeneous solid surface. Hydrophilic surfaces present contact angles lower than 90º whilst hydrophobic surfaces form angles larger than 90º. Adapted from [16].
Table III presents the contact angles of the 5 tubes with different compositions used in a
recirculating system to test the correlation between the surface hydrophobicity and
biofilm formation. The contact angle measurements showed three hydrophilic tubes (gas
tubing, silicone and soft silicone) and two hydrophobic tubes (teflon and marprene). The
FA composition of cells in biofilms attached to the inside of the tube was analysed to
unveil their influence on the interaction between cells and the surface of the tubes.
Table III – Tubes used in the recirculation biofilm reactor system and their respective contact angle
measured in the laboratory.
Tube Contact angle (°) Charactera
Gas tubing 56.2 Hydrophilic
Marprene 57.7 Hydrophilic
Soft silicone 72.5 Hydrophilic
Silicone 94.5 Hydrophobic
Teflon 101.3 Hydrophobic
a – classification according to Audrey Wipret [19].
The recirculation biofilm reactor system with the 5 different tubes, indicated in Table III,
was operated under different conditions. Ethanol was used as carbon source and the
system was inoculated with cells collected in early exponential phase and with cells
collected in late exponential phase in order to test the effect of the growth phase on cell
adherence capabilities and biofilm development. To study the effect of certain fatty acids
on cell adhesion, propionic acid was used as carbon source because it was previously
observed that cells grown in this carbon source contain more branched-chain fatty acids
(BCFAs, data not shown). Limonene was also tested as carbon source, since it was
previously shown that terpenes, such as carveol and carvone, reduce significantly the
volume of biofilms by decreasing the production of fatty acids with more than 16 carbon
atoms (responsible for cell hydrophobicity) and by influencing the composition and
physical properties of exopolymeric substances.
From the FA profile of the cells it was possible to verify a correlation between the contact
angle of the tube where cells adhered and the percentage of FAs with more than 16
carbons, as displayed in Figure 3.7. On the four cases, adherent cells responded by
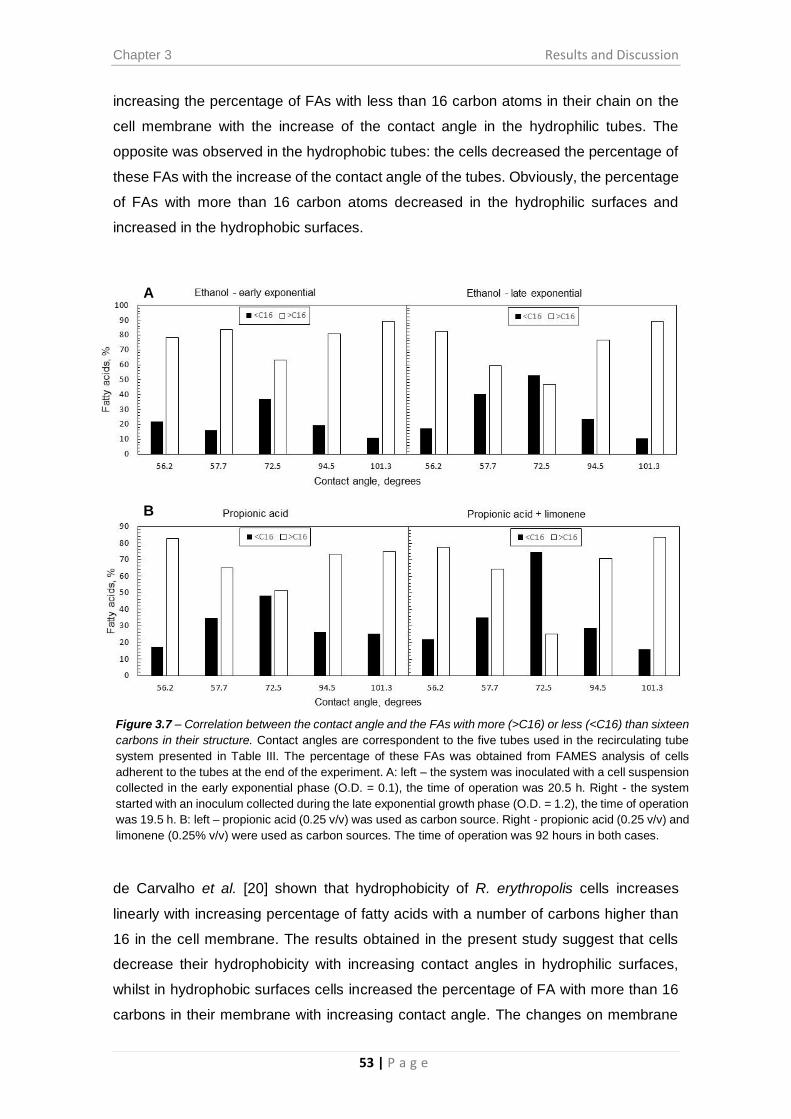
Chapter 3 Results and Discussion
53 | P a g e
increasing the percentage of FAs with less than 16 carbon atoms in their chain on the
cell membrane with the increase of the contact angle in the hydrophilic tubes. The
opposite was observed in the hydrophobic tubes: the cells decreased the percentage of
these FAs with the increase of the contact angle of the tubes. Obviously, the percentage
of FAs with more than 16 carbon atoms decreased in the hydrophilic surfaces and
increased in the hydrophobic surfaces.
de Carvalho et al. [20] shown that hydrophobicity of R. erythropolis cells increases
linearly with increasing percentage of fatty acids with a number of carbons higher than
16 in the cell membrane. The results obtained in the present study suggest that cells
decrease their hydrophobicity with increasing contact angles in hydrophilic surfaces,
whilst in hydrophobic surfaces cells increased the percentage of FA with more than 16
carbons in their membrane with increasing contact angle. The changes on membrane
Figure 3.7 – Correlation between the contact angle and the FAs with more (>C16) or less (<C16) than sixteen
carbons in their structure. Contact angles are correspondent to the five tubes used in the recirculating tube
system presented in Table III. The percentage of these FAs was obtained from FAMES analysis of cells
adherent to the tubes at the end of the experiment. A: left – the system was inoculated with a cell suspension
collected in the early exponential phase (O.D. = 0.1), the time of operation was 20.5 h. Right - the system
started with an inoculum collected during the late exponential growth phase (O.D. = 1.2), the time of operation
was 19.5 h. B: left – propionic acid (0.25 v/v) was used as carbon source. Right - propionic acid (0.25 v/v) and
limonene (0.25% v/v) were used as carbon sources. The time of operation was 92 hours in both cases.
B
A
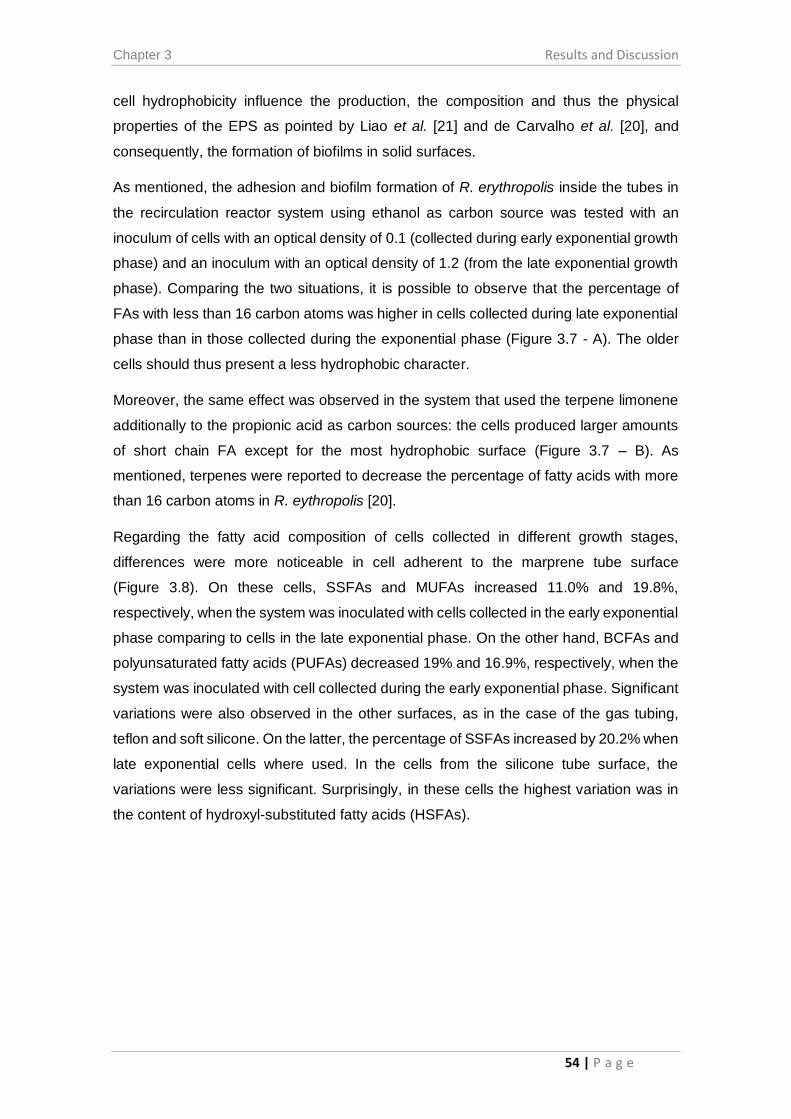
Chapter 3 Results and Discussion
54 | P a g e
cell hydrophobicity influence the production, the composition and thus the physical
properties of the EPS as pointed by Liao et al. [21] and de Carvalho et al. [20], and
consequently, the formation of biofilms in solid surfaces.
As mentioned, the adhesion and biofilm formation of R. erythropolis inside the tubes in
the recirculation reactor system using ethanol as carbon source was tested with an
inoculum of cells with an optical density of 0.1 (collected during early exponential growth
phase) and an inoculum with an optical density of 1.2 (from the late exponential growth
phase). Comparing the two situations, it is possible to observe that the percentage of
FAs with less than 16 carbon atoms was higher in cells collected during late exponential
phase than in those collected during the exponential phase (Figure 3.7 - A). The older
cells should thus present a less hydrophobic character.
Moreover, the same effect was observed in the system that used the terpene limonene
additionally to the propionic acid as carbon sources: the cells produced larger amounts
of short chain FA except for the most hydrophobic surface (Figure 3.7 – B). As
mentioned, terpenes were reported to decrease the percentage of fatty acids with more
than 16 carbon atoms in R. eythropolis [20].
Regarding the fatty acid composition of cells collected in different growth stages,
differences were more noticeable in cell adherent to the marprene tube surface
(Figure 3.8). On these cells, SSFAs and MUFAs increased 11.0% and 19.8%,
respectively, when the system was inoculated with cells collected in the early exponential
phase comparing to cells in the late exponential phase. On the other hand, BCFAs and
polyunsaturated fatty acids (PUFAs) decreased 19% and 16.9%, respectively, when the
system was inoculated with cell collected during the early exponential phase. Significant
variations were also observed in the other surfaces, as in the case of the gas tubing,
teflon and soft silicone. On the latter, the percentage of SSFAs increased by 20.2% when
late exponential cells where used. In the cells from the silicone tube surface, the
variations were less significant. Surprisingly, in these cells the highest variation was in
the content of hydroxyl-substituted fatty acids (HSFAs).

Chapter 3 Results and Discussion
55 | P a g e
The effect of growth phase of bacteria is important to the process of adhesion and
infection. During a similar time of system operation, the cells with more capacity to
adhere to the tube surfaces will promote larger biofilms on their surfaces. Figure 3.9
demonstrates that more biomass was adherent at the end of the experiment when the
system was inoculated with cells from an early exponential growth culture. The exception
was observed in the amount of cells which adhered to the silicone tube. These
observations are in concordance with the work of Cronin and Wilkinson who studied the
Figure 3.8 – Fatty acid composition of the cells attached to the inside surface of tubes in the recirculation
reactor system with ethanol (0.25% v/v) as carbon source.
A: left – the system was inoculated with a cell suspension collected during the early exponential phase (O.D.
= 0.1), the time of operation was 20.5 h. Right - the system started with a cell suspension collected in the late
exponential growth phase (O.D. = 1.2), the time of operation was 19.5 h. Tubes are ordered by increasing
contact angle. B – Differences between fatty acid composition of adherent cells, at the end of system operation,
when the system was inoculated with cells from early and late exponential growth phases. The “Culture”
sample (control) refers to the planktonic cells in the shake flask that fed the system. SSFAs – saturated straight
chain fatty acids, MUFAs – monounsaturated fatty acids, BCFAs – branched-chain fatty acids, SCBFAs –
saturated cyclopropyl-branched fatty acids, 10MBFAs – 10-methyl branched fatty acids, DMAFAs –
dimethylacetal fatty acids, PUFAs – polyunsaturated fatty acids,
HSFA – hydroxyl-substituted fatty acids.
A
B

Chapter 3 Results and Discussion
56 | P a g e
adhesion of Bacillus cereus and suggested that cells in late exponential phase appeared
to have reduced adherence properties compared to cells in early exponential or lag
phase [22]. Nevertheless, the chemical nature of the substratum could have a strong
influence, as observed on soft silicone tubes, which allowed the highest adherence of
cells. On both cases, inoculation with early and late exponential cells, an increase of
adherence was observed with increasing contact angle on hydrophilic surfaces (gas
tubing, marprene and soft silicone). Contrary, the adherence decreased with increasing
contact angle on hydrophobic surfaces (silicone and teflon). These results are in
concordance with the results regarding the percentage of FAs with more or less than 16
carbon atoms where the soft silicone was also the inflection point of the “curve”. This
suggests a different response of cells when facing hydrophobic or hydrophilic surfaces.
Moreover, the results indicate that a decrease in cell hydrophobicity as result of a
decrease in the percentage of FA with more than 16 carbon atoms (Figure 3.7), leads to
higher adherence of cells to hydrophilic surfaces (Figure 3.9).
Similar profiles of FA were obtained in cells from the system in the presence and absence
of limonene (Figure 3.10). In fact, the variation between the two cases was less than 7%
which is low when compared to the differences found in the system using ethanol and
cells from early or late exponential phases (Figure 3.8). Although terpenes may be
considered toxic compounds that destabilize the cell membrane and to which the
microorganisms have to adapt their membranes, R. erythropolis cells are able to use
limonene as carbon source [5]. Besides, the percentage of each lipid class may be
similar but the composition in the individual FA in each class may vary, as shown
regarding the composition in FA with 16 carbon atoms (Figure 3.7).
Figure 3.9 – Lipid weight of cells adherent to the tube surfaces at the end of system
operation. Ethanol (0.25% v/v) was the carbon source and the system was inoculated with
cells from early and late exponential growth phases. Data was normalised using the biomass
in the culture at the end of system operation.

Chapter 3 Results and Discussion
57 | P a g e
As expected, in the presence of limonene less cells adhered to the tubes (inferred from
the percentage of lipids extracted from the cells on the tube surface) than in the absence
of this terpene (Figure 3.11). The exception was observed in the silicone tube. The
results are in concordance with de Carvalho et al. that showed the ability of terpenes to
disperse cell aggregates and demote established biofilms [20].
Figure 3.10 – Fatty acid composition of the cells attached to the inside surface of tubes in the recirculation
reactor system with propionic acid (0.25% v/v, A-left) or propionic acid with limonene (0.25% v/v, A – right) as
carbon sources, the time of operation was 92h in both cases . B – Differences between fatty acid composition
of adherent cells, at the end of system operation, between cells on propionic acid and propionic acid with
limonene. The “Culture” sample (control) refers to the planktonic cells in the shake flask that fed the system.
SSFAs – saturated straight chain fatty acids, MUFAs – monounsaturated fatty acids, BCFAs – branched-chain
fatty acids, SCBFAs – saturated cyclopropyl-branched fatty acids, 10MBFAs – 10-methyl branched fatty acids,
DMAFAs – dimethylacetal fatty acids, PUFAs – polyunsaturated fatty acids, HSFA – hydroxyl-substituted fatty
acids.monounsaturated fatty acids, BCFAs – branched-chain fatty acids, SCBFAs – saturated cyclopropyl-
branched fatty acids, 10MBFAs – 10-methyl branched fatty acids, DMAFAs – dimethylacetal fatty acids,
PUFAs – polyunsaturated fatty acids, HSFA – hydroxyl-substituted fatty acids.
A
B
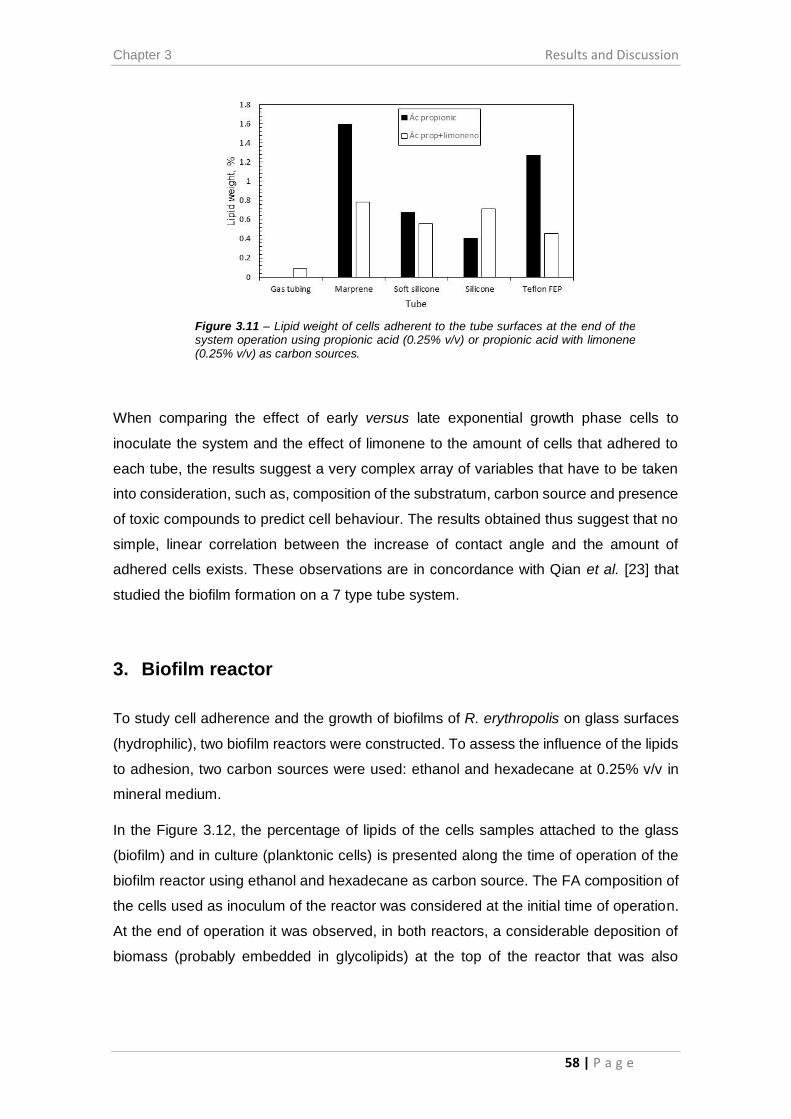
Chapter 3 Results and Discussion
58 | P a g e
When comparing the effect of early versus late exponential growth phase cells to
inoculate the system and the effect of limonene to the amount of cells that adhered to
each tube, the results suggest a very complex array of variables that have to be taken
into consideration, such as, composition of the substratum, carbon source and presence
of toxic compounds to predict cell behaviour. The results obtained thus suggest that no
simple, linear correlation between the increase of contact angle and the amount of
adhered cells exists. These observations are in concordance with Qian et al. [23] that
studied the biofilm formation on a 7 type tube system.
3. Biofilm reactor
To study cell adherence and the growth of biofilms of R. erythropolis on glass surfaces
(hydrophilic), two biofilm reactors were constructed. To assess the influence of the lipids
to adhesion, two carbon sources were used: ethanol and hexadecane at 0.25% v/v in
mineral medium.
In the Figure 3.12, the percentage of lipids of the cells samples attached to the glass
(biofilm) and in culture (planktonic cells) is presented along the time of operation of the
biofilm reactor using ethanol and hexadecane as carbon source. The FA composition of
the cells used as inoculum of the reactor was considered at the initial time of operation.
At the end of operation it was observed, in both reactors, a considerable deposition of
biomass (probably embedded in glycolipids) at the top of the reactor that was also
Figure 3.11 – Lipid weight of cells adherent to the tube surfaces at the end of the system operation using propionic acid (0.25% v/v) or propionic acid with limonene (0.25% v/v) as carbon sources.
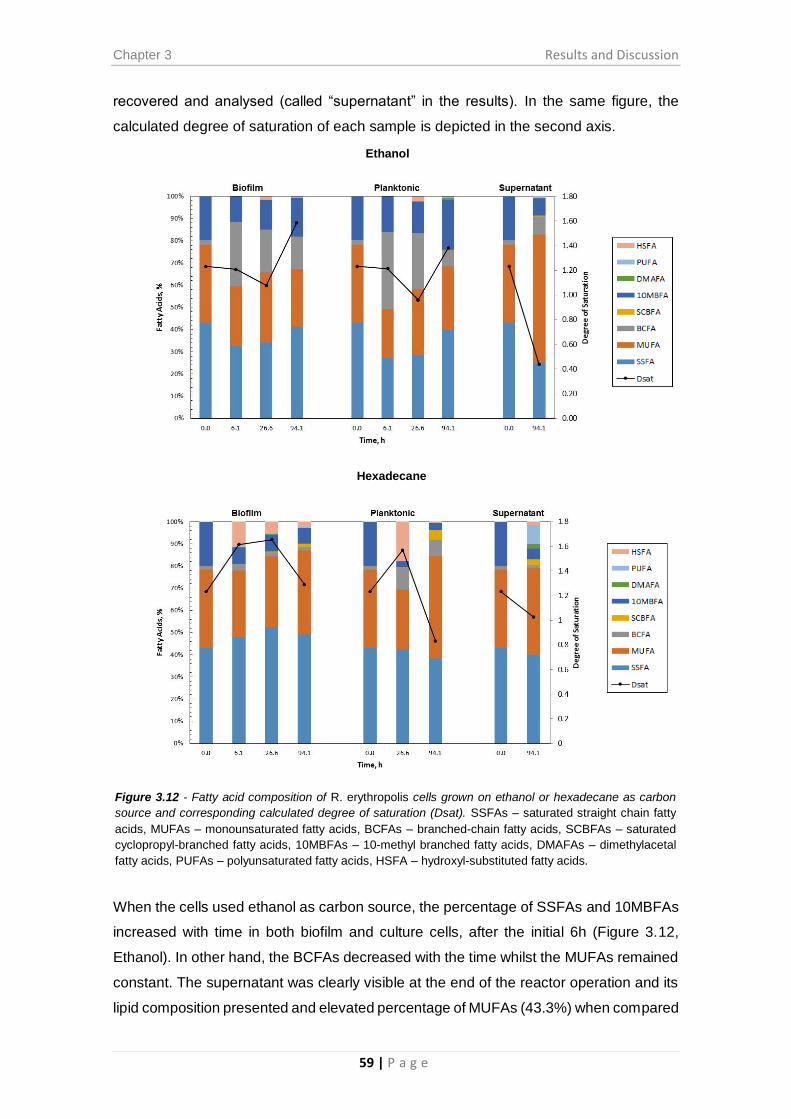
Chapter 3 Results and Discussion
59 | P a g e
recovered and analysed (called “supernatant” in the results). In the same figure, the
calculated degree of saturation of each sample is depicted in the second axis.
When the cells used ethanol as carbon source, the percentage of SSFAs and 10MBFAs
increased with time in both biofilm and culture cells, after the initial 6h (Figure 3.12,
Ethanol). In other hand, the BCFAs decreased with the time whilst the MUFAs remained
constant. The supernatant was clearly visible at the end of the reactor operation and its
lipid composition presented and elevated percentage of MUFAs (43.3%) when compared
Figure 3.12 - Fatty acid composition of R. erythropolis cells grown on ethanol or hexadecane as carbon
source and corresponding calculated degree of saturation (Dsat). SSFAs – saturated straight chain fatty
acids, MUFAs – monounsaturated fatty acids, BCFAs – branched-chain fatty acids, SCBFAs – saturated
cyclopropyl-branched fatty acids, 10MBFAs – 10-methyl branched fatty acids, DMAFAs – dimethylacetal
fatty acids, PUFAs – polyunsaturated fatty acids, HSFA – hydroxyl-substituted fatty acids.
Hexadecane
Ethanol

Chapter 3 Results and Discussion
60 | P a g e
to the cells in biofilm biofilm (26%) and planktonic (28.9%) at the end of operation. The
percentage of SSFAs was lower and consequently the degree of saturation in these
samples was only 0.44, suggesting a very low saturation degree of cell membrane of
possible cells in the supernatant. By analysing the degree of saturation of biofilm and
planktonic cells, is perceptible that in both cases the degree of saturation decreased until
26.6 hours but at the end the cells presented membranes with higher percentage of
saturated FAs than at the beginning. Such behaviour could result from carbon source
depletion or/and lack of oxygen at the end of the experiment. In fact, the deposition of a
thick mass layer on the top the medium may have hindered oxygen transfer. Supporting
this affirmation is the fact that cells in the supernatant decreased their saturation degree
possible due to an easier access to oxygen.
The fatty acid profile of cells grown as biofilm on hexadecane increased the SSFAs
percentage on cell membranes along the time. In contrast, planktonic cells decrease the
percentage of SSFAs (Figure 3.12, Hexadecane). The percentage of MUFAs decreased
during the initial hours but increased in both cases till the end. Similarly, 10MBFAs
decreased in cells in the biofilm reactor when compared to the cells at time zero but their
percentage remained constant until the end of operation. In biofilm cells, the BCFAs were
constant but in planktonic cells their percentage was higher than at the beginning of the
experiment. The degree of saturation on both cases increased until 26.6 hours and
decreased towards the end of the experiment (94.1 h), with planktonic cells presenting
a degree of saturation lower than biofilm cells on the glass surface. The supernatant
presented a FA profile similar to the biofilm and planktonic cells at the end of the
experiment, although it’s noticeable the presence of PUFAs (8.7%) that are almost non-
existent in the other two.
Comparing the composition of the cells grown on the two carbon sources, some
differences are observed. In ethanol, the samples collected from the established biofilm
presented in general more BCFAs, 10MBFAs and decreased degree of saturation. On
the other hand, hexadecane grown cells presented HSFAs which in the ethanol grown
cells are almost absent. Moreover, the 10MBFAs decreased with the time when
compared to ethanol samples.
Zeta potential
The net surface charge of the cells may influence the process of interaction and
attachment to the substratum, since van der Waals, hydrophobic and electrostatic

Chapter 3 Results and Discussion
61 | P a g e
interactions are known to be involved in the process of cell adhesion [24]. In order to test
the existence of differences in the charge between planktonic and biofilm cells, the zeta
potential was measured in samples collected simultaneously to those for the FAMES
analyses.
The net surface charge of cells, represented by the zeta potential, grown in ethanol
presented an increase during the first 6 hours (Figure 3.13 - left), this increase being
higher in biofilm attached on glass (-16.4 mV) than in planktonic cells (-29 mV).
Nevertheless, at 26 hours the charge dropped to values lower than at the beginning of
the experiment. At the end (94 hours) the surface charge increased slight in the two
cases, although more significantly in planktonic cells than in those in the biofilm. The
supernatant formed at the end of operation presented cells with a net charge of -37.55
mV, which is similar to the -36.95 mV of cells attached to the glass surface. Cells in the
supernatant might, in fact, grow as a biofilm (a thick layer could be observed at the liquid-
gas interphase) similar the cells attached to the glass, which could explain the
comparable net surface charge of the cells.
On the other hand, when hexadecane was used as carbon source (Figure 3.13 – right),
cells presented behaviour different from those cells grown on ethanol. Planktonic cells
changed their surface charge along the time of operation and becoming less negative.
The cells in biofilm maintained the charge constant during the first 6-26 h
(-31.55 mV), but increased their charge afterwards, reaching up to -15.75 mV at 94.1 h.
In both cases is notorious the increase of the membrane charge. The cells at the
supernatant at the end of the biofilm reactor operation had a net charge similar to the
planktonic cells. In fact, at the end, the cells from the three different situations presented
a similar membrane charge
Figure 3.13 – Net surface charge of biofilm and planktonic cells grown in the biofilm reactor with 0.25 %
v/v of ethanol (left) or hexadecane (right). At the end of operation, a sample of the supernatant formed was collected.

Chapter 3 Results and Discussion
62 | P a g e
de Carvalho et al. [24] studied cell wall properties of R. erythropolis cells on different
n-alkane hydrocarbons and demonstrated that the zeta potential decreases with the
increase of the chain length of the carbon source and that biofilm and planktonic cells
have similar behaviour in terms of the cell surface charge. In the present study it was
also observed that planktonic and biofilm cells present similar surface charge during the
time of operation and that cells grown on a short chain alkanol (ethanol) presented
surface charges lower than those grown on a long chain alkane (hexadecane), as
observed in Figure 3.13.
Although the net charge represent the overall charge of a certain sample/population of
cells, in some cases different subpopulations, composed of cells with different surface
may be present. These subpopulations may be studied by analysis of the zeta potential
distribution of each sample (Figure 3.14). At 6.1 h, the “biofilm” sample presented two
different populations. The largest percentage of the adherent cells (61.2%) had a charge
of -9.19 mV whilst the remaining (38.8%) presented a charge of -28.3 mV, which is in
the range of the surface charge of planktonic cells. Similarly at 94.1 hours, cells in culture
presented 10% of the population with -10.8 mV of surface charge whilst the remaining
Figure 3.14 – Zeta potential distribution of cells in planktonic state, biofilm and in the supernatant along the
time of operation of the biofilm reactor with ethanol as carbon source (0.25% v/v). Replicates are indicated
with numbers one and two. The surface charge of the inoculum cells (culture) was used at time zero
Chapter 3 Results and Discussion
63 | P a g e
results indicate that cells presented a surface charge between -40 mV and -30 mV and
only one kind of population.
In hexadecane the presence of subpopulations with different surface charges are even
more notorious (Figure 3.15). For instance, at 26 hours, planktonic cells presented
clearly two different populations: one with an average zeta potential of -27.5 mV (67.4
%) and a second one with -10 mV (27.5 %). At the end of operation, planktonic cells
presented a surface charge less negative (Figure 3.13 – right). In fact, 73.7 % of the
planktonic cell population had a membrane charge of -13.5 mV and 26.6% of -37.6 mV
(Figure 3.15). So, compared to what was observed at 26.6 hours, most of the population
became less negative but a small part remained as negative as those at the beginning
(0 h). Similar behaviour was observable in cells from the biofilm, which had a small
population at 6.1 h with zeta potentials of -15 mV but at 94.1 h this population
represented 63% of the cells. The cells in the supernatant at the end presented a
distribution similar to the cell on the biofilm, suggesting, as expected that this supernatant
formed was a biofilm on top of the culture medium, and so, had comparable
characteristics with the biofilm formed on the glass slide.
Figure 3.15 – Zeta potential distribution of cells in planktonic state, biofilm and in the supernatant along the
time of operation of the biofilm reactor with hexadecane as carbon source (0.25% v/v). Replicates are
indicated with numbers one and two. The surface charge of the inoculum cells (culture) was used at time
zero

Chapter 3 Results and Discussion
64 | P a g e
Lipid Fractioning
The lipid composition presented in the previous sections represents the total fatty acids
in the cells. Since the cells were collected during exponential phases in most of the
cases, the large majority of the fatty acids should had been present in the cellular
membrane phospholipids. However, after establishment of the biofilm or during periods
of nutrient shortage, the cells may accumulate storage lipids and/or produce
exopolymeric glycolipids. To study the origin of the fatty acids accurately, the lipids were
fractioned into apolar lipids and neutral lipids, which contain storage lipids, and
phospholipids.
Samples from the ethanol and hexadecane biofilm reactors were collected from culture
(planktonic cells), glass surface (biofilm) and supernatant and used for the fractioning of
the different lipids in the cells. The phospholipids are present in cell membranes and their
percentage is also representative of the quantity of cells present in the sample. The
glycolipids may act as storage lipids but also as biosurfactants that some bacteria, such
as R. erythropolis, produce and excrete to decrease the superficial tension of the medium
[139] or to act as antimicrobial agents [140]. The apolar lipids are also storage lipids
which, in the case of R. erythropolis, are mainly triacylglycerols (TAGs). These lipids are
more common in eukaryotic organisms but are also found in the mycolata taxon, which
contains species such as Mycobacterium, Streptomyces, Rhodococcus and Nocardia.
The function of TAGs are mainly of carbon and energy storage but other functions have
been described [27].
The percentage of phospholipids was similar in culture and glass samples in both carbon
sources (between 25 and 31%) and increased in the supernatant to 40% in hexadecane
and 46% in ethanol (Figure 3.16). This result suggests the existence of more cells in the
samples collected from the supernatant than in those from the glass (biofilm) and culture
(planktonic cells). Accordingly, the percentage of glycolipids is higher in cells collected
from the glass surface and culture samples (more than 50%) rather than from cells in the
supernatant (around 15%). The apolar lipids present in supernatant samples
represented 45% of total lipids in hexadecane grown cells and 38% in ethanol, whilst it
represented around 17.8% in planktonic cells and in those attached to the glass. Indeed
the samples collected from the glass surface and culture had similar compositions. Cells
from the supernatant samples presented less storage lipids (53.7% in ethanol and 60.1%
in hexadecane) when compared to cells from the glass surface (70.5% in ethanol and
75.1% in hexadecane) and planktonic cells in culture (71.3% in ethanol and 68.9% in
hexadecane). This suggests that cells at the surface, with easy access to oxygen, should

Chapter 3 Results and Discussion
65 | P a g e
have been kept growing while those in the biofilm and in the culture suspension may
have been under oxygen depleting conditions because of the thick layer formed by the
supernatant at the top of the reactor.
Enzymatic Profile
Semiquantification of the enzymatic activities of cells from biofilm and supernatant
samples recovered at the end of the biofilm reactor operation was accessed using an
API ZYM® kit from BioMérieux (France). The enzymes present in the kit are listed in
Table IV.
Table IV – Enzymes present in the enzymatic kit used (API ZYM®, BioMérieux).
The activities of the enzymes were detected by colorimetric reaction and the intensity of
the signal was graded in a scale from 0, meaning no enzymatic activity, to 5 representing
Number Enzyme Number Enzyme
1 Blank 11 Acid phosphatase
2 Alkaline phosphatase 12 Naftol-AS-BI.phosphohydrolase
3 Esterase (C 4) 13 α-galactosidase
4 Esterase Lipase (C 8) 14 β-galactosidase
5 Lipase (C 14) 15 β-glucoronidase
6 Leucine arylamidase 16 α-glucosidase
7 Valine arylamidase 17 β-glucosidase
8 Cystine arylamidase 18 N-acetyl-β-glucosaminidase
9 Trypsin 19 α-manosidase
10 α-quimotrypsin 20 α-fucosidase
Figure 3.16 – Percentage of apolar lipids, glycolipids and phospholipids in
planktonic, biofilm and supernatant cells when grown on ethanol or hexadecane
as carbon source at the end of reactor operation (94.1 h)

Chapter 3 Results and Discussion
66 | P a g e
a high enzymatic activity, as suggested by BioMérieux. Regarding cells grown on
ethanol, the enzymatic activity was higher, in all cases, in supernatant cells when
compared to those in biofilm. Besides, cells from the supernatant presented activity on
five different enzymes (Alkaline phosphatase, Valine arylamidase, Trypsin, β-
galactosidase, α-glucosidase) that were not detected in biofilm cells.
On other hand, cells grown on hexadecane in the biofilm reactor presented an enzymatic
activity was much higher in comparison to those grown on ethanol (Figure 3.17).
Besides, the enzymatic activities in biofilm and supernatant cells were similar, with cells
from the supernatant presenting higher or equal activity to those from the biofilm
(exception observed for the enzyme esterase). The higher enzymatic activity in
supernatant cells was expected because, as mentioned before, the deposition of a thick
layer of cells on the top of the reactor may facilitate the access to oxygen of cells in the
supernatant while difficulting the access to oxygen by the cells attached to the glass.
Both the lipid fractioning results and the enzymatic activities test suggest that cells on
the supernatant were more active, probably because of the availability of oxygen. In the
case of the biofilm cells the access to oxygen could be limited due to a poor superficial
mass transfer, although the system was magnetically stirred.
Comparing the results obtained for cells grown on ethanol and hexadecane, it is possible
to observe that the metabolism of hexadecane should be more complex than the uptake
of ethanol, forcing the cells to produce more and different enzymes (Figure 3.17).
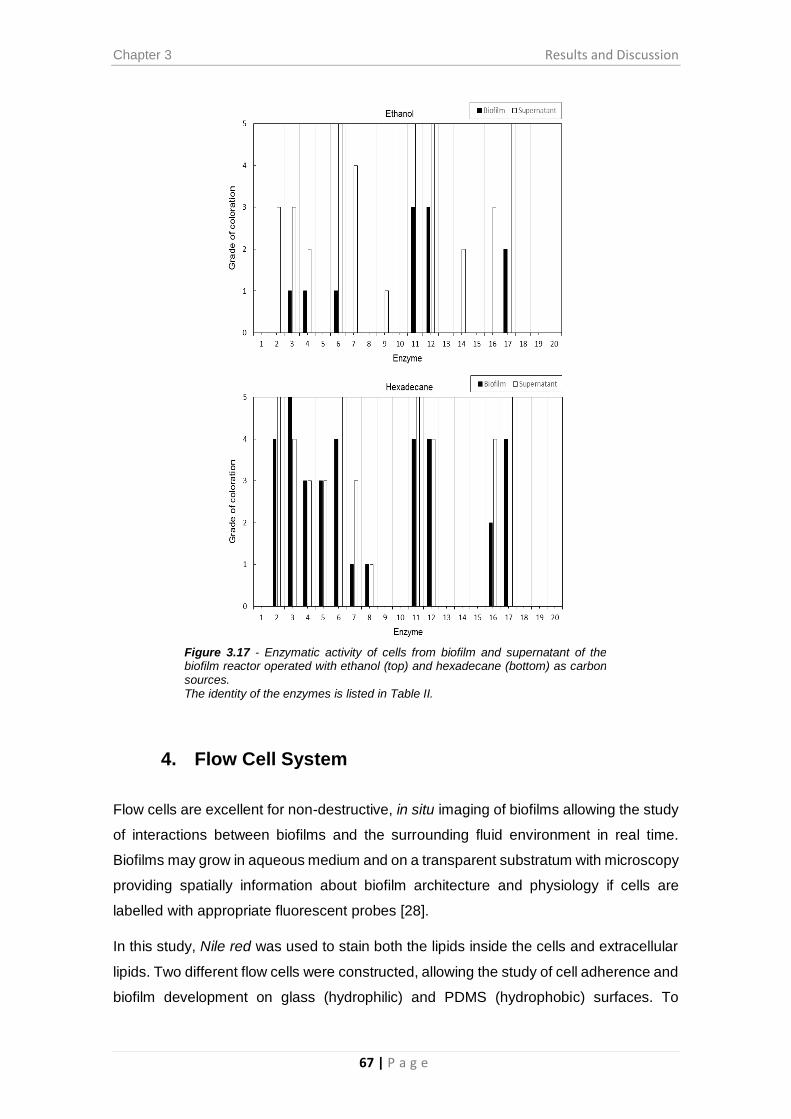
Chapter 3 Results and Discussion
67 | P a g e
4. Flow Cell System
Flow cells are excellent for non-destructive, in situ imaging of biofilms allowing the study
of interactions between biofilms and the surrounding fluid environment in real time.
Biofilms may grow in aqueous medium and on a transparent substratum with microscopy
providing spatially information about biofilm architecture and physiology if cells are
labelled with appropriate fluorescent probes [28].
In this study, Nile red was used to stain both the lipids inside the cells and extracellular
lipids. Two different flow cells were constructed, allowing the study of cell adherence and
biofilm development on glass (hydrophilic) and PDMS (hydrophobic) surfaces. To
Figure 3.17 - Enzymatic activity of cells from biofilm and supernatant of the biofilm reactor operated with ethanol (top) and hexadecane (bottom) as carbon sources. The identity of the enzymes is listed in Table II.

Chapter 3 Results and Discussion
68 | P a g e
promote the production of different lipids in the cells, ethanol and hexadecane were used
as carbon sources. During the system operation, images were captured at certain time
periods to compare the architecture of biofilm that was being formed and the positioning
of both cells and extracellular lipids. At the end of the experiment, the flow cell was
disconnected from the system and was washed several times with 1 mL of distilled water,
each mL being collected into a separate fraction that was used for FAMES analysis and
zeta potential measurements. The fraction “1” represented in Figure 3.18 corresponds
to the first fraction of cells that were washed out of the flow cell with the first mL used to
clean the micro-reactor whilst fractions “3” and “4” were the last cells to be washed out.
Cells adhesion to the surface of the cells in “1” should therefore be less strong than those
in fraction “4”.
When ethanol was used as carbon source, the cells were mainly composed of SSFAs
and MUFAs (Figure 3.18). In the fractions recovered from the flow cell, the bacterial cells
also presented 10MBFAs. The degree of saturation of the cells increased with the
number of fractions recovered. Since the first fraction contained the cells less attached
to the flow cell and the last fraction recovered contained the cells more strongly attached
the surface, this means that a membrane containing more SSFA (more saturated) should
help the adhesion of the cells.
Concomitantly to the increase of the degree of saturation and the percentage of SSFA
in the membrane phospholipids of the cells, the surface charge of the cells attached also
Figure 3.18 – Lipid composition of membrane cells removed from the Flow Cell operating system. Left: PDMS/Glass flow cell after 17.7 h of operation. Right: PDMS/PDMS flow cells after 5.8 h of
operation. At the second axis is presented the degree of saturation (Dsat) of the cell membrane.
SSFAs –saturated straight chain fatty acids, MUFAs – monounsaturated fatty acids, BCFAs –
branched-chain fatty acids, SCBFAs – saturated cyclopropyl-branched fatty acids, 10MBFAs –
10-methyl branched fatty acids, DMAFAs – dimethylacetal fatty acids, PUFAs – polyunsaturated
fatty acids, HSFA – hydroxyl-substituted fatty acids.

Chapter 3 Results and Discussion
69 | P a g e
increased with the order of flushing from the flow cell. So, the cells attached more
strongly to the surface (flushed in the last fraction) were less negative than the cells less
attached (Figure 3.19). In both PDMS-PDMS and PDMS-Glass flow cells, an increase of
the surface charge of the cells could be observed, although the increase in the cells from
the PDMS-PDMS flow cell was more abrupt when compared with that of PDMS-Glass
flow cell. Moreover, the net values presented by the cells were less negative than that of
cells attached to the PDMS-Glass flow cell.
As mentioned previously, net surface charge presented in Figure 3.19 is the average of
the population, but in reality the samples recovered can present distinct subpopulations
of cells. In the PDMS-Glass flow reactor, the majority of cells in the recirculating culture
presented a surface charge of -37 mV, although 10% of the population had a charge of
-9,09 mV (Figure 3.20). The cells from the first and second fractions flushed from the
flow cell presented a more negatively surface charge, corresponding apparently to the
most negatively charge subpopulation of the recirculating culture. Clearly, two
populations were observed in the 3rd and 4th fractions. The 3rd fraction presented a
subpopulation with -8.74 mV (43.9%) and the last fraction presented a subpopulation
with a surface charge of -3.72 (55%). Apparently these cells are related to the 10% of
the recirculating culture presenting less negative charge. The results thus suggest that
an increase in the surface charge of the cells and in the degree of saturation (and
consequently of the SSFAs) leads to more strongly adherent cells. The substratum
characteristics of PDMS-Glass (hydrophilic) versus PDMS-PDMS (hydrophobic) may
have influenced the difference on charge surface observed between the cells from the
two flow cells.
Figure 3.19 – Net Surface charge of planktonic cells at culture flask and biofilm attached in the two types of flow cells with 0.25 % v/v of ethanol as carbon source.

Chapter 3 Results and Discussion
70 | P a g e
With the PDMS-PDMS Flow cell (hydrophobic) an increase in the surface charge of the
cells was also observed as in the PDMS-Glass micro-reactor. As expected, the cells in
the recirculating culture presented a similar surface charge (-38.6 mV; Figure 3.21) when
compared to those in the PDMS-Glass flow cell (-37 mV; Figure 3.20). Nevertheless, in
this case a decrease of the cell charge in the first fraction flushed from the flow cell, as
observed in the PDMS-Glass flow cell (Figure 3.19), was not observed (Figure 3.21).
The first fraction of cells flushed from the PDMS-PDMS flow cell presented a surface
charge (-36.6 mV) similar to cells in culture (-38.6 mV). The second fraction clearly
presented two distinct subpopulations of cells: the major part (58.9%) having a surface
charge of -22.7 mV and a second population (41.1 %) a positive charge of 2.46 mV
(Figure 3.21). In the last fraction flushed, most of the cells (97.1%) presented a surface
charge of -8.90 mV. This subpopulation appears between the two populations of the
second fraction and seems to be an “intermediate” subpopulation in relation to the other
two subpopulations flushed in the second fraction.
Culture - 1
Culture - 2 Fraction - 1 Fraction - 2
Fraction - 3 Fraction - 4
Figure 3.20 - Zeta potential distribution of biofilm cells on the PDMS-Glass flow cell with ethanol as carbon source (0.25% v/v). “Culture” represents the planktonic cells at the culture flask and replicates are indicated with numbers one and two.

Chapter 3 Results and Discussion
71 | P a g e
The PDMS is a hydrophobic surface (contact angle of 109° [29]) and Glass is a
hydrophilic surface (contact angle of 38.6º). Comparing the last fraction of R. erythropolis
cells recovered from each flow cell (Figure 3.22) it is possible to observe that cells from
the PDMS-Glass flow cell presented two distinguished subpopulation with surface
charges of -35.3 mV (45%) and -1.73 mV (55%). This suggests that different surface
materials on the flow cell may influenced the surface charge of the cells, resulting in
different subpopulations. The PDMS-PDMS flow cell presented mainly a population with
a zeta potential of -8.47 mV (97.1%), indicating that the subpopulation presenting the
highest negative surface charge in the PDMS-Glass flow cell may be adhered to the
glass. However, further studies will be necessary to elucidate these results.
Fraction - 1 Fraction - 2
Fraction - 3
Culture - 1
Culture - 2
Figure 3.21 – Zeta potential distribution of biofilm cells from the PDMS-PDMS flow cell with ethanol as carbon source (0.25% v/v). “Culture” represents the planktonic cells in the culture flask and replicates are indicated with numbers one and two.
Fraction – 3 PDMS-PDMS
Fraction – 4 PDMS-Glass
Figure 3.22 – Comparison of the zeta potential distribution of the cells from fraction 3 from the PDMS-PDMS flow cell and fraction 4 from the PDMS-Glass flow cell, with ethanol as carbon source (0.25% v/v).
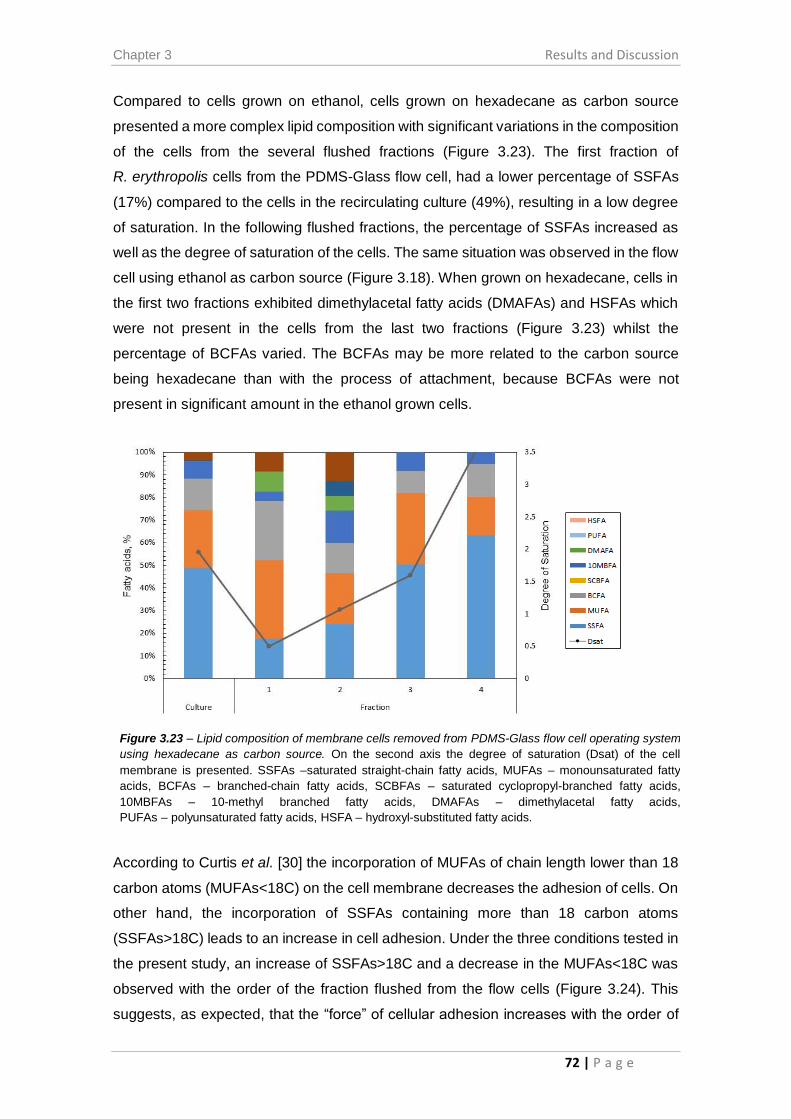
Chapter 3 Results and Discussion
72 | P a g e
Compared to cells grown on ethanol, cells grown on hexadecane as carbon source
presented a more complex lipid composition with significant variations in the composition
of the cells from the several flushed fractions (Figure 3.23). The first fraction of
R. erythropolis cells from the PDMS-Glass flow cell, had a lower percentage of SSFAs
(17%) compared to the cells in the recirculating culture (49%), resulting in a low degree
of saturation. In the following flushed fractions, the percentage of SSFAs increased as
well as the degree of saturation of the cells. The same situation was observed in the flow
cell using ethanol as carbon source (Figure 3.18). When grown on hexadecane, cells in
the first two fractions exhibited dimethylacetal fatty acids (DMAFAs) and HSFAs which
were not present in the cells from the last two fractions (Figure 3.23) whilst the
percentage of BCFAs varied. The BCFAs may be more related to the carbon source
being hexadecane than with the process of attachment, because BCFAs were not
present in significant amount in the ethanol grown cells.
According to Curtis et al. [30] the incorporation of MUFAs of chain length lower than 18
carbon atoms (MUFAs<18C) on the cell membrane decreases the adhesion of cells. On
other hand, the incorporation of SSFAs containing more than 18 carbon atoms
(SSFAs>18C) leads to an increase in cell adhesion. Under the three conditions tested in
the present study, an increase of SSFAs>18C and a decrease in the MUFAs<18C was
observed with the order of the fraction flushed from the flow cells (Figure 3.24). This
suggests, as expected, that the “force” of cellular adhesion increases with the order of
Figure 3.23 – Lipid composition of membrane cells removed from PDMS-Glass flow cell operating system
using hexadecane as carbon source. On the second axis the degree of saturation (Dsat) of the cell
membrane is presented. SSFAs –saturated straight-chain fatty acids, MUFAs – monounsaturated fatty
acids, BCFAs – branched-chain fatty acids, SCBFAs – saturated cyclopropyl-branched fatty acids,
10MBFAs – 10-methyl branched fatty acids, DMAFAs – dimethylacetal fatty acids,
PUFAs – polyunsaturated fatty acids, HSFA – hydroxyl-substituted fatty acids.

Chapter 3 Results and Discussion
73 | P a g e
the fraction recovered. In other words, since the cells recovered from the last fraction
had a larger percentage of SSFAs>18C and a lower percentage of MUFAs<18C, these
cells should present an increasing adhesion to surfaces when compared to cells
recovered from the first fraction. This is in agreement with the logical assumption that
cells recovered from the last fraction required more “force” to be washed out from the
flow cell. Moreover, cells grown on hexadecane presented a percentage of SSFAs higher
than the cells grown on ethanol, suggesting that cells in this carbon source are more
strongly adherent to the flow cell surface.
Cell surface properties, including the surface charge, are important for cell adhesion.
Curtis et al. [31] studied the association of adhesion and cell surface charge density and
suggested that low surface charge densities are associated with high adhesion and vice-
versa. Moreover, the incorporation of certain FAs may change the surface charge density
and consequently influence cell adhesion. Using the electrophoretic mobility
measurements of cells flushed from the flow cells using ethanol as carbon source, the
surface charge density was calculated using the equation described by Krisinky et al.
[32]. In both flow cells, the negative charges at the cell surface decreased per area with
the fraction recovered (Figure 3.25). The decrease in surface charge density verified in
PDMS-PDMS cells was lower than that observed in cells recovered from the PDMS-
Glass flow cell, which presented an abrupt decrease in surface charge density when
analysing the cells from fractions 1 to 2. These results thus suggest that a decrease in
cells surface charge density are correlated to high cell adhesion, which is in agreement
with Curtis et al. [31], as previously hypothesised.
Figure 3.24 – Fatty acid composition of the cells flushed from the flow cell systems.
SSFAs >18C, Saturated straight-chain fatty acids with more than 18 carbon atoms. MUFAs
<18C, monounsaturated fatty acids with less than 18 carbon atoms.

Chapter 3 Results and Discussion
74 | P a g e
To assess the percentage of cells that were weakly or strongly attached to the surface
of the flow cells, the percentage of cells recovered after each flushed fraction was
calculated (Figure 3.26). When the cells were using ethanol as carbon source, the large
majority (at least 75%) of the cells were recovered in the first fraction. However, in the
system with hexadecane as carbon source, only 37.7% of cells were recovered in first
fraction and 43.7% in the second fraction. The cells removed in the last fractions
represented a small percentage of the total adherent biomass. The results thus indicate
that, in a PDMS-Glass flow cell, the adhesion of R. erythropolis cells to the surfaces is
stronger when using hexadecane as carbon source than when the cells are using
ethanol. These results thus confirm what had been suggested by FAMEs and zeta
potential analysis. Besides, the method of studying the percentage of cell in fractions
obtained from flushing liquid through the flow cells, is sufficiently accurate as
demonstrate by analysing the influence of time. The PDMS-PDMS flow cells were
operated for only 5.75 h and, since the cells had not enough time to adhere to the
surfaces and to form a proper biofilm, only three fractions containing cells were
recovered and nearly 90% of the cells were recovered in the first fraction..
Figure 3.25 – Surface charge density (δ) of cells flushed from the two flow cells
(fractions 1 to 4) and culture (0) when grown on ethanol as carbon source.

Chapter 3 Results and Discussion
75 | P a g e
The architecture of the biofilm formed in the flow cell systems was accessed by
microscopy images acquired during the time of operation (Figure 3.27). The biofilms
formed by cells grown on ethanol presented similar structure, with the cells embedded
in a cloud type of exopolymeric lipids, regardless of the flow cell materials. On the other
hand, the biofilm grown on hexadecane presented a distinct architecture from the
biofilms grown on ethanol. Besides, during the operation of the flow cells on the two
carbon sources differences were also noted in the biofilm behaviour. Biofilms grown
during ethanol consumption were characterized by the agglomeration of cells in a
structure like a “cloud” and by some movement inside the flow cell (data not shown).
Contrarily, the biofilm developed in the hexadecane-containing flow cell was nearly
“filamentous” like, and both cells and exopolymeric lipids adhered immediately at the
entrance of the flow cell chamber. The attachment during a short period of time (1h) was
noticeable as shown in the supplementary Figure S5 of chapter 5. In the flow cell systems
tested, the deposition and attachment of cells occurred first at the entrance of the flow
cell chamber and propagated from there to the rest of the chamber, probably as a result
of a rapid decrease in pressure observed between the channel and chamber of the flow
cell.
From the microscope observations it was perceptible that cells grown in hexadecane
were “stickier” and more prone to adhesion and attachment than ethanol grown cells.
These observations are in agreement with the analyses discussed before, e.g. regarding
Figure 3.26 – Influence of carbon source, flow cell material and operation time on the percentage of cells recovered after each flow cell flushing.
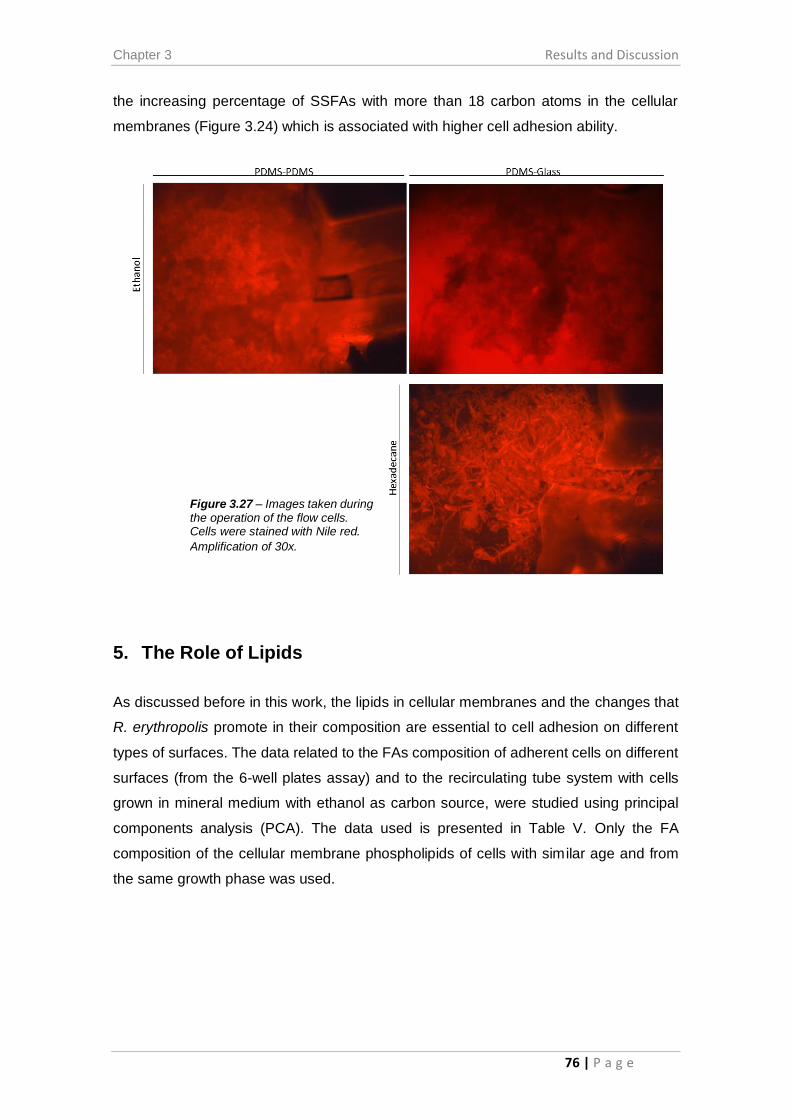
Chapter 3 Results and Discussion
76 | P a g e
the increasing percentage of SSFAs with more than 18 carbon atoms in the cellular
membranes (Figure 3.24) which is associated with higher cell adhesion ability.
5. The Role of Lipids
As discussed before in this work, the lipids in cellular membranes and the changes that
R. erythropolis promote in their composition are essential to cell adhesion on different
types of surfaces. The data related to the FAs composition of adherent cells on different
surfaces (from the 6-well plates assay) and to the recirculating tube system with cells
grown in mineral medium with ethanol as carbon source, were studied using principal
components analysis (PCA). The data used is presented in Table V. Only the FA
composition of the cellular membrane phospholipids of cells with similar age and from
the same growth phase was used.
Figure 3.27 – Images taken during the operation of the flow cells. Cells were stained with Nile red.
Amplification of 30x.

Chapter 3 Results and Discussion
77 | P a g e
Table V – Fatty acid composition of adhered cells in different surfaces used for the PCA.
Surface Fatty Acids (%)
Straight MUFA 10-methyl Branched PUFA
Polystyrene (PS) 41.60 41.31 17.10 0.00 0.00
Al 37.80 44.97 17.23 0.00 0.00
Fe 36.16 47.89 15.95 0.00 0.00
Zn 38.16 40.40 21.44 0.00 0.00
Cu 38.59 44.83 16.58 0.00 0.00
Pb 40.31 39.69 20.00 0.00 0.00
Butyl rubber 45.77 34.50 18.21 0.35 1.16
Politetrafluoretileno (PTFE) 45.29 36.07 17.85 0.00 0.80
Polyethylene (PE) 45.02 35.18 18.98 0.14 0.69
Polyethylene terephthalate (PET) 44.88 34.41 19.44 0.49 0.78
Glass 43.08 33.91 21.42 0.13 1.46
Glass mosaic 39.68 45.30 14.75 0.00 0.27
Gas tubing 51.10 31.05 1.70 7.93 4.73
Marprene 30.45 37.24 8.30 8.23 12.69
Soft silicone 29.24 27.64 3.91 23.49 6.55
Silicone 27.30 25.50 3.03 17.72 11.40
Teflon 39.93 41.23 11.43 4.61 0.49
According to PCA, 87.2% of the variability of the data are explained by 2 components
(PCA 1 and PCA 2). By scoring the experimental data on a plot having PC1 and PC2 as
axes, it’s possible to observe the clustering of the data according to the FA composition
and hydrophobicity character of the material (Figure 3.28). The data is separated along
PC1 by the composition in FA: the main group of materials clustered at the right-side
(Figure 28 – A) is separated from the left side by their composition in SSFAs (straight),
10MBFAs (10-methyl) and MUFA (Figure 3.28 – B). In this group, the metallic surfaces
(Al, Fe, Cu, Zn and Pb) are very close to each other, being separated from some plastics
(PET,PE), PTFE, glass and butyl rubber by the degree of saturation (i.e. percentage of
monounsaturated and saturated straight fatty acids along PC2). Similarly the non-
metallic surfaces silicone, soft silicone and marprene were separated from the other non-
metallic surfaces by the percentage of saturated FA. According to this analysis, the gas
tubing was the surface where cells presented a response that was most different from
all others.

Chapter 3 Results and Discussion
78 | P a g e
The relation between the FA composition of the cellular membrane phospholipids and
the volume of biofilm of the cells formed on different surfaces was analysed by partial
least squares (PLS). The statistical method tries to find the multidimensional direction in
the FA composition that explains the maximum multidimensional variance in the biofilm
data. The percentages of each FA type were therefore used as predictors (Table V),
whilst the response was the biofilm volume (which was normalised to vary between 0
and 1; Table VI).
Figure 3.28 –Principal component analysis using the fatty acid composition of cells forming biofilms on different surfaces. A - Score plot with data represented as function
of the surface to which the cells adhered; B – Loading plot.
A
B

Chapter 3 Results and Discussion
79 | P a g e
Table VI – Normalized volume of the biofilm formed on each surface, used as response vector for the PLS analysis.
Surface Biofilm, normalized (0-1)
Polystyrene (PS) 0.736
Al 0.435
Fe 0.165
Zn 1.000
Cu 0.201
Pb 0.378
Butyl rubber 0.071
Politetrafluoretileno (PTFE) 0.434
Polyethylene (PE) 0.240
Polyethylene terephthalate (PET) 0.157
Glass 0.562
Glass mosaic 0.036
Gas tubing 0.000
Marprene 0.004
Soft silicone 0.014
Silicone 0.012
Teflon 0.002
The results of the PLS analysis indicated that 2 components can predict 83.6% of the
variance of data regarding the FA composition of the phospholipids of cells during
adhesion to different surfaces and the amount of biofilm formed. According to the PLS
coefficients, the 10MBFAs (10-methyl) are positively correlated with the formation of
biofilm (Figure 3.29 – A). This is in concordance to/confirms the results obtained in
section 1 (Figure 3.5). Comparing the PLS loading (Figure 3.20 - B) and score (Figure
3.29 –C) plots, it is possible to observe that the percentage of biofilm on MM increased
with increasing percentage of 10MBFAs in the phospholipids of the cells which adhered
to metallic and non-metallic surfaces clustered at the right side of Figure 3.29 – C.
Outside this cluster, the surfaces silicone, soft silicone and marprene are separated
because of the content in PUFAs and BCFAs (branched). Once again, the cells changed
the FA composition of the phospholipids during adhesion to the gas tubing in a different
way from to all other surfaces.
The amount of biofilm increased in the direction from glass mosaic to zinc surface,
because of the increase in the content of 10MBFAs (10-methyl) in the cellular membrane
of R. erythropolis. On other hand, the biofilm size decreased in the direction of silicone
to marprene.

Chapter 3 Results and Discussion
80 | P a g e
After analysing the relation between the FA composition of the phospholipids of R.
erythropolis adherent to different surfaces and the amount of biofilm produced, it was
possible to conclude that cells, grown in mineral medium and using ethanol as carbon
source, form and develop biofilms depending on the percentage of 10-methyl branched
fatty acids in the cellular membrane.
B
A
C
Figure 3.29 – PLS analysis of the relation between the FA composition of cellular phospholipids and the amount of biofilm formed. A - PLS coefficients, B - Loading
plot, C - Score plot with data
represented as function of the
surface to which the cells adhered.

Chapter 3 Results and Discussion
81 | P a g e
6. References
1. Russell NJ: Mechanisms of thermal adaptation in bacteria: blueprints for survival.
Trends in Biochemical Sciences 1984, 9(3):108-112.
2. Denich TJ, Beaudette LA, Lee H, Trevors JT: Effect of selected environmental and
physico-chemical factors on bacterial cytoplasmic membranes. Journal of
Microbiological Methods 2003, 52(2):149-182.
3. Alexander JW: History of the medical use of silver. Surgical infections 2009, 10(3):289-
292.
4. Lemire JA, Harrison JJ, Turner RJ: Antimicrobial activity of metals: mechanisms,
molecular targets and applications. Nat Rev Micro 2013, 11(6):371-384.
5. de Carvalho C, Parreno-Marchante B, Neumann G, da Fonseca MMR, Heipieper HJ:
Adaptation of Rhodococcus erythropolis DCL14 to growth on n-alkanes, alcohols
and terpenes. Applied Microbiology and Biotechnology 2005, 67(3):383-388.
6. Martin-Rodriguez A, Gonzalez-Orive A, Hernandez-Creus A, Morales A, Dorta-Guerra R,
Norte M, Martin V, Fernandez J: On the influence of the culture conditions in bacterial
antifouling bioassays and biofilm properties: Shewanella algae, a case study. BMC
Microbiology 2014, 14(1):102.
7. de Carvalho CCCR: Adaptation of Rhodococcus erythropolis cells for growth and
bioremediation under extreme conditions. Research in Microbiology 2012,
163(2):125-136.
8. Grass G, Rensing C, Solioz M: Metallic Copper as an Antimicrobial Surface. Applied
and Environmental Microbiology 2011, 77(5):1541-1547.
9. Warnes SL, Keevil CW: Mechanism of Copper Surface Toxicity in Vancomycin-
Resistant Enterococci following Wet or Dry Surface Contact. Applied and
Environmental Microbiology 2011, 77(17):6049-6059.
10. de Carvalho C, da Fonseca MMR: The remarkable Rhodococcus erythropolis.
Applied Microbiology and Biotechnology 2005, 67(6):715-726.
11. de Carvalho CCCR: Biofilms: recent developments on an old battle. Recent patents
on biotechnology 2007, 1(1):49-57.
12. de Carvalho CCCR: Biofilms: new ideas for an old problem. Recent patents on
biotechnology 2012, 6(1):13-22.
13. Yang L, Liu Y, Wu H, Song ZJ, Hoiby N, Molin S, Givskov M: Combating biofilms. FEMS
Immunol Med Microbiol 2012, 65(2):146-157.
14. Tomaras AP, Dorsey CW, Edelmann RE, Actis LA: Attachment to and biofilm
formation on abiotic surfaces by Acinetobacter baumannii: involvement of a novel
chaperone-usher pili assembly system. Microbiology 2003, 149(Pt 12):3473-3484.
15. Rainey PB, Rainey K: Evolution of cooperation and conflict in experimental bacterial
populations. Nature 2003, 425(6953):72-74.
16. Yuan Y, Lee TR: Contact Angle and Wetting Properties. In: Surface Science
Techniques. Edited by Bracco G, Holst B, vol. 51: Springer Berlin Heidelberg; 2013: 3-
34.
17. Simoes LC, Simoes M, Vieira MJ: Adhesion and biofilm formation on polystyrene by
drinking water-isolated bacteria. Antonie van Leeuwenhoek 2010, 98(3):317-329.
18. Vrolijk NH, Targett NM, Baier RE, Meyer AE: Surface characterisation of two
gorgonian coral species: Implications for a natural antifouling defence. Biofouling
1990, 2(1):39-54.
19. Wipret A: Measurement of Water Contract Angle on Ceramic Tiles Treated with
Silicone Emulsions. Dow Corning Corporation 2012.
20. de Carvalho C, de Fonseca MMR: Preventing biofilm formation: promoting cell
separation with terpenes. Fems Microbiology Ecology 2007, 61(3):406-413.

Chapter 3 Results and Discussion
82 | P a g e
21. Liao BQ, Allen DG, Droppo IG, Leppard GG, Liss SN: Surface properties of sludge and
their role in bioflocculation and settleability. Water Research 2001, 35(2):339-350.
22. Cronin UP, Wilkinson MG: Monitoring growth phase-related changes in
phosphatidylcholine-specific phospholipase C production, adhesion properties
and physiology of Bacillus cereus vegetative cells. Journal of industrial microbiology
& biotechnology 2008, 35(12):1695-1703.
23. Qian P-Y, Rittschof D, Sreedhar B: Macrofouling in unidirectional flow: miniature
pipes as experimental models for studying the interaction of flow and surface
characteristics on the attachment of barnacle, bryozoan and polychaete larvae.
Marine Ecology Progress Series 2000, 207:109-121.
24. de Carvalho CCCR, Wick LY, Heipieper HJ: Cell wall adaptations of planktonic and
biofilm Rhodococcus erythropolis cells to growth on C5 to C16 n-alkane
hydrocarbons. Applied Microbiology and Biotechnology 2009, 82(2):311-320.
25. Petrikov K, Delegan Y, Surin A, Ponamoreva O, Puntus I, Filonov A, Boronin A:
Glycolipids of Pseudomonas and Rhodococcus oil-degrading bacteria used in
bioremediation preparations: Formation and structure. Process Biochem 2013, 48(5-
6):931-935.
26. Abdel-Megeed A, Al-Rahma AN, Mostafa AA, Baser KHC: Biochemical
characterization of anti-microbial activity of glycolipids produced by Rhodococcus
erythropolis. In: Pak J Bot. vol. 43; 2011: 1323-1334.
27. Alvarez HM, Steinbuchel A: Triacylglycerols in prokaryotic microorganisms. Appl
Microbiol Biotechnol 2002, 60(4):367-376.
28. Tolker-Nielsen T, Sternberg C: Growing and Analyzing Biofilms in Flow Chambers.
In: Current Protocols in Microbiology. John Wiley & Sons, Inc.; 2005.
29. Mata A, Fleischman AJ, Roy S: Characterization of polydimethylsiloxane (PDMS)
properties for biomedical micro/nanosystems. Biomedical microdevices 2005,
7(4):281-293.
30. Curtis AS, Chandler C, Picton N: Cell surface lipids and adhesion. III. The effects on
cell adhesion of changes in plasmalemmal lipids. Journal of cell science 1975,
18(3):375-384.
31. Curtis A: Cell adhesion. Progress in Biophysics and molecular Biology 1973, 27:315-
384.
32. Krysiński P, Tien HY: Membrane electrochemistry. Prog Surf Sci 1986, 23:17-412.

Chapter 4 Conclusion and
Future Work
1. Conclusion ..................................................................................................................86
2. Future work ................................................................................................................87


Chapter 4 Conclusion and Future Work
86 | P a g e
1. Conclusion
The study of physicochemical properties of the surface and membrane composition of
R. erythropolis cells attached to surfaces with different properties led to some insights
on the cell adaptation mechanisms that determine the attachment of previously
planktonic cells and the identity of the lipids produced by the cells during the formation
of the biofilm.
In this study, it was possible to observe the changes in the fatty acid composition of the
cells after adhesion to different surfaces. The two media used also influenced the lipid
composition of R. erythropolis cells. These changes are in concordance to the
microscopic observations: the size of cell aggregates and biofilm development are
influenced by the surface material and the medium used. Using a recirculating biofilm
reactor it was observed that cells decreased their hydrophobicity with increasing contact
angles in hydrophilic surfaces, whilst in hydrophobic surfaces cells increased the
percentage of FAs with more than 16 carbons in their membrane with increasing contact
angle. Moreover, cells in early exponential phase had more capacity of adherence and
biofilm formation than cells in late exponential phase. But cell composition could be
influenced by adding limonene leading to less adhered cells. Nevertheless, the results
obtained suggest that no simple, linear correlation between the increase of contact angle
and the amount of adhered cells exists.
It was also observed that planktonic and biofilm cells increased the net surface charge
during the time of operation of a biofilm reactor. The cells grown on a short chain alkanol
(ethanol) presented surface charges lower than those grown on a long chain alkane
(hexadecane).
The construction of a flow cell system allowed the visualization of biofilm formation in situ
and in real time. The cells attached more strongly to the surface presented a net surface
charge less negative and a higher degree of saturation of the membrane phospholipids
compared to weakly adhered cells. Moreover, a larger percentage of saturated straight-
chain fatty acids with more than 18 carbon atoms and a lower percentage of
monounsaturated fatty acids with less than 18 carbon atoms in cell membranes of
R. erythropolis increased the “force” of cell adhesion to surfaces. Using statistic methods
was possible to conclude that R. erythropolis cells adherent to different surfaces, grown
in mineral medium and using ethanol as carbon source, formed and developed biofilms
depending on the percentage of 10-methyl branched fatty acids in the cellular
membrane.

Chapter 4 Conclusion and Future Work
87 | P a g e
The results obtained in the present work suggest that a very complex array of variables
have to be taken into consideration, such as, composition of the substratum, carbon
source and presence of toxic compounds to predict cell behaviour. The changes on
membrane cell influence the production, the composition and thus the physical properties
of the EPS and consequently, the formation of biofilms on solid surfaces. Such
achievements may contribute to the knowledge and advance of biofilm development
processes and lead to new biotechnological applications in the areas of bioremediation
and biocatalysis or, on the contrary, to biofilm eradication.
1. Future work
The present study demonstrates that lipids play an important role in several steps of
biofilm formation. Further studies are required for a better elucidation of the influence of
lipids in biofilm formation and bacterial adaptation. Also, the identification of new drug
targets such as the synthesis of specific lipids required for biofilm formation could be of
extremely importance to understand the biofilm development. Thus, the following
suggestions are presented:
- to study the influence of the composition of the cell wall (e.g. in mycolic acids) in cell
adhesion;
- to determine the identity of the lipids involved in the cell anchorage and biofilm matrix;
- to study the defence and adaptation mechanisms of bacterial cells to antimicrobial
compounds and extreme conditions (e.g. desiccation, osmotic shock, presence of
solvents) at the lipid level;
- to evaluate which changes in the lipid composition of the mature biofilm lead to the
release and dispersion of cells for the colonization of new surfaces.

Chapter 5 Supplementary
Information

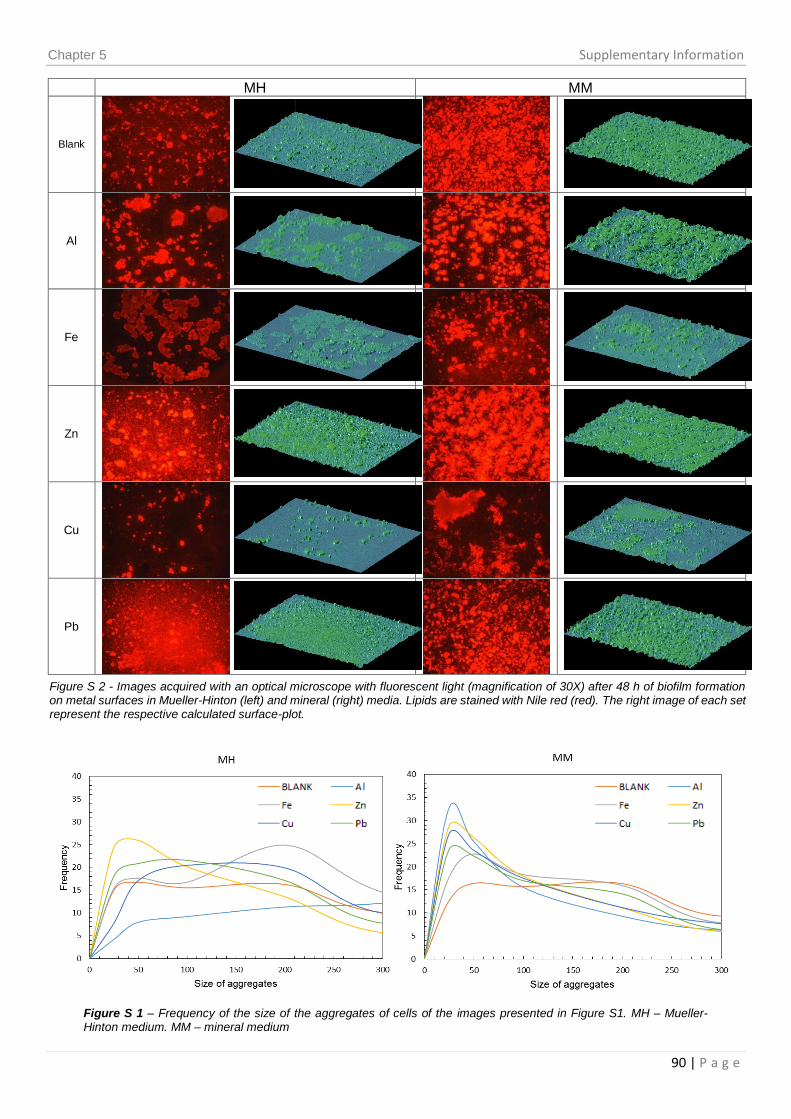
Chapter 5 Supplementary Information
90 | P a g e
Figure S 2 - Images acquired with an optical microscope with fluorescent light (magnification of 30X) after 48 h of biofilm formation on metal surfaces in Mueller-Hinton (left) and mineral (right) media. Lipids are stained with Nile red (red). The right image of each set represent the respective calculated surface-plot.
MH MM
Blank
Al
Fe
Zn
Cu
Pb
Figure S 1 – Frequency of the size of the aggregates of cells of the images presented in Figure S1. MH – Mueller-Hinton medium. MM – mineral medium

Chapter 5 Supplementary Information
91 | P a g e
MH MM
Blank
Butyl Ruber
Teflon
PE
PET
Glass
Glass Mosaic
Figure S 3 – images taken with an optical microscope with fluorescent light (magnification of 30X) during biofilm formation in non-metal surfaces in Mueller-Hinton (left) and mineral (right) media. Lipids are stained with Nile red (red). Right image of each set represent the respective calculated surface-plot.
Figure S 4 – Frequency of the size of the aggregates of cells of the images presented in Figure S3. MH – Mueller-Hinton medium. MM –
mineral medium Mueller

Chapter 5 Supplementary Information
92 | P a g e
A
D
B
E
C
F
Figure S 5 – Images taken during operation of PDMS-Glass flow cell when hexadecane was used as carbon source at 0.25% v/v. Images order by time of acquisition from A to F with a lapsed time of 1 hour. Cells were stained with Nile red. Amplification of 30x.