THE IMPORTANCE OF FFT AND BCS SPECTRUMS ANALYSIS FOR ...
10
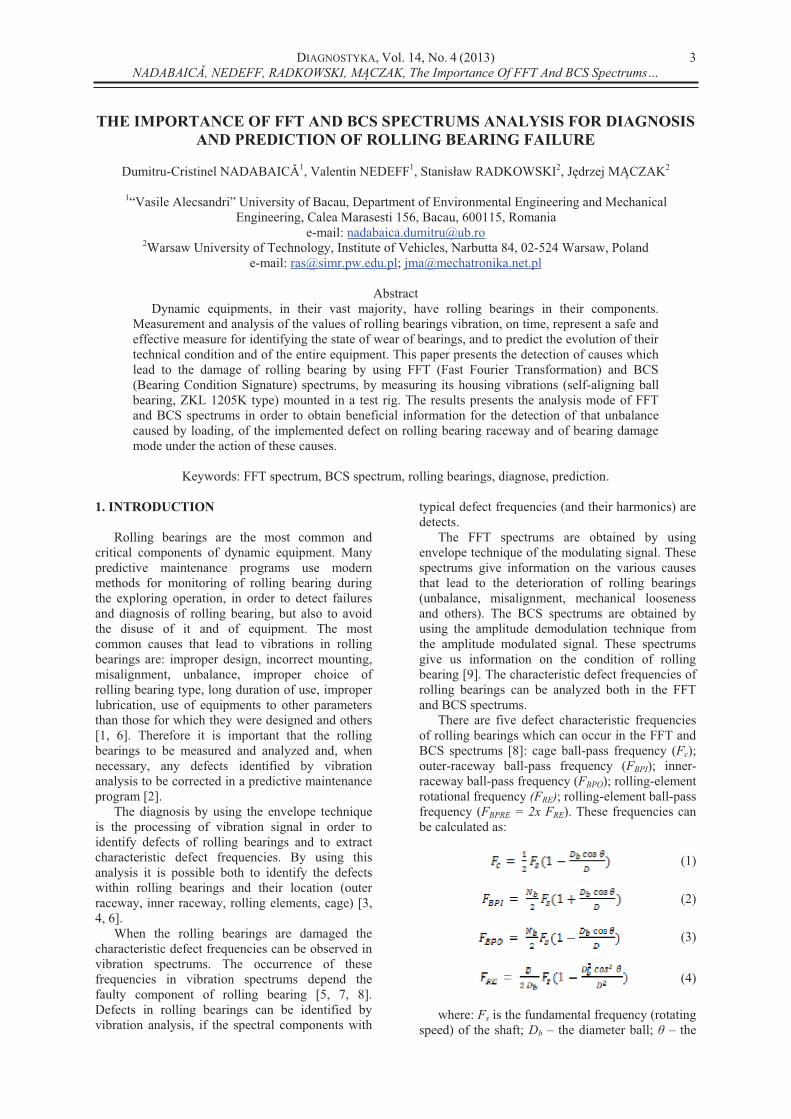
DIAGNOSTYKA, Vol. 14, No. 4 (2013) FT And BCS 3 THE IMPORTANCE OF FFT AND BCS SPECTRUMS ANALYSIS FOR DIAGNOSIS AND PREDICTION OF ROLLING BEARING FAILURE Dumitru- 1 , Valentin NEDEFF 1 , Stanis aw RADKOWSKI 2 , J drzej M CZAK 2 1 Department of Environmental Engineering and Mechanical Engineering, Calea Marasesti 156, Bacau, 600115, Romania e-mail: [email protected] 2 Warsaw University of Technology, Institute of Vehicles, Narbutta 84, 02-524 Warsaw, Poland e-mail: [email protected]; [email protected] Abstract Dynamic equipments, in their vast majority, have rolling bearings in their components. Measurement and analysis of the values of rolling bearings vibration, on time, represent a safe and effective measure for identifying the state of wear of bearings, and to predict the evolution of their technical condition and of the entire equipment. This paper presents the detection of causes which lead to the damage of rolling bearing by using FFT (Fast Fourier Transformation) and BCS (Bearing Condition Signature) spectrums, by measuring its housing vibrations (self-aligning ball bearing, ZKL 1205K type) mounted in a test rig. The results presents the analysis mode of FFT and BCS spectrums in order to obtain beneficial information for the detection of that unbalance caused by loading, of the implemented defect on rolling bearing raceway and of bearing damage mode under the action of these causes. Keywords: FFT spectrum, BCS spectrum, rolling bearings, diagnose, prediction. 1. INTRODUCTION Rolling bearings are the most common and critical components of dynamic equipment. Many predictive maintenance programs use modern methods for monitoring of rolling bearing during the exploring operation, in order to detect failures and diagnosis of rolling bearing, but also to avoid the disuse of it and of equipment. The most common causes that lead to vibrations in rolling bearings are: improper design, incorrect mounting, misalignment, unbalance, improper choice of rolling bearing type, long duration of use, improper lubrication, use of equipments to other parameters than those for which they were designed and others [1, 6]. Therefore it is important that the rolling bearings to be measured and analyzed and, when necessary, any defects identified by vibration analysis to be corrected in a predictive maintenance program [2]. The diagnosis by using the envelope technique is the processing of vibration signal in order to identify defects of rolling bearings and to extract characteristic defect frequencies. By using this analysis it is possible both to identify the defects within rolling bearings and their location (outer raceway, inner raceway, rolling elements, cage) [3, 4, 6]. When the rolling bearings are damaged the characteristic defect frequencies can be observed in vibration spectrums. The occurrence of these frequencies in vibration spectrums depend the faulty component of rolling bearing [5, 7, 8]. Defects in rolling bearings can be identified by vibration analysis, if the spectral components with typical defect frequencies (and their harmonics) are detects. The FFT spectrums are obtained by using envelope technique of the modulating signal. These spectrums give information on the various causes that lead to the deterioration of rolling bearings (unbalance, misalignment, mechanical looseness and others). The BCS spectrums are obtained by using the amplitude demodulation technique from the amplitude modulated signal. These spectrums give us information on the condition of rolling bearing [9]. The characteristic defect frequencies of rolling bearings can be analyzed both in the FFT and BCS spectrums. There are five defect characteristic frequencies of rolling bearings which can occur in the FFT and BCS spectrums [8]: cage ball-pass frequency (F c ); outer-raceway ball-pass frequency (F BPI ); inner- raceway ball-pass frequency (F BPO ); rolling-element rotational frequency (F RE ); rolling-element ball-pass frequency (F BPRE = 2x F RE ). These frequencies can be calculated as: (1) (2) (3) (4) where: F s is the fundamental frequency (rotating speed) of the shaft; D b the diameter ball; the
Transcript of THE IMPORTANCE OF FFT AND BCS SPECTRUMS ANALYSIS FOR ...
DIAGNOSTYKA, Vol. 14, No. 4 (2013)
FT And BCS
3
THE IMPORTANCE OF FFT AND BCS SPECTRUMS ANALYSIS FOR DIAGNOSIS
AND PREDICTION OF ROLLING BEARING FAILURE
Dumitru- 1, Valentin NEDEFF1, Stanis aw RADKOWSKI2, J drzej M CZAK2
1 Department of Environmental Engineering and Mechanical
Engineering, Calea Marasesti 156, Bacau, 600115, Romania
e-mail: [email protected] 2Warsaw University of Technology, Institute of Vehicles, Narbutta 84, 02-524 Warsaw, Poland
e-mail: [email protected]; [email protected]
Abstract
Dynamic equipments, in their vast majority, have rolling bearings in their components.
Measurement and analysis of the values of rolling bearings vibration, on time, represent a safe and
effective measure for identifying the state of wear of bearings, and to predict the evolution of their
technical condition and of the entire equipment. This paper presents the detection of causes which
lead to the damage of rolling bearing by using FFT (Fast Fourier Transformation) and BCS
(Bearing Condition Signature) spectrums, by measuring its housing vibrations (self-aligning ball
bearing, ZKL 1205K type) mounted in a test rig. The results presents the analysis mode of FFT
and BCS spectrums in order to obtain beneficial information for the detection of that unbalance
caused by loading, of the implemented defect on rolling bearing raceway and of bearing damage
mode under the action of these causes.
Keywords: FFT spectrum, BCS spectrum, rolling bearings, diagnose, prediction.
1. INTRODUCTION
Rolling bearings are the most common and
critical components of dynamic equipment. Many
predictive maintenance programs use modern
methods for monitoring of rolling bearing during
the exploring operation, in order to detect failures
and diagnosis of rolling bearing, but also to avoid
the disuse of it and of equipment. The most
common causes that lead to vibrations in rolling
bearings are: improper design, incorrect mounting,
misalignment, unbalance, improper choice of
rolling bearing type, long duration of use, improper
lubrication, use of equipments to other parameters
than those for which they were designed and others
[1, 6]. Therefore it is important that the rolling
bearings to be measured and analyzed and, when
necessary, any defects identified by vibration
analysis to be corrected in a predictive maintenance
program [2].
The diagnosis by using the envelope technique
is the processing of vibration signal in order to
identify defects of rolling bearings and to extract
characteristic defect frequencies. By using this
analysis it is possible both to identify the defects
within rolling bearings and their location (outer
raceway, inner raceway, rolling elements, cage) [3,
4, 6].
When the rolling bearings are damaged the
characteristic defect frequencies can be observed in
vibration spectrums. The occurrence of these
frequencies in vibration spectrums depend the
faulty component of rolling bearing [5, 7, 8].
Defects in rolling bearings can be identified by
vibration analysis, if the spectral components with
typical defect frequencies (and their harmonics) are
detects.
The FFT spectrums are obtained by using
envelope technique of the modulating signal. These
spectrums give information on the various causes
that lead to the deterioration of rolling bearings
(unbalance, misalignment, mechanical looseness
and others). The BCS spectrums are obtained by
using the amplitude demodulation technique from
the amplitude modulated signal. These spectrums
give us information on the condition of rolling
bearing [9]. The characteristic defect frequencies of
rolling bearings can be analyzed both in the FFT
and BCS spectrums.
There are five defect characteristic frequencies
of rolling bearings which can occur in the FFT and
BCS spectrums [8]: cage ball-pass frequency (Fc);
outer-raceway ball-pass frequency (FBPI); inner-
raceway ball-pass frequency (FBPO); rolling-element
rotational frequency (FRE); rolling-element ball-pass
frequency (FBPRE = 2x FRE). These frequencies can
be calculated as:
(1)
(2)
(3)
(4)
where: Fs is the fundamental frequency (rotating
speed) of the shaft; Db the diameter ball; the

DIAGNOSTYKA, Vol. 14, No. 4 (2013)
FT And BCS
4
contact angle; D the pitch diameter of the rolling
bearing; Nb the number of balls.
2. EXPERIMENTAL RESEARCH
2.1. Test rig description
This experimental research has proposed the
analysis of FFT and BCS spectrums in order to
diagnose and predict failure of rolling bearings.
Thus, the test rig consisted of a base on which the
electric motor-gearbox-coupling-shaft assembly
was mounted, as can be seen in Fig. 1. The electric
motor has a power of 0.25 kW and a rotating speed
of 2760 rpm. Since the gearbox ratio is 2.8 the shaft
speed used is 1000 rpm. The shaft is supported by
two rolling bearings, ZKL 1205K type. These are
self-aligning ball bearing with tapered bore (taper
1:12) which are mounted on the shaft by means of
adapter sleeves. The measurements were performed
in the horizontal, vertical and axial directions of the
rolling bearing housing from left side of the test rig.
Fig. 1. Test rig
2.2. Vibration measuring devices
The acquisition of vibration measurements was
performed by using a piezoelectric accelerometer
(Fig. 2a) connected to the VIBROTEST 60 device
(Fig. 2b) from Bruel & Kjaer Vibro. Measurements
were recorded in the PC-card of VIBROTEST 60
device (Fig. 2c), then transferred for their analysis
in the XMS software (extended monitoring
software). The frequency range of the sensor is
between 4 Hz and 10 kHz, and the resonance
frequency is 35 kHz.
was implemented on the outer raceway of the
rolling bearing (Fig. 3), with its size given in Table
1. The rolling bearing worked under three loadings:
14 N, 24 N and 42 N (three steel discs of 1.4 kg
each). The rolling bearing worked for 10 hours
under each loading. The first measurement was
acquired at the beginning of the experiment then
another 5 measurements at intervals of two hours.
Before each operation, between the second and
third loading, the bearing was cleaned by using
petrol and then it was re-lubricated. The vibration
signals were collected in the frequency domain in
order to analyze: overall vibration trend, overall
BCU (Bearing Condition Unit) trend, FFT and BCS
spectrum. The appearance and evolution mode of
their harmonics and the side bands of these
frequencies and harmonics were analyzed in FFT
and BCS spectrums.
a. b. c.
Fig. 2. Acquisition system of vibration from Bruel
& Kjaer Vibro: a. accelerometer, AS-065 type; b.
VIBROTEST 60 device; c. PC-card
a. b.
Fig. 3. Self-aligning ball bearing with tapered bore,
ZKL 1205K type: a. - technical drawing; b. - photo
with location of the artificial defect on rolling
bearing outer raceway
The geometrical characteristics of this type of
bearing are shown in Table 2.
Table 1. Sizes of the artificial defect on rolling
bearing outer raceway
Defect
cod
Length
[mm]
Width
[mm]
Depth
[mm]
D1E 7 0.5 0.1
Table 2. Sizes of self-aligning ball bearing with
tapered bore, ZKL 1205K type
Sizes Values
De - outer diameter 52 mm
d - inner diameter 25 mm
B - thickness 15 mm
Db - ball diameter 7.2 mm
Nb - number of balls 24 balls

DIAGNOSTYKA, Vol. 14, No. 4 (2013)
FT And BCS
5
The FFT spectrum was divided into a number of
six bands, each band is specific of some causes
leading to dynamic equipment failure. Thus, Band
No. 2 is specific for the unbalances of the
equipment, Band No. 3 for the misalignments, Band
No. 4 for the clearances and looseness, Band No. 5
for the possible defects of rolling bearings, and
Band No. 6 confirms the advanced condition of
defects in rolling bearings by detecting the so-
called "haystacks" [10].
The limits calculation of these bands is done as
follows:
1. . Fs;
2. Band No. 2: 0.8 Fs . Fs;
3. Band No. 3: 1. Fs . Fs;
4. Band No. 4: 2. Fs . Fs;
5. Band No. 5: 5. Fs . Fmax;
6. Band No. 6: 0. Fmax Fmax.
where: Fmax is the maximum frequency that is
chosen depending on the type of equipment, the
rotating speed and the type of used bearing. For this
experiment will be Fmax = 1000 Hz.
Thus, the limits values of these bands
calculated in this experiment will be:
1. .33 Hz;
2. Band No. 2: 13 99 Hz;
3. .65 Hz;
4. Band No. 4: 41. .63 Hz;
5. Band No. 5: 91.
6.
Section, the characteristic defect frequencies of this
type of bearing have the following values: Fc = 6.81
Hz, FBPO = 81.45 Hz, FBP1 = 118.55 Hz, FRE =
43.39 Hz, FBPRE = 86.78 Hz. Knowing that the
rotating speed is 1000 rpm, the fundamental
frequency will be: Fs = 16.67 Hz.
3. EXPERIMENTAL RESULTS AND
INTERPRETATIONS
3.1. FFT and BCS spectrums analysis of the
rolling bearing which worked with an
artificial defect on the outer raceway under
loading of 14 N
In FFT spectrum analysis for all measuring
directions (Fig. 3) the harmonics of FBPO frequency
were detected. Also, the fundamental frequency
(Fs) predominating in Band No. 2 and its harmonics
in Bands No. 3 and 4 were observed. These
observations give information regarding the
existence of an unbalance which is developed by
loading of 14 N. Because on the horizontal FFT
spectrum the Fs and its harmonics are predominant,
the harmonics amplitudes of FBPO (4 x FBPO
FBPO) are much lower compared to them, which
makes it difficult to interpret the existence of a
defect on the outer raceway. Better clarity of
of FBPO can be obtained only
by using the Zoom function of XMS software.
During the experiment (Fig. 4a and 4b) in this
FBPO haven't
had significant increases.
In vertical direction the 3 x Fs harmonic that
predominates in the first measurement (Fig. 4c) and
the Fs that predominates in the 6th measurement
(Fig. 4d) were observed. Also, in FFT spectrums
the harmonics of FBPO (3 x FBPO BPO) were
observed, that are much clearer than those in the
horizontal direction and also the appearance of the
harmonic 3 x FBPO. During the experiment in this
direction the harmonics amplitudes of FBPO haven't
had significant increases.
In axial direction the 3 x Fs harmonic that
predominates in spectrums (Fig. 4e and 4f) were
observed as well as the harmonics amplitudes of
FBPO (3 x FBPO BPO) that are much clearer.
During the experiment in this direction the
harmonics amplitudes of FBPO haven't had
significant increases.
In BCS spectrums analysis for all measuring
directions, the FBPO frequency and its harmonics,
with much clearer amplitudes than the FFT
spectrums, were detected. Also, the 1 x Fs (-1 and
1) and 2 x Fs (-2 and 2) sidebands, which confirm
the existence an unbalance developed by loading of
14 N, were detected. In horizontal and vertical
directions during the experiment the amplitudes of
FBPO and its harmonics were more obvious than
those in the axial direction (in horizontal and
vertical directions the highest values occurring in
the 4th measurement and in axial direction in the
6th measurement) as can be observed in Fig. 5.
Although the amplitudes of FBPO and its
harmonics increased during the experiment in all
directions of the measurement, when the rolling
bearing was dismounted (Fig. 6) it didn't have any
damage caused by the implementation of the defect
on the outer raceway.

DIAGNOSTYKA, Vol. 14, No. 4 (2013)
NADABAIC , NEDEFF, RADKOWSKI, M CZAK, The Importance Of FFT And BCS Spectrums…
6
a.
c.
e.
b.
d.
f.
Fig. 4. FFT spectrums of bearing operating under loading of 14 N: a. - in horizontal direction for the 1st
measurement; b. - in horizontal direction for the 6th measurement; c. – in vertical direction for the 1st
measurement; d. – in vertical direction for the 6th measurement; e. -in axial direction for the 1st measurement; f.
- in axial direction for the 6th measurement

DIAGNOSTYKA, Vol. 14, No. 4 (2013)
FT And BCS
7
a.
c.
e.
b.
d.
f.
Fig. 5. BCS spectrums of bearing operating under loading of 14 N: a. - in horizontal direction for the 1st
measurement; b. - in horizontal direction for the 6th measurement; c. - in vertical direction for the 1st
measurement; d. - in vertical direction for the 6th measurement; e. - in axial direction for the 1st measurement; f.
- in axial direction for the 6th measurement

DIAGNOSTYKA, Vol. 14, No. 4 (2013)
FT And BCS
8
Fig.6. Evolution of rolling bearing degradation with
artificial defect on the outer raceway after its
operation under loading of 14 N
3.2. FFT and BCS spectrums analysis of the
rolling bearings which worked with an
artificial defect on the outer raceway under
loading of 28 N
During this experiment in FFT spectrums it was
observed that by increasing of loading the
harmonics amplitudes of FPBO increased and the 1x
Fc (-1'and 1') sidebands appeared. Also, it was
observed that the Fs frequency and its harmonics
predominate in spectrums. In horizontal direction
(Fig. 7), the number of harmonics of FPBO increased
from 4 x FPBO 9 x FPBO to 3 x FPBO 12 x FPBO and
their amplitudes are much clearer. In vertical
direction (Fig. 8) the number of harmonics of FPBO
increased from 3 x FPBO 9 x FPBO to 3 x FPBO 12 x
FPBO.
In axial direction (Fig. 9) it was observed that by
increasing of loading the 8 x FPBO and 9 x FPBO
harmonics have high amplitudes (even higher than
the Fs frequency and its harmonics). The increases
of FPBO amplitudes during the experiment can
confirm the existence of rolling bearing damage due
to implemented defect on the outer raceway.
During this experiment in BCS spectrums
analysis (Fig. 10, 11 and 12) for all measuring
directions it was observed that by increasing the
loading, the amplitudes of FPBO and of its harmonics
increased. Also, the 1 x Fs (-1 and 1), 2 x Fs (-2 and
2) and 1 x Fc (- and ) sidebands were observed.
These amplitudes increases of the harmonics of
FPBO from FFT spectrums and of the FPBO frequency
and of its harmonics from BCS spectrums, as well as
the appearance mode of the sidebands give the
evolution mode of the artificial defect on the outer
raceway when loading is increased from 14 N to 28
N. At the dismounting of the rolling bearing (Fig.
13) these observations are confirmed by establishing
the evolution mode of the artificial defect on the
outer raceway (a groove of about 8 mm, along the
outer raceway in area of the artificial defect and a
thermal wear on the balls from the row that is it in
contact with the artificial defect were developed).
Thermal wear in this bearing is present by a color
changing (a blackening) of the superficial layer of
Fig. 7. FFT spectrum of bearing operating under
loading of 28 N in the horizontal direction for the
5th measurement
Fig. 8. FFT spectrum of bearing operating under
loading of 28 N in the vertical direction for the 3rd
measurement
Fig. 9. FFT spectrum of bearing operating under
loading of 28 N in the axial direction for the 3rd
measurement

DIAGNOSTYKA, Vol. 14, No. 4 (2013)
FT And BCS
9
Fig. 10. BCS spectrum of bearing operating under
loading of 28 N in the horizontal direction for the
6th measurement
Fig. 11. BCS spectrum of bearing operating under
loading of 28 N in the vertical direction for the 5th
measurement
Fig. 12. BCS spectrum of bearing operating under
loading of 28 N in the axial direction for the 6th
measurement
Fig. 13. Evolution of rolling bearing degradation
with artificial defect on the outer raceway after its
operation under loading of 28 N
3.3. FFT and BCS spectrums analysis of the
rolling bearings which worked with an
artificial defect on the outer raceway under
loading of 42 N
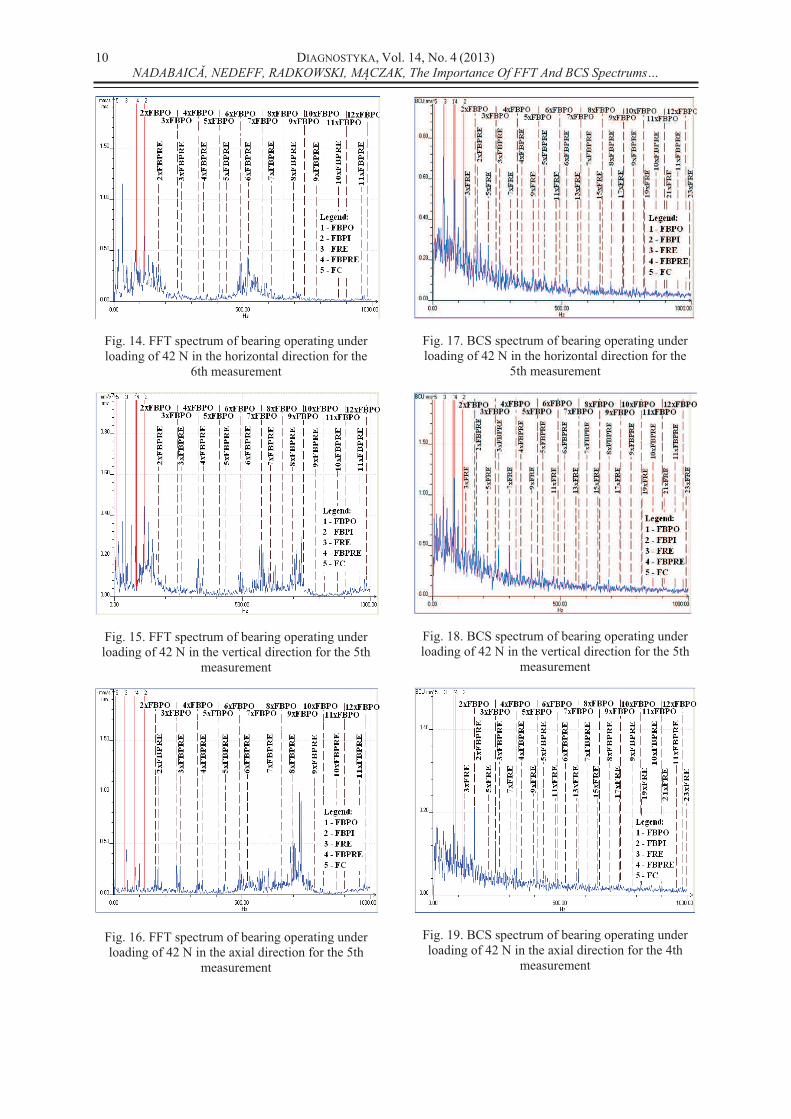
In FFT spectrums it was observed that by
increasing of loading, the harmonics amplitudes of
FPBO and the 1x Fc (- and ) sidebands are much
clearer in all measuring directions. Also, the Fs
frequency and its harmonics that predominate in
spectrums, were observed. In horizontal direction
(Fig.14) at the 6th measurement the harmonics
amplitudes of FBPRE were observed, which confirms
the damage of the rolling bearing . In vertical
and axial directions this defect characteristic
frequency was observed even from the 5th
measurement as can be seen in Fig. 15 and 16.
In BCS spectrums for all measuring directions
was observed that by increasing of loading, the
amplitudes of FBPO and of its harmonics increased.
Thus, in horizontal and vertical directions these
amplitudes increased until the 4th measurement,
then at the 5th measurement the amplitudes of FBPRE
and FRE frequencies were observed. At the 6th
measurement, the amplitudes of FBPRE and FRE
frequencies and of its harmonics are much higher
than FBPO frequency and its harmonics that are more
difficult to observe. In axial direction the amplitudes
of FBPO and of its harmonics are difficult to observe
even from the 5th measurement. These higher
amplitudes of FBPRE and FRE frequencies suggest that
the balls damage is more extensive than the outer
raceway damage. These observations were
confirmed at the dismounting of the rolling bearing
(Fig. 20). Thus, along the outer raceway the groove
expanded from 8 mm to 41 mm (Fig. 20b), in
addition to the thermal wear of the balls there was
also a removal of material from the surface layer
(Fig. 20a) and inner raceway has a thermal wear
with small dimples (small removal of material - fig.
20c).
DIAGNOSTYKA, Vol. 14, No. 4 (2013)
FT And BCS
10
Fig. 14. FFT spectrum of bearing operating under
loading of 42 N in the horizontal direction for the
6th measurement
Fig. 15. FFT spectrum of bearing operating under
loading of 42 N in the vertical direction for the 5th
measurement
Fig. 16. FFT spectrum of bearing operating under
loading of 42 N in the axial direction for the 5th
measurement
Fig. 17. BCS spectrum of bearing operating under
loading of 42 N in the horizontal direction for the
5th measurement
Fig. 18. BCS spectrum of bearing operating under
loading of 42 N in the vertical direction for the 5th
measurement
Fig. 19. BCS spectrum of bearing operating under
loading of 42 N in the axial direction for the 4th
measurement

DIAGNOSTYKA, Vol. 14, No. 4 (2013)
FT And BCS
11
a. b. c.
Fig. 20. Evolution of rolling bearing degradation with artificial defect on the outer raceway after its operation
under loading of 42 N: a. on ball; b. on outer raceway; c. on inner raceway
4. CONCLUSIONS
Measurement and analysis of vibrations, over
time, in different points of
rolling bearings represent a safe and effective
measure for the diagnosis and prediction of their
technical state as well as of the entire equipment.
The FFT and BCS spectrums analysis give the most
effective information on the causes of rolling
bearings deterioration during the time passing, but
they also give prediction on their remaining lifetime.
Thus, the FFT spectrums of this experimental
research give information by the appearance of
rotation speed amplitudes, Fs, and its harmonics on
the existence of an unbalance created by the used
loadings, and by the appearance of characteristic
defect frequencies harmonics (FBPO, FBPRE and FRE)
on the presence of defects from rolling bearing
components. These harmonics of characteristic
defect frequencies have random variations in their
amplitude both in time and spectrum width. These
random variations don't provide sufficient
information regarding the evolution mode of rolling
bearing deterioration both due to unbalance and
when faults occur in their components. On the other
hand, in BCS spectrums, amplitudes of characteristic
defect frequencies and of its harmonics decrease
asymptotically from characteristic defect frequencies
to the last harmonic. The BCS spectrums give
information regarding the existence of unbalance by
the appearance of 1x Fs and 2x Fs sidebands of
characteristic defect frequencies, as well as the
existence of different diameters of the rolling
elements by 1x Fc and 2x Fc sidebands. Also, by the
appearance and evolution mode of characteristic
defect frequencies amplitudes and of its harmonics,
BCS spectrums give beneficial information
regarding the evolution mode of bearing degradation
during the time passing. Thus, in order to have
efficiency of the diagnosis and of the prediction of
rolling bearings, it is necessary to use FFT and BCS
spectrums analysis. For detecting of characteristic
defect frequencies, the knowledge of rolling bearing
geometrical characteristics is also necessary, but in
order to have an effective diagnosis and prediction,
it is required to have an experienced and responsible
staff.
REFERENCES
[1] Orhan S., Akturk N., Celik V.: Vibration monitoring for defect diagnosis of rolling
element bearings as a predictive maintenance
tool: Comprehensive case studies, NDT&E
International, 2006, Vol. 39, No. 4, pp. 293
298.
[2]
A.: The study of the diagnosis theory applied
for predictive maintenance, Research Journal
of Agricultural Science, 2009, Vol. 41, No. 2,
pp. 338-350.
[3] Balerston H. L.: The Detection of Incipient
Failure in Bearings, Materials Evaluation, 1996, Vol. 27, pp. 121 128.
[4] Tse P., Peng Y., Yam R.: Wavelet analysis
and envelope detection for rolling element bearing fault diagnosis their effectiveness
and flexibilities, Journal of Vibration and
Acoustics, 2001, Vol. 123, pp. 303 310.
[5] Mobley K. R.: Root Cause Failure Analysis,
Reed Elsevier, USA, 1999.
[6] Nadabaica D. C., Bibire L., Andrioai G.:
Study of the advantages of predictive
maintenance in the monitoring of rolling bearings, Environmental Engineering and
Management Journal, 2012, Vol. 11, No. 12,
pp 2233-2238.
[7] Ragulskis K., Yurkauskas A.: Vibration of
Bearing, Hemisphere Publishing Corporation,
Bristol, 1989.
[8] Rieger N. F., Crofoot J. F.: Vibration of
Rotationary Machinary, Rochester Institute
of Tehnology, 1977, pp.69-77.
[9] Al-Hazmi M.W.: The Effect Of The
Manufacturing Errors On The Dynamic
Performance Of Gears, Journal of
Engineering & Architecture, 2011, Vol. 4,
No. 2, pp. 37-53.
[10] Dennis H. S.: Signal Processing For Effective
Vibration Analysis, IRD Mechanalysis, Inc.
Columbus, Ohio, 1995.

DIAGNOSTYKA, Vol. 14, No. 4 (2013)
FT And BCS
12
Dumitru - Cristinel
NADABAICA is PhD
student and associate
assistant in Environmental
Engi-neering and Mechanical
Engineering Department,
Bacau. In his works he explores issues of the
diagnostic of process equipments failure and the
prognosis of their remaining lifetime.
Prof. Valentin NEDEFF,
Bacau and professor in
Environmental Engi-neering
and Mechanical Engineering
Department, Engineering
Faculty. In his scientific
work he deals with research
in mechanical and
environmental field.
RADKOWSKI, professor in
the Institute of Vehicles of the
Warsaw University of
Technology. In his scientific
work he deals with
vibroacoustic diagnosis,
technical risk analysis and
energy harvesting.
Dr i ,
PhD, is an assistant professor
at the Institute of Vehicles of
the Warsaw University of
Technology. His scientific
interests are distributed
diagnostic systems, machine
diagnostics and analysis of the
vibroacoustic signals.