RSPO Supply Chain - RSPO - Roundtable on Sustainable Palm Oil

0
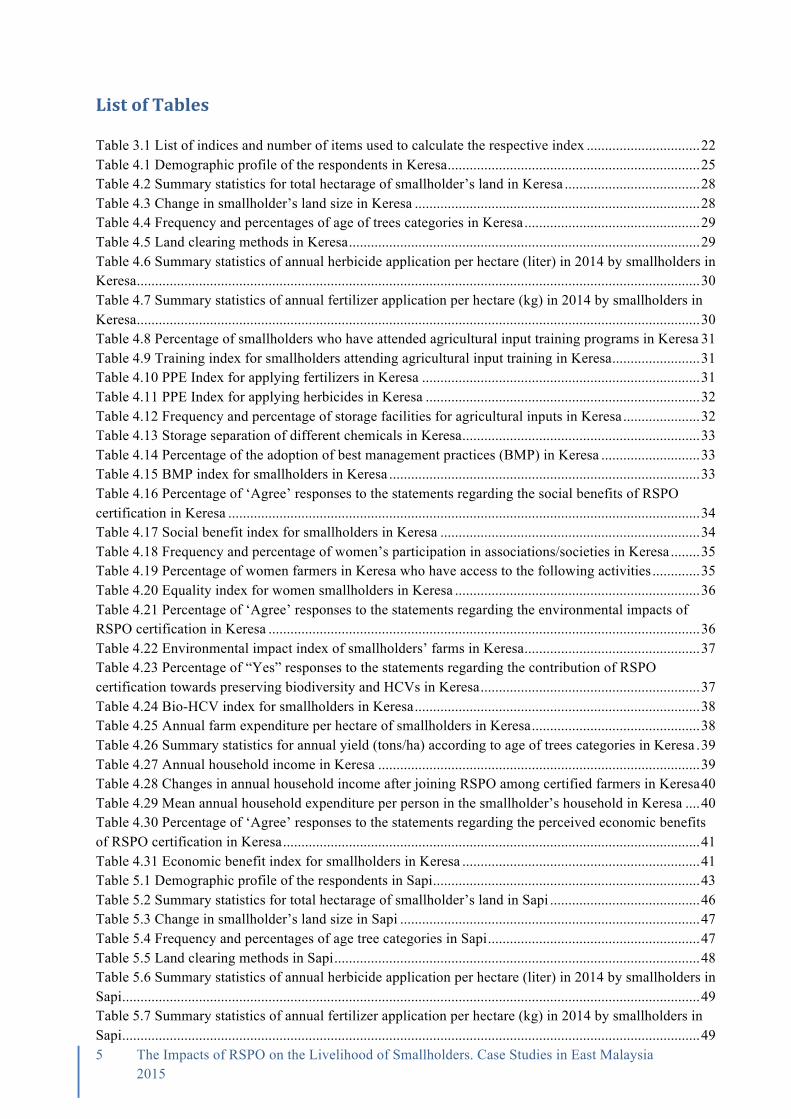
THE IMPACTS OF RSPO ON THE LIVELIHOOD OF SMALLHOLDERS: CASE STUDIES IN EAST MALAYSIA
Smallholders from Rumah Majang, Bintulu, Sarawak, Malaysia collecting the fresh fruit bunches (FFB’s) in their farm for delivery to Keresa Mill Sdn. Bhd. (2015). Image: Rizal Mohd

1 The Impacts of RSPO on the Livelihood of Smallholders. Case Studies in East Malaysia 2015
Acknowledgements In order to accomplish assigned tasks and successfully gather the much needed information for this study, we worked closely with particular organizations and individuals who were very supportive from beginning to end. We want to express our gratitude to RSPO for the research funds generously provided. This research would not even be possible without their funding support. We are very much grateful for the presence and cooperation of the village communities from Keresa and Sapi organized by their respective tuai rumah and village heads during the whole span of data collection and survey interviews. We would also like to express our sincerest appreciation to Keresa Plantations and Mill Sdn. Bhd. and Wilmar International Limited for the assistance they rendered during the fieldwork, particularly with logistics and accommodation. We also thank Wild Asia for the array of support and recommendations they contributed and the experiences they shared with the team that enabled the study to work out smoothly. Thanks also to IKDPM staff for their helpful support and the manpower provided for this study. The Impacts of RSPO on the Livelihood of Smallholders: Case Studies in East Malaysia, by Shaufique Fahmi Sidique, Tey Yeong Sheng, Marcel Djama, Che Ku Amir Rizal Che Ku Mohd, Diana Rose Sadili, and Syahaneem Mohamad Zainalabidin. This document has ‘open access’, you are free to print a copy from the RSPO website. You may also reproduce the text with appropriate acknowledgements of RSPO and Institute of Agricultural and Food Policy Studies (IKDPM).
2 The Impacts of RSPO on the Livelihood of Smallholders. Case Studies in East Malaysia 2015
ExecutiveSummaryThe primary objective of this study is to examine the impacts of RSPO certification on independent smallholders, with particular emphasis on their livelihood. Our study is guided by the sustainable development framework, which focuses on social, economic and environmental aspects of development. The data for this study was collected through field observations and surveys conducted in two independent smallholder areas in Bintulu (Keresa) and Sandakan (Sapi) districts. A total of 76 and 100 smallholders were interviewed in Keresa and Sapi, respectively. We found sufficient evidence to conclude that RSPO certification has positive impacts on the social and economic wellbeing of smallholders, as well as the surrounding environment they live in. This report is organized into six chapters. The first chapter provides a background and covers the primary issues motivating this study. The second chapter reviews past studies and literature that are relevant to this research. Chapter three discusses in detail the methodology that we employed to conduct this study. Chapters four and five discuss the findings from our two study areas, Keresa and Sapi. The final chapter concludes our review of findings and speaks to future needs. Key findings from this report Smallholders are generally aware of the existence of RSPO certification, and the main motivations for getting certified were associated with economic incentives such as premium pricing and farm yield improvements. In the case of Keresa, the certification was found to bring both parties, the independent smallholders and the plantation company, to work closely together. The company provides complimentary extension services and credit for fertilizer purchase. The smallholders enjoy significant reduction in the cost of fertilizer because the company helps them to organize bulk fertilizer purchases. For both Keresa and Sapi, there are also signs of spillover benefits to non-certified smallholders. Non-certified smallholders are found to be familiar with good agricultural practices, which are emulated mainly from their certified peers. This is highly probable given the social relationship and connectedness of being in close proximity with one another when living in the same community. Non-certified smallholders also benefit from the infrastructure provided by the plantation companies. There are indications that certified smallholders benefit from higher economic returns compared to non-certified smallholders. The economic returns can generally be credited, but not entirely, to RSPO certification. The findings indicate that the difference in mean annual household income for certified smallholders in Keresa is almost 25% more than their non-certified counterparts. The difference in mean annual income in Keresa can be attributed mainly to better yield and larger farm size. In Sapi, certified and waiting-to-be certified smallholders’ mean annual income is approximately 10% more than that of non-certified smallholders. The case is slightly different in Sapi where non-RSPO members have reported better yield but received lower prices, thus resulting in lower household income. In addition, certified smallholders in Keresa and Sapi perceived RSPO certification to be economically rewarding. The results from this study also suggest that certified smallholders are very optimistic about the environmental benefits of RSPO certification. They perceive that their post-certification farm practices are more environmentally friendly, with better waste management and lower amounts of pollution. They also believe that their land is better managed and its resources are better conserved. These findings are mostly consistent with the survey results and our observations on the farm practices of these smallholders.

3 The Impacts of RSPO on the Livelihood of Smallholders. Case Studies in East Malaysia 2015
Certified smallholders in both areas, Keresa and Sapi, are better trained in fertilizer, herbicide and pesticide applications and handling. Certified smallholders in both areas are found to use lesser amounts of herbicides at their farms than the non-certified smallholders. In Sapi, the quantity of chemical application used for land preparation among certified farmers and the ones waiting for certification has dramatically reduced as a result of RSPO certification. The percentage of smallholders with proper agricultural inputs to storage facilities is also higher than their non-certified counterparts. Proper handling and storage of chemical inputs, apart from optimizing use and ensuring the health and safety of the farmers, would minimize the externalities generated by its application to the environment. RSPO certification could be a catalyst of improving social wellbeing. RSPO certified smallholders in Keresa perceive RSPO certification leads to positive changes in their social wellbeing. This is also largely due to Keresa’s commitment to improving social amenities in the local communities, such as access roads, and healthcare. Similarly, certified and waiting-to-be-certified smallholders in Sapi strongly agreed that RSPO certification brings positive social benefits to the community. Main Recommendations Moving forward, we propose several recommendations.
• Beyond certification, extension services are paramount. Continuous education and support should be provided to the smallholders to constantly improve their productivity and to help achieve maximum benefits of the certification. There is an incentive for certified mills to provide these services in exchange for continuous quality supply of FFBs;
• Smallholders are responsive to economic incentives. Premium pricing of FFBs and transparency in pricing and payment mechanisms can attract more smallholders to get certified. Certified mills could transfer some of the premium they get from selling certified sustainable palm oil (CSPO) to the certified smallholders. Certified mills are also more transparent towards grading, pricing and payment for FFBs; and
• Group managers need to play an active role in organizing certified smallholders not only for certification purposes, but also as a farm business decision-making entity. RSPO certification provides a platform for the smallholders to be organized as a unit to enable collective bargaining in terms of input purchase, request for extension services, transportation, and FFB sales.

4 The Impacts of RSPO on the Livelihood of Smallholders. Case Studies in East Malaysia 2015
Table of Contents Executive Summary ................................................................................................................................. 2 List of Tables ........................................................................................................................................... 5 List of Figures .......................................................................................................................................... 7 Acronyms ................................................................................................................................................. 8 Chapter 1. Introduction ............................................................................................................................ 1
Background .................................................................................................................................... 1 Smallholders in Malaysia .............................................................................................................. 2 Research Problem .......................................................................................................................... 3 Objectives of the Study ................................................................................................................... 4
Chapter 2. Literature Review ................................................................................................................... 6 Agriculture and Sustainable Certification Schemes ...................................................................... 6 Impacts of Sustainable Certification Standards on Farmers' Livelihood ...................................... 7 Impacts of RSPO Certification Standards on Smallholders’ Livelihood ....................................... 9
Chapter 3. Methodology ........................................................................................................................ 13 Conceptual Framework ............................................................................................................... 13 Study Areas .................................................................................................................................. 14 Questionnaire Design .................................................................................................................. 18 Pre-Test ........................................................................................................................................ 19 Data Collection ............................................................................................................................ 20 Data Analysis ............................................................................................................................... 21
Chapter 4. Findings from Keresa ........................................................................................................... 25 Background of Respondents ........................................................................................................ 25 Farming Practice ......................................................................................................................... 28 Social Impacts .............................................................................................................................. 34 Environmental Impacts ................................................................................................................ 36 Economic Impacts ........................................................................................................................ 38
Chapter 5. Findings from Sapi ............................................................................................................... 43 Background of Respondents ........................................................................................................ 43 Farming Practice ......................................................................................................................... 46 Social Impacts .............................................................................................................................. 53 Environmental Impacts ................................................................................................................ 55 Economic Impacts ........................................................................................................................ 57
Conclusion ............................................................................................................................................. 62 Annex 1: References .............................................................................................................................. 64 Annex 2: Appendix ................................................................................................................................ 67
5 The Impacts of RSPO on the Livelihood of Smallholders. Case Studies in East Malaysia 2015
ListofTablesTable 3.1 List of indices and number of items used to calculate the respective index ............................... 22 Table 4.1 Demographic profile of the respondents in Keresa ..................................................................... 25 Table 4.2 Summary statistics for total hectarage of smallholder’s land in Keresa ..................................... 28 Table 4.3 Change in smallholder’s land size in Keresa .............................................................................. 28 Table 4.4 Frequency and percentages of age of trees categories in Keresa ................................................ 29 Table 4.5 Land clearing methods in Keresa ................................................................................................ 29 Table 4.6 Summary statistics of annual herbicide application per hectare (liter) in 2014 by smallholders in Keresa .......................................................................................................................................................... 30 Table 4.7 Summary statistics of annual fertilizer application per hectare (kg) in 2014 by smallholders in Keresa .......................................................................................................................................................... 30 Table 4.8 Percentage of smallholders who have attended agricultural input training programs in Keresa 31 Table 4.9 Training index for smallholders attending agricultural input training in Keresa ........................ 31 Table 4.10 PPE Index for applying fertilizers in Keresa ............................................................................ 31 Table 4.11 PPE Index for applying herbicides in Keresa ........................................................................... 32 Table 4.12 Frequency and percentage of storage facilities for agricultural inputs in Keresa ..................... 32 Table 4.13 Storage separation of different chemicals in Keresa ................................................................. 33 Table 4.14 Percentage of the adoption of best management practices (BMP) in Keresa ........................... 33 Table 4.15 BMP index for smallholders in Keresa ..................................................................................... 33 Table 4.16 Percentage of ‘Agree’ responses to the statements regarding the social benefits of RSPO certification in Keresa ................................................................................................................................. 34 Table 4.17 Social benefit index for smallholders in Keresa ....................................................................... 34 Table 4.18 Frequency and percentage of women’s participation in associations/societies in Keresa ........ 35 Table 4.19 Percentage of women farmers in Keresa who have access to the following activities ............. 35 Table 4.20 Equality index for women smallholders in Keresa ................................................................... 36 Table 4.21 Percentage of ‘Agree’ responses to the statements regarding the environmental impacts of RSPO certification in Keresa ...................................................................................................................... 36 Table 4.22 Environmental impact index of smallholders’ farms in Keresa ................................................ 37 Table 4.23 Percentage of “Yes” responses to the statements regarding the contribution of RSPO certification towards preserving biodiversity and HCVs in Keresa ............................................................ 37 Table 4.24 Bio-HCV index for smallholders in Keresa .............................................................................. 38 Table 4.25 Annual farm expenditure per hectare of smallholders in Keresa .............................................. 38 Table 4.26 Summary statistics for annual yield (tons/ha) according to age of trees categories in Keresa . 39 Table 4.27 Annual household income in Keresa ........................................................................................ 39 Table 4.28 Changes in annual household income after joining RSPO among certified farmers in Keresa 40 Table 4.29 Mean annual household expenditure per person in the smallholder’s household in Keresa .... 40 Table 4.30 Percentage of ‘Agree’ responses to the statements regarding the perceived economic benefits of RSPO certification in Keresa .................................................................................................................. 41 Table 4.31 Economic benefit index for smallholders in Keresa ................................................................. 41 Table 5.1 Demographic profile of the respondents in Sapi ......................................................................... 43 Table 5.2 Summary statistics for total hectarage of smallholder’s land in Sapi ......................................... 46 Table 5.3 Change in smallholder’s land size in Sapi .................................................................................. 47 Table 5.4 Frequency and percentages of age tree categories in Sapi .......................................................... 47 Table 5.5 Land clearing methods in Sapi .................................................................................................... 48 Table 5.6 Summary statistics of annual herbicide application per hectare (liter) in 2014 by smallholders in Sapi .............................................................................................................................................................. 49 Table 5.7 Summary statistics of annual fertilizer application per hectare (kg) in 2014 by smallholders in Sapi .............................................................................................................................................................. 49
6 The Impacts of RSPO on the Livelihood of Smallholders. Case Studies in East Malaysia 2015
Table 5.8 Percentage of smallholders who have attended agricultural input training programs in Sapi .... 49 Table 5.9 Training index for smallholders attending agricultural input training in Sapi ............................ 50 Table 5.10 PPE Index for applying fertilizers in Sapi ................................................................................ 50 Table 5.11 PPE Index for applying herbicides in Sapi ............................................................................... 50 Table 5.12 Frequency and percentage of storage facilities for agricultural inputs in Sapi ......................... 51 Table 5.13 Storage separation of different chemicals in Sapi ..................................................................... 51 Table 5.14 Percentage of the adoption of best management practices (BMP) in Sapi ............................... 52 Table 5.15 BMP index for smallholders in Sapi ......................................................................................... 52 Table 5.16 Percentage of ‘Agree’ responses to the statements regarding the social benefits of RSPO certification in Sapi ..................................................................................................................................... 53 Table 5.17 Social benefit index for smallholders in Sapi ........................................................................... 53 Table 5.18 Frequency and percentages of women’s participation in associations/societies in Sapi .......... 54 Table 5.19 Percentage of women farmers in Sapi who have access to do the following activities ............ 55 Table 5.20 Equality index for women farmers in Sapi ............................................................................... 55 Table 5.21 Percentage of ‘Agree’ responses to the statements regarding the environmental impacts of RSPO certification in Sapi .......................................................................................................................... 56 Table 5.22 Environmental impact index for smallholders in Sapi .............................................................. 56 Table 5.23 Percentage of “Yes” responses to the statements regarding the contribution of RSPO certification towards preserving biodiversity and HCVs in Sapi ................................................................ 57 Table 5.24 Bio-HCV index for smallholders in Sapi .................................................................................. 57 Table 5.25 Annual farm expenditure per hectare of smallholders in Sapi .................................................. 58 Table 5.26 Summary of statistics for yield (tons/ha) according to tree age categories in Sapi .................. 58 Table 5.27 Annual household income of smallholders in Sapi ................................................................... 59 Table 5.28 Changes in annual household income among certified farmers in Sapi ................................... 59 Table 5.29 Mean annual household expenditure per person in the smallholder’s household in Sapi ........ 60 Table 5.30 Percentage of ‘Agree’ responses to the statements regarding the economic benefits of RSPO certification in Sapi ..................................................................................................................................... 61 Table 5.31 Economic benefit index for smallholders in Sapi ..................................................................... 61

7 The Impacts of RSPO on the Livelihood of Smallholders. Case Studies in East Malaysia 2015
ListofFiguresFigure 3.1 Conceptual Framework .............................................................................................................. 14 Figure 3.2 Geographical location of Keresa Plantations and Mill Sdn Bhd ............................................... 15 Figure 3.3 Social structure of smallholders in Keresa ................................................................................ 16 Figure 3.4 Geographical location of WAGS Beluran, Sabah ..................................................................... 17 Figure 3.5 Social structure of smallholders in Sapi .................................................................................... 18 Figure 4.1 Breakdown of RSPO information among the respondents in Keresa ....................................... 27 Figure 4.2 Breakdown of application for RSPO certification among the respondents in Keresa ............... 27 Figure 4.3 Breakdown of RSPO certified and non-certified respondents in Keresa .................................. 28 Figure 5.1 Breakdown of RSPO information among the respondents in Sapi ........................................... 45 Figure 5.2 Breakdown of application for RSPO certification among the respondents in ........................... 45 Figure 5.3 Breakdown of RSPO certified, waiting for certification, and non-certified respondents in Sapi ......................................................................................................................................................... 46

8 The Impacts of RSPO on the Livelihood of Smallholders. Case Studies in East Malaysia 2015
Acronyms BMP Best Management Practices CSPO Certified Sustainable Palm Oil FAO Food and Agriculture Organization of the United Nations FELCRA Federal Land Consolidation and Rehabilitation Authority FELDA Federal Land Development Authority FFB Fresh Fruit Bunches FLO Fairtrade Labelling Organizations (also known as Fairtrade International) FSC Forest Stewardship Council GDP Gross Domestic Product HCV High Conservation Values IAASTD International Assessment on Agricultural Science and Technology for
Development KSGS Keresa Smallholder Group Scheme MPOB Malaysian Palm Oil Board PPE Personal Protective Equipment RSPO Roundtable for Sustainable Palm Oil SPOC Smallholder Palm Oil Cluster WAGS Wild Asia Group Scheme WWF World Wild Fund for Nature

9 The Impacts of RSPO on the Livelihood of Smallholders. Case Studies in East Malaysia 2015
CHAPTER1
INTRODUCTION

1
Chapter1.Introduction Background Sustainability is an important issue today, particularly in agriculture. Through the years, initiatives and movements towards sustainable agriculture have been put in place in order to balance nature, profits and the community. These initiatives range from government-driven regulations to non-state-driven standards and certification. Now, different certification schemes for keeping sustainability in the DNA of agro-based businesses have been linked to different commodity-based and non-commodity-based products. Some of the widely established agricultural certification standards are: Forest Stewardship Council (FSC), Roundtable on Sustainable Palm Oil (RSPO), Fairtrade International, Rainforest Alliance, Organic and UTZ Certification. The primary aim of these certifications is to encourage supply chain partners in producing sustainable agricultural products. Oil palm expansion raises conservation and sustainability concerns. Although oil palm is the most productive oilseed crop in the world, its rapid expansion is linked to the continuous loss of biodiversity and wildlife species in the tropics. Further, the oil palm industry is often criticized for its labor treatment and the impacts on local communities. In order to address sustainability issues related to palm oil, World Wide Fund for Nature (WWF) initiated the formation of a Roundtable on Sustainable Palm Oil (RSPO) in 2001. RSPO is the only international, multi-stakeholder organization that is formed exclusively for sustainable palm oil. To date, it has 2,356 members who are committed in the RSPO vision of transforming markets and making sustainable palm oil into a norm. Palm oil is produced not only by large plantation companies but also by smallholders. Globally, RSPO reported that there are approximately three million smallholders that produce around 4 million tonnes of palm oil, accounting for 40% of the total global production. As of 31 July 2015, there are 118,793 certified individual smallholders with a certified land area that covers 350,124 hectares. Despite their significant contribution to global palm oil production, smallholders in general, due to the nature of their farm size, face multiple challenges. RSPO reported that many are still suffering from lower yields than their large-scale counterparts. Many of the traditional smallholder farmers lack improved and up-to-date agricultural knowledge and practices. Herein, many are having difficulties gaining access to local and international markets. There are also issues regarding ownership status and securing capital. Smallholders have so much to offer to the oil palm industry because most of them have not reached their yield potential. Marginal enhancements in farming techniques and agricultural practices will result in significant improvement in output, securing mutually beneficial outcomes for surrounding estates and mills, as well as processors. Smallholders are also likely to be more intimate with the surrounding environment, given the direct ownership of their land. Their farming decisions and activities will have direct impact on the environment they live in and also on the sustainability of their livelihood. Their interaction with nature, if properly guided, could ensure long-run environmental sustainability in a landscape scale. Given the potential benefits smallholders could offer, it is imperative that this group remains in the global palm oil value chain through the RSPO certification scheme.

2 The Impacts of RSPO on the Livelihood of Smallholders. Case Studies in East Malaysia 2015
Smallholders in Malaysia Roundtable for Sustainable Palm Oil (RSPO) defines smallholders as farmers who are growing oil palm with a planted area usually below 50 hectares. In Malaysia, smallholders are defined as growers with lands under 40 hectares. Smallholder farms cover about 38% of the total area of oil palm cultivation in this country (MPOB, 2014). According to World Bank (2011), the average smallholder income was likely to be at least 50% more than the average GDP per capita in Malaysia (Dayang Norwana et. al , 2011). Smallholders in Malaysia can be further divided into scheme or organized smallholders and independent smallholders. Organized smallholders’ land area accounted for 24% of the total oil palm planted area in the country while 14% belongs to independent smallholders (Kamalrudin & Abdullah, 2014). Scheme or organized smallholders are growers who cultivate oil palm, along with subsistence production of other crops, with the support of an organization, which can either be a government agency, private corporations or even NGOs. They are provided with technical assistance, agricultural inputs or financing. Smallholders under this structure usually receive their support in the form of seedlings, fertilizers, pesticides and access to technical assistance or credits (Nagiah & Azmi, 2012). Scheme smallholders are often limited to choose the crop they develop and are managed by the managers of the mill, estate or scheme to which they are linked (RSPO, 2015). These schemes are under organizations such as Federal Land Development Authority (FELDA) and Federal Land Consolidation and Rehabilitation Authority (FELCRA). Moreover, scheme smallholders are usually bound to sell their crops to their local mills. Thus, they may not always be able to obtain the best price for their crop (Nagiah & Azmi, 2012) Unlike scheme smallholders, independent smallholders are growers who cultivate oil palm without direct assistance from any third party. Independent smallholders have the freedom to choose how to utilize their lands and how to manage them. They are also characterized as being self-financed, self-organized, self-managed and not contractually bound to any particular mill or any particular association (RSPO, 2015). On the other hand, they may also receive some technical assistance from the government normally in the form of extension services (e.g. TUNAS-Malaysian Palm Oil Board). In contrast with scheme smallholders, independent smallholders sell their crops directly to local mills or traders and are free to bargain in order to obtain the best price. Therefore, independent smallholders may have the greater bargaining power, especially when they form a well-organized group (Nagiah & Azmi, 2012) However, most studies have shown that independent smallholders perform far less than the scheme or organized smallholders. According to a study by Ismail et al., (2003), in Malaysia, scheme smallholders have a typical land holding of 4 hectares whereas independent smallholders have 3 hectares. The yield per hectare of the organized smallholders is 19 tons and is in contrast to the 16-17 tons for the yield of independent smallholders. This is close to the report disclosed by MPOB (2014) to which the average annual yield of independent smallholders accounts to 17.84 tons per hectare. Meanwhile, in a study conducted by Vermeulen & Goad (2006) in Johor, data showed that net return per hectare for organized smallholders is RM1,275 per annum. This is higher compared to their independent counterpart where the net return per hectare is RM1,212 per annum (February 2005 exchange rate: USD1=MYR3.718). This is supported by further studies where independent smallholders in Malaysia are generally perceived to be inefficient and unproductive, producing barely half of the national average yield. These studies indicate that independent smallholders are getting lower yield and income compared to organized farmers, making them more susceptible to

3 The Impacts of RSPO on the Livelihood of Smallholders. Case Studies in East Malaysia 2015
poverty compared to organized smallholders (Abdullah, 2013; Wild Asia, 2013). However, there is contrary evidence on this point for smallholders in East Malaysia. According to a study by Majid Cooke et al (2011), the comparison of several models of community involving oil palm industry in Sabah and Sarawak revealed that independent smallholders perform better in terms of effective and inclusive participation and financial performance in the palm oil industry than the government-led joint-ventures and schemes. The current expansion of oil palm cultivation in Malaysia occurs mainly in Sabah and Sarawak. Sabah accounted for 28.0% (1.5 million hectares) of the total oil palm planted area in this country while 23.5% (1.3 million hectares) of the total planted area is in Sarawak (MPOB, 2014). As of 2014, the total land area for oil palm smallholders in Sabah reached 214,818 hectares (14.21%) while smallholders in Sarawak had 121,425 (9.61%) of the total land area per sector (MPOB, 2014). Today, one-third of the accounted land areas in Sabah and Sarawak are planted by independent smallholders, and it is projected that 80% of independent smallholder growth is to occur in these two states (Wild Asia, 2013). Research Problem The essence of RSPO certification is to provide an effective standard for the production of sustainable palm oil that have less negative impacts on the environment and society. It is also associated with operational benefits that provide growers with better agricultural practices, improved efficiency and resource use, increased labor safety, enhanced working conditions and quality output (RSPO, 2009). Since a significant portion of Malaysian palm oil is produced by smallholders, it is important to encourage their participation in the global certified sustainable palm oil (CSPO) market. Being excluded from the global CSPO supply chain might have a negative impact on the farmers’ livelihoods. The challenge they face to remain part of the value chain is rather acute. Unlike commercial and scheme growers, independent smallholders have limited capital, agronomic knowledge, and less access to technology and appropriate inputs. It is hoped that through RSPO certification, independent smallholders can increase their productivity and can improve their livelihoods. However, little is known about the changes that RSPO certification has brought to a smallholder’s livelihood. An in-depth study is needed to ascertain if RSPO compliance can serve as a mechanism that helps smallholders benefit from following better agricultural practices and, in turn, receive higher income. It is also important to understand the smallholders’ underlying motivations in adopting RSPO, as well as the challenges and barriers they encounter. This study will help us understand the adoptive behavior of smallholders in relation to RSPO and its impact on their livelihoods. The data for this study will be obtained through surveys conducted in two independent smallholder areas in Sabah and Sarawak. The findings of this study may help RSPO in promoting certification more effectively to smallholders and improve the knowledge on how the certification process enhances their livelihoods.

4 The Impacts of RSPO on the Livelihood of Smallholders. Case Studies in East Malaysia 2015
Objectives of the Study The general objective of this study is to examine the impacts of RSPO adoptions on independent smallholders’ livelihoods within the sustainable development spectrum; namely the social, economic and environment dimensions. The specific objectives of this study are:
i. To examine the social impacts (i.e. social structure and promoting sustainable behavior) of RSPO adoption;
ii. To examine the economic impacts (i.e. productivity, and income) of RSPO adoption; iii. To examine the environmental impacts of RSPO adoption; and iv. To examine the perceived environmental impacts of RSPO adoption.

5 The Impacts of RSPO on the Livelihood of Smallholders. Case Studies in East Malaysia 2015
CHAPTER2
LITERATUREREVIEW

6 The Impacts of RSPO on the Livelihood of Smallholders. Case Studies in East Malaysia 2015
Chapter2.LiteratureReviewAgriculture and Sustainable Certification Schemes The production of plants useful to humans is known to us as agriculture. The history of agriculture is the story of human civilization. Without agriculture, humans would not settle in towns and cities. Agriculture, if it had not developed, would have left humans to remain hunter-gatherers, roaming from place to place to find food. Research studies say that agriculture started about ten thousand years ago in the Fertile Crescent, an area in the ancient Middle East. It extended from the Persian Gulf through the valleys of the Tigris and Euphrates Rivers to Egypt. However, farming systems took place not only in Fertile Crescent but also in ancient China, Mexico, South America and other places (Woods & Woods, 2000). Agriculture – including horticulture, livestock, fisheries, forestry, and fodder and milk production – is increasingly spreading to towns and cities (FAO, 2015). Agricultural development is one of the most powerful tools to end extreme poverty, boost shared prosperity and feed 9 billion people by 2050. It is also notable that the growth in the agriculture sector is about two to four times more effective in raising incomes among the poorest compared to other sectors. Development in the agricultural sector is essential for 78% percent of the world’s poor who live in rural areas and depend largely on farming to make a living. Economic growth is critically affected by agriculture since it accounts for one-third of gross-domestic product (GDP) and three-quarters of employment in Sub-Saharan Africa. However, agriculture is more vulnerable to climate change compared to any other sector. In addition, the agricultural sector today also faces challenges regarding gender roles, labor and community development. Issues including small farmers and rural communities in developing countries are often the highlights of agricultural development’s critics. According to research published by International Assessment on Agricultural Science and Technology for Development (IAASTD), small farmers and rural communities in developing countries have often not benefited from opportunities that agricultural trade can offer. Moreover, given the current trends in globalization, rising environmental and sustainability concerns continue to redefine the relationship of agriculture and gender roles, specifically in regard to the status women. Agricultural activities involving women range from 20% to 70%, a figure that is significantly increasing in many developing countries, especially those that geared towards export. Although some progress has been made, women continue to struggle with low income, limited access to education, credit and land, job insecurity, and deteriorating work conditions (IAASTD, 2008). Nowadays, in order to resolve the issues arising with agriculture, including gender, there are various types of sustainable certification standards that are being implemented and adopted by different stakeholders. Sustainable certification of agricultural commodities has gradually gained wider acceptance worldwide due to increasing demands for healthier and more socially and environmentally friendly farm products among the consumers (Petit, 2007; Butch, 2011; Stellmacher & Grote, 2011). The certification system aims to encourage supply chain partners in producing sustainable agricultural products under long-term contractual arrangements based on trust grounded in quality of product and delivery reliability. The certification process typically involves a review of existing production operations, identifying areas of non-compliance with the standards, implementing an action plan to address those areas, and finally undergoing audits by an approved certification body (Wissel et al., 2012).

7 The Impacts of RSPO on the Livelihood of Smallholders. Case Studies in East Malaysia 2015
Today, the established certification bodies include Fairtrade, Organic Certification, Rainforest Alliance, UTZ Certification and Roundtable for Sustainable Palm Oil. Each of these certified bodies operates with different claims to sustainability (Giovannucci & Ponte, 2005; Dauvergne & Lister, 2012) but their main objective remains the same. They advocate the use of a set of standards and indicators that promotes sustainable practices and improves the livelihood of farmers. Forest Stewardship Council (FSC) is a global, multi-stakeholder, non-profit organization dedicated to promote responsible forest management worldwide. FSC originally developed the HCV definitions for the use of forest certification. Roundtable on Sustainable Palm Oil (RSPO) is a multi-stakeholder organization that exclusively focused in the production of sustainable palm oil. Moreover, Fairtrade International is the organization dedicated to Fairtrade labeling at an international level, whereas Rainforest Alliance is a non-government organization that works to conserve biodiversity and ensure sustainable livelihoods by transforming land-use practices, business practices and consumer behavior. Organic standard mainly focuses in the production of certified organic products. Another widely use certification is UTZ Certified which developed the UTZ Codes of Conduct and consists of product-specific standards for coffee, cocoa, tea and rooibos as well as chain of custody standards and a thorough certification system. Since consumers of today increasingly demand an environmental and ethical dimension of food quality, these certification schemes have developed respective standards, practices and services that are vital in the recognition of sustainable agricultural products. These sustainability standards provide detailed technical specifications that incorporate social and environmental characteristics during the production process with clear reference to the three pillars of sustainable development. They also differ not only with their respective principles but also with their pioneering initiatives (Daviron & Vagneron, 2011). These standards specifically aim to produce products using farming techniques that are environmentally, socially and economically beneficial. Further, they intend to create a common reference among industries, stakeholders, NGOs, government, farmers and communities. Impacts of Sustainable Certification Standards on Farmers' Livelihood Different sustainable certification standards have gradually gained wider acceptance worldwide due to increasing demands for the balance of environmental and social needs among consumers. These certification schemes also advocate the use of a set of standards and indicators to promote sustainable practices and to improve the livelihood of the farmers. Despite the potential role of certification in improving farmers’ welfare, there are few empirical studies that assessed the impact of certification on farmers’ livelihood (Bacon, 2005; Calo & Wise, 2005; Jaffee, 2007). Moreover, the existing studies ended up with conflicting findings and focused mainly on coffee and a substantial number on tea, cocoa and banana commodities produced by Fairtrade and Organic certified farmers. The divergent findings have been associated with the differences in the local setting, which determines the implementation, enforcement, and monitoring of certification schemes (Giovannucci and Potts, 2008). The current studies have emphasized more on the benefit of price premium associated with certified markets as well as its effect on their welfare (Bacon, 2005; Jaffee, 2007; Grote et al., 2007; Bechetti & Constantino, 2008; Wissel et al., 2010). The whole idea is framed on the belief that consumers are willing to pay a price premium for sustainable products as a means of promoting environmental conservation. However, the literature suggests the premium is subject to price variability and it offers only a partial explanation of
8 The Impacts of RSPO on the Livelihood of Smallholders. Case Studies in East Malaysia 2015
why farmers join and stay in certification programs (Rotherham, 1997; Rueda & Lambin, 2013). A meta-study of Fairtrade-impacts based on more than 80 academic and development agency reports indicated that Fairtrade certification improves the wellbeing of small-scale coffee farmers and their families through enhancing their access to credit facilities, external funds, training and the quality of their farm products (Nelson & Pound, 2009). Comparing those certified by Fairtrade and those without certification, Becchetti & Constantino (2008) found that the certified farmers in Kenya are better off than uncertified ones in terms of price satisfaction, monthly household food consumption, income satisfaction, dietary quality and child mortality. Likewise, Ruben (2008) matched certified farmers and control groups with similar attributes and concludes that FLO combined with organic improves the income of certified farmers. Using a quantitative household survey of 327 randomly-selected members of conventional, organic and organic-Fairtrade certified cooperatives in Nicaragua, Beuchelt & Zeller (2011) reported that certified farmers are more often found below the absolute poverty line than conventional farmers. Empirical evidence points to the critical importance of coffee certification in strengthening the farmers’ organization and improving global production networks. Detailed case studies from coffee cooperatives in Costa Rica (Ronchi, 2002), Nicaragua (Bacon et al., 2008) and Mexico (Jaffee, 2007) found that Fairtrade strengthened farmers’ organizations and therefore concluded that Fairtrade increases the returns of smallholder farmers, which positively affects their quality of life. Likewise, Ruben et al. (2009) showed that Fairtrade certified farmers consistently invest more on education and house upgrading, and also appear to be significantly less risk-averse than the uncertified ones. Other researchers stressed that Fairtrade initiatives improved the well-being of small-scale coffee farmers and their families through training and improved capabilities that enhance the quality of their products (Taylor, 2005; Murray et al., 2003). Fairtrade certified farmers were also successful in improving their production, experienced satisfaction with prices obtained, and showed improvements in food consumption and living conditions (Becchetti & Costantino, 2008). Focusing on Fairtrade certified bananas in Costa Rica and Ghana and Fairtrade certified coffee in Tanzania and Nicaragua, Poncelet (2005) suggests that the bonus received by coffee cooperatives due to certification were effectively used to improve production capacities and implement social projects that improved the socioeconomic wellbeing of the small farmers in such countries. The literature also suggests that organic certification has multiple potential environmental benefits to the small farmers. It protects the environment from dreadful conditions through elimination of agrochemicals that contaminate organisms and watersheds, promotes use of locally available materials for fertilizers, eliminates pollution from manufacturers and the transportation of chemical fertilizers. It also promotes the installation of small-scale terraces and other structures that enhance the formation and conservation of soil, and accelerates changes in the richness of soil organic matter (OCIA, 2004). The certified organic farmers also experienced dramatic improvements in plant health, particularly in the abundance of foliage and the size of coffee plants, as well as productivity gains. Organic certification projects began with experimenting with new techniques of coffee production that have less adverse effect on the environment. It also creates the possibility that technological innovations could extend to the whole farming system. Organic coffee farms are now able to provide environmental services that resemble those provided by forests (Bacon et al., 2008). Organic coffee production stores carbon from the atmosphere and protects watersheds by slowing down run-off. It also replaces inorganic fertilizers with organic fertilizer. As coffee farms are
9 The Impacts of RSPO on the Livelihood of Smallholders. Case Studies in East Malaysia 2015
located in some of the most biologically diverse and most threatened environments in the world, it plays a vital role as protections for wildlife (Moguel & Toledo, 1999). In spite of the potential role of certification in improving farmer's livelihood, others have suggested that certification has been ineffective at improving the livelihood of farmers. In this vein, Becchetti et al. (2009) suggested that though per capita income of rice producers in Thailand has been positive and significantly affected by both organic certification and Fairtrade affiliation, this effect did not translate into higher productivity due to a concurring increase in working hours. Similarly, Bacon (2005) revealed that although Fairtrade and organic certification have the potential to improve the livelihoods of the coffee smallholders in Northern Nicaragua, it did not offset other factors responsible for the decline in their general livelihood. A four-year empirical study of the economic impact of FLO certification on cooperative coffee producers in Mexico undertaken by Jaffee (2007) suggested that even though Fairtrade certification increases gross household income and provides them with economic benefits related to the reduction of debt, enhancement of better nutrition and schooling, better price stability and extra capital to the wider communities, it is not a panacea. Certification in and of itself does not bring the majority of participants out of poverty. Jenna et al. (2010) employed household data from 249 coffee farmers from six different cooperatives collected in the Jimma zone of Southwestern Ethiopia and found that the certification of coffee cooperatives has a low impact on the livelihood of small-scale coffee producers due to low productivity, insignificant price premium, and poor access to credit and information from the cooperative. In the same vein, Ruben & Fort (2011) reported that Fairtrade certification reduces the total gross and net household income of small coffee farmers in Peru, which is attributed to low yield. Studies by Valkila & Nygren (2009) found that Fairtrade organic coffee production has lower yields and requires higher labor efforts. Therefore, the increase in farmer’s income from this low-intensity coffee production is very modest because of low output produced by certified farmers. Farmers thus remain in poverty despite being connected to Fairtrade organic markets (see Bacon et al., 2008). The largest proportion of impact studies considered the effects of Fairtrade (FLO) certification in improving the livelihood of certified coffee farmers in Latin America, Caribbean and African countries. This may be because of its longest track-record of any major development oriented certification scheme as well as the global market potential for coffee. Relatively speaking, there are few impact assessments of Rainforest Alliance and UTZ Certification and Roundtable on Sustainable Palm Oil (RSPO). Impacts of RSPO Certification Standards on Smallholders’ Livelihood Roundtable for Sustainable Palm Oil (RSPO) was formally established in 2004 under Article 60 of the Swiss Civil Code. It is the only international, multi-stakeholder organization that focuses on sustainable palm oil (RSPO, 2015). Further, it unites stakeholders from the seven sectors of the palm oil industry: oil palm producers, processors or traders, consumer goods manufacturers, retailers, banks/investors, and environmental and social non-governmental organizations (NGOs), in the development and implementation of global standards for sustainable palm oil. This certification scheme has also been of significant interest to different stakeholders, even to those who are not directly involved in the palm oil industry. Moreover, there were researches on the impacts of RSPO certification that were also conducted in the past years. However, unlike Fairtrade and organic certification, studies on the impacts of RSPO were relatively fewer.

10 The Impacts of RSPO on the Livelihood of Smallholders. Case Studies in East Malaysia 2015
Indonesia is the largest oil palm producer in the world followed by Malaysia. In Malaysia, the palm oil sector employs over half a million workers directly; while Indonesia has an estimated number of people working in the palm oil industry and downstream industries which range from 6 million to 3.7 million. The majority of RSPO certified supply comes from these two countries. Also, RSPO compliant production is slightly concentrated in these countries than other global production, although the certification scheme is in line with the global distribution of oil palm production (IISD, 2014). Herein, the researches on the case of farmers in Indonesia under RSPO certification are significant for further studies in other relevant countries. In a study conducted by Hidayat et al. (2015) in Indonesia, farmers’ participation in certification contributes positively to farmers’ organizations, especially on building business relationships and farmers’ social and human capital. The social and human capitals were improved through trainings for farmers, such as Good Agricultural Practices (GAP) focusing on integrated pest management, limited use of pesticide and sprays, proper use of fertilizer application and harvesting techniques. Human capital was also improved through trainings on High Conservation Value (HCV) and on the concept of protected animals and Environmental Impact Assessments. Further, a study of Brandi et al. (2013) suggested that the certification of smallholders offers additional income generation and livelihood improvement. As such, it can potentially give development opportunities to rural regions. Certification of smallholders can also incorporate stronger supply chain cooperation, which lowers production costs, raises productivity to a better quality level and contributes toward stabilization of supply through risk diversification. Additionally, the research suggested that the RSPO certification process has potential large-scale ecological benefits that include prevention of deforestation, reduction of greenhouse gas emissions and the preservation of biodiversity. In a study undertaken by Opijnen et al. (2013), results showed that RSPO also has various indirect benefits to farmers in Indonesia. This includes positive health effects due to increased awareness on risks of pesticides and other chemicals. Furthermore, roads and other infrastructure improvements have provided farmers better opportunities to reach the mills that also made their daily working practices from and to the fields easier. These studies were echoed by cases from Malaysia (WWF, 2015; RSPO Pinterest, 2015). Herein, case studies from existing RSPO certification schemes demonstrated that the certified smallholder farmers benefit in terms of improved yields, better technical skills and knowledge, higher chances of attracting international funding, and strengthened social relations within the community (Donough et al., 2009; Beuningen and Knorringa, 2009; Mollenar et al., 2010). In addition, aside from the potential benefits of RSPO certification to smallholders, local communities and indigenous people also gained positive impacts from the process. Nesadurai (2013) suggested that RSPO gives the local communities an opportunity of having their grievances heard and a chance of re-addressing their complaints, something that had previously been denied to local land claimants by state authorities or some plantation companies in Malaysia and Indonesia. This made it possible for the organization to be more responsive than governments regarding the land rights of rural and indigenous communities. Under RSPO regulation on land rights, indigenous local communities must be consulted, their consent given freely before planting or expansion can start, and consent must have been the result of open communication and exchange of information between the plantation and the community to allow well-informed decision making by claimants having legitimate rights to the land. Another RSPO standard that benefits local and indigenous communities is the requirement for auditors to consult directly with the local people to confirm that any land transfer and land use agreements possessed by the mill plantations have been obtained with the free, prior, and informed consent of the communities (RSPO, 2007).

11 The Impacts of RSPO on the Livelihood of Smallholders. Case Studies in East Malaysia 2015
However, RSPO’s potential as a sustainability regime for palm oil has also been criticized on a number of grounds. First, the organization has been seen as ineffective in enforcing its own sustainability criteria on its member firms A second criticism is that RSPO principles, rules and procedures do not go far enough in addressing climate change concerns centered on greenhouse gas emissions (McLaughlin, 2011; World Bank, 2011; Richardson, 2010). The larger plantation companies with transnational operations have started cutting back on previously announced oil palm expansion plans in anticipation of strict GHG emission criteria that would further raise production costs amidst softening prices for crude palm oil (Khor, 2013). A fourth criticism is that RSPO certification does not do enough to safeguard the land rights of rural and indigenous communities. A fifth charge is that sustainability certification is expensive and thus can exclude most of the smallholder farmers from the sustainable palm oil market, creating insecurities for these farmers (Colchester & Chao, 2011). These claims were further supported by studies conducted by several researchers. One uncertainty found in the certification system is the lack of commitment of international buyers to support the sustainable certification and few possibilities to shift part of the certification costs to the buyer. This uncertainty could be higher if more certified palm oil enters the market, while the demand for CSPO is not significantly changing. Further, the certification scheme does not change the price volatility with which smallholders need to cope. With this, certification–although generally leading to higher income–does not result in more stable income (Hidayat et al., 2015). World Growth (2013) also reported that certification generates costs that reduce the economic-viability of small-scale farmers. These costs include: training and monitoring, land assessments (e.g. HCV assessments and SEIA), certification and segregation costs. Aside from the costs, the lack of capacity and knowledge to cope with the complexities of the RSPO compliance standards, lack of organization, and the lack of incentives for smallholder certification were also seen to be challenges for RSPO certification (Brandi et al., 2013). Additionally, success in the potential benefits of certification is more difficult to achieve if farmers do not share similar backgrounds. This is because belongingness and organizational identity are essential components to cohesion and willingness to working together towards a shared goal (Hidayat et al., 2015).
12 The Impacts of RSPO on the Livelihood of Smallholders. Case Studies in East Malaysia 2015
CHAPTER3
METHODOLOGY
13 The Impacts of RSPO on the Livelihood of Smallholders. Case Studies in East Malaysia 2015
Chapter3.MethodologyConceptual Framework We developed a conceptual framework to illustrate the impact of RSPO certification on smallholders’ livelihood (Figure 3.1). This framework assumes that livelihood can be classified into three different aspects; economic, environment and social. These different aspects of livelihood are affected by endogenous and exogenous factors. Based on this framework, we hypothesize that RSPO certification standards improve the livelihood of the farmers through improvements and developments of agricultural practices and activities. This hypothesis is given further detail using three conjectures. Firstly, since the primary aim of RSPO is to ensure the sustainability of oil palm, agricultural practices and activities of farmers could be improved through training and services provided by RSPO certification. Further, farmers are also able to improve their farm management skills as well as identification of their skills development needs through the certification program. Moreover, the farmers could enhance their GAP (good agricultural practices) and way of working through the certification process. Concerned stakeholders that include NGOs, extension services from agencies and private plantation companies, also have a relationship with RSPO and farmers through provision of services and assistance, although the relationships may be indirect or arbitrary. Secondly, prior to the possible positive impacts of assistance and services provided by RSPO and concerned stakeholders, the improvements in the livelihood of the farmers are affected by exogenous factors referred to us as: (1) market volatility, which is the degree of variation of trading prices and economic trends that could further affect the price of the products, income and the production cost; (2) climate change, which is the change in the statistical distribution of weather patterns to which the change lasts over an extended period of time and affects the amount of rainfall, temperature and water availability in agriculture areas; (3) cultural aspect refers to the way of life of the farmers- their behaviors, values and beliefs that are passed from one generation to the next and affects the lifestyle and practices of farmers; and (4) government policies and regulations are those legislations that are implemented nationally or locally which the farmers abide. RSPO certification is hypothesized to help mitigate the negative impacts of these exogenous factors on farmers’ livelihood. Thirdly, existence of better agricultural practices and activities with the support of the RSPO certification process, along with assistance from other stakeholders, could improve livelihood. From the economic perspective, potential benefits include reduction of production cost, higher productivity, higher income, better product quality, better market access, increased capability to manage the risk of crop loss, better access to credit facilities and premium pricing. In terms of the environment, certification could help conserve natural resources, achieve a cleaner and more sustainable production, attain better soil, air and water quality, minimize waste and reduce open burning. From a social perspective, impacts of the program include improvement of social structures and facilities, better living and working conditions, improved lifestyle, better education and strong organization and cooperation among farmers.

14 The Impacts of RSPO on the Livelihood of Smallholders. Case Studies in East Malaysia 2015
Figure 3.1 Conceptual Framework1
Study Areas To date, there are three (3) independent smallholder groups that achieved RSPO certification: (1) Keresa Smallholder Group Scheme, (2) WAGS Beluran, Sabah, and (3) Wild Asia Group Scheme (WAGS) Air Kuning, Perak. Because the third smallholder group only recently received the certification (on 20 March 2015), our study only covered areas of Keresa Smallholder Group Scheme and WAGS-Malaysian Palm Oil Board (MPOB)’s Smallholder Palm Oil Cluster (SPOC) in East Malaysia.
1ExogenousfactorsaredrawnfromN.KHidayat,P.Glasbergen,andA.Offermans.SustainabilityCertificationandPalmOilSmallholders’
LIVELIHOOD
• MarketVolatility• ClimateChange• CulturalAspect• GovernmentPoliciesandRegulations
AgriculturalPracticesandActivities
RoundtableforSustainablePalmOil(RSPO)
NGOs
ExtensionServices
PrivatePlantationCompanies
ExogenousFactors
Economics Environment Social
• Costreduction• Higherproductivity
• Higherincome• Betterproductquality
• Increasemarketaccess
• Capabilitytomanagetheriskofcroploss
• Betteraccesstocreditfacilities
• Achievepremiumpricing
• Preservationofwildlife
• Conservationofnaturalresources
• Cleanerandmoresustainableproduction
• Bettersoil,airandwaterquality
• Improvewasteminimization
• Reductionofforestburningactivities
• Improvesocialstructures
• Betterfacilities• Betterlivingandworkingconditions
• Lessillnesses• Improvelifestyle• Bettereducation• Strongorganizationandcooperationamongfarmers
EndogenousFactors

15 The Impacts of RSPO on the Livelihood of Smallholders. Case Studies in East Malaysia 2015
Keresa Smallholder Group Scheme (KSGS) Keresa Smallholder Group Scheme, initiated and managed by Keresa Plantations and Mill Sdn. Bhd. (Keresa), is located in Lavang Land district, Sebauh sub-district, Bintulu, Sarawak, Malaysia (see Figure 3.2). It is situated approximately 85 km from Bintulu town. It is accessed via sealed road from Bintulu on the Bintulu-Miri Road heading north east.
Figure 3.2Geographical location of Keresa Plantations and Mill Sdn Bhd
Keresa is a Sarawak-based Bumiputra company which began as a rattan plantation in 1981. In 1996, the company started planting oil palm and is now currently engaged in oil palm plantations and milling. Currently, it owns 6,023 ha of land of which 5,347 ha is planted. Keresa Plantations’ aim to support sustainable management was achieved when the company’s membership application to RSPO was approved on 2 June 2009. On 21 October 2010, Keresa Plantations and Mill both obtained their RSPO Certification. In 2011, Keresa’s first independent smallholders became RSPO certified under Keresa Smallholders Group Scheme (KSGS). As of 2014, six longhouses were certified. The longhouses under KSGS certification are: Rumah Majang, Rumah Anchai, Rumah Iba, Rumah Ballrully, Rumah Lichong and Rumah Ambak (formerly known as Rumah Nuga). KSGS was established in October 2010. Keresa mill, through KSGS, provides extension services to certified smallholders in the form of guidance, training, and a credit facility. The project also extends its program through their corporate social responsibility by providing better road access and a bereavement gift to the smallholders. It also provides a fertilizer assistance scheme to certified smallholders where the company buys the fertilizer in bulk and sells to KSGS members on credit at a significantly lower price than the going market price. The company will gradually deduct the payment through FFB sales. Although KSGS members are not bound in any contract of selling their FFBs to Keresa, they are encouraged to do so and FFB prices are based on MPOB’s published prices (Figure 3.3).

16 The Impacts of RSPO on the Livelihood of Smallholders. Case Studies in East Malaysia 2015
Figure 3.3Social structure of smallholders in Keresa
WAGS-MPOB’s SPOC The WAGS-MPOB’s SPOC is located in Telupid Sub-District, Beluran, Sandakan, Sabah, Malaysia (hereinafter referred to as Sapi) (Figure 3.4). It is a formal collaboration between Wild Asia and MPOB to help support independent small farmers towards RSPO certification. That initiative is also supported by a member of RSPO – Wilmar International Limited, through its Sapi Palm Oil Mill in the local area. Wilmar International Limited, founded in 1991, is one of Asia’s leading agribusiness groups today. The company’s business activities include oil palm cultivation, oilseed crushing, edible oils refining, sugar milling and refining, specialty fats, oleochemicals, biodiesel and fertilizer manufacturing and grain processing. It is the global leader in processing and merchandising of oil palm and lauric oils, as well as production of oleochemicals, specialty fats, palm biodiesel and consumer pack oils. Wilmar has over 450 manufacturing plants in 18 countries and has an extensive distribution network covering China, India, Indonesia and some 50 other countries. The company advocates sustainable growth and is committed to its role as a responsible corporate citizen. Wilmar promotes sustainable palm oil production and is one of the first palm oil companies to achieve RSPO certification. The company attained its first certification for four estates and three mills in December 2008.
FFBs
RSPOCERTIFIEDSMALLHOLDERS
ExtensionServices
CorporateSocial
Responsibility
FertilizerAssistanceScheme
KERESAMILL
KSGS
17 The Impacts of RSPO on the Livelihood of Smallholders. Case Studies in East Malaysia 2015
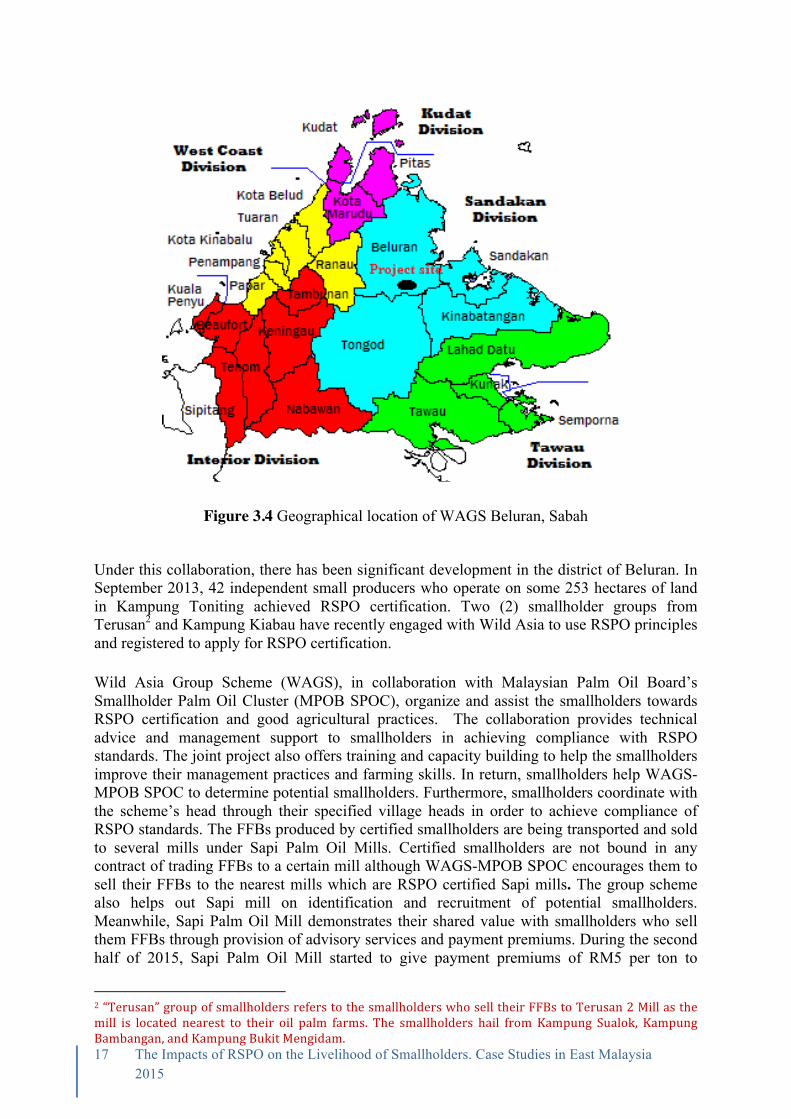
Figure 3.4 Geographical location of WAGS Beluran, Sabah
Under this collaboration, there has been significant development in the district of Beluran. In September 2013, 42 independent small producers who operate on some 253 hectares of land in Kampung Toniting achieved RSPO certification. Two (2) smallholder groups from Terusan2 and Kampung Kiabau have recently engaged with Wild Asia to use RSPO principles and registered to apply for RSPO certification. Wild Asia Group Scheme (WAGS), in collaboration with Malaysian Palm Oil Board’s Smallholder Palm Oil Cluster (MPOB SPOC), organize and assist the smallholders towards RSPO certification and good agricultural practices. The collaboration provides technical advice and management support to smallholders in achieving compliance with RSPO standards. The joint project also offers training and capacity building to help the smallholders improve their management practices and farming skills. In return, smallholders help WAGS-MPOB SPOC to determine potential smallholders. Furthermore, smallholders coordinate with the scheme’s head through their specified village heads in order to achieve compliance of RSPO standards. The FFBs produced by certified smallholders are being transported and sold to several mills under Sapi Palm Oil Mills. Certified smallholders are not bound in any contract of trading FFBs to a certain mill although WAGS-MPOB SPOC encourages them to sell their FFBs to the nearest mills which are RSPO certified Sapi mills. The group scheme also helps out Sapi mill on identification and recruitment of potential smallholders. Meanwhile, Sapi Palm Oil Mill demonstrates their shared value with smallholders who sell them FFBs through provision of advisory services and payment premiums. During the second half of 2015, Sapi Palm Oil Mill started to give payment premiums of RM5 per ton to
2“Terusan”groupofsmallholdersreferstothesmallholderswhoselltheirFFBstoTerusan2Millasthemill is located nearest to their oil palm farms. The smallholders hail from Kampung Sualok, KampungBambangan,andKampungBukitMengidam.

18 The Impacts of RSPO on the Livelihood of Smallholders. Case Studies in East Malaysia 2015
certified smallholders under the collaboration. The initiatives are supported by Sapi Palm Oil Mill through sponsorships like accommodation for WAGS’s staffs and subsidising rental of WAGS’s office (Figure 3.5).
Figure 3.5Social structure of smallholders in Sapi
Questionnaire Design Our initial questionnaire (in English) was developed through primary and secondary sources. The secondary sources like published work from both academic and non-academic researchers gave us an understanding of previous approaches and variables. The literature suggests that any impact assessment on sustainable livelihood should study variables underlying the three (3) constructs of sustainability – the environment, social, and economic. While the constructs are generally applicable, individual variables describing them need to be specified for reflecting their relevance to our study. The identified variables were then verified through primary sources – field observations and key informant interviews. For these purposes, we visited Keresa site on 2-4 July 2014. We met with Keresa’s management and selected individuals. An important agenda item was to understand how did Keresa’s approach promote, engage, and organize RSPO certification activities in relation to its independent smallholders. We were also introduced to the local independent smallholders in their longhouses by Keresa’s sustainability team. The aim was to explore RSPO impacts that were observed by the population. Through that discussion, we identified the need to tailor our questionnaire according to their socio-cultural background and translate our questions into their local language. We also travelled to observe the difference between certified and non-certified plots.
FFBs
WAGS-MPOBSPOC
RSPOCERTIFIEDSMALLHOLDERS SAPIPALMOIL
MILL
TechnicalAdvice
ManagementSupport
Training&CapacityBuilding
Advisoryservices
PaymentPremium(RM5/ton:kickedoff2Hof2015)
Sponsorship
PotentialSmallholders

19 The Impacts of RSPO on the Livelihood of Smallholders. Case Studies in East Malaysia 2015
The first draft of questionnaire was designed compounding insights from the literature, field observations, and key informant interviews. As that initial work was in English, it was later translated into Bahasa Melayu and incorporated Ibanese for certain key words (i.e. “pekerja” was translated to “kuli”). To check for reliability, we verified the translated the questionnaire through a focus group discussion (FGD) in Keresa. The FGD was conducted on 9 October 2014, involving eight certified smallholder representatives from five (5) longhouses out of six (6) certified smallholder groups (longhouses). The open-ended nature of the group discussions allowed us to cover unanticipated issues and explore areas not covered by the literature. We focused on obtaining information with regard to the impacts of RSPO certification on farmer’s livelihood. Other topical issues included farming practices, FFB production, environmental awareness, satisfaction and perceived benefits of certification. The FGD was recorded and analyzed. A key finding from the FGD was that certain questions were considered complex. In particular, the participants expressed difficulty in answering questions requiring them to rate their degree of agreement (1-5 Likert scale) to a statement. It was understood that, in their culture, things are simpler and straight forward. Moderating scales like “2” representing “somewhat disagree” and “4” representing “somewhat agree” posed a challenge. By leaving options to just “disagree”, “uncertain”, and “agree”, the participants turned out to be able to comprehend and be more participative, not to mention able to answer the questionnaire consistently. Through such an exercise, our translated questionnaire was refined. Pre-Test Before pre-testing the refined questionnaire, the work in Ibanese dialect was presented to Keresa’s sustainability team to keep them in loop of information that this study sought. As no issue was raised, we proceeded to pre-test the questionnaire on 24-27 February 2015. There were six (6) randomly selected respondents interviewed due to their proximity to Keresa. The respondents are from Rumah Majang, Rumah Ambak, Rumah Ballrully, and Rumah Iba. While there were no major issues with the refined questionnaire, the interview process in the pre-test was bit challenging. That was largely due to the difference between Bahasa Melayu spoken by us and Ibanese dialect used by the respondents. Consequently, the interviews were assisted by a staff member of Keresa’s sustainability team competent in local dialects. Such a need was also foreseen to arise in the forthcoming survey. This hence necessitated to employ enumerators from the local community in order to carry out the survey efficiently. Our pre-test continued with the smallholders in Sapi on 12-16 July 2015. There was a significant time gap between the first and the second work due to difficulties in getting access to local assistance and their availability. This hindrance was eventually cleared through Wilmar Prt Ltd’s goodwill and commitment to sustainability. The final questionnaire used on Keresa site was pre-tested with six (6) randomly selected respondents in Sapi. They were from Kampung Kiabau, Kampung Toniting, Kampung Ulu Sapi, Kampung Bukit Mengidam, and Kampung Sualok. It was noted that these respondents were able to comprehend our questions in Bahasa Melayu and they helped us localize some of the expressions (i.e. “selasing”, “karung” and “bibit”). In particular, respondents from Kampung Kiabau and Kampung Bukit Mengidam, and Kampung Sualok identified themselves as a new member of WAGS, who is in the process of getting RSPO certification.

20 The Impacts of RSPO on the Livelihood of Smallholders. Case Studies in East Malaysia 2015
This gave rise to a new category in addition to “RSPO certified member” and “non-RSPO member” in our questionnaire. The other questions remained relevant and were shared with Wilmar Prt Ltd and Wild Asia. Data Collection Our data collection processes involved enumerator training, sampling, and face-to-face interviews. This survey aimed to collect primary information using the final questionnaire. Enumerator training Enumerators were engaged to help collect information through face-to-face interviews. At Keresa, with the help of their sustainability team, we initially recruited eleven (11) local Ibanese competent in the local dialect. They were briefed on the questionnaire and trained for interview procedures on 12 March 2015. In the training, a mock interview was carried out among themselves. As the enumerators live in longhouses, they were encouraged to practice conducting the survey with their neighbors – oil palm producers residing in the same longhouse. We observed the entire interview proceedings in order to check the efficacy of the enumerators. It turned out that three (3) of them were incompetent and they voluntarily withdrew from the work. That reduced our survey team to eight (8) local enumerators. The abovementioned exercise also enabled us to meet and seek permission from the tuai rumah of longhouses to conduct the survey at their premise. It was also hoped that the chief would spread the word to potential respondents (residents) who lived under one roof. In Sapi, two (2) enumerators were recruited on 15 July 2015 with the help of Wild Asia. The processes of briefing and training were similar to those we did at Keresa. A difference was that these enumerators have vast experience in oil palm farming activities and required minimal supervision. They also served as a guide to reach our target villages and respondents. Sampling As mentioned at the outset, our target respondents3 were RSPO certified members (independent smallholders) and non-RSPO members. While a list of certified members under KSGS and WAGS- MPOB’s SPOC was provided, information on non-RSPO members was unavailable. Consequently, purposive sampling method was employed to ensure fair representation from both target groups. We aimed to interview approximately 100 independent smallholders at Keresa. The work was kicked off by first interviewing few a tuai rumah on 15 March 2015. That gave them an understanding of our questions in order for them to share with their fellow neighbors. Because the rest time of independent smallholders is inconsistent, the tuai rumah recommended that the enumerators should approach whoever is available in the longhouse during their visit. We followed and supervised the survey throughout the process. The survey at Keresa was completed on 27 March 2015. A total of 94 attempts were made and 76 respondents were finally interviewed. That represents a response rate of 81 percent. The respondents came from 10 longhouses: Rumah Ambak, Rumah Anchai (formerly known as Rumah Nuga), Rumah Ballrully, Rumah Edwin, Rumah Jam, Rumah Lichong, Rumah 3 The target respondents are decisionmakers in the householdwho, inmost cases, are the householdheads.
21 The Impacts of RSPO on the Livelihood of Smallholders. Case Studies in East Malaysia 2015
Mabung, Rumah Majang, Rumah Rentap, and Rumah Sanbang. Three (3) out of these 11 longhouses are certified RSPO members. Therefore, we obtained information from both RSPO certified members and non-RSPO members. Similarly, our sample size in Sapi was targeted to have approximately 100 respondents. Given that only two (2) enumerators were recruited, a researcher was actively involved in the survey. The survey started on 29 July 2015 and the first respondents were village heads who are also involved in oil palm farming. That was a critical move to pay our courtesy, seek their permission to conduct the survey in their village, and introduce us to other respondents (villagers). As villagers live in close proximity, getting access to a respondent led us to another respondent. Consequently, our survey proceeded smoothly. The survey in Sapi was accomplished and concluded on 13 August 2015. Out of 110 attempts, 100 voluntarily participated in the survey. As a result, the response rate was 91 percent. These respondents were distributed across 10 villages: Kampung Ulu Sapi, Kampung Toniting, Kampung Kiabau, Kampung Sualok, Kampung Bambangan, Kampung Bambangan 2, Kampung Bakong-Bakong, Kampung Bukit Mengidam, Kampung Manduring, and Kampung Kuala Sapi. Among them, most respondents from Kampung Toniting have achieved RSPO certification. The rest either just recently joined WAGS and in the process of getting RSPO certification or were non-RSPO members. As such, we obtained a fair representation of smallholder population in this study area. Data Analysis Descriptive Statistics The data were analyzed by using descriptive statistics. Descriptive statistics is a direct yet helpful way of describing the sample characteristics. The statistical results in this study are reported in tables that consist of fundamental statistics namely frequency, percentages, mean, standard deviations, median, minimum and maximum values. In some cases, the frequency and percentages are presented in diagrams (e.g. pie chart). Outliers were carefully assessed and excluded from our analysis. Mean and median are measures of central tendency, and standard deviation measures the dispersion of the data. In cases where the data distribution is skewed due to the presence of outliers, median would be a more appropriate measure of central tendency. T-Tests T-tests were conducted to examine statistical differences in mean of the variables analyzed between the certified and non-certified smallholders in our sample. For the case of Sapi, comparisons were made between certified and waiting-to-be certified smallholders, and non-certified smallholders. However, the t-test results were not elaborated in detail in the report. Calculation of Index In this study, indices are developed and calculated for selected constructs to help us understand smallholder’s farming practices and activities, their social engagements and also their perception on certain impacts of RSPO certification. Each construct is represented by a predetermined set of items or statements as indicated in Table 3.1. • Training

22 The Impacts of RSPO on the Livelihood of Smallholders. Case Studies in East Malaysia 2015
Training index is calculated by computing the total number of training programs attended by the smallholders on agricultural inputs, namely seed, fertilizer, pesticide and herbicide. The index has a range between 0 being the least and 4 being the most number of programs attended by them. If the resulting index is closer to 4, the value suggests that they have attended all training programs on agricultural inputs. In contrast, an index value closer to 0 suggests that the smallholders have not attended any training on the inputs. An index value closer to 4 is the most favorable index for the farmers.
Table 3.1 List of indices and number of items used to calculate the respective index
Index No. of items Training 4 PPE for Fertilizer 7 PPE for Herbicide 7 Best Management Practices (BMP) 9/10 Social Benefit 9 Participation of Women in Associations/Societies 13 Environmental Impact 10 Biodiversity and High Conservation Values (Bio-HCV) 7 Economic Benefit 9
• PPE for Fertilizer and Herbicide
Personal protective equipment (PPE) index is calculated by computing total number of PPE worn during the application of agricultural chemicals such as fertilizers and herbicide. PPE consists of gloves, coverall, apron, safety boots, head cover, goggles and protective mask. The index ranges from 0 to 7. If the resulting index value is 0, it indicates that the smallholders do not wear any PPE at all during the application of fertilizer and herbicide, making them highly vulnerable to safety and health problems. An index value of 7 indicates that the smallholders wear all types of PPE during chemical application and handling, thus minimizing safety and health risk. We developed two PPE indices for fertilizers and herbicides.
• Best Management Practice (BMP) BMP index is calculated by computing the total number of the BMPs adopted by the smallholders. The index has a range between 0 to 10 for Keresa and 0 to 9 for Sapi. The maximum index for Sapi is lower because we excluded the item related to wild animals. Higher index value implies more adoption of BMPs.
• Social Benefit Social benefit index is calculated by computing the mean value of the statements representing perceived social benefits of RSPO certification. Each statement related to perceived social benefit is assigned a value of 1 if the respondent agrees to the statement, -1 if the respondent disagrees, and 0 if the respondent is uncertain. The mean value is computed by vertically summing the values of all responses divided by the total number of items. The index has a range between -1 and 1. Index value close to -1 suggests that perceived social benefits of RSPO certification is very low or almost non-existence. If the index value is closer to 1, the perceived social benefits gained through RSPO certification are high. Index value close to 0 indicates respondent’s uncertainty towards the social benefits of RSPO certification.
• Rights index for women smallholders

23 The Impacts of RSPO on the Livelihood of Smallholders. Case Studies in East Malaysia 2015
Rights index is calculated by computing the mean value of the items measuring women’s rights that include participation in household decision-making, community involvement, and also access to certain facilities. Each item is assigned a value of 1 if the respondent answered yes, -1 if the respondent answered no, and 0 if the respondent is uncertain. The mean value is calculated by vertically summing the values of all responses divided by the total number of items. The equality index has a range between -1 and 1. Index value close to -1 suggests women’s rights among smallholders’ female spouse are low while index value close to 1 indicates equal rights. Index value closer to 0 implies that female respondents are mostly uncertain about their rights.
• Environmental Impact The environmental impact index is developed to better understand smallholder’s perception of the environmental impacts of RSPO certification. We calculated the index by computing the mean value of all items measuring environmental impacts. Each environmental impact statement is assigned a value of 1 if the respondent agrees to the statement, -1 if the respondent disagrees, and 0 if the respondent is uncertain. The environmental impact index takes a value between -1 to 1, where -1 indicates no or extremely low environmental impact and 1 indicates very high impact. Meanwhile, index value closer to 0 indicates that the smallholders are uncertain about the environmental impacts of RSPO certification.
• Biodiversity and High Conservation Values (Bio-HCV) The Bio-HCV index is calculated by computing the mean value for all the statements measuring the contribution of RSPO certification towards the preservation of biodiversity and high conservation value. Each statement is assigned a value of 1 if the respondent agrees to the statement, -1 if the respondent disagrees, and 0 if the respondent is uncertain. The mean Bio-HCV index takes a value between -1 to 1, where -1 indicates no or extremely low Bio-HCV impact and 1 indicates very high impact.
• Economic Benefit Economic benefit index is developed by computing the mean value of statements representing perceived economic benefits of RSPO certification. Each economic benefit statement is assigned a value of 1 if the respondent agrees to the statement, -1 if the respondent disagrees, and 0 if the respondent is uncertain. The mean value is calculated by vertically summing the values of all responses divided by the total number of items. The index has range between -1 and 1. Index value close to -1 suggests low perceived economic benefits of certification, while an index closer to 1 implies high benefits. An index value closer to 0 suggests that smallholders are uncertain of the economic benefits of certification.
24 The Impacts of RSPO on the Livelihood of Smallholders. Case Studies in East Malaysia 2015
CHAPTER4
FINDINGSFROMKERESA

25 The Impacts of RSPO on the Livelihood of Smallholders. Case Studies in East Malaysia 2015
Chapter4.FindingsfromKeresaBackground of Respondents Demographics Table 4.1 presents the demographic profile of the respondents in Keresa. There were 70 (92.11%) male and 6 (7.89%) female respondents interviewed in the sampling area. The observation suggests that oil palm is still dominated by male farmers. With regards to age of household head, mean age of the respondents from Keresa was 54.51 years old. In addition, there were more respondents who belong to the age groups of 51-60 years old and 60 years old and above. In term of household size, Keresa has a mean household size of 5 persons. As for race or ethnicity, we interviewed 75 (98.68%) Ibanese and 1 (1.32%) Malay. Most of the respondents (92.11%) are married while the rest are single (2.63%) or widowed (5.26%). As for educational background, there were 43 (56.58%) respondents who did not receive formal education. Nevertheless, there were smaller number of respondents who attended primary/religious schools, and obtained their SRP/PMR and SPM certificates. Most respondents are full-time oil palm growers (84.21%). In addition, there are also some respondents employed as estate officers and workers, teachers, security guards, storekeepers, engineers, shopkeepers and office clerks. In terms of farming experience, respondents in Keresa have a mean farming experience of approximately 8 years.
Table 4.1 Demographic profile of the respondents in Keresa
Variable Keresa n %
Gender Male 70 92.11 Female 6 7.89 Total 76 100 Household Head Age Group 30 years and below 2 2.63 31– 40 years 5 6.58 41 – 50 years 20 26.32 51 – 60 years 24 31.58 Above 60 years 25 32.89 Total 76 100 Mean 54.51 Standard Deviation 11.59 Minimum 26 Maximum 90 Household Size Group 1 – 3 15 19.74 4 – 6 41 53.95 7 – 9 20 26.32 Total 76 100 Mean 5.26 Standard Deviation 1.81 Minimum 2 Maximum 8

26 The Impacts of RSPO on the Livelihood of Smallholders. Case Studies in East Malaysia 2015
(Continued) Race/Ethnicity Ibanese 75 98.68 Malay 1 1.32 Total 76 100 Marital Status Single 2 2.63 Married 70 92.11 Widow/Widower 4 5.26 Total 76 100 Level of Education Did not receive formal education 43 56.58 Primary/Religious 16 21.05 SRP/PMR 5 6.58 SPM 8 10.53 STPM/Certificate/Diploma 3 3.95 University Degree 1 1.32 Total 76 100 Occupation Farmer (full time) 64 84.21 Others 12 15.79 Total 76 100 Farming Experience 1 – 3 years - - 4 – 6 years 24 31.58 7 – 9 years 25 32.89 10 – 12 years 22 28.95 13 – 15 years 4 5.26 16 – 18 years 1 1.32 Total 76 100 Mean 8.34 Standard Deviation 3.11 Minimum 4 Maximum 17 RSPO Exposure During the interview, we asked the respondents several questions regarding their prior exposure or knowledge of RSPO, application for RSPO certification, and factors for getting their farms certified by RSPO. The findings revealed that 69.74% of respondents interviewed have heard of RSPO previously, some as early as 2009 (Figure 4.1). However, most of the respondents exposed to RSPO heard of it for the first time in 2012.
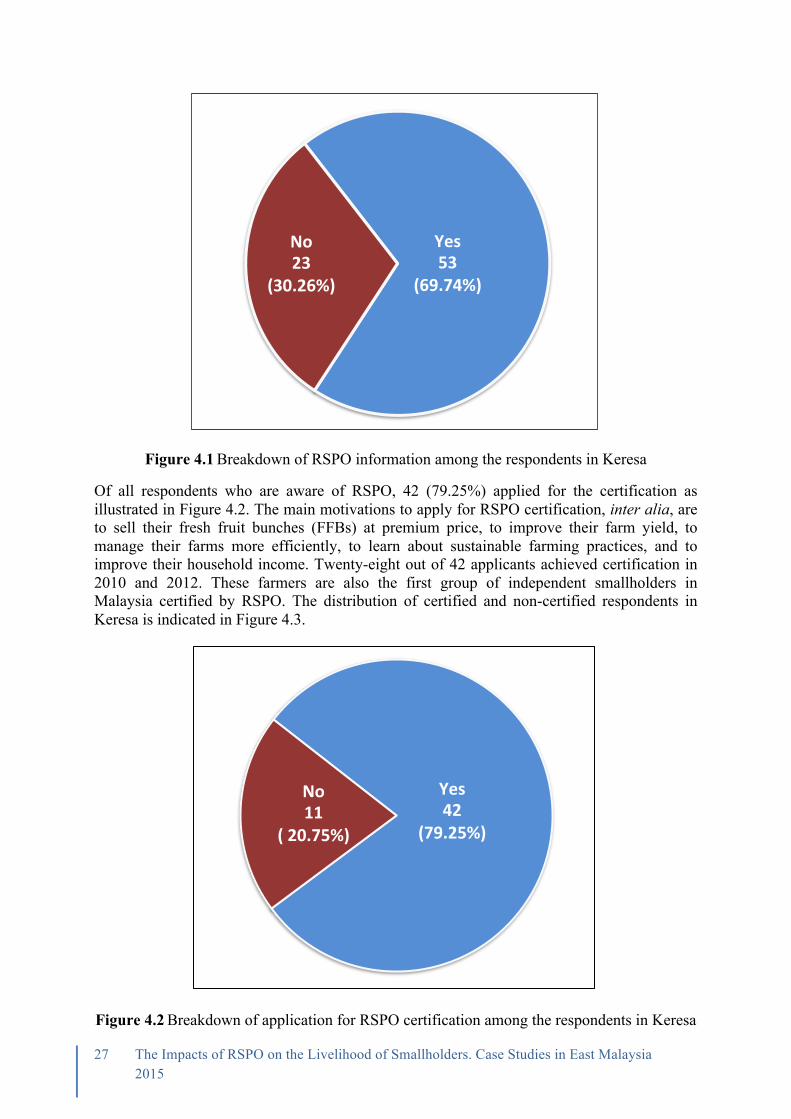
27 The Impacts of RSPO on the Livelihood of Smallholders. Case Studies in East Malaysia 2015
Figure 4.1Breakdown of RSPO information among the respondents in Keresa
Of all respondents who are aware of RSPO, 42 (79.25%) applied for the certification as illustrated in Figure 4.2. The main motivations to apply for RSPO certification, inter alia, are to sell their fresh fruit bunches (FFBs) at premium price, to improve their farm yield, to manage their farms more efficiently, to learn about sustainable farming practices, and to improve their household income. Twenty-eight out of 42 applicants achieved certification in 2010 and 2012. These farmers are also the first group of independent smallholders in Malaysia certified by RSPO. The distribution of certified and non-certified respondents in Keresa is indicated in Figure 4.3.
Figure 4.2Breakdown of application for RSPO certification among the respondents in Keresa
Yes53
(69.74%)
No23
(30.26%)
Yes42
(79.25%)
No11
(20.75%)

28 The Impacts of RSPO on the Livelihood of Smallholders. Case Studies in East Malaysia 2015
Figure 4.3Breakdown of RSPO certified and non-certified respondents in Keresa
Farming Practice Farm Profile Farm profile discusses total hectarage, land change, and age of trees in smallholder’s farms. Table 4.2 reports the summary statistics for total hectarage of smallholder’s land in Keresa. The mean land size for certified farmers is 6.64 ha, which is slightly larger than the mean land size of non-certified farmers (3.49 ha). Table 4.2Summary statistics for total hectarage of smallholder’s land in Keresa
Smallholder n Mean Std. Dev. Median Min Max Certified 28 6.64 4.38 5.27 0.60 16.91 Non-Certified 43 3.49 2.28 2.87 0.88 9.62 Total 71 4.73 3.60 3.45 0.60 16.91 Ha : Meancertified – Meannon-certified > 0; t-stat = 3.976, p-value = 0.0001 Certified smallholders began planting oil palm trees as early as 2002 while the earliest planting for non-certified smallholders started in 2003. As for land change, the result in Table 4.3 suggests that, on average, the certified and non-certified farmers increased their land size by 5.11 ha and 5.60 ha, respectively. Table 4.3 Change in smallholder’s land size in Keresa
Smallholder n Mean Std. Dev. Median Min Max Certified 12 5.11 3.09 3.92 1.79 11.30 Non-Certified 14 5.60 7.71 2.51 0.45 27.00 Total 26 5.37 5.93 3.13 0.45 27.00
CerBfied28
(36.84%)
Non-CerBfied
48(63.16%)

29 The Impacts of RSPO on the Livelihood of Smallholders. Case Studies in East Malaysia 2015
The increase in oil palm land size can generally be attributed to the high returns of oil palm cultivation and also the availability of farm land due to land transfer by genealogy and inheritance. There are farmers who manage more than one plot of land. From the interviews during field observation, the respondents reported that the rationale for having more than a plot is to provide a buffer for the gap between replanting and harvest. Replanting could be carried out progressively and the smallholders would still be able to harvest from remaining plot(s). This practice ensures continuous stream of income for the smallholders to sustain their livelihood even when replanting. The trees planted in the smallholders’ farm are generally divided into four categories: immature, young mature, young prime and old trees. Trees under three years of age are classified as immature. Young mature trees grow between three to six years of age and young prime trees grow from seven to twenty years of age, producing the most fruits. After twenty years, the trees are classified as old and are economically less productive, usually qualifying them for replanting. Ages of trees from the sampling area are presented in Table 4.4. Table 4.4 Frequency and percentages of age of trees categories in Keresa
Smallholder Tree Age Category
Less than 3 years
3 – 6 years
7 – 20 years
Above 20 years
Certified - 13 24 - - (35.14) (64.86) -
Non-Certified 2 19 16 2 (5.13) (48.72) (41.03) (5.13)
Total 2 32 40 2 (2.63) (42.11) (52.63) (2.63)
Note: Figures in brackets are percentages. Based on the table, most certified farmers have trees standing in their farms at young prime age where the trees are at their highest productive capacity. For non-certified farmers, most of the trees belong to young mature age category. Farm Management Farm management looks at several practices adopted by the smallholders such as land clearing methods, application of herbicides and fertilizers, training on agricultural inputs, use of personal protective equipment (PPE), storage for agricultural inputs, and best management practices (BMP). Table 4.5 Land clearing methods in Keresa
Smallholder Land Clearing Methods Manual (Slashing) Machine Burning
Certified 28 23 - (100.00) (82.14)
Non-Certified 44 35 - (91.67) (72.92)
Total 72 58 - (94.74) (76.32)
Note: Note: ncertified=28; nnon-certified=48 Note: Figures in brackets represent the percentage of farmers using a particular method.

30 The Impacts of RSPO on the Livelihood of Smallholders. Case Studies in East Malaysia 2015
Figures in Table 4.5 describe the farm land clearing methods adopted by the smallholders. All certified farmers clear the land manually by slashing. According to these farmers, the manual clearing method offers an incentive for them to reduce farm expenditure without having to hire farm workers and to apply chemicals (e.g. paraquat) to clear the land. As for the use of machinery, the percentage of certified farmers (82.14%) who employ machinery for land clearing is higher than the non-certified farmers (72.92%). No burning was reported for opening up new land after 2012. Further evidence is rendered in Table 4.4, where almost all respondents, except for 2 non-certified ones, reported age of trees of less than 3 years. Table 4.6Summary statistics of annual herbicide application per hectare (liter) in 2014 by smallholders in Keresa
Smallholder n Mean Std. Dev. Median Min Max Certified 26 6.64 4.48 6.10 1.05 16.00 Non-Certified 46 13.82 10.36 11.00 1.21 41.60 Total 72 16.39 30.22 7.90 1.05 41.60 Ha : Meancertified – Meannon-certified > 0; t-stat = -3.353, p-value = 0.0006 Table 4.7Summary statistics of annual fertilizer application per hectare (kg/ha) in 2014 by smallholders in Keresa
Smallholder n Mean Std. Dev. Median Min Max Certified 22 197 135 158 17 500 Non-Certified 40 161 94 156 6 390 Total 62 173 110 156 6 500 Ha : Meancertified – Meannon-certified > 0; t-stat = 1.228, p-value = 0.112 Note: One observation of certified farmers was excluded due to missing value. Applications of agricultural inputs are indicated by figures in Table 4.6 and Table 4.7. Certified farmers applied less herbicide (L/ha) at their farms than the non-certified farmers. Low amount of herbicide application by the certified farmers could be partly contributed by practical information earned from training programs provided by the Keresa sustainability team. However, mean annual fertilizer application (kg/ha) by the certified farmers was much higher than the non-certified farmers. Higher amounts of fertilizer application, as long as it does not exceed the optimal application amount, would increase tree productivity. Nevertheless, the increase in the amounts of fertilizer would also increase farm expenditure.

31 The Impacts of RSPO on the Livelihood of Smallholders. Case Studies in East Malaysia 2015
Table 4.8Percentage of smallholders who have attended agricultural input training programs in Keresa
Agricultural Input Training
Smallholder Certified (%) Non-Certified (%)
Seed 26.92 27.27 Fertilizer 84.62 58.70 Pesticide 20.00 27.27 Herbicide 85.19 52.17 Note: ncertified=26; nnon-certified=44 Further to input application, it is also important to note the farmer’s participation in training programs that are specifically tailored to promote correct use of farm inputs. Table 4.8 presents the percentage of smallholders who have attended agricultural input training programs in Keresa. The majority of certified farmers attended training programs on fertilizer and herbicide. However, the percentage of certified farmers who attended the training for seed and pesticide application are quite low. These programs are important for the farmers to learn the correct methods of applying agricultural inputs to promote better farm productivity and soil fertility. Our field observations also indicated that the Keresa sustainability team works closely with the farmers to understand their training needs and to constantly monitor correct use of agricultural inputs. Table 4.9Training index for smallholders attending agricultural input training in Keresa
Smallholder n Mean Std. Dev. Certified 25 2.120 1.092 Non-Certified 44 1.613 1.631 Total 69 1.797 1.471 Ha : Meancertified – Meannon-certified > 0; t-stat = 1.384, p-value = 0.086
Note: Seven observations were excluded due to missing values. A training index is developed by computing the total number of training programs on seed, fertilizer, pesticide and herbicide attended by the smallholders. The index has a range between 0 (being the least) and 4 (being the most number of programs attended by the farmers). Table 4.9 presents the mean and standard deviation of training index calculated for both certified and non-certified farmers. On average, the certified farmers have a higher mean training index than the non-certified ones. The mean training index for certified farmers is still nevertheless far less than 4. Upon further examination (as illustrated in Table 4.8), we can see the low index is attributed to low participation of certified farmers in seed and pesticide training. Table 4.10PPE Index for applying fertilizers in Keresa
Smallholder n Mean Std. Dev. Certified 28 2.179 1.124 Non-Certified 48 2.229 1.292 Total 76 2.211 1.225 Ha : Meancertified – Meannon-certified > 0; t-stat = -0.173, p-value = 0.432
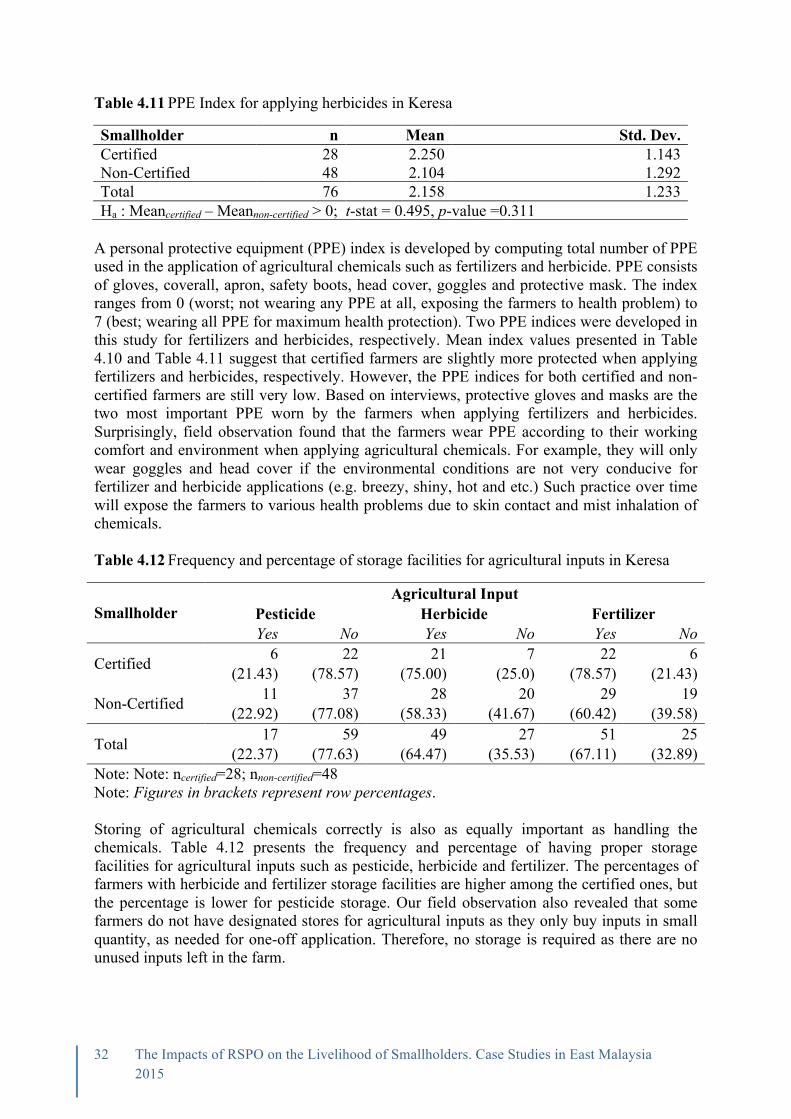
32 The Impacts of RSPO on the Livelihood of Smallholders. Case Studies in East Malaysia 2015
Table 4.11PPE Index for applying herbicides in Keresa
Smallholder n Mean Std. Dev. Certified 28 2.250 1.143 Non-Certified 48 2.104 1.292 Total 76 2.158 1.233 Ha : Meancertified – Meannon-certified > 0; t-stat = 0.495, p-value =0.311
A personal protective equipment (PPE) index is developed by computing total number of PPE used in the application of agricultural chemicals such as fertilizers and herbicide. PPE consists of gloves, coverall, apron, safety boots, head cover, goggles and protective mask. The index ranges from 0 (worst; not wearing any PPE at all, exposing the farmers to health problem) to 7 (best; wearing all PPE for maximum health protection). Two PPE indices were developed in this study for fertilizers and herbicides, respectively. Mean index values presented in Table 4.10 and Table 4.11 suggest that certified farmers are slightly more protected when applying fertilizers and herbicides, respectively. However, the PPE indices for both certified and non-certified farmers are still very low. Based on interviews, protective gloves and masks are the two most important PPE worn by the farmers when applying fertilizers and herbicides. Surprisingly, field observation found that the farmers wear PPE according to their working comfort and environment when applying agricultural chemicals. For example, they will only wear goggles and head cover if the environmental conditions are not very conducive for fertilizer and herbicide applications (e.g. breezy, shiny, hot and etc.) Such practice over time will expose the farmers to various health problems due to skin contact and mist inhalation of chemicals. Table 4.12Frequency and percentage of storage facilities for agricultural inputs in Keresa
Smallholder Agricultural Input
Pesticide Herbicide Fertilizer Yes No Yes No Yes No
Certified 6 22 21 7 22 6 (21.43) (78.57) (75.00) (25.0) (78.57) (21.43)
Non-Certified 11 37 28 20 29 19 (22.92) (77.08) (58.33) (41.67) (60.42) (39.58)
Total 17 59 49 27 51 25 (22.37) (77.63) (64.47) (35.53) (67.11) (32.89)
Note: Note: ncertified=28; nnon-certified=48 Note: Figures in brackets represent row percentages. Storing of agricultural chemicals correctly is also as equally important as handling the chemicals. Table 4.12 presents the frequency and percentage of having proper storage facilities for agricultural inputs such as pesticide, herbicide and fertilizer. The percentages of farmers with herbicide and fertilizer storage facilities are higher among the certified ones, but the percentage is lower for pesticide storage. Our field observation also revealed that some farmers do not have designated stores for agricultural inputs as they only buy inputs in small quantity, as needed for one-off application. Therefore, no storage is required as there are no unused inputs left in the farm.
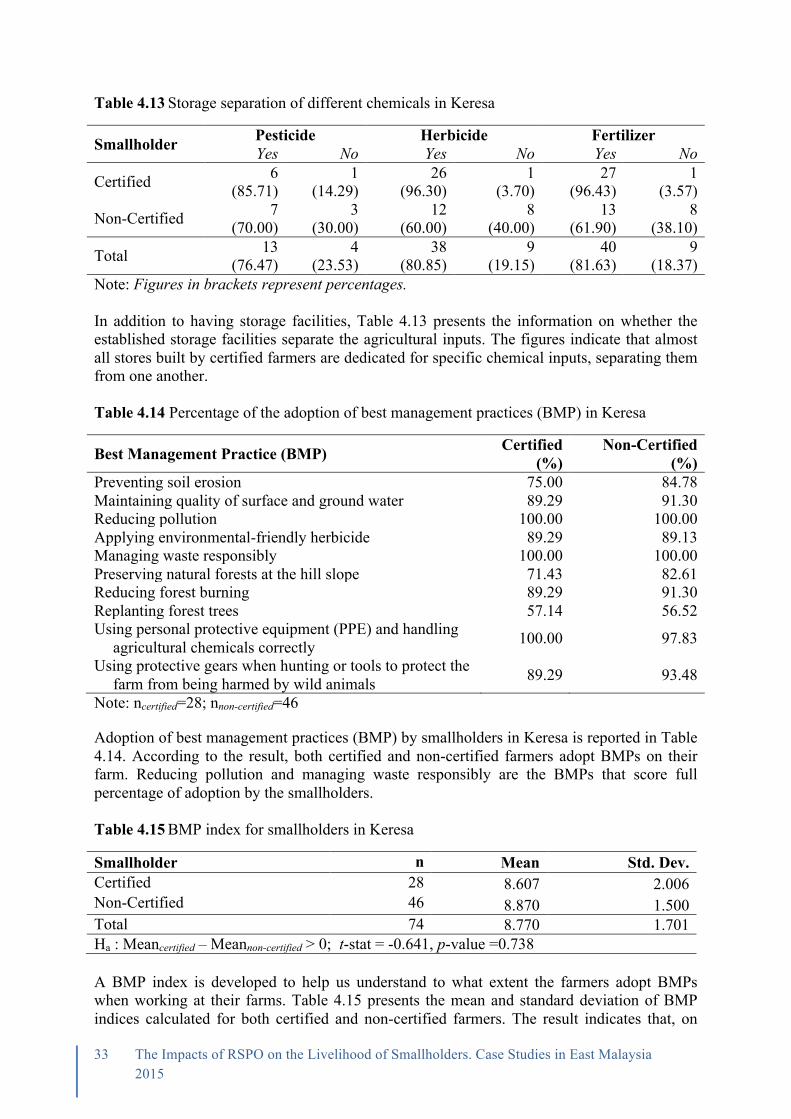
33 The Impacts of RSPO on the Livelihood of Smallholders. Case Studies in East Malaysia 2015
Table 4.13Storage separation of different chemicals in Keresa
Smallholder Pesticide Herbicide Fertilizer Yes No Yes No Yes No
Certified 6 1 26 1 27 1 (85.71) (14.29) (96.30) (3.70) (96.43) (3.57)
Non-Certified 7 3 12 8 13 8 (70.00) (30.00) (60.00) (40.00) (61.90) (38.10)
Total 13 4 38 9 40 9 (76.47) (23.53) (80.85) (19.15) (81.63) (18.37)
Note: Figures in brackets represent percentages. In addition to having storage facilities, Table 4.13 presents the information on whether the established storage facilities separate the agricultural inputs. The figures indicate that almost all stores built by certified farmers are dedicated for specific chemical inputs, separating them from one another. Table 4.14 Percentage of the adoption of best management practices (BMP) in Keresa
Best Management Practice (BMP) Certified (%)
Non-Certified (%)
Preventing soil erosion 75.00 84.78 Maintaining quality of surface and ground water 89.29 91.30 Reducing pollution 100.00 100.00 Applying environmental-friendly herbicide 89.29 89.13 Managing waste responsibly 100.00 100.00 Preserving natural forests at the hill slope 71.43 82.61 Reducing forest burning 89.29 91.30 Replanting forest trees 57.14 56.52 Using personal protective equipment (PPE) and handling
agricultural chemicals correctly 100.00 97.83
Using protective gears when hunting or tools to protect the farm from being harmed by wild animals 89.29 93.48
Note: ncertified=28; nnon-certified=46
Adoption of best management practices (BMP) by smallholders in Keresa is reported in Table 4.14. According to the result, both certified and non-certified farmers adopt BMPs on their farm. Reducing pollution and managing waste responsibly are the BMPs that score full percentage of adoption by the smallholders. Table 4.15BMP index for smallholders in Keresa
Smallholder n Mean Std. Dev. Certified 28 8.607 2.006 Non-Certified 46 8.870 1.500 Total 74 8.770 1.701 Ha : Meancertified – Meannon-certified > 0; t-stat = -0.641, p-value =0.738 A BMP index is developed to help us understand to what extent the farmers adopt BMPs when working at their farms. Table 4.15 presents the mean and standard deviation of BMP indices calculated for both certified and non-certified farmers. The result indicates that, on

34 The Impacts of RSPO on the Livelihood of Smallholders. Case Studies in East Malaysia 2015
average, the non-certified farmers have better adoption of BMPs in their farm in comparison with the certified farmers. The index appears to be higher for non-certified farmers probably due to their needs to address individual farm issues such as soil runoff, erosion and slope planting. Social Impacts Table 4.16Percentage of ‘Agree’ responses to the statements regarding the social benefits of RSPO certification in Keresa
Statement Certified (%)
Non-Certified (%)
I think that through RSPO certification, cooperation among smallholders improves 81.82 31.58 relationship between smallholders and millers improves 77.27 31.58 smallholder’s health improves 63.64 28.95 smallholder’s knowledge on farm practice improves 81.82 34.21 education facilities improve 54.55 23.68 healthcare facilities improve 77.27 23.68 food security at home improves 68.18 23.68 agricultural activities are getting environmentally
friendlier 77.27 34.21 I have better road access 81.82 31.58
Note: (ncertified=22, nnon-certified=38). According to the social benefit index (Table 4.17), certified RSPO members (0.692) were of greater agreement that RSPO certification is beneficial in terms of social aspects than non-members (0.213). Such perception is underpinned by their experience in relation to their improved association with smallholders and millers, and enhanced standard of living through access to public amenities. These social benefits were largely derived from Keresa’s goodwill to improve the current state of sustainable development among local communities. Table 4.17Social benefit index for smallholders in Keresa
n Mean Std. Dev. Certified 22 0.692 0.385 Non-Certified 38 0.213 0.479 Total 60 0.389 0.501 Ha : Meancertified – Meannon-certified > 0; t-stat = 3.991, p-value = 0.0001
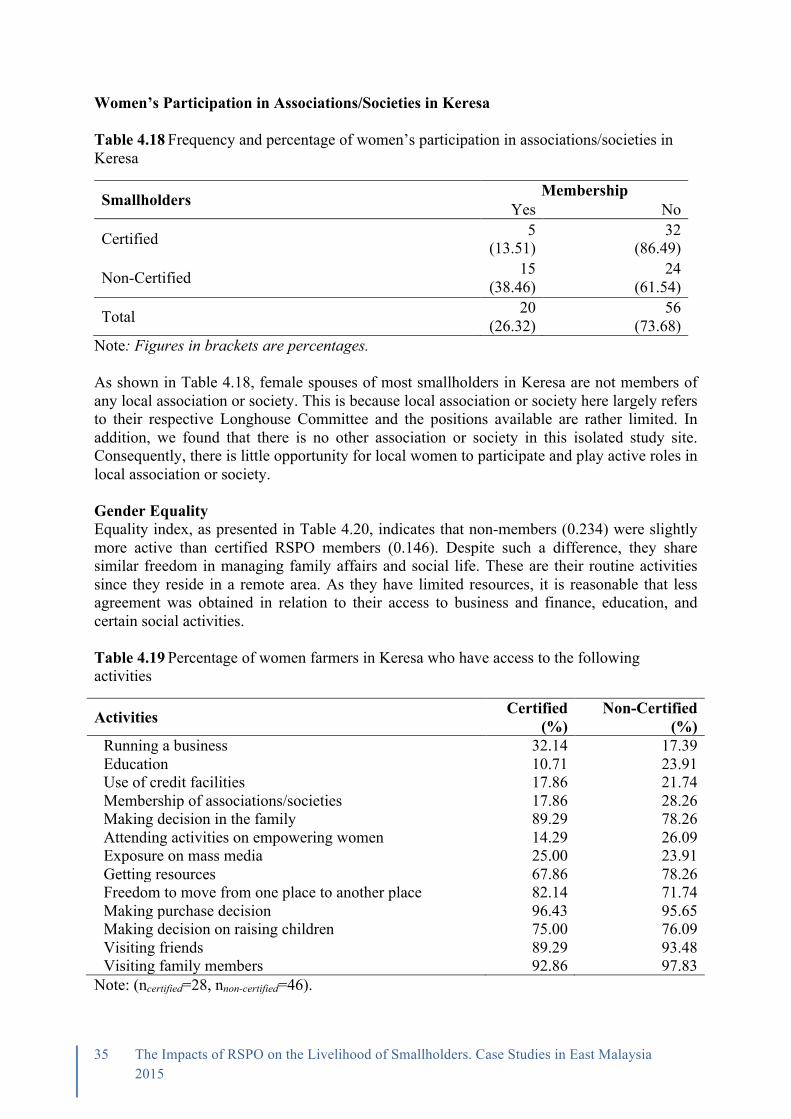
35 The Impacts of RSPO on the Livelihood of Smallholders. Case Studies in East Malaysia 2015
Women’s Participation in Associations/Societies in Keresa Table 4.18Frequency and percentage of women’s participation in associations/societies in Keresa
Smallholders Membership Yes No
Certified 5 (13.51)
32 (86.49)
Non-Certified 15 (38.46)
24 (61.54)
Total 20 (26.32)
56 (73.68)
Note: Figures in brackets are percentages. As shown in Table 4.18, female spouses of most smallholders in Keresa are not members of any local association or society. This is because local association or society here largely refers to their respective Longhouse Committee and the positions available are rather limited. In addition, we found that there is no other association or society in this isolated study site. Consequently, there is little opportunity for local women to participate and play active roles in local association or society. Gender Equality Equality index, as presented in Table 4.20, indicates that non-members (0.234) were slightly more active than certified RSPO members (0.146). Despite such a difference, they share similar freedom in managing family affairs and social life. These are their routine activities since they reside in a remote area. As they have limited resources, it is reasonable that less agreement was obtained in relation to their access to business and finance, education, and certain social activities. Table 4.19Percentage of women farmers in Keresa who have access to the following activities
Activities Certified (%)
Non-Certified (%)
Running a business 32.14 17.39 Education 10.71 23.91 Use of credit facilities 17.86 21.74 Membership of associations/societies 17.86 28.26 Making decision in the family 89.29 78.26 Attending activities on empowering women 14.29 26.09 Exposure on mass media 25.00 23.91 Getting resources 67.86 78.26 Freedom to move from one place to another place 82.14 71.74 Making purchase decision 96.43 95.65 Making decision on raising children 75.00 76.09 Visiting friends 89.29 93.48 Visiting family members 92.86 97.83
Note: (ncertified=28, nnon-certified=46).

36 The Impacts of RSPO on the Livelihood of Smallholders. Case Studies in East Malaysia 2015
Table 4.20Equality index for women smallholders in Keresa
n Mean Std. Dev. Certified 28 0.146 0.252 Non-Certified 46 0.234 0.359 Total 74 0.201 0.324 Ha : Meancertified – Meannon-certified > 0; t-stat = -1.144, p-value = 0.128 Environmental Impacts Table 4.21 reports the percentages of “agree” responses of certified (n=31) and non-certified (n=29) smallholders on different aspects of environmental impact of RSPO certification in Keresa. The result indicates that the majority of certified smallholders have a higher percentage of “agree” responses compared to the non-certified ones. This also suggests that the perceived impact of RSPO certification on the environment is largely positive. However, it is noticeable that a lower percentage of certified smallholders (18.18%) thought that wild animals surrounding their farms are protected. Furthermore, lower agreement was obtained for both certified and non-certified smallholders on the perception that natural habitats surrounding their farms will be protected. This might be because even though Keresa farmers live near forested areas where they could apply the RSPO P&C, they are still casually involved in hunting certain wild animals for food. Table 4.21Percentage of ‘Agree’ responses to the statements regarding the environmental impacts of RSPO certification in Keresa
Statement Certified (%)
Non-Certified (%)
I think that through RSPO certification... my farm practice is becoming/will be more
environmentally friendly 86.36 57.89
soil fertility in my farm improved/will improve 72.73 50.00 animals and plants surrounding my farm are
protected/will be protected 18.18 39.47
wild animals surrounding my farm are protected/will be protected 27.27 28.95
aquatics surrounding my farm are protected/will be protected 59.09 36.84
waste management in my farm improved/ will improve 90.91 47.37 water pollution is reduced/will be reduced 63.64 39.47 air pollution is reduced/will be reduced 77.27 50.00 land is conserved/will be better conserved 81.82 52.63 deforestation is reduced/will be reduced 77.27 50.00
Note: (ncertified=22, nnon-certified=38)
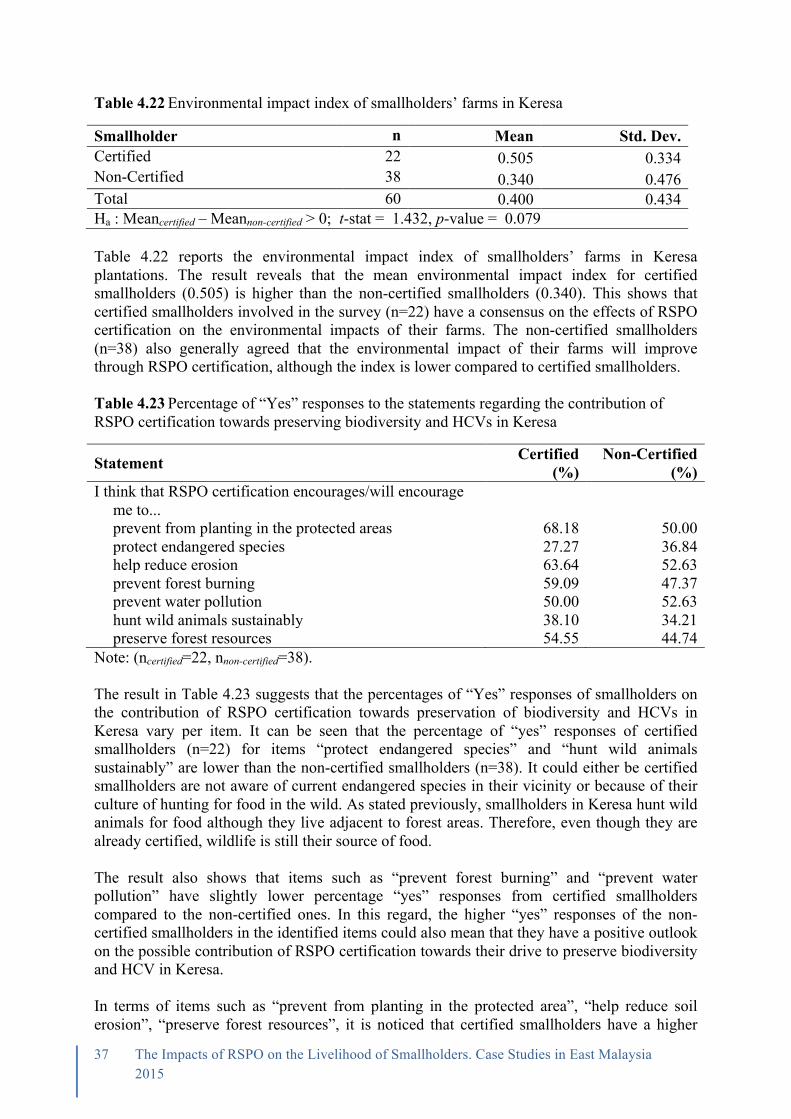
37 The Impacts of RSPO on the Livelihood of Smallholders. Case Studies in East Malaysia 2015
Table 4.22Environmental impact index of smallholders’ farms in Keresa
Smallholder n Mean Std. Dev. Certified 22 0.505 0.334 Non-Certified 38 0.340 0.476 Total 60 0.400 0.434 Ha : Meancertified – Meannon-certified > 0; t-stat = 1.432, p-value = 0.079 Table 4.22 reports the environmental impact index of smallholders’ farms in Keresa plantations. The result reveals that the mean environmental impact index for certified smallholders (0.505) is higher than the non-certified smallholders (0.340). This shows that certified smallholders involved in the survey (n=22) have a consensus on the effects of RSPO certification on the environmental impacts of their farms. The non-certified smallholders (n=38) also generally agreed that the environmental impact of their farms will improve through RSPO certification, although the index is lower compared to certified smallholders. Table 4.23Percentage of “Yes” responses to the statements regarding the contribution of RSPO certification towards preserving biodiversity and HCVs in Keresa
Statement Certified (%)
Non-Certified (%)
I think that RSPO certification encourages/will encourage me to... prevent from planting in the protected areas 68.18 50.00 protect endangered species 27.27 36.84 help reduce erosion 63.64 52.63 prevent forest burning 59.09 47.37 prevent water pollution 50.00 52.63 hunt wild animals sustainably 38.10 34.21 preserve forest resources 54.55 44.74
Note: (ncertified=22, nnon-certified=38). The result in Table 4.23 suggests that the percentages of “Yes” responses of smallholders on the contribution of RSPO certification towards preservation of biodiversity and HCVs in Keresa vary per item. It can be seen that the percentage of “yes” responses of certified smallholders (n=22) for items “protect endangered species” and “hunt wild animals sustainably” are lower than the non-certified smallholders (n=38). It could either be certified smallholders are not aware of current endangered species in their vicinity or because of their culture of hunting for food in the wild. As stated previously, smallholders in Keresa hunt wild animals for food although they live adjacent to forest areas. Therefore, even though they are already certified, wildlife is still their source of food. The result also shows that items such as “prevent forest burning” and “prevent water pollution” have slightly lower percentage “yes” responses from certified smallholders compared to the non-certified ones. In this regard, the higher “yes” responses of the non-certified smallholders in the identified items could also mean that they have a positive outlook on the possible contribution of RSPO certification towards their drive to preserve biodiversity and HCV in Keresa. In terms of items such as “prevent from planting in the protected area”, “help reduce soil erosion”, “preserve forest resources”, it is noticed that certified smallholders have a higher

38 The Impacts of RSPO on the Livelihood of Smallholders. Case Studies in East Malaysia 2015
“yes” response percentage than non-certified. This could be because certified smallholders follow certain strong rules and regulations, locally and internationally, when it comes to protected areas, forest and land use. Obeying the RSPO certification process specifically on these items could help the smallholders to not breach any law while continuing oil palm production in their farms. Table 4.24Bio-HCV index for smallholders in Keresa
Smallholder n Mean Std. Dev. Certified 21 0.170 0.663 Non-Certified 38 0.286 0.597 Total 60 0.245 0.618 Ha : Meancertified – Meannon-certified > 0; t-stat = -0.685, p-value = 0.248 Table 4.24 shows the Bio-HCV index for smallholders in Keresa. The result reveals that the mean of certified smallholders (0.170) on bio-HCV index is lower than the non-certified smallholders (0.286). This shows that non-certified smallholders are more positive in their view of the possible contribution of RSPO certification to the preservation of biodiversity and HCV in Keresa. This could be because some of the certified smallholders are still in the process of fully adopting the certification standards into their farm practices. Thus, some of the impacts of the certification towards HCVs and biodiversity are yet to be seen. Economic Impacts Farm Expenditure Table 4.25Annual farm expenditure per hectare of smallholders in Keresa
Smallholder n Mean Std. Dev. Median Min Max Certified 23 1,025 992 624 88 3787 Non-Certified 42 1,289 1,075 844 109 4,680 Total 65 1,195 1,046 768 88 4,680 Ha : Meancertified – Meannon-certified > 0; t-stat = -0.971, p-value = 0.168 Note: Three observations are excluded from the analysis due to missing values. The data in Table 4.25 indicates there is an obvious gap in the average farm expenditure between certified RSPO members (RM1,025) and non-RSPO members (RM1,289) in Keresa. The latter spent lesser than the mean (RM1,195) of the whole population, suggesting a case of underinvestment. Such finding is reinforced by our field observation, particularly in relation to their knowledge and ability to make informed fertilization decisions. Some individuals even regard pesticides as the cheapest input to boost farm productivity. In contrast, certified RSPO members were observed to follow BMP principles and to apply inputs variably according to agronomic needs. This is a result of joining Keresa Smallholder Group Scheme in which the participants were trained and were also involved in frequent meetings to exchange ideas with other planters (including Keresa). Through the same arrangement, the participants received and applied fertilizers that were ordered in bulk by Keresa. This aid ensures that the participants have adequate feed for their trees at a price lower than the retail level.

39 The Impacts of RSPO on the Livelihood of Smallholders. Case Studies in East Malaysia 2015
Yield and Income Table 4.26Summary statistics for annual yield (ton/ha) according to age of trees categories in Keresa
Smallholder Age of Trees
3-6 years
7-20 years
Above 20 years
Certified 15.13 8.83 - (7.26) (4.62) -
Non-Certified 8.17 8.34 4.16 (4.58) (4.29) (2.94)
Ha : Meancertified – Meannon-certified > 0; t-stat = 2.848 p-value = 0.004
t-stat = 1.580 p-value = 0.062
Note: Figures in brackets represent standard deviations. In general, certified RSPO members achieved higher yield than non-RSPO members in both tree age categories (Table 4.26), but the difference is marginal in the young prime category. The difference in yield of the young mature category can be largely attributed to the extension support the certified farmers receive from Keresa. This is a critical stage of growth for the trees and the extension services provided to farmers improves the way these trees are managed. Poor yield for the old trees (4.16 tons/ha) for the non-certified farmers is mostly due to high tree density, which exceeded the optimal capacity of having 136 trees per hectare. Table 4.27Annual household income in Keresa
Smallholder n Mean Std. Dev. Median Min Max Certified 23 23,922 12,409 24,000 2,400 48,000 Non-Certified 45 20,484 16,472 12,000 5,000 60,000 Total 68 21,647 15,213 18,000 2,400 60,000 Ha : Meancertified – Meannon-certified > 0; t-stat = 0.880, p-value = 0.191 Note: One observation is excluded from the analysis due to missing value. Because smallholders in Keresa are isolated from the nearest town, they rely entirely on oil palm. Household members have very little opportunity to work in other employment sectors and the number of household members has an insignificant effect on their annual household income. Thus, it would not be overly biased to compare total household income among the respondents without controlling for the household size. Annual household income of smallholders in Keresa is presented in Table 4.27. Certified RSPO members (RM23,922) obtained higher income than non-RSPO members (RM20,484). Such a difference is characterized by their farm size, yield, and FFB price. The certified RSPO members operated on a larger scale and produced higher yield. They also enjoyed fair FFB prices in comparison to those received by non-RSPO members from private traders or mills. Although the fair offer is unexclusive for the certified population, most non-RSPO members prefer to sell to private traders or mills due to cash terms of trade and also because of the distance.

40 The Impacts of RSPO on the Livelihood of Smallholders. Case Studies in East Malaysia 2015
Table 4.28Changes in annual household income after joining RSPO among certified farmers in Keresa
Change in Income n Percentage Decreased 1 6.25 Unchanged 2 12.50 Increased 13 81.25 Total 16 100.00 Note: Only 16 out of 37 certified respondents disclosed the information on changes in household income after joining RSPO. Apart from looking at the difference between income of RSPO members and non-members, it is important that we investigate if there are any changes in income after joining the program. Table 4.28 indicates that 81.25% of RSPO members feel that their annual household income increased after certification. Although the change can be partly affected by the biological age of their trees, most of them indicated that BMPs of RSPO underpinned their farm work more systematically and sensibly. We also use per capita household expenditure to measure wellbeing. As displayed in Table 4.29, per capita household expenditure of RSPO certified members (RM3,994) are higher than the per capita expenditure of non-certified households (RM2,794). With limited access to a credit facility, smallholders in Keresa are only able to spend within their earning capacity. This finding reinforces the previous contention that certified RSPO members are economically better off than the non-RSPO members. Table 4.29Mean annual household expenditure per person in the smallholder’s household in Keresa
Smallholders n Mean Std. Dev. Median Min Max Certified 27 3,994 3,829 2,660 690 21,319 Non-Certified 46 2,794 1,718 2,325 412 8,930 Total 73 3,238 3,033 2,345 412 21,319 Ha : Meancertified – Meannon-certified > 0; t-stat = 1.652, p-value = 0.052 Note: Three observations were excluded from the mean analysis due to missing values.

41 The Impacts of RSPO on the Livelihood of Smallholders. Case Studies in East Malaysia 2015
Perceived economic benefits of RSPO certification Table 4.30Percentage of ‘Agree’ responses to the statements regarding the perceived economic benefits of RSPO certification in Keresa
Statement Certified (%) Non-Certified (%) I think that through RSPO certification,
I can achieve higher FFBs 72.73 31.58 I can produce better FFB grade 77.27 28.95 Demand for my FFB is higher 63.64 21.05 I can sell my FFBs at premium price 77.27 26.32 My farm is getting more profitable 63.64 21.05 I acquire more household assets 36.36 10.53 My farm expenditure decreases 54.55 21.05 I can get credit facilities more easily 54.55 21.05 my farm practice is better 72.73 31.58
Note: (ncertified=22 nnon-certified=38). From Table 4.30, there is a clear distinction between RSPO certified members and non-RSPO members with regards to the economic benefits associated with RSPO certification. Only few of the latter group shared the positive opinions of the certified population. Most of them remained skeptical of the economic impacts resulting from certification. This finding seems reasonable since they have little or no experience of adopting sustainability principles. Consequently, according to the economic benefit index, non-RSPO members were somewhat neutral in assessing the economic impacts of RSPO (as illustrated in Table 4.31). Table 4.31Economic benefit index for smallholders in Keresa
Smallholder n Mean Std. Dev. Certified 22 0.576 0.380 Non-Certified 38 0.149 0.428 Total 60 0.306 0.457 In most cases, the certified RSPO members agree that they can be better off from multiple economic perspectives: yield, grade (quality), premium prices, farming practices, and profitability. Their agreement on these aspects concurs with RSPO’s hypotheses that compliance with the recommended principles is economically rewarding. The economic benefit index indicates that a strong agreement was obtained, showing the confidence of the certified population on the economic returns on investment of RSPO certification.

42 The Impacts of RSPO on the Livelihood of Smallholders. Case Studies in East Malaysia 2015
CHAPTER5
FINDINGSFROMSAPI

43 The Impacts of RSPO on the Livelihood of Smallholders. Case Studies in East Malaysia 2015
Chapter5.FindingsfromSapi Background of Respondents Demographics Table 5.1 presents the demographic profile of the respondents in Sapi. We interviewed 96 male and 4 female respondents in the sampling area. The observation also suggests that oil palm is still dominated by male farmers in the area. With regards to age of household head, mean age of the respondents from Sapi is 52 years old. In addition, the sampling area has the most number of respondents who belong to age groups of 31-40 years old and 41-50 years old. As for race or ethnicity, we interviewed 85 Kadazan/Dusun respondents followed by 4 Tidung and Sungai respondents, as well as 3 Dumpas and Ibanese. There was also a Malay respondent interviewed from the sampling area. Most of the respondents (93%) are married while the rests are single (5%) or widowed (2%). Regarding educational background, there are 19 respondents who did not receive formal education. Nevertheless, there is larger number of respondents who attended primary or religious schools, and also with SRP/PMR and SPM certificates. As for occupation, most respondents are full-time oil palm growers (90%). In addition, there are also some respondents employed as estate officers and workers, teachers, security guards, storekeepers, engineers, shopkeepers and office clerks. In terms of farming experience, respondents in Sapi have a mean farming experience of approximately 17 years.
Table 5.1 Demographic profile of the respondents in Sapi
Variable Sapi n %
Gender Male 96 96 Female 4 4 Total 100 100 Household Head Age Group 30 years and below 2 2 31– 40 years 49 49 41 – 50 years 39 39 51 – 60 years 4 4 Above 60 years 6 6 Total 100 100 Mean 52.03 Standard Deviation 11.85 Minimum 26 Maximum 76 Household Size Group 1 – 3 6 6 4 – 6 34 34 7 – 9 52 52 10 – 12 6 6 13 – 15 2 2 Total 100 100 Mean 6.72 Standard Deviation 2.20 Minimum 1 (Continued)

44 The Impacts of RSPO on the Livelihood of Smallholders. Case Studies in East Malaysia 2015
Maximum 13 Race/Ethnicity Ibanese 3 3 Malay 1 1 Kadazan/Dusun 85 85 Tidung 4 4 Dumpas 3 3 Sungai 4 4 Total 100 100 Marital Status Single 5 5 Married 93 93 Widow/Widower 2 2 Total 100 100 Level of Education Did not receive formal education 19 19 Primary/Religious 25 25 SRP/PMR 16 16 SPM 34 34 STPM/Certificate/Diploma 4 4 University Degree 2 2 Total 100 100 Occupation Farmer (full time) 90 90 Others 10 10 Total 100 100 Farming Experience 1 – 3 years 7 7 4 – 6 years 9 9 7 – 9 years 6 6 10 – 12 years 9 9 13 – 15 years 10 10 16 – 18 years 6 6 19 – 21 years 19 19 22 – 24 years 11 11 25 – 27 years 8 8 28 – 30 years 9 9 31 – 33 years 4 4 34 years and above 2 2 Total 100 100 Mean 17.46 Standard Deviation 8.95 Minimum 1 Maximum 37
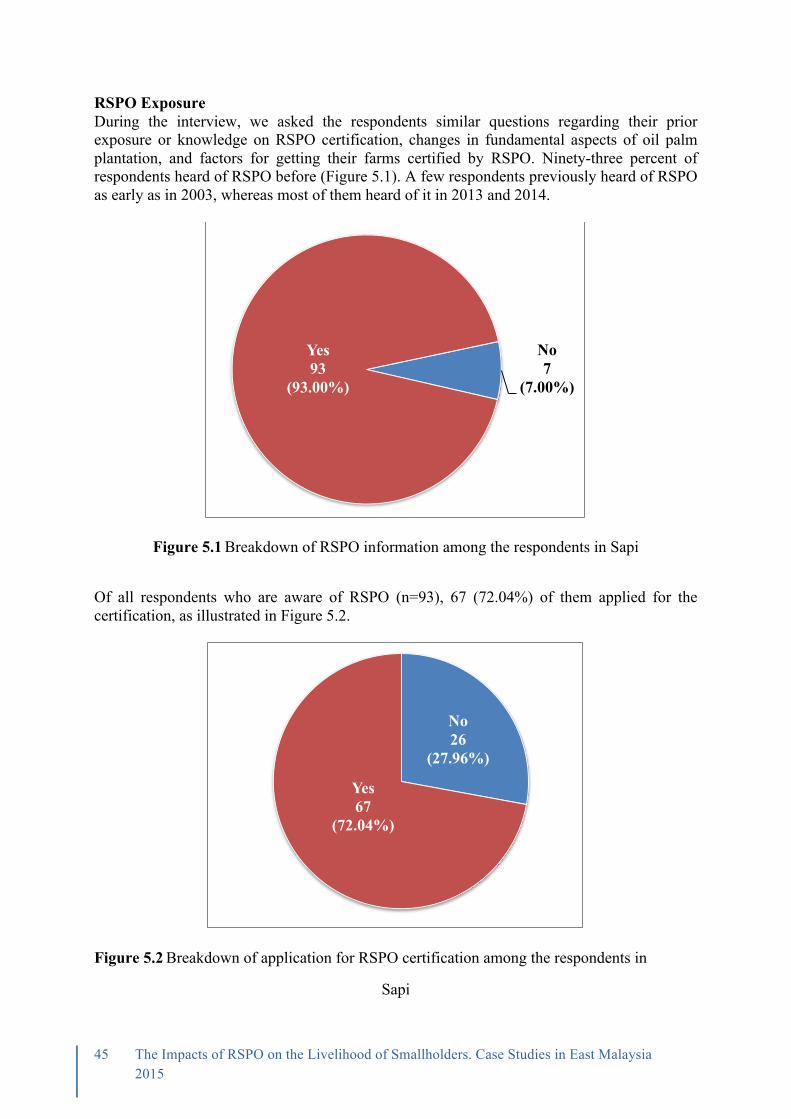
45 The Impacts of RSPO on the Livelihood of Smallholders. Case Studies in East Malaysia 2015
RSPO Exposure During the interview, we asked the respondents similar questions regarding their prior exposure or knowledge on RSPO certification, changes in fundamental aspects of oil palm plantation, and factors for getting their farms certified by RSPO. Ninety-three percent of respondents heard of RSPO before (Figure 5.1). A few respondents previously heard of RSPO as early as in 2003, whereas most of them heard of it in 2013 and 2014.
Figure 5.1Breakdown of RSPO information among the respondents in Sapi
Of all respondents who are aware of RSPO (n=93), 67 (72.04%) of them applied for the certification, as illustrated in Figure 5.2.
Figure 5.2Breakdown of application for RSPO certification among the respondents in
Sapi
No 7
(7.00%)
Yes 93
(93.00%)
No 26
(27.96%)
Yes 67
(72.04%)
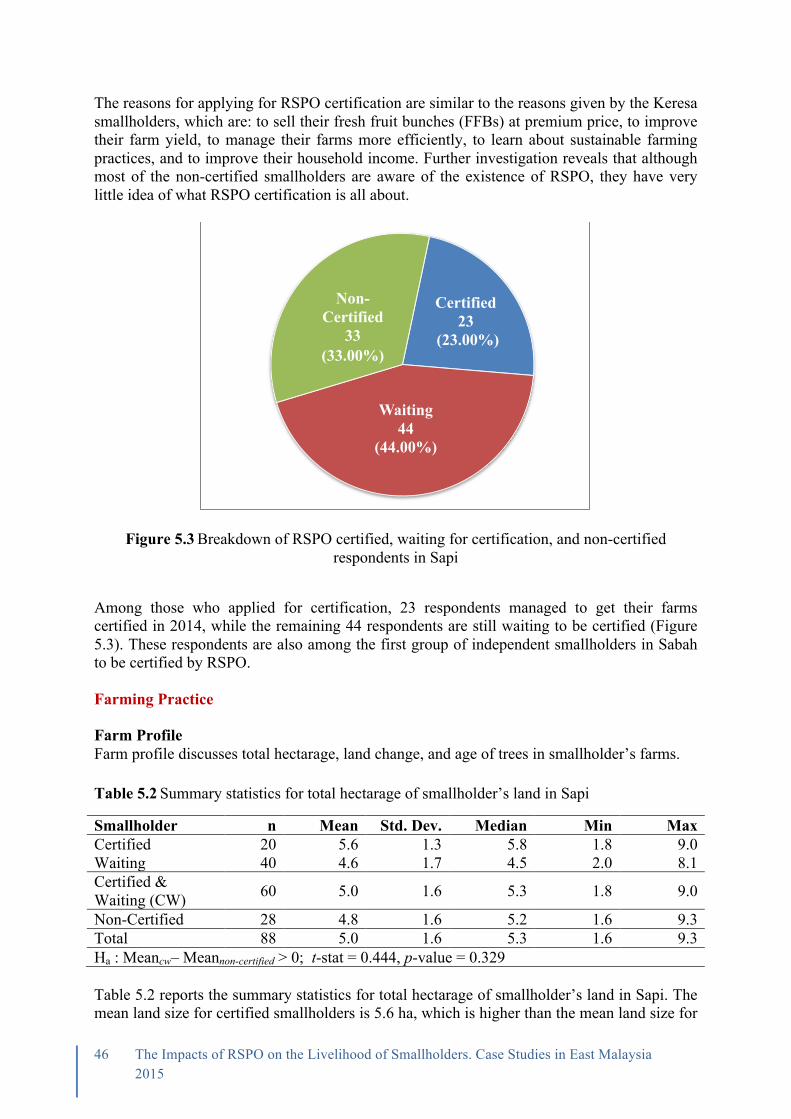
46 The Impacts of RSPO on the Livelihood of Smallholders. Case Studies in East Malaysia 2015
The reasons for applying for RSPO certification are similar to the reasons given by the Keresa smallholders, which are: to sell their fresh fruit bunches (FFBs) at premium price, to improve their farm yield, to manage their farms more efficiently, to learn about sustainable farming practices, and to improve their household income. Further investigation reveals that although most of the non-certified smallholders are aware of the existence of RSPO, they have very little idea of what RSPO certification is all about.
Figure 5.3Breakdown of RSPO certified, waiting for certification, and non-certified respondents in Sapi
Among those who applied for certification, 23 respondents managed to get their farms certified in 2014, while the remaining 44 respondents are still waiting to be certified (Figure 5.3). These respondents are also among the first group of independent smallholders in Sabah to be certified by RSPO. Farming Practice Farm Profile Farm profile discusses total hectarage, land change, and age of trees in smallholder’s farms. Table 5.2Summary statistics for total hectarage of smallholder’s land in Sapi
Smallholder n Mean Std. Dev. Median Min Max Certified 20 5.6 1.3 5.8 1.8 9.0 Waiting 40 4.6 1.7 4.5 2.0 8.1 Certified & Waiting (CW) 60 5.0 1.6 5.3 1.8 9.0
Non-Certified 28 4.8 1.6 5.2 1.6 9.3 Total 88 5.0 1.6 5.3 1.6 9.3 Ha : Meancw– Meannon-certified > 0; t-stat = 0.444, p-value = 0.329 Table 5.2 reports the summary statistics for total hectarage of smallholder’s land in Sapi. The mean land size for certified smallholders is 5.6 ha, which is higher than the mean land size for
Certified 23
(23.00%)
Waiting 44
(44.00%)
Non-Certified
33 (33.00%)

47 The Impacts of RSPO on the Livelihood of Smallholders. Case Studies in East Malaysia 2015
non-certified smallholders (4.8 ha) and also smallholders currently waiting for certification (4.6 ha). Certified smallholders began planting oil palm trees as early as 1985 while the earliest planting for non-certified smallholders started in 1984. Farmers waiting for the certification started planting the trees in 1978. As for land change, Table 5.3 suggests that, on average, the certified farmers increased their land size by 4.3 ha while the farmers waiting for certification increased their land size by 4.2 ha. The non-certified farmers have the highest mean land size change (6.9 ha). Table 5.3Change in smallholder’s land size in Sapi
Smallholder n Mean Std. Dev. Median Min Max Certified 3 4.3 2.1 4.9 2.0 6.1 Waiting 12 4.2 2.5 4.7 0.8 8.1 Non-Certified 9 6.9 6.3 5.8 1.2 21.9 Total 24 5.2 4.4 4.9 0.8 21.9 The reasons for increasing oil palm land size in Sapi is quite similar to Keresa: the increase can be generally attributed to the returns of oil palm cultivation and also the availability of farm land due to land transfer by genealogy and inheritance. There are also a small number of farmers in Sapi who manage more than one plot of land. Having more than one plot would make it easier for the farmers start replanting when the trees become less productive. Replanting could be carried out phase by phase and the smallholders would still be able to harvest from remaining plots. This practice ensures a continuous stream of income for the smallholders to sustain their livelihood even when replanting. The trees planted in the smallholders’ farm are generally divided into four categories: immature, young mature, young prime and old trees. Trees under three years of age are classified as immature. Young mature trees grow between three to six years of age and young prime trees grow from seven to twenty years of age, producing the most fruits. After twenty years, the trees classified as old are economically less productive, usually qualifying them for replanting. Table 5.4Frequency and percentages of age of trees categories in Sapi
Age of Trees
Smallholders Less than 3 years
3-6 years
7-20 years
20 years and above
Certified 3 2 13 5 (13.04) (8.70) (56.52) (21.74)
Waiting 3 6 18 17 (6.82) (13.64) (40.91) (38.64)
Non-Certified 2 4 16 11 (6.06) (12.12) (48.48) (33.33)
Total 8 12 47 33 (8.00) (12.00) (47.00) (33.00)
Note: figures in brackets represent percentages.

48 The Impacts of RSPO on the Livelihood of Smallholders. Case Studies in East Malaysia 2015
Age of tree from the sampling area is presented in Table 5.4. Based on the table, most farmers have trees standing in their farms at young prime ages when the trees are producing at their highest productive capacity. Farm Management Farm management looks at several practices adopted by the smallholders, such as land clearing methods, applications of herbicides and fertilizers, trainings on agricultural inputs, use of personal protective equipment (PPE), storage for agricultural inputs, and best management practices (BMP). Figures in Table 5.5 describe the land clearing methods adopted by the farmers. The result shows that 91.3% of certified farmers clear the land manually by slashing. The farmers in Sapi feel that the manual clearing method offers an incentive for them to reduce farm expenditure without having to hire farm workers for land clearing. The use of machinery to clear farmland is higher among farmers waiting for certification compared to the certified and non-certified farmers. It is also important to note that all certified farmers and those waiting for certification have already stopped open burning for land clearing. Table 5.5Land clearing methods in Sapi
Smallholder Land Clearing Methods Manual (Slashing) Machine Burning Chemicals
Certified 21 9 0 22 (91.3) (39.13) (0.00) (95.65)
Waiting 41 23 0 39 (93.18) (52.27) (0.00) (88.64)
Non-Certified 32 11 5 30 (96.97) (33.33) (15.15) (90.91)
Total 94 43 5 91 (94.00) (43.00) (5.00) (91.00)
Note: ncertified=37; nwaiting=39; nnon-certified=39 Note: Figures in brackets represent row percentages. Another clearing method used by the smallholders in Sapi is herbicide application. Table 5.5 indicates that most farmers use chemicals to clear the land. Although the use of chemicals for land clearing is still prevalent among certified farmers and the ones waiting for certification, interviews during the field observation revealed that the quantity of application has dramatically reduced. Annual application of agricultural inputs such as herbicide and fertilizers at smallholders’ farms in Sapi are reported in Table 5.6 and Table 5.7, respectively.

49 The Impacts of RSPO on the Livelihood of Smallholders. Case Studies in East Malaysia 2015
Table 5.6Summary statistics of annual herbicide application per hectare (liter) in 2014 by smallholders in Sapi
Smallholder n Mean Std. Dev. Median Min Max Certified 22 8.4 6.9 6.9 0.7 23.0 Waiting 41 7.3 5.6 5.8 0.2 21.2 Certified & Waiting 63 7.7 6.0 6.2 0.2 23.0 Non-Certified 28 13.6 9.8 9.9 1.9 37.0 Total 91 7.8 7.8 7.0 0.2 37.0 Ha : Meancw– Meannon-certified > 0; t-stat = -3.5141, p-value = 0.0003 Note: Five observations were excluded due to missing values. Table 5.6 suggests that certified and waiting-to-be certified farmers, on average, applied 7.7 liter/ha of herbicides at their farms, which is lower than the average herbicide application of non-certified farmers. Table 5.7Summary statistics of annual fertilizer application per hectare (kg) in 2014 by smallholders in Sapi
Smallholder n Mean Std. Dev. Median Min Max Certified 20 397.7 275.6 325.7 32.9 1,132.1 Waiting 43 297.3 297.3 164.6 2.9 1,220.3 Certified & Waiting (CW) 63 292.5 292.5 227.3 2.9 1,220.3 Non-Certified 26 234.0 234.0 191.3 3.5 839.5 Total 89 205.8 276.9 205.8 2.9 1,220.3 Ha : Meancw– Meannon-certified > 0; t-stat = 0.9847, p-value = 0.1638 Note: Seven observations were excluded due to missing value. Further to the annual herbicide application, Table 5.7 indicates a similar observation on annual fertilizer application (kg/ha) by certified farmers. On average, the annual fertilizer application of certified farmers is 398 kg/ha, which is lower than the non-certified farmers (234 kg/ha). Further investigation during the interviews revealed that the higher amount of fertilizer application by the non-certified farmers can be explained by the provision of farm input subsidies. All in all, observations on herbicide and fertilizer application suggest that certified farmers are optimizing the use of agricultural inputs, which in turn will help them reduce average farm expenditure on each plot. The advisory support from the Wild Asia team to the certified farmers and other farmers who are engaged through WAGS also relatively contributes to the reduction in farm expenditure. Table 5.8Percentage of smallholders who have attended agricultural input training programs in Sapi
Agricultural Input Training
Smallholder Certified (%) Waiting (%) Non-Certified (%)
Seed 28.57 84.09 25.71 Fertilizer 88.57 88.64 48.65 Pesticide 17.65 84.09 31.43 Herbicide 86.11 88.64 43.24 Note: ncertified=23; nwaiting=44; nnon-certified=33

50 The Impacts of RSPO on the Livelihood of Smallholders. Case Studies in East Malaysia 2015
The farmers also attended training programs specifically tailored for them to promote correct input use on their farms. Table 5.8 presents the percentage of smallholders who have attended agricultural input training programs in Sapi. Most certified farmers and farmers waiting for certification attended training programs on fertilizer and herbicides. Table 5.9Training index for smallholders attending agricultural input training in Sapi
Smallholder n Mean Std. Dev. Certified 23 3.826 0.834 Waiting 45 3.378 1.386 Certified & Waiting (CW) 68 3.529 1.240 Non-Certified 32 0.969 1.713 Total 100 2.710 1.844 Ha : Meancw– Meannon-certified > 0; t-stat = 8.492, p-value = 0.000
Table 5.9 presents the mean and standard deviation of training index calculated for certified, waiting-to-be certified and non-certified farmers. The result indicates that, on average, the certified farmers and those waiting for certification have attended most training programs on agricultural input use. Table 5.10PPE Index for applying fertilizers in Sapi
Smallholder n Mean Std. Dev. Certified 23 6.087 1.411 Waiting 44 5.114 1.530 Certified & Waiting (CW) 67 5.448 1.550 Non-Certified 32 4.531 1.586 Total 99 5.152 1.612 Ha : Meancw– Meannon-certified > 0; t-stat = 2.731, p-value = 0.004
Note: One observation was excluded due to missing value. Table 5.11PPE Index for applying herbicides in Sapi
Smallholder n Mean Std. Dev. Certified 23 6.130 1.486 Waiting 44 5.822 1.284 Certified & Waiting (CW) 67 5.926 1.353 Non-Certified 32 1.575 1.575 Total 99 5.730 1.448 Ha : Meancw– Meannon-certified > 0; t-stat = 2.0073, p-value = 0.0237
In order to understand the use of personal protective equipment (PPE) worn by farmers during the application of agricultural inputs, a PPE index was developed for herbicide and fertilizer, respectively. Table 5.10 and Table 5.11 present the index values (mean) for fertilizer and herbicide. Results from both tables suggest that the certified farmers are slightly more protected when applying these chemical inputs. Based on interviews during field observations, we also found that farmers in Sapi are better informed of the importance of PPE when applying agricultural inputs. According to them, training on the correct use of PPE as well as high level of awareness towards safety and health concerns are the essential factors encouraging them to use PPE.

51 The Impacts of RSPO on the Livelihood of Smallholders. Case Studies in East Malaysia 2015
Table 5.12 presents the frequency and percentage of having proper storage facilities for agricultural inputs such as pesticide, herbicide and fertilizer. Table 5.12Frequency and percentage of storage facilities for agricultural inputs in Sapi
Smallholder Agricultural Input
Pesticide Herbicide Fertilizer Yes No Yes No Yes No
Certified 15 8 20 3 21 2 (65.22) (34.78) (86.96) (13.04) (91.30) (8.70)
Waiting 22 22 26 18 27 17 (50.00) (50.00) (59.09) (40.91) (61.36) (38.64)
Non-Certified 17 16 20 13 21 12 (51.52) (48.48) (60.61) (39.39) (63.64) (36.36)
Total 54 46 66 34 69 31 (54.00) (46.00) (66.00) (34.00) (69.00) (31.00)
Note: Figures in brackets represent row percentages. A majority of certified farmers have proper storage facilities for all agricultural inputs. Field observation also revealed that some farmers do not have designated stores for agricultural inputs, especially pesticide, because they only buy inputs in small quantity and as needed for one-off application. Therefore, no storage is required because there are no unused inputs left on the farm. Table 5.13Storage separation of different chemicals in Sapi
Smallholder Pesticide Herbicide Fertilizer Yes No Yes No Yes No
Certified 10 12 15 8 15 8 (45.45) (54.55) (65.22) (34.78) (65.22) (34.78)
Waiting 10 34 14 30 17 27 (22.73) (77.27) (31.82) (68.18) (38.64) (61.36)
Non-Certified - 33 2 31 5 28 - (100.00) (6.06) (93.94) (15.15) (84.85)
Total 20 79 31 69 37 63 (20.20) (79.80) (31.00) (69.00) (37.00) (63.00)
Note: Figures in brackets represent percentages. Table 5.13 provides information on whether the storage facilities separate the agricultural inputs. There are 10 out of 15 stores built by the certified farmers for keeping pesticide only. Of all 20 herbicide storage facilities built by certified farmers, only 15 stores separate the herbicide from other agricultural inputs. As for fertilizer, only 15 out of 21 certified farmers keep other agricultural chemicals away from the fertilizer store.

52 The Impacts of RSPO on the Livelihood of Smallholders. Case Studies in East Malaysia 2015
Table 5.14Percentage of the adoption of best management practices (BMP) in Sapi
Best Management Practice (BMP) Certified Waiting Non-Certified n (%) n (%) n (%)
Preventing soil erosion 18 94.44 40 100.00 30 96.67 Maintaining quality of surface and ground
water 22 100.00 44 97.73 31 96.77
Reducing pollution 23 100.00 44 97.73 33 32.00 Applying environmental-friendly herbicide 23 100.00 44 97.73 32 90.63 Managing waste responsibly 23 95.65 44 100.00 33 90.91 Preserving natural forests at the hill slope 21 90.48 41 95.12 31 70.97 Reducing forest burning 23 91.30 44 100.00 33 93.94 Replanting forest trees 23 30.43 43 27.91 33 12.12 Using personal protective equipment (PPE)
and handling agricultural chemicals correctly
23 91.30 44 97.73 33 81.82
Using protective gears when hunting or tools to protect the farm from being harmed by wild animals
1 100.00 2 50.00 2 100.00
Adoption of best management practices (BMP) by smallholders in Sapi is reported in Table 5.14. According to the result, the farmers in Sapi mostly adopt BMPs at their farms. Maintaining water quality, reducing pollution and applying environmentally friendly herbicides are the BMPs that are practically adopted by all certified smallholders participating in this study. It is also noteworthy to report that most smallholders in Sapi do not hunt as casually as the smallholders in Keresa. There are only a small number of smallholders who hunt wild animals for food. Table 5.15BMP index for smallholders in Sapi
Smallholder n Mean Std. Dev. Certified 17 6.647 1.902 Waiting 37 7.108 1.882 Certified & Waiting (CW) 54 6.963 1.883 Non-Certified 26 5.769 3.050 Total 80 6.575 2.375 Ha : Meancw– Meannon-certified > 0; t-stat = 2.154, p-value = 0.017 Note: Twenty observations are excluded from the analysis due to missing values. Table 5.15 reports the mean BMP index for certified, waiting to be certified and non-certified smallholders, respectively. The result indicates that certified and waiting-to-be certified farmers have adopted more BMPs compared to the non-certified farmers.

53 The Impacts of RSPO on the Livelihood of Smallholders. Case Studies in East Malaysia 2015
Social Impacts Certified and waiting-to-be certified smallholders have varying perceptions on the different social aspects outlined on Table 5.16. Table 5.16Percentage of ‘Agree’ responses to the statements regarding the social benefits of RSPO certification in Sapi
Statement Certified (%)
Waiting (%)
Overall (%)
I think that through RSPO certification, cooperation among smallholders improves 91.30 95.35 93.94 relationship between smallholders and millers improves 95.65 88.37 90.91 smallholder’s health improves 91.30 93.02 92.42 smallholder’s knowledge on farm practice improves 91.30 97.67 95.45 education facilities improve 91.30 95.35 93.94 healthcare facilities improve 100.00 90.70 93.94 food security at home improves 69.57 86.05 80.30
agricultural activities are getting environmentally friendlier 100.00 97.67 98.48
I have better road access 82.61 79.07 80.30 Note: (ncertified=23, nwaiting=43). Social benefit index of smallholders in Sapi is summarized in Table 5.17. The result shows that both certified and waiting to be certified farmers strongly agree that RSPO certification brings positive social benefits, as indicated by the mean social benefit indices of 0.884 and 0.915, respectively Table 5.17Social benefit index for smallholders in Sapi
Smallholder n Mean Std. Dev. Certified 23 0.884 0.182 Waiting 43 0.915 0.141 Total 66 0.904 0.156 Note: One observation is excluded from the analysis due to missing values. Women’s Participation in Associations/Societies In general, women’s level of participation in associations or societies in Sapi is very limited (29%) among different group of smallholders as shown in Table 5.18.

54 The Impacts of RSPO on the Livelihood of Smallholders. Case Studies in East Malaysia 2015
Table 5.18Frequency and percentages of women’s participation in associations/societies in Sapi
Smallholder Membership Yes No
Certified 7 16 (30.43) (69.57)
Waiting 14 30 (31.82) (68.18)
Non-Certified 8 25 (24.24) (75.76)
Total 29 71 (29.00) (71.00)
Note: Figures in brackets are percentages. These women are not restricted to participate in activities outside their homes and everyone has a fair chance of participating of their own free will. Despite that, the overall percentage is low due to a number of possible reasons. These women are solely responsible for household chores and family affairs but apart from that, they are also involved in the maintenance of oil palm plots. The abovementioned activities keep these women busy, leaving them with little time to be involved in associations or societies. Their homemaker responsibilities also kept them uninterested and unaware of such associations or societies, if any existed at all. Gender Equality Women’s access to different activities in Sapi is summarized in Table 5.19. Overall, the level of access of women to decisions in the family including purchasing and raising children is high for the different groups of smallholders. They also have the liberty to move from one place to another, which gives them a fair opportunity to visit friends and family members. Their mobility also allows them to participate in various social activities. However, their level of participation very much depends on their commitments at home, which is commonly higher among certified members due to the additional work that certification entails. Thus, certified members also have lower access to opportunities in running a business and pursuing educational related activities compared to those who are still waiting to be certified and non-certified members.

55 The Impacts of RSPO on the Livelihood of Smallholders. Case Studies in East Malaysia 2015
Table 5.19Percentage of women farmers in Sapi who have access to do the following activities
Activities Certified (%)
Waiting (%)
Non-Cert. (%)
Running a business 47.83 79.49 82.76 Education 78.26 92.31 96.55 Use of credit facilities 65.22 76.92 65.52 Membership of associations/societies 47.83 74.36 62.07 Making decision in the family 82.61 100.00 86.21 Attending activities on empowering women 82.61 100.00 72.41 Exposure on mass media 34.78 46.15 34.48 Getting resources 100.00 100.00 100.00 Freedom to move from one place to another place 100.00 94.87 86.21 Making purchase decision 100.00 92.31 100.00 Making decision on raising children 100.00 100.00 100.00 Visiting friends 100.00 100.00 100.00 Visiting family members 100.00 100.00 100.00
Note: ncertified=23; nwaiting=39; nnon-certified=29 Table 5.20 shows the equality index for women farmers in Sapi. The overall average (0.735) confirms earlier findings that women in general are empowered and are given fair opportunities in pursuing different activities inside and outside their homes. Table 5.20Equality index for women farmers in Sapi
n Mean Std .Dev. Certified 23 0.632 0.287 Waiting 39 0.815 0.209 Certified & Waiting (CW) 62 0.747 0.254 Non-Certified 29 0.708 0.295 Total 91 0.735 0.267 Ha : Meancw– Meannon-certified > 0; t-stat = 0.6423, p-value = 0.2612 Note: Nine observations are excluded due to missing values. Environmental Impacts Table 5.21 shows the percentages of agree responses with regards to the respondents’ perceived environmental impacts of RSPO certification. The result suggests that all certified smallholders agree that the RSPO certification program improved their waste management practices, hence, reducing the sources of air and water pollution. Furthermore, 100% of the certified ones agree that being certified helps them to better conserve their lands and reduce deforestation. These scenarios are also true with the smallholders who are waiting to be certified. This could be because those smallholders waiting for certification are all members of WAGS. Thus, they are all aware of the RSPO certification processes and its possible impacts.

56 The Impacts of RSPO on the Livelihood of Smallholders. Case Studies in East Malaysia 2015
Table 5.21Percentage of ‘Agree’ responses to the statements regarding the environmental impacts of RSPO certification in Sapi
Statement Certified (%)
Waiting (%)
I think that through RSPO certification... my farm practice is becoming more environmentally
friendly 100.00 97.67 soil fertility in my farm improved 95.65 97.67 animals and plants surrounding my farm will be protected 91.30 97.67 wild animals surrounding my farm will be protected 85.00 97.62 aquatics surrounding my farm will be protected 91.30 97.67 waste management in my farm will be improved 100.00 100.00 water pollution will be reduced 100.00 100.00 air pollution will be reduced 100.00 100.00 land will be better conserved 100.00 100.00 deforestation will be reduced 100.00 95.35
Note: (ncertified=23, nwaiting=43). On the other hand, the “agree” response of the certified smallholders on the improvement on soil fertility (95.65%) is slightly lower than the smallholders waiting to be certified (97.67%). One possible reason on this slight difference between two smallholders is the period of certification. Since certified smallholders only received certification in 2014, the majority of them are still in the process of adopting the practices and might still have not yet seen the overall efficiency and effectiveness of RSPO certification regarding soil impacts. Apparently, there are also slight differences in the data between certified and smallholders waiting to be certified in terms of protection of wild animals, plants and aquatic sources. In all these three respective items, certified smallholders have slightly lower “agree” responses than the smallholders who are waiting to be certified. A possible explanation of these differences on data is the location of their respective farmlands. Although there is a forest reserve known to them as Bidu-bidu, a majority of the certified smallholders’ farms are located near the mills and to a more developed area compared to the smallholders waiting to be certified who are located closer the forest. In this regard, smallholders who are waiting to be certified are more optimistic on the impacts of certification on the environment. Table 5.22Environmental impact index for smallholders in Sapi
Smallholder n Mean Std. Dev. Certified 23 0.935 0.184 Waiting 43 0.983 0.049 Total 66 0.968 0.113 Note: One observation is excluded due to missing value. Table 5.22 shows the environmental impact index of smallholders’ farms in Sapi plantations. The result reveals that the environmental impact index of the certified farmers (0.935) is lower than the waiting to be certified farmers (0.983). Furthermore, this shows that certified farmers involved in the survey (n=23) have a consensus on the positive effects of RSPO certification on the environmental impacts of their farms, although with lower impact index compared to smallholders waiting to be certified. The farmers waiting to be certified (n=43) also generally agreed that the environmental impact of their farms will also improve through RSPO certification.

57 The Impacts of RSPO on the Livelihood of Smallholders. Case Studies in East Malaysia 2015
Table 5.23Percentage of “Yes” responses to the statements regarding the contribution of RSPO certification towards preserving biodiversity and HCVs in Sapi
Statement Certified (%)
Waiting (%)
RSPO certification encourages me to... prevent from planting in the protected areas 95.65 95.35 protect endangered species 81.82 100.00 help reduce erosion 95.45 97.67 prevent forest burning 100.00 100.00 prevent water pollution 100.00 100.00 hunt wild animals sustainably 50.00 53.85 preserve forest resources 100.00 100.00
Note: (ncertified=23, nwaiting=43). Table 5.23 shows the “yes” responses of the smallholders on the contribution of RSPO certification to the preservation of biodiversity and HCV in Sapi. The result reveals that certified smallholders have a lower percentage of “yes” responses than the smallholders waiting to be certified in terms of the protection of endangered species (81.82%) and hunting of wild animals (50%). Table 5.24Bio-HCV index for smallholders in Sapi
n Mean Std. Dev. Certified 8 0.750 0.273 Waiting 26 0.901 0.133 Total 34 0.866 0.183 Note: Thirty-three observations are excluded due to missing values Table 5.24 shows the Bio-HCV index for smallholders in Sapi. The result reveals that the mean of certified smallholders on bio-HCV index (0.750) is lower than the waiting-to-be certified smallholders (0.901). This shows that smallholders who are waiting to be certified are more positive on their views of the possible contribution of RSPO certification to the preservation of biodiversity and HCV in Keresa. It could be that smallholders waiting for certification are more exposed to biodiversity and HCV than that of the certified ones since the latter are living near the mills and in a more developed, rural area. Economic Impacts Farm Expenditure The average farm expenditure of Sapi smallholders is RM1,491 per hectare. RSPO certified farmers have the lowest expenditure at RM1,130 followed by non-certified farmers (RM1,416) and waiting-to-be certified farmers (RM1,710). Nevertheless, it was observed that lower expenditure among certified smallholders is not directly attributed to more efficient use of resources. According to the respondents, they have inadequate extension services. Thus, some of them still maintain practices like buying cheaper inputs of low quality that have little impact on productivity.
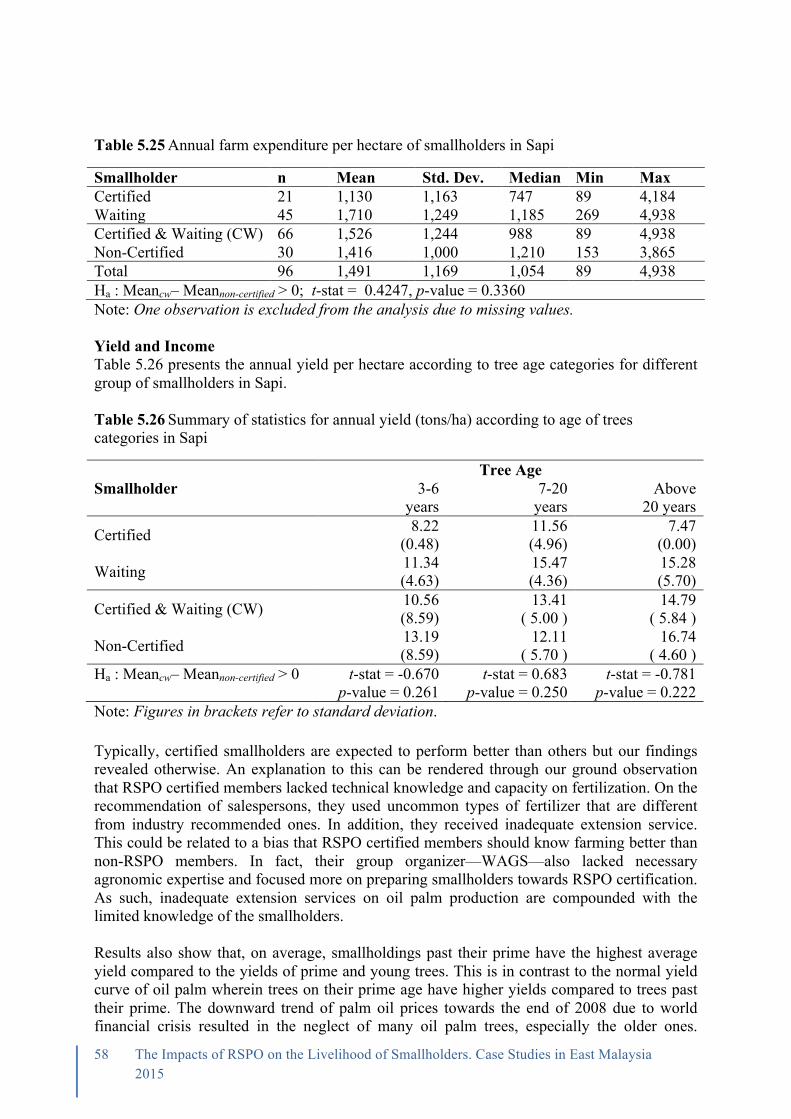
58 The Impacts of RSPO on the Livelihood of Smallholders. Case Studies in East Malaysia 2015
Table 5.25Annual farm expenditure per hectare of smallholders in Sapi
Smallholder n Mean Std. Dev. Median Min Max Certified 21 1,130 1,163 747 89 4,184 Waiting 45 1,710 1,249 1,185 269 4,938 Certified & Waiting (CW) 66 1,526 1,244 988 89 4,938 Non-Certified 30 1,416 1,000 1,210 153 3,865 Total 96 1,491 1,169 1,054 89 4,938 Ha : Meancw– Meannon-certified > 0; t-stat = 0.4247, p-value = 0.3360 Note: One observation is excluded from the analysis due to missing values. Yield and Income Table 5.26 presents the annual yield per hectare according to tree age categories for different group of smallholders in Sapi. Table 5.26Summary of statistics for annual yield (tons/ha) according to age of trees categories in Sapi
Smallholder Tree Age
3-6 years
7-20 years
Above 20 years
Certified 8.22 11.56 7.47 (0.48) (4.96) (0.00)
Waiting 11.34 (4.63)
15.47 (4.36)
15.28 (5.70)
Certified & Waiting (CW) 10.56 13.41 14.79 (8.59) ( 5.00 ) ( 5.84 )
Non-Certified 13.19 12.11 16.74 (8.59) ( 5.70 ) ( 4.60 )
Ha : Meancw– Meannon-certified > 0 t-stat = -0.670 p-value = 0.261
t-stat = 0.683 p-value = 0.250
t-stat = -0.781 p-value = 0.222
Note: Figures in brackets refer to standard deviation. Typically, certified smallholders are expected to perform better than others but our findings revealed otherwise. An explanation to this can be rendered through our ground observation that RSPO certified members lacked technical knowledge and capacity on fertilization. On the recommendation of salespersons, they used uncommon types of fertilizer that are different from industry recommended ones. In addition, they received inadequate extension service. This could be related to a bias that RSPO certified members should know farming better than non-RSPO members. In fact, their group organizer—WAGS—also lacked necessary agronomic expertise and focused more on preparing smallholders towards RSPO certification. As such, inadequate extension services on oil palm production are compounded with the limited knowledge of the smallholders. Results also show that, on average, smallholdings past their prime have the highest average yield compared to the yields of prime and young trees. This is in contrast to the normal yield curve of oil palm wherein trees on their prime age have higher yields compared to trees past their prime. The downward trend of palm oil prices towards the end of 2008 due to world financial crisis resulted in the neglect of many oil palm trees, especially the older ones.

59 The Impacts of RSPO on the Livelihood of Smallholders. Case Studies in East Malaysia 2015
Application of fertilizer was very limited and trees were left untended. However, things made a turn when CPO prices started to pick up, reaching levels above $1,000 per tonne in 2011 and 2012 (Sime Darby, 2013). Smallholders then began nurturing their plots again and older trees which used to bear less fruits became more productive, thus they have slightly higher yields compared to prime age palm trees. Table 5.27Annual household income of smallholders in Sapi
Smallholder n Mean Std. Dev. Median Min Max Certified 19 28,834 17,019 24,000 840 69,000 Waiting 39 28,072 16,890 24,000 1,800 69,600 Certified & Waiting 58 27,011 16,852 24,000 840 69,600 Non-Certified 26 26,123 10,207 25,200 7,200 45,600 Total 84 26,736 15,053 24,000 840 69,600 Ha : Meancw– Meannon-certified > 0; t-stat = 0.2486, p-value = 0.4022 Note: Six observations are excluded from the analysis due to missing values. Table 5.27 summarizes the annual income of smallholders in Sapi. A majority of these smallholders rely on their own oil palm plots for their livelihoods. Most households also have single income-earners because work opportunities are limited in the area. The average household income for all respondents is RM26,736 per annum. RSPO certified members have the highest income at RM28,834, followed by waiting-to-be certified respondents (RM28,072) and non-certified members (RM26,123). The incomes of certified and waiting to be certified respondents are higher than non-certified respondents despite the non-certified ones having the highest yield. Most certified members enjoy the benefit of proximity of their oil palm plots to the mill, enabling them to deliver their harvests directly to the mill, which employed a fair pricing and grading mechanism following MPOB standard. They receive their payment a month after the delivery. On the other hand, the majority of non-members are located in inner areas distant from the mill. Their crops are sold to traders who generally offer discounted prices after factoring in the transportation cost to mills. Such discounts, however, are not done in a transparent a manner. Some non-members also prefer selling their FFBs to traders for instant cash The above scenarios imply that certification does not equate to higher yields and that higher yields do not necessarily translate to higher incomes. However, appropriate technical support and extension services on oil palm production and efficient market access can help drive higher production or revenues among different categories of smallholders. Table 5.28Changes in annual household income among certified farmers in Sapi
Smallholder Change in Annual Household Income Total Decreased Unchanged Increased
Certified 2 3 16 21 (9.52) (14.29) (76.19) (100)
Waiting 1 11 20 32 (3.13) (34.38) (62.5) (100)
Total 3 14 36 53 (5.66) (26.42) (67.92) (100)
Note: Figures in brackets represent percentages.

60 The Impacts of RSPO on the Livelihood of Smallholders. Case Studies in East Malaysia 2015
Smallholders’ perception on changes to their income is shown in Table 5.28. Most certified members (76.19%) perceived their income to have improved after joining RSPO. Only 2 respondents noted that income decreased while 3 smallholders did not consider their income to have changed at all. A similar trend is seen among members who are still waiting to be certified, but to a lower degree. Only 62.5% of the respondents indicated their income improved while 34.38% perceived their income to be still the same while one respondent noted that his income decreased. Table 5.29Mean annual household expenditure per person in the smallholder’s household in Sapi
Smallholders n Mean Std. Dev. Median Min Max Certified 22 2,799 2,548 2,110 300 11,368 Waiting 44 4,362 4,171 2,645 639 19,536 Certified & Waiting (CW) 66 3,841 3,763 2,463 300 19,536 Non-Certified 31 3,921 4,255 2,484 806 17,511 Total 97 3,867 3,905 2,484 300 19,536
On average, smallholders is Sapi have an annual per capita expenditure of RM3,867 as shown in Table 5.29. Among them, waiting to be certified respondents have the highest expenses, which stood at RM4,362 per annum while non-members spent RM3,921 on average. RSPO certified members have the lowest expenditures of only RM2,799. As previously mentioned, many smallholders misallocate resources that are perceived to be cheaper but not necessarily beneficial. One possible reason also for the reduced expenditures among certified smallholders is their proximity to the mill and town centers, which reduces overall transportation costs. Generally, inputs and household needs are relatively cheaper in areas proximate to their source. Perceived economic benefits of RSPO certification

61 The Impacts of RSPO on the Livelihood of Smallholders. Case Studies in East Malaysia 2015
Generally, RSPO certified and waiting-to-be certified respondents perceived certification to be economically beneficial. This is evident from the results in Table 5.30, which show the detailed summary of perceptions for the different statements relating to economic benefits. Both RSPO certified and waiting-to-be certified respondents strongly agree that their farm practices improved through certification. Despite lower average yields among certified farmers compared to other smallholders, most certified members strongly agree that they can achieve higher FFBs and better FFB grade. Another notable result is the perception of smallholders regarding access to credit facilities. RSPO certified and non-certified members do not agree that they have better access to credit facilities through RSPO certification, implying the lack of extension services among smallholders. Table 5.30Percentage of ‘Agree’ responses to the statements regarding the economic benefits of RSPO certification in Sapi
Statement Certified Waiting I think that through RSPO certification,
I can achieve higher FFBs 95.65 86.05 I can produce better FFB grade 100.00 86.05 Demand for my FFB is higher 78.26 86.05 I can sell my FFBs at premium price 82.61 86.05 My farm is getting more profitable 86.96 83.72 I acquire more household assets 60.87 62.79 My farm expenditure decreases 73.91 62.79 I can get credit facilities more easily 40.91 48.84 My farm practice is better 100.00 100.00
Note: (ncertified=23, nwaiting=43). Table 5.31 reports the economic benefit index of smallholders in Sapi. Index values that are close to one for both smallholder groups indicate positive perception towards the economic benefits of RSPO certification. Table 5.31Economic benefit index for smallholders in Sapi
Smallholder n Mean Std. Dev. Certified 22 0.753 0.214 Waiting 43 0.778 0.266 Total 65 0.769 0.248 Note: Two observations are excluded due to missing values.

62 The Impacts of RSPO on the Livelihood of Smallholders. Case Studies in East Malaysia 2015
Conclusion The study conducted for both Keresa and Sapi plantations focused on the impacts of RSPO certification on smallholders’ livelihood. Most of the smallholders interviewed from Keresa and Sapi have already heard of RSPO certification. Although in Sapi, most of the non-certified smallholders have very little idea of what RSPO certification is all about, even though they are aware of its existence. Most of the smallholders who are aware of RSPO are likely to apply for certification with the main motivations of selling their FFBs at premium price, improving their farm yield, managing their farms more efficiently, learning more about sustainable farming practices and improving their household income. In terms of land size, certified smallholders in Keresa have slightly larger hectarage compared to the non-certified ones. This shows the smallholders’ optimism and confidence on managing their farms using RSPO standards. Moreover, there are smallholders in Keresa who managed to have more than one plot of land to provide a buffer for the gap between replanting and harvest. Meanwhile, unlike Keresa, certified smallholders in Sapi have a smaller scale of operation compared to non-certified ones and smallholders waiting to be certified. Both certified and non-certified smallholders in Keresa clear their lands manually through slashing, employing machinery and sometimes burning. Smallholders in Sapi employ almost similar methods of land clearing and preparation. However, instead of burning, the certified smallholders in Sapi use chemicals to clear and prepare their land. Nevertheless, the quantity of chemical application used for land clearing among certified farmers and the ones waiting for certification has dramatically reduced through RSPO certification. Certified smallholders in Keresa and Sapi also use lesser amounts of herbicides at their farms than the non-certified smallholders. This could be partly contributed by the training programs and information provided by the Keresa sustainability team and WAGS, respectively. The amount of fertilizer used by certified smallholders in Keresa is higher than the non-certified ones. Although this increases farm expenditure, increases in fertilizer application, as long as it does not exceed the optimal amount, promotes higher yield. Moreover, certified smallholders for both areas are trained on agricultural inputs better than the non-certified smallholders. Storing agricultural chemicals correctly is also as equally important as applying them. The study found that both certified smallholders in Keresa and Sapi are more aware of the importance of storing chemicals separately. Thus, most of their chemicals are kept in their respective storage facilities. Adoption of BMPs is also common among smallholders in Keresa and Sapi. Certified smallholders in Sapi, together with the smallholders waiting to be certified, have better adoption of BMPs than the non-certified smallholders. In contrast, non-certified smallholders in Keresa have better adoption of BMPs probably due to their needs to address individual farm issues such as soil runoff, erosion and slope planting. This is also an evidence suggesting spillover effect of RSPO certification. Certified smallholders in Keresa believe that RSPO certification generally improves social wellbeing. This is partly due to Keresa’s commitment to improve the social welfare and development of local communities. Similarly, certified and waiting-to-be certified smallholders in Sapi strongly agree that RSPO certification brings social benefits to the community. Women’s participation in local association or society is limited in Keresa because local association mostly refers to their respective longhouse committee, which has limited positions. Meanwhile, the level of participation of women in associations in Sapi is low despite the free will and fair chance given to them. This is probably because women are solely responsible for household chores and family affairs, as well as maintenance of oil palm plots. Further, the level of participation of women among certified members is low since they

63 The Impacts of RSPO on the Livelihood of Smallholders. Case Studies in East Malaysia 2015
are also given the task to handle documentations required for RSPO certification which kept them occupied. Generally, in terms of the impacts of RSPO on the environment, certified smallholders in Keresa and Sapi perceived that RSPO certification is beneficial to the environment. Furthermore, smallholders recognized that most of the environmental impacts are farm related. In Keresa, certified smallholders achieved higher yields than the non-certified ones. This is reflected by their higher farm expenditure, knowledge, and ability to make informed decisions on fertilizer application. The outperformance could also be explained by their access to Keresa’s resources and timely support from Keresa. For example, through collective bargaining, certified smallholders enjoy cheaper fertilizers. In contrast, certified smallholders and those waiting for certification in Sapi have lower yield performance than non-RSPO members. This could be due to underinvestment in agricultural inputs (i.e. fertilizers). Our findings indicate that non-certified smallholders apply more fertilizers than certified ones and this could be due to the fertilizer subsidies made available to them. An additional explanation could be the inadequate extension services and limited knowledge of the smallholders. In general, certified smallholders in Keresa and Sapi generate higher household income compared to non-certified smallholders. For the case of Sapi, although the yield of certified smallholders is lower than the non-certified ones, their income is higher as a result of better FFB pricing. They also perceived that RSPO certification is economically rewarding. Consequently, certified smallholders are better off in terms of economic well-being. Nevertheless, there are spillover effects, with reference to the BMPs, to non-certified smallholders in Keresa and Sapi. Moving forward, we propose three recommendations to improve the effectiveness of RSPO certification on smallholder’s livelihood. First, continuous education and support should be provided to the smallholders to constantly improve their productivity and to help achieve maximum benefits of the certification. There is an incentive for certified mills to provide these services in exchange for a continuous quality supply of FFBs. Second, since smallholders are responsive to economic incentives, premium pricing of FFBs and transparency in pricing and payment mechanism can attract more smallholders to get certified. Certified mills could transfer some of the premium they get from selling certified sustainable palm oil (CSPO) to the certified smallholders. Certified mills are also more transparent towards grading, pricing and payment for FFBs. Third, group managers need to play an active role in organizing certified smallholders not only for certification purposes, but also as a farm business decision-making entity. RSPO certification provides a platform for the smallholders to be organized as a unit to enable collective bargaining in terms of input purchase, request for extension services, transportation, and FFB sales.

64 The Impacts of RSPO on the Livelihood of Smallholders. Case Studies in East Malaysia 2015
Annex1:References Abdullah, R. (2013). Technical Efficiency of Independent Oil Palm Smallholders (ISH) in Peninsular
Malaysia with Respect to Fertiliser and Land Size. Oil Palm Industry Economic Journal, 13(2), 27-37.
Bacon, C. (2005). Confronting the coffee crisis: Can Fairtrade, Organic and Specialty Coffees Reduce Small-Scale Farmer Vulnerability in Northern Nicaragua? World Development, 33(3), 497-511.
Bacon, M., Mendez, V., Flores Gomez, M., Stuart, D., & Diaz Flores, S. (2008). Are Sustainable Coffee Certifications Enough to Secure Farmer Livelihoods? The Millenium Development Goals and Nicaragua's Fairtrade Cooperatives. Globalizations, 5(2), 259-274.
Becchetti, L., & M. Constantino. (2008). The Effects of Fair Trade on Affiliated Producers: An Impact Analysis of Kenyan Farmers. World Development, 36, 823-842.
Beuchelt, T., & Zeller M. (2011). Profits and Poverty: Certification's Troubled Link for Nicaragua's Organic and Fairtrade Coffee Producers. Ecological Economics, 70, 1316-1324.
Brandi, C., Cabani, T., Hosang, C., Schirmbeck, S., Westermann, L., & Wiese, H. (2013). Sustainability Certification in the Indonesian Palm Oil Sector: Benefits and Challenges for Smallholders. Deustches Institut Entwicklungspolitik.
Busch, L. (2011). Standards: Recipes for reality. Cambridge, MA: MIT Press. Calo, M., & Wise, T. (2005). Revaluing peasant coffee production: Organic and fairtrade markets in
Mexico. Global Development and Environment Institute. Medford, MA: Tufts University. Colchester, M., & Chao, S. (2011). Oil Palm Expansion in South East Asia: An Overview. (M.
Colchester, & S. Chao, Ed.) Oil Palm Expansion in South East Asia: Trends and Implications for Local Communities and Indigenous People.
Dauvergne, P., & Lister, J. (2012). Big brand sustainability: Governance prospects and environmental limits. Global Environmental Change, 22, 36-45.
Daviron, B., & Vagneron, I. (2011). From Commoditisation to De-commoditisation and Back Again: Discussing the Role of Sustainability Standards for Agricultural Products. Development Policy Review, 29(1), 91-113.
Dayang Norwana, A., Kunjappan, R., Melissa, C., Schoneveld, G., Potter, L., & Andriani, R. (2011). The local impacts of oil palm expansion in Malaysia: An assessment based on a case study in Sabah State. Bogor, Indonesia: Center for International Forestry Research (CIFOR).
Donough, C., Witt, C., & Fairhust, T. (2009). Yield Intensification in Oil Palm Plantations through Best Management Practice. Better Crops, 93(1), 12-14.
FAO. (2015). FAO's role in urban agriculture. Retrieved from Food and Agriculture Organization of the United Nations (FAO): http://www.fao.org/urban-agriculture/en/
Giovannucci, D., & Ponte, S. (2005). Standards as a new form of social contract? Sustainability initiatives in the coffee industry. Food Policy, 30, 284-301.
Giovannucci, D., & Potts, J. (2008). Seeking Sustainability: COSA Preliminary Analysis of Sustainability Initiatives in the Coffee Sector. Committee on Sustainability Assessment. (B. Killian, C. Wunderlich, G. Soto, S. Schuller, F. Pinard, K. Schroeder, dll., Ed.)
Grote, U., Basu, A., & Und Nancy Chau. (2007). New Frontiers in Environmental and Social Labeling. Heidelberg and New York: Springer/Physica Publication.
Hidayat, N., Glasbergen, P., & Offermans, A. (2015). Sustainability Certification and Palm Oil Smallholder's Livelihood: A Comparison between Scheme Smallholders and Independent Smallholders in Indonesia. International Food and Agribusiness Management Review, 18(3), 25-48.
IAASTD. (2008). A Synthesis of the Global and Sub-Global IAASTD Reports. (B. McIntrye, H. Herren, J. Wakhungu, & R. Watson, Editor) Retrieved from United Nations Environment Programme (UNEP): http://www.unep.org/dewa/agassessment/reports/IAASTD/EN/Agriculture %20at%20a%20Crossroads_Synthesis%20Report%20(English).pdf
IISD. (2014). SSI Review 2014. Retrieved from International Institute for Sustainable Development (IISD): http://www.iisd.org/pdf/2014/ssi_2014_chapter_11.pdf
Ismail, A., Simeh, M., & Mohd Noor, M. (2003). The Production Cost of Oil Palm Fresh Fruit Bunches: the Case of Independent Smallholders in Johor. Oil Palm Industry Economic Journal, 3(1), 1-7.

65 The Impacts of RSPO on the Livelihood of Smallholders. Case Studies in East Malaysia 2015
Jaffee, D. (2007). Brewing Justice: Fairtrade coffee, sustainability and survival. University of California Press.
Jenna, P., Stellmacher, T., & Grote U. (2012). The Impact of Coffee Certification on Small-Scale Producer's Livelihoods: Evidence from Ethiopia. Selected Paper prepared for presentation at the International Association of Agricultural Economists (IAAE) Triennial Conference, Foz do Iguacu, Brazil.
Kamalrudin, M., & Abdullah, R. (2014). Malaysian Palm Oil - Moving Ahead to Sustainable Production Growth. Oil Palm Indsutry Economic Journal, 14(1), 24-33.
Khor, Y. (2013). Struggle for sustainability in palm oil industry shows results, 18. (Institute of Southeast Asian Studies (ISEAS)) Retrieved in 2015, from ISEAS Perspective: https://docs.google.com/viewer?a=v&pid=sites&srcid=ZGVmYXVsdGRvbWFpbnxraG9yeXVsZW5nfGd4OjM2MjBiYWRmYmY0MjcyYWM
Majid Cooke, F., Toh, S., & Vaz, J. (2011). Community-investor business models: Lessons from the oil palm sector in East Malaysia. London/Rome/Kota Kinabalu: IIED/IFAD/FAO/Universiti Malaysia Sabah.
McLaughlin, D. (2011). Land, food and biodiversity. Conservation Biology, 25(6), 1117-1120. Moguel, P., & Toledo, V. (1999). Biodiversity conservation in traditional coffee systems of Mexico.
Conservation Biology, 13, 11-21. Molenaar, J., Orth, M., Lord S., Meekers, P., Taylor, C., Hanu, M. (2010). Analysis of the Agronomic
and Institutional Constraints to Smallholder Yield Improvement in Indonesia. Global Sustainability Associates.
MPOB. (2014). Economics and Industry Development Division. Malaysian Palm Oil Board. Murray D., Raynolds, L., & Taylor, P. (2003). One Cup at a Time: Poverty Alleviation and Fairtrade
Coffee in Latin America. Colorado State University. Colorado: Fair Trade Research Group. Nagiah, C., & Azmi, R. (2012). A Review of Smallholder Oil Palm Production: Challenges and
Opportunities for Enhancing Sustainability - A Malaysian Perspective. Journal of Oil Palm & The Environment, 3, 114-120.
Nelson V., & Pound B. (2009). The Last Ten Years: A Comprehensive Review of the Literature on the Impact of Fairtrade. Retrieved from http://www.fairtrade.net/fileadmin/user_upload/content/ 2009/about_us/2010_03_NRI_Full_Literature_Review.pdf
Nesadurai, H. (2013). Food security, the palm oil-land conflict nexus and sustainability: A governance role for a private multistakeholder regime like the RSPO? The Pacific Review, 25(5), 505-525.
OCIA. (2004). International Certification Standards (CP-P-001, Revision I). Organic Crop Improvement Association (OCIA) International.
Petit, N. (2007). Ethiopia's coffee sector: A bitter or better future? Journal of Agrarian Change, 7(2), 225-263.
Poncelet, M. (2005). A Fair and Sustainable Trade between Market and Solidarity: Diagnosis and Prospects. Liege, Belgium: University of Liege.
Richardson, C. (2010). Deforestation due to Palm Oil Plantations in Indonesia: Towards the Sustainable Production of Palm Oil. Retrieved in 2015, from http://palmoilaction.org.au/wp-content/uploads/2014/02/palm-oil-research-project.pdf
Ronchi, L. (2002). The Impact of Fairtrade on Producers and their Organisations. A Case Study with Coocafe in Costa Rica. Policy Research Unit. Sussex: University of Sussex.
Rotherham, T. (1997). The international background to forest certification: Economic aspects of the environmental approach. Alberta, Canada.
RSPO. (2007). RSPO Certification Systems. Retrieved from Roundtable on Sustainable Palm Oil (RSPO): http://www.rspo.org/files/resource_centre/RSPO%20certification%20systems_1.pdf
RSPO. (2009). RSPO Principles and Criteria for Sustainable Palm Oil Production - Guidance on Scheme Smallholders. Retrieved from Roundtable on Sustainable Palm Oil (RSPO): http://www.rspo.org/files/project/smallholders/Final%20RSPO%20Guidance%20on%20Scheme%20Smallholders%20as%20approved.pdf
RSPO. (2015). Smallholders. Retrieved from Roundtable on Sustainable Palm Oil: http://www.rspo. org/members/smallholders
RSPO Pinterest. (2015). RSPO Certification: Big Impact for Small Holders. Retrieved in 2015, from RSPO Pinterest: https://www.pinterest.com/RSPO/rspo-certification-big-impact-for-small-holders/

66 The Impacts of RSPO on the Livelihood of Smallholders. Case Studies in East Malaysia 2015
Ruben, R. (2008). The Impact of Fairtrade. The Netherlands: Wageningen University Press. Ruben, R., & Fort, R. (2011). The Impact of Fairtrade Certification for Coffee Farmers in Peru. World
Development, 40(3), 570-582. Ruben, R., Fort, R., & Zuniga-Arias, G. (2009). Measuring the Impact of Fairtrade on Development.
Development in Practice, 19(6), 777-788. Rueda X., & Lambin E. F. (2013). Linking Globalization to Local Land Uses: How Eco-consumers
and Local Gourmands are Changing the Colombian Coffee Landscapes. World Development, 41, 286-301.
Stellmacher, T., & Grote, U. (2011). Forest coffee certification in Ethiopia: Economic boom or ecological bane? ZEF Working Paper Series 76, University of Bonn, Department of Political and Cultural Change, Bonn/Hannover.
Taylor, P. (2005). In the Market but not of it: Fairtrade Coffee and Forest Stewardship Council Certification as Market-Based Social Change. World Development, 33(1), 129-147.
Valkila J., & Nygren A. (2009). Impacts of Fair Trade certification on coffee farmers, cooperatives and laborers in Nicaragua. Agriculture and Human Values, 27(3), 321-333.
van Beuningen, C., & Knorringa, P. (2009). Inclusive Improvement: Standards And Smallholders - Taking Stock and Moving On. The Hague, The Netherlands: HIVOS/Creative Commons Licence.
van Opijnen, M., Arjen, B., & Petra, M. (2013). Lesson Learned on RSPO Smallholder Certification in Indonesia. Retrieved from CREM Working on Sustainability: http://www.crem.nl/files/upload/ documents/downloads/file/1310_Report_lessons_learned_FINAL.pdf
Vermeulen, S., & Goad, N. (2006). Towards better practice in smallholder palm oil production. Natural Resource Issues Series (5).
Wild Asia. (2013). Baseline Study of Models for Smallholder Development With Regards to Palm Oil Crop Production in Malaysia. Retrieved from Smallholder Acceleration And REDD Programme (SHARP): http://www.sharp-partnership.org/sharp-programmes/objects/pdfs/baseline-studies-models-malaysia-wildasia
Wissel, S., A. Berghofer, R. Jordan, S. Oldfield, & T. Stellmacher. (2010). Certification and Labeling. In TEBB - The Economics of Ecosystems and Biodiversity for Local and Regional Policy Makers (pg. 161-171). United Nations Environment Programme (UNEP).
Wissel, S., Bergh, O., Jordan, A., Olfield, R., Stellmacher, S., & Forster, J. (2012). Certification and labeling. In H. Wittmer, & H. Gundimenda, The economics of ecosystems and biodiversity in local and regional policy and management (pg. 273-288). Routledge, Abingdon and New York.
World Bank. (2011). Rising Global Interest in Farmland: Can It Yield Sustainable and Equitable Benefits? Washington DC: The World Bank.
World Growth. (2013). Smallholders: Costs and Challenges of Small-Farmer Certification. A World Growth Report. (World Growth) Retrieved in 2015, from Research: http://worldgrowth.org/site/ wp-content/uploads/2013/03/smallholders_Final.pdf
WWF. (2015). Impacts. Retrieved in 2015, from World Wildlife Fund (WWF): http://www.worldwildlife.org/industries/palm-oil

67 The Impacts of RSPO on the Livelihood of Smallholders. Case Studies in East Malaysia 2015
Annex2:Appendix We develop an ordinary least squares (OLS) regression model to facilitate our understanding on the factors affecting smallholders’ yield in both Keresa and Sapi. Our model takes the following form: YIELD = f(RSPO, TREEAGE, LANDLAB, FERT, FERTSQ, HERB, HERBSQ, HEADAGE) where, YIELD - Annual FFB yield (tons) per hectare RSPO - RSPO certified or waiting for certification farmer (1 = Yes, 0 = No) TREEAGE - Age of trees (years) LANDLAB - Land to labor ratio (calculated by taking the ratio of land to labor, giving us the hectarage per unit of labor) FERT - Annual fertilizer application (kg) per hectare FERTSQ - FERT squared HERB - Annual herbicide application (liter) per hectare HERBSQ - HERB squared HEADAGE - Age of household head Table A.1. OLS Regression (Dependent variable: YIELD) Explanatory Variable Coefficient Std. Error
RSPO 2.74 1.08* TREEAGE 0.19 0.05* LANDLAB -0.69 0.43** FERT 2.85E-03 1.69E-03** FERTSQ -3.29E-07 3.49E-07 HERB 0.03 0.09 HERBSQ -2.33E-04 4.22E-04 HEADAGE -0.04 0.04 Constant 10.23 2.74 n = 119, R-squared = 0.219
The OLS result (Table A.1) suggests that annual yield improves when a farmer is a certified RSPO member (RSPO). The model predicts that a certified member is expected to produce 2.74 tons more FFBs per annum compared to a non-certified member, holding other factors constant. Other variables that are statistically significant in the model include TREEAGE, LLEFF, and FERT. The coefficient for TREEAGE indicates that annual yield increases as the trees mature. Annual yield is found to decrease when land to labor ratio increases. This indicates that increasing land size without increasing the number of farm labor reduces efficiency and this will be translated into lower annual FFB yield per hectare. The coefficient for FERT implies that there is a positive relationship between the amount of fertilizer applied and annual yield. We control for the diminishing effects of fertilizer and herbicide applications on yield by including the squares of both variables. Both squared variables, although not statistically significant, show the correct signs indicating that excessive fertilizer and herbicide applications will reduce yield.

68 The Impacts of RSPO on the Livelihood of Smallholders. Case Studies in East Malaysia 2015
RSPO SECRETARIAT SDN BHD (787510-K)UnitA-37-1,Level37,TowerA,MenaraUOABangsarNo.5JalanBangsarUtama1,59000KualaLumpur
RSPO SECRETARIAT SDN BHD (787510-K)UnitA-37-1,Level37,TowerA,MenaraUOABangsarNo.5JalanBangsarUtama1,59000KualaLumpurT +603 2302 1500 F +603 2302 1542 E [email protected]