The impacts of rising temperatures on aircraft takeoff ... · PDF fileThe impacts of rising...
8
LETTER The impacts of rising temperatures on aircraft takeoff performance Ethan D. Coffel 1,2 & Terence R. Thompson 3 & Radley M. Horton 2,4 Received: 6 April 2017 /Accepted: 19 June 2017 # Springer Science+Business Media B.V. 2017 Abstract Steadily rising mean and extreme temperatures as a result of climate change will likely impact the air transportation system over the coming decades. As air temperatures rise at constant pressure, air density declines, resulting in less lift generation by an aircraft wing at a given airspeed and potentially imposing a weight restriction on departing aircraft. This study presents a general model to project future weight restrictions across a fleet of aircraft with different takeoff weights operating at a variety of airports. We construct performance models for five common commercial aircraft and 19 major airports around the world and use projections of daily temperatures from the CMIP5 model suite under the RCP 4.5 and RCP 8.5 emissions scenarios to calculate required hourly weight restriction. We find that on average, 10–30% of annual flights departing at the time of daily maximum temperature may require some weight restriction below their maximum takeoff weights, with mean restrictions ranging from 0.5 to 4% of total aircraft payload and fuel capacity by mid- to late century. Both mid-sized and large aircraft are affected, and airports with short runways and high tempera- tures, or those at high elevations, will see the largest impacts. Our results suggest that weight restriction may impose a non-trivial cost on airlines and impact aviation operations around the world and that adaptation may be required in aircraft design, airline schedules, and/or runway lengths. Climatic Change DOI 10.1007/s10584-017-2018-9 Electronic supplementary material The online version of this article (doi:10.1007/s10584-017-2018-9) contains supplementary material, which is available to authorized users. * Ethan D. Coffel [email protected] 1 Department of Earth and Environmental Sciences, Columbia University, New York, USA 2 NASA Goddard Institute for Space Studies, New York, USA 3 Logistics Management Institute (LMI), Virginia, USA 4 Center for Climate Systems Research, Columbia University, New York, USA
Transcript of The impacts of rising temperatures on aircraft takeoff ... · PDF fileThe impacts of rising...

LETTER
The impacts of rising temperatures on aircrafttakeoff performance
Ethan D. Coffel1,2 & Terence R. Thompson3 &
Radley M. Horton2,4
Received: 6 April 2017 /Accepted: 19 June 2017# Springer Science+Business Media B.V. 2017
Abstract Steadily rising mean and extreme temperatures as a result of climate change willlikely impact the air transportation system over the coming decades. As air temperatures rise atconstant pressure, air density declines, resulting in less lift generation by an aircraft wing at agiven airspeed and potentially imposing a weight restriction on departing aircraft. This studypresents a general model to project future weight restrictions across a fleet of aircraft withdifferent takeoff weights operating at a variety of airports. We construct performance modelsfor five common commercial aircraft and 19 major airports around the world and useprojections of daily temperatures from the CMIP5 model suite under the RCP 4.5 and RCP8.5 emissions scenarios to calculate required hourly weight restriction. We find that onaverage, 10–30% of annual flights departing at the time of daily maximum temperature mayrequire some weight restriction below their maximum takeoff weights, with mean restrictionsranging from 0.5 to 4% of total aircraft payload and fuel capacity by mid- to late century. Bothmid-sized and large aircraft are affected, and airports with short runways and high tempera-tures, or those at high elevations, will see the largest impacts. Our results suggest that weightrestriction may impose a non-trivial cost on airlines and impact aviation operations around theworld and that adaptation may be required in aircraft design, airline schedules, and/or runwaylengths.
Climatic ChangeDOI 10.1007/s10584-017-2018-9
Electronic supplementary material The online version of this article (doi:10.1007/s10584-017-2018-9)contains supplementary material, which is available to authorized users.
* Ethan D. [email protected]
1 Department of Earth and Environmental Sciences, Columbia University, New York, USA2 NASA Goddard Institute for Space Studies, New York, USA3 Logistics Management Institute (LMI), Virginia, USA4 Center for Climate Systems Research, Columbia University, New York, USA
Global mean surface temperatures have increased by approximately 1 °C above pre-industriallevels, with most of that change occurring after 1980 (Walsh et al. 2014). As air temperatureincreases at constant pressure, air expands and becomes less dense. The lift generated by anairplane wing is a function of the mass flux across the wing surface; at lower air densities, ahigher airspeed is required to produce a given lifting force (Anderson 2015). For a givenrunway and aircraft, there is a temperature threshold above which takeoff at the aircraft’smaximum takeoff weight (MTOW) is impossible due to runway length or performance limitson tire speed or braking energy. Above this threshold temperature, a weight restriction—entailing the removal of passengers, cargo, and fuel—must be imposed to permit takeoff(Coffel and Horton 2015, 2016; Hane 2015).
Weather is a leading cause of disruption to flight operations (Lan et al. 2006; Koetse andRietveld 2009), either through direct impacts on airport capacity and flight routes or throughcascading delays across the aviation system (Fleurquin et al. 2013). However, the study of thepotential impacts of climate change on aviation is relatively recent (Thompson 2016). Priorwork has suggested that both turbulence (Williams and Joshi 2013; Williams 2017) and trans-Atlantic flight times (Williams 2016) may increase due to a strengthening and shifting mid-latitude jet stream. Climate change may also result in more extreme precipitation events(O’Gorman and Schneider 2009; Kharin et al. 2007), altered mid-latitude storm tracks (Yin2005; Coumou et al. 2015), and changes in hurricane frequency and intensity (Knutson et al.2010; Webster et al. 2005), among other disruptions to prevailing weather patterns. Sea levelrise is also likely to threaten low-lying coastal airports around the world (Hinkel et al. 2014;Parris et al. 2012; Burbidge 2016). Little work has explored these potential risks in detail in thecontext of the aviation sector, and they present fertile ground for future research.
This study focuses on one potential impact of climate change: an increase in weightrestriction due to higher temperatures. The warming resulting from current climate change(~1 °C) has raised the mean airport density altitude (i.e., the altitude associated with air at agiven pressure at standard atmospheric conditions) by approximately 100 ft, and expectedadditional warming of 1–3 °C by the end of the century (Collins et al. 2013) will result infurther increases of additional hundreds of feet. Prior work has shown that the frequency ofdays on which a Boeing 737-800 requires weight restriction is likely to increase by 100–300%at several airports in the USA in the coming decades (Coffel and Horton 2015). We expand onthese results by building performance models for five common commercial aircraft, the Boeing737-800, Airbus A320, Boeing 787-8, Boeing 777-300, and Airbus A380, and calculating thechange in the magnitude and frequency of weight restriction events at 19 airports (seeSupplementary Tables 1 and 2 for airport and aircraft information). Air traffic is heavilyconcentrated in a relatively small number of cities, and these selected locations represent themost common climates, elevations, and runway conditions found at the world’s busiestairports. We then calculate weight restriction at a variety of takeoff weights (TOWs) in bothhistorical and future climate conditions. This analysis demonstrates a method which could becombined with aviation industry operational data to dynamically predict the weight restrictionburden for an airline, taking into account fleets of diverse aircraft and daily schedules atdifferent airports.
We project future daily airport temperatures using 27 general circulation models (GCMs)from the CMIP5 (Taylor et al. 2012) model suite under both the RCP 4.5 and RCP 8.5emissions scenarios (Moss et al. 2010), using the single grid cell that includes each selectedairport. We identify and correct several sources of GCM temperature bias using airport stationobservations from the NOAA-NCEI Global Historical Climatology Network (GHCN) (see
Climatic Change
Supplementary methods). While global mean temperatures are projected to rise by 2–4 °C by2100 relative to pre-industrial times, changes over land will be larger (Collins et al. 2013; Karlet al. 2015). Changes in extremes may be larger still, with annual maximum airport temper-atures projected to increase by 4–8 °C (Horton et al. 2015), resulting in substantial fractions ofthe year being spent above the historical annual maximum temperature, especially in thetropics where variability is lower (Mora et al. 2013). The frequency and severity of extremeheat events have already increased due to climate change (Stott et al. 2004; Dole et al. 2011),and future mean warming and potential changes in temperature variability (Horton et al. 2015;Horton et al. 2016; Kodra and Ganguly 2014; Schär et al. 2004) are very likely to furtherenhance the risk of unprecedented heat waves.
We use aircraft performance data from publicly available BAirplane characteristics forairport planning^ documents which are produced by manufacturers for all commercial aircrafttypes (Boeing 2013). These documents contain charts relating TOW, airport elevation, and airtemperature to required takeoff runway length. Using these data, we fit three-dimensionalsurfaces relating temperature and TOW to required takeoff runway length for each aircraft typeand airport elevation; Supplementary Figure 5 shows fitted surfaces and weight restrictioncharacteristics. Using the appropriate surface for each aircraft and airport, weight restrictioncan be calculated at any air temperature and departure weight (see Supplementary methods).
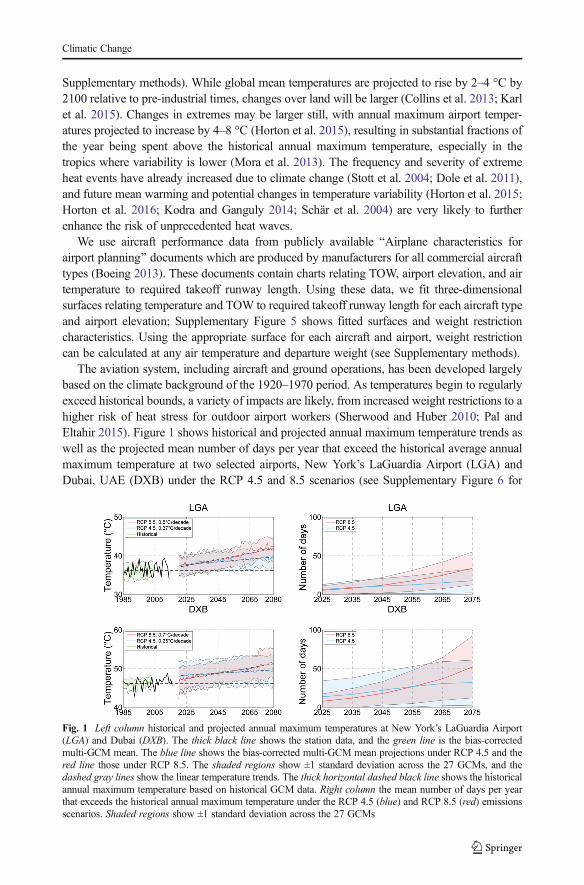
The aviation system, including aircraft and ground operations, has been developed largelybased on the climate background of the 1920–1970 period. As temperatures begin to regularlyexceed historical bounds, a variety of impacts are likely, from increased weight restrictions to ahigher risk of heat stress for outdoor airport workers (Sherwood and Huber 2010; Pal andEltahir 2015). Figure 1 shows historical and projected annual maximum temperature trends aswell as the projected mean number of days per year that exceed the historical average annualmaximum temperature at two selected airports, New York’s LaGuardia Airport (LGA) andDubai, UAE (DXB) under the RCP 4.5 and 8.5 scenarios (see Supplementary Figure 6 for
Fig. 1 Left column historical and projected annual maximum temperatures at New York’s LaGuardia Airport(LGA) and Dubai (DXB). The thick black line shows the station data, and the green line is the bias-correctedmulti-GCM mean. The blue line shows the bias-corrected multi-GCM mean projections under RCP 4.5 and thered line those under RCP 8.5. The shaded regions show ±1 standard deviation across the 27 GCMs, and thedashed gray lines show the linear temperature trends. The thick horizontal dashed black line shows the historicalannual maximum temperature based on historical GCM data. Right column the mean number of days per yearthat exceeds the historical annual maximum temperature under the RCP 4.5 (blue) and RCP 8.5 (red) emissionsscenarios. Shaded regions show ±1 standard deviation across the 27 GCMs
Climatic Change
projections at all 19 airports). Rising temperatures will result in rapid increases in the numberof days that exceed the historical annual maximum temperature (Hansen et al. 2012); in mostcities, this frequency may rise to between 10 and 50 days per year by 2060–2080.
Weight restriction can be partitioned into payload reduction (i.e., passengers and/or cargo)and fuel weight reduction. When payload is reduced, less fuel is required to carry that payload,and less still is required to carry that reduced fuel load. Thus, the required payload reduction isless than the total weight restriction. We use a model of aircraft performance(EUROCONTROL 2004) to estimate the mean partitioning of a weight restriction for aBoeing 737-800 to be 83% payload and 17% fuel (see Supplementary methods). Thispartitioning ratio will vary somewhat for different aircraft types and flight lengths, and moreexact values could be computed in future research. Using this partitioning, we calculaterequired payload reduction for all selected aircraft/airport combinations.
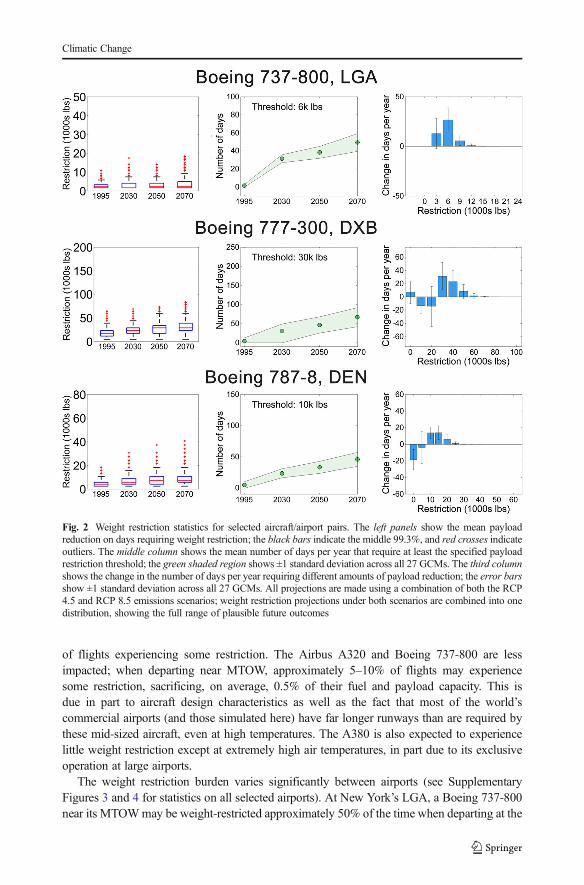
Because air traffic volume varies across airports and may change in the future, we computeweight restriction statistics as if there were one takeoff of each aircraft type during each of the24 h in every day across all airports. In Fig. 2, we show for several airport/aircraft pairs (seeSupplementary Figure 7 for full results) the mean payload reduction at the time of the dailymaximum temperature on all days requiring some weight restriction from MTOW (Fig. 2).Figure 2 shows the change in the number of days per year exceeding a specified weightrestriction threshold, and Fig. 2 shows the change in the number of days per year experiencingvarious levels of weight restriction. The changes in mean payload shown in Fig. 2 varyconsiderably, but most aircraft/airport pairs see 5–10% increases in payload reduction. Largechanges are seen in the frequency of particular levels of weight restriction (Fig. 2), withincreases by a factor of 1.5–4 common by 2060–2080; the weight restriction threshold with themaximum frequency change is shown.
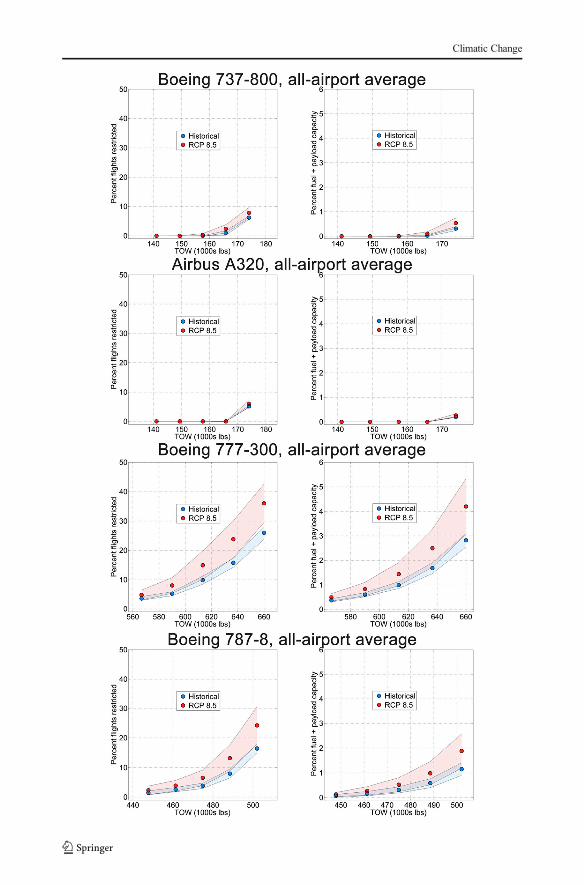
Weight restriction is heavily dependent on TOW. If a flight is scheduled to depart wellbelow its MTOW, weight restriction will likely not be needed, even at high temperatures. Thedistribution of TOWs depends on the specifics of airline operations including route distance,cargo and passenger loads, and fuel reserves and is difficult to estimate. Instead, we modelweight restriction at TOW intervals spaced between each aircraft’s operating empty weight(OEW, the weight of the airframe with no payload and limited fuel) and MTOW. Figure 3shows weight restriction calculated at the time of the daily maximum temperature. The leftpanels show the percentage of flights requiring some restriction, and the right panels show therestriction magnitude as a percentage of total fuel and payload capacity (see SupplementaryFigure 2 for mean results across all hours of the day). Both panels show the historical period(1985–2005) and RCP 8.5 in 2060–2080. Climate-related increases in the percentage of flightsrequiring some weight restriction range from 1 to 10 percentage points, with declines in totalpayload and fuel capacity of 0.5–1.5 percentage points. A small change in the total aircraft fueland payload weight represents a large decrease in capacity when aggregated across an airline’sfleet. For example, a 0.5% decrease from MTOW for a Boeing 737-800 equates to about722 lb, or three passengers (see Supplementary methods) use the airline-standard 220 lbpassenger mean weight. For a normal aircraft configuration of approximately 160 passengers,this is nearly 2% of passenger capacity. Such a decrease can have a substantial impact onairline costs.
While the projected change in weight restriction is relatively consistent across aircraft, thetotal impact of restriction varies. The large Boeing 777-300 and Boeing 787-8 are projected toexperience the greatest impacts from weight restriction; for an aircraft departing near MTOW,by mid- to late century, total fuel and payload capacity may be reduced by 3–5% with 30–40%
Climatic Change
of flights experiencing some restriction. The Airbus A320 and Boeing 737-800 are lessimpacted; when departing near MTOW, approximately 5–10% of flights may experiencesome restriction, sacrificing, on average, 0.5% of their fuel and payload capacity. This isdue in part to aircraft design characteristics as well as the fact that most of the world’scommercial airports (and those simulated here) have far longer runways than are required bythese mid-sized aircraft, even at high temperatures. The A380 is also expected to experiencelittle weight restriction except at extremely high air temperatures, in part due to its exclusiveoperation at large airports.
The weight restriction burden varies significantly between airports (see SupplementaryFigures 3 and 4 for statistics on all selected airports). At New York’s LGA, a Boeing 737-800near its MTOWmay be weight-restricted approximately 50% of the time when departing at the
Fig. 2 Weight restriction statistics for selected aircraft/airport pairs. The left panels show the mean payloadreduction on days requiring weight restriction; the black bars indicate the middle 99.3%, and red crosses indicateoutliers. The middle column shows the mean number of days per year that require at least the specified payloadrestriction threshold; the green shaded region shows ±1 standard deviation across all 27 GCMs. The third columnshows the change in the number of days per year requiring different amounts of payload reduction; the error barsshow ±1 standard deviation across all 27 GCMs. All projections are made using a combination of both the RCP4.5 and RCP 8.5 emissions scenarios; weight restriction projections under both scenarios are combined into onedistribution, showing the full range of plausible future outcomes
Climatic Change
Climatic Change

time of the daily highest temperature and see weight reductions of close to 3.5% of fuel andpayload capacity. Similarly, a Boeing 777-300 near MTOW departing from Dubai (DXB) atthe time of the daily highest temperature may be weight-restricted about 55% of the time, withweight reductions of up to 6.5% of fuel and payload capacity. The averages over all 19 airportsshown in Fig. 3 are lower, as they demonstrate the system-wide impact of weight restriction,including airports which are minimally affected such as London (LHR), Paris (CDG), andNew York (JFK).
Technological change, including improvements in engine performance and airframeefficiency, will likely ameliorate the effects of rising temperatures to some degree. Inaddition, the vast majority of weight restriction will occur near the time of highesttemperature; in some locations, it may prove feasible to reschedule some flights, espe-cially those with high TOWs, to cooler hours of the day (this is already done at someairports (ICAO 2016)). Airports could also lengthen runways, although such projects areexpensive and politically difficult. However, even with adaptation, potentially includingnew aircraft designs, takeoff performance will still likely be lower than it would havebeen given no climate change due to both the effects of reduced air density and degradedengine performance and thrust at higher temperatures. This fact is true of all climateimpacts: even if they can be adapted to, they still have a cost. A variety of climateimpacts on the aviation industry are likely to occur in the coming decades, and thesooner climate change is incorporated into mid- and long-range plans, the more effectiveadaptation efforts can be.
Acknowledgments We acknowledge the World Climate Research Programme’s Working Group on CoupledModelling, which is responsible for the CMIP, and we thank the climate modeling groups for producing andmaking available their model output. For the CMIP, the US Department of Energy’s Program for Climate ModelDiagnosis and Intercomparison provided coordinating support and led the development of software infrastructurein partnership with the Global Organization for Earth System Science Portals. Funding for this research wasprovided through NSF grant number DGE-11-44155 and the US DOI.
Author contributions E.D.C. and T.R.T. jointly conceived of the study, conducted the analyses, and wrote thepaper. R.M.H. provided the input at all stages.
References
Anderson JD (2015) Introduction to flight. McGraw-Hill Education, New YorkBoeing (2013). 737 airplane characteristics for airport planningBurbidge R (2016) Adapting European airports to a changing climate. Transp Res Procedia 14:14–23Coffel E, Horton R (2015) Climate change and the impact of extreme temperatures on aviation. Weather Clim
Soc 7:94–102Coffel ED, Horton RM (2016) Reply to ‘BComment on ‘Climate change and the impact of extreme temperatures
on aviation’ ’̂. AMS Weather Clim Soc 8:207–208Collins, M. et al., (2013) in Intergovernmental Panel on Climate Change, Working Group I Contribution to the
IPCC Fifth Assessment Report (AR5) (Cambridge University Press, New York) (eds. Stocker, T. F. et al.)(Cambridge University Press)
Fig. 3 Weight restriction as a function of TOW in the historical period (blue, 1985–2005) and the future (red,2060–2080) under RCP 8.5. Weight is restriction calculated at the time of highest daily air temperature at each ofthe 19 selected airports and then averaged. The left column shows the percentage of flights with some weightrestriction, and the right column shows the restriction as a percentage of total fuel and payload capacity. Theshaded region shows ±1 standard deviation across 27 GCMs
R
Climatic Change

Coumou D, Lehmann J, Beckmann J (2015) The weakening summer circulation in the Northern Hemispheremid-latitudes. Science 348(80):324–327
Dole R et al (2011) Was there a basis for anticipating the 2010 Russian heat wave? Geophys Res Lett 38EUROCONTROL (2004). Experimental centre. User manual for the Base of Aircraft Data (BADA)Fleurquin P, Ramasco JJ, Eguiluz VM (2013) Systemic delay propagation in the US airport network. Sci Rep 3:
1159Hane FT (2015) Comment on ‘Climate change and the impact of extreme temperatures on aviation’. Weather
Clim Soc 8:205–206Hansen J, Sato M, Ruedy R (2012) Perception of climate change. Proc Natl Acad Sci U S A 109:E2415–E2423Hinkel J et al (2014) Coastal flood damage and adaptation costs under 21st century sea-level rise. Proc Natl Acad
Sci U S A 111:3292–3297Horton RM, Coffel ED, Winter JM, Bader DA (2015) Projected changes in extreme temperature events based on
the NARCCAP model suite. Geophys Res Lett:1–10. doi:10.1002/2015GL064914Horton RM, Mankin JS, Lesk C, Coffel E, Raymond C (2016) A review of recent advances in research on
extreme heat events. Curr Clim Chang Rep 2:242–259ICAO (2016) Environmental reportKarl TR et al (2015) Possible artifacts of data biases in the recent global surface warming hiatus. Science
348(80):1469–1472Kharin VV, Zwiers FW, Zhang X, Hegerl GC (2007) Changes in temperature and precipitation extremes in the
IPCC Ensemble of Global Coupled Model Simulations. J Clim 20:1419–1444Knutson TR et al (2010) Tropical cyclones and climate change. Nat Geosci 3:157–163Kodra E, Ganguly AR (2014) Asymmetry of projected increases in extreme temperature distributions. Sci Rep 4:
5884Koetse MJ, Rietveld P (2009) The impact of climate change and weather on transport: an overview of empirical
findings. Transp Res Part D Transp Environ 14:205–221Lan S, Clarke J-P, Barnhart C (2006) Planning for robust airline operations: optimizing aircraft routings and flight
departure times to minimize passenger disruptions. Transp Sci 40:15–28Mora C et al (2013) The projected timing of climate departure from recent variability. Nature 502:183–187Moss RH et al (2010) The next generation of scenarios for climate change research and assessment. Nature 463:
747–756O’Gorman Pa, Schneider T (2009) The physical basis for increases in precipitation extremes in simulations of
21st-century climate change. Proc Natl Acad Sci U S A 106:14773–14777Pal JS, Eltahir EAB (2015) Future temperature in southwest Asia projected to exceed a threshold for human
adaptability. Nat Clim Chang 18203:1–4Parris, A. et al. (2012). Global sea level rise scenarios for the United States National Climate Assessment. At
http://cpo.noaa.gov/sites/cpo/Reports/2012/NOAA_SLR_r3.pdfSchär C et al (2004) The role of increasing temperature variability in European summer heatwaves. Nature 427:
332–336Sherwood SC, Huber M (2010) An adaptability limit to climate change due to heat stress. Proc Natl Acad Sci U S
A 107:9552–9555Stott PA, Stone DA, Allen MR (2004) Human contribution to the European heatwave of 2003. Nature.
doi:10.1029/2001JB001029Taylor KE, Stouffer RJ, Meehl G a (2012) An overview of CMIP5 and the experiment design. Bull AmMeteorol
Soc 93:485–498Thompson TR (2016) Aviation and the impacts of climate change ∙ climate change impacts upon the commercial
air transport industry: an overview. Carbon Clim Law Rev 10:105–112Walsh, J. et al. (2014) Chapter 2: Our changing climate. Third US Natl. Clim. AssessWebster PJ, Holland GJ, Curry Ja, Chang H-R (2005) Changes in tropical cyclone number, duration, and
intensity in a warming environment. Science 309:1844–1846Williams PD (2016) Transatlantic flight times and climate change. Environ Res Lett 11Williams PD (2017) Increased light, moderate, and severe clear-air turbulence in response to climate change. Adv
Atmos Sci 34:576–586Williams PD, Joshi MM (2013) Intensification of winter transatlantic aviation turbulence in response to climate
change. Nat Clim Chang 3:644–648Yin JH (2005) A consistent poleward shift of the storm tracks in simulations of 21st century climate. Geophys
Res Lett 32:1–4
Climatic Change