The Impacts of Neighborhoods on Economic Opportunity · PDF fileThe Impacts of Neighborhoods...
33
Raj Chetty Harvard University The Impacts of Neighborhoods on Economic Opportunity New Evidence and Policy Lessons Photo Credit: Florida Atlantic University
Transcript of The Impacts of Neighborhoods on Economic Opportunity · PDF fileThe Impacts of Neighborhoods...

Raj Chetty
Harvard University
The Impacts of Neighborhoods on Economic Opportunity New Evidence and Policy Lessons
Photo Credit: Florida Atlantic University
The American Dream?
Probability that a child born to parents in the bottom fifth
of the income distribution reaches the top fifth:

Probability that a child born to parents in the bottom fifth
of the income distribution reaches the top fifth:
Canada
Denmark
UK
USA
13.5%
11.7%
7.5%
9.0% Blanden and Machin 2008
Boserup, Kopczuk, and Kreiner 2013
Corak and Heisz 1999
Chetty, Hendren, Kline, Saez 2014
The American Dream?

Probability that a child born to parents in the bottom fifth
of the income distribution reaches the top fifth:
Chances of achieving the “American Dream” are almost
two times higher in Canada than in the U.S.
Canada
Denmark
UK
USA
13.5%
11.7%
7.5%
9.0% Blanden and Machin 2008
Boserup, Kopczuk, and Kreiner 2013
Corak and Heisz 1999
Chetty, Hendren, Kline, Saez 2014
The American Dream?
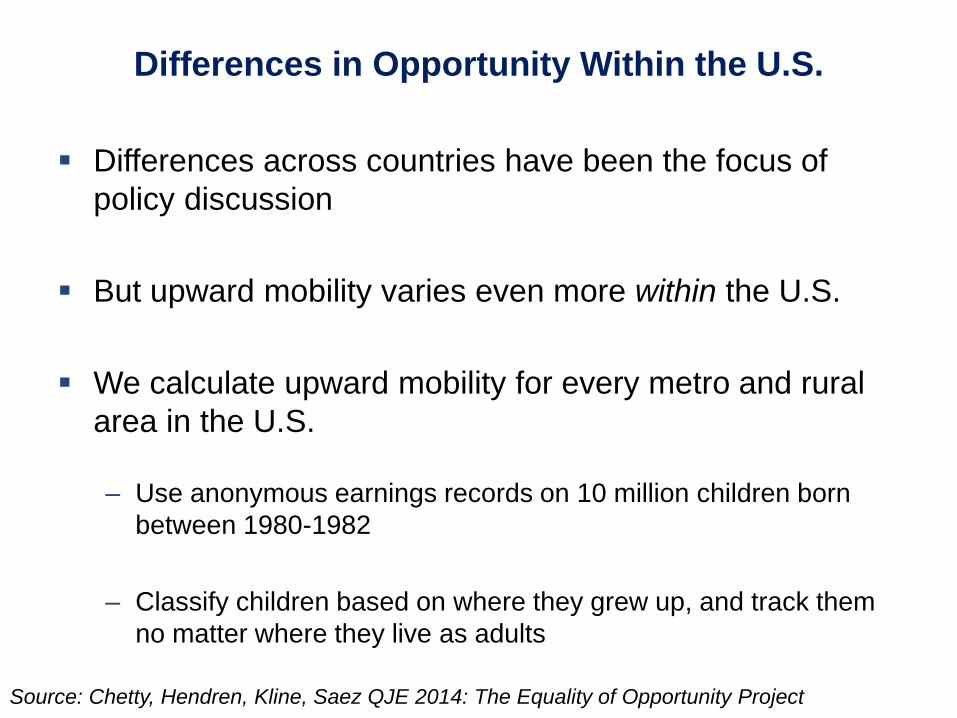
Differences across countries have been the focus of
policy discussion
But upward mobility varies even more within the U.S.
We calculate upward mobility for every metro and rural
area in the U.S.
– Use anonymous earnings records on 10 million children born
between 1980-1982
– Classify children based on where they grew up, and track them
no matter where they live as adults
Differences in Opportunity Within the U.S.
Source: Chetty, Hendren, Kline, Saez QJE 2014: The Equality of Opportunity Project

The Geography of Upward Mobility in the United States
Chances of Reaching the Top Fifth Starting from the Bottom Fifth by Metro Area
San
Jose
12.9%
Salt Lake City 10.8% Atlanta 4.5%
Washington DC 11.0%
Charlotte 4.4%
Denver 8.7%
Note: Lighter Color = More Upward Mobility
Download Statistics for Your Area at www.equality-of-opportunity.org
Boston 10.4%
Minneapolis 8.5%
Chicago
6.5%

Why Does Upward Mobility Vary Across Places?
Two very different explanations for variation in children’s
outcomes across areas:
1. Heterogeneity: different people live in different places
2. Neighborhood effects: places have a causal effect on
upward mobility for a given person

Identifying Causal Effects of Place
Ideal experiment: randomly assign children to
neighborhoods and compare outcomes in adulthood
We approximate this experiment using a quasi-
experimental design [Chetty and Hendren 2015]
– Study 5 million families who move across areas with
children of different ages in observational data

0%
20%
40%
60%
80%
100%
10 15 20 25 30
Age of Child when Parents Move
P
erc
enta
ge G
ain
fro
m M
ovin
g t
o a
Better A
rea
Effects of Moving to a Different Neighborhood
on a Child’s Income in Adulthood by Age at Move
Boston
Chicago

0%
20%
40%
60%
80%
100%
10 15 20 25 30
Age of Child when Parents Move
Effects of Moving to a Different Neighborhood
on a Child’s Income in Adulthood by Age at Move
Children whose families move from Chicago to Boston
when they are 9 years old get 54% of the gain from
growing up in Boston from birth
Perc
enta
ge G
ain
fro
m M
ovin
g t
o a
Better A
rea
Boston
Chicago

0%
20%
40%
60%
80%
100%
10 15 20 25 30
Age of Child when Parents Move
Effects of Moving to a Different Neighborhood
on a Child’s Income in Adulthood by Age at Move P
erc
enta
ge G
ain
fro
m M
ovin
g t
o a
Better A
rea
Boston
Chicago
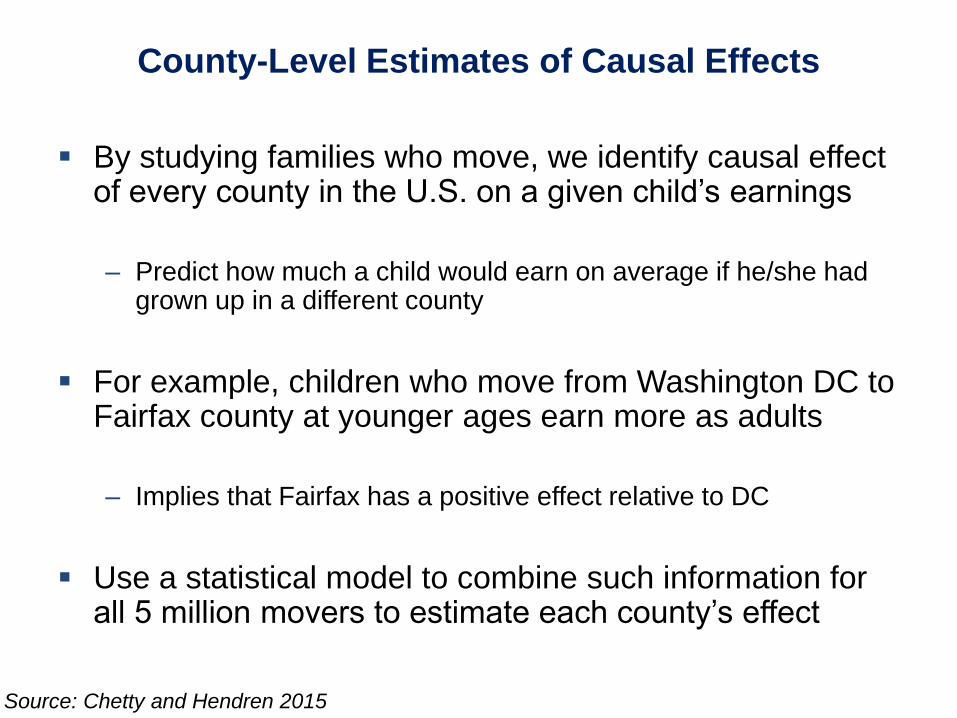
By studying families who move, we identify causal effect of every county in the U.S. on a given child’s earnings
– Predict how much a child would earn on average if he/she had
grown up in a different county
For example, children who move from Washington DC to Fairfax county at younger ages earn more as adults
– Implies that Fairfax has a positive effect relative to DC
Use a statistical model to combine such information for all 5 million movers to estimate each county’s effect
County-Level Estimates of Causal Effects
Source: Chetty and Hendren 2015

Note: Lighter colors represent areas where children from low-income families earn more as adults
Causal Effects of Growing up in Different Counties on Earnings in Adulthood For Children in Low-Income (25th Percentile) Families in the Washington DC Area
Charles
Baltimore
DC
Hartford

Top 10 Counties Bottom 10 Counties
Rank County Change in
Earnings (%) Rank County
Change in
Earnings (%)
1 Dupage, IL +15.1 91 Pima, AZ -12.2
2 Snohomish, WA +14.4 92 Bronx, NY -12.3
3 Bergen, NJ +14.1 93 Milwaukee, WI -12.3
4 Bucks, PA +13.3 94 Wayne, MI -12.5
5 Contra Costa, CA +12.1 95 Fresno, CA -12.9
6 Fairfax, VA +12.1 96 Cook, IL -13.3
7 King, WA +11.3 97 Orange, FL -13.5
8 Norfolk, MA +10.8 98 Hillsborough, FL -13.5
9 Montgomery, MD +10.5 99 Mecklenburg, NC -13.8
10 Middlesex, NJ +8.6 100 Baltimore City, MD -17.3
Causal Effects on Earnings for Children in Low-Income (25th Percentile) Families Top 10 and Bottom 10 Among the 100 Largest Counties in the U.S.
Estimates represent % change in earnings from growing up a given county instead of an average place

Male Children
Top 10 Counties Bottom 10 Counties
Rank County Change in
Earnings (%) Rank County
Change in
Earnings (%)
1 Bucks, PA +16.8 91 Milwaukee, WI -14.8
2 Bergen, NJ +16.6 92 New Haven, CT -15.0
3 Contra Costa, CA +14.5 93 Bronx, NY -15.2
4 Snohomish, WA +13.9 94 Hillsborough, FL -16.3
5 Norfolk, MA +12.4 95 Palm Beach, FL -16.5
6 Dupage, IL +12.2 96 Fresno, CA -16.8
7 King, WA +11.1 97 Riverside, CA -17.0
8 Ventura, CA +10.9 98 Wayne, MI -17.4
9 Hudson, NJ +10.4 99 Pima, AZ -23.0
10 Fairfax, VA +9.2 100 Baltimore City, MD -27.9
Causal Effects on Earnings for Children in Low-Income (25th Percentile) Families
Estimates represent % change in earnings from growing up a given county instead of an average place

Female Children
Top 10 Counties Bottom 10 Counties
Rank County Change in
Earnings (%) Rank County
Change in
Earnings (%)
1 Dupage, IL +18.2 91 Hillsborough, FL -10.2
2 Fairfax, VA +15.1 92 Fulton, GA -11.5
3 Snohomish, WA +14.6 93 Suffolk, MA -11.5
4 Montgomery, MD +13.6 94 Orange, FL -12.0
5 Montgomery, PA +11.6 95 Essex, NJ -12.7
6 King, WA +11.4 96 Cook, IL -12.8
7 Bergen, NJ +11.2 97 Franklin, OH -12.9
8 Salt Lake, UT +10.2 98 Mecklenburg, NC -14.7
9 Contra Costa, CA +9.4 99 New York, NY -14.9
10 Middlesex, NJ +9.4 100 Marion, IN -15.5
Causal Effects on Earnings for Children in Low-Income (25th Percentile) Families
Estimates represent % change in earnings from growing up a given county instead of an average place

Two Policy Approaches to Improving Upward Mobility
Importance of place for mobility motivates two types of
policies:
1. Help people move to better areas
2. Invest in places with low levels of opportunity to
replicate successes of areas with high upward mobility

One way to improve outcomes: give low income families
subsidized housing vouchers to move to better areas
– U.S. already spends $45 bil per year on affordable housing, $20
bil. of which goes to Section 8 housing vouchers
HUD Moving to Opportunity Experiment: gave such
vouchers using a randomized lottery
– 4,600 families in Boston, New York, LA, Chicago, and Baltimore in
mid 1990’s
Source: Chetty, Hendren, and Katz 2015
Policy Approach 1: Moving to Opportunity

Control
King Towers
Harlem
Experimental
Wakefield
Bronx
Most Common MTO Residential Locations in New York

Children who moved to low-poverty areas when young (e.g., below age 13) do much better as adults:
– 30% higher earnings = $100,000 gain over life in present value
– 27% more likely to attend college
– 30% less likely to become single parents
But moving had little effect on the outcomes of children who were already teenagers
Moving also had no effect on parents’ earnings
Reinforces conclusion that childhood exposure is a key determinant of upward mobility
Moving to Opportunity Experiment

Encouraging families with young kids to move to lower-poverty
areas improves outcomes for low-income children
Increase in tax revenue from kids’ higher earnings more than
offsets cost of voucher relative to public housing
Such integration can help the poor without hurting the rich
Mixed-income neighborhoods produce, if anything, slightly
better outcomes for the rich
Implications for Housing Policy

Limits to scalability of policies that move people
Also need policies that improve existing neighborhoods
Challenging to identify causal effects of local policies
But we can characterize the features of areas that generate
good outcomes
Policy Approach 2: Improving Neighborhoods

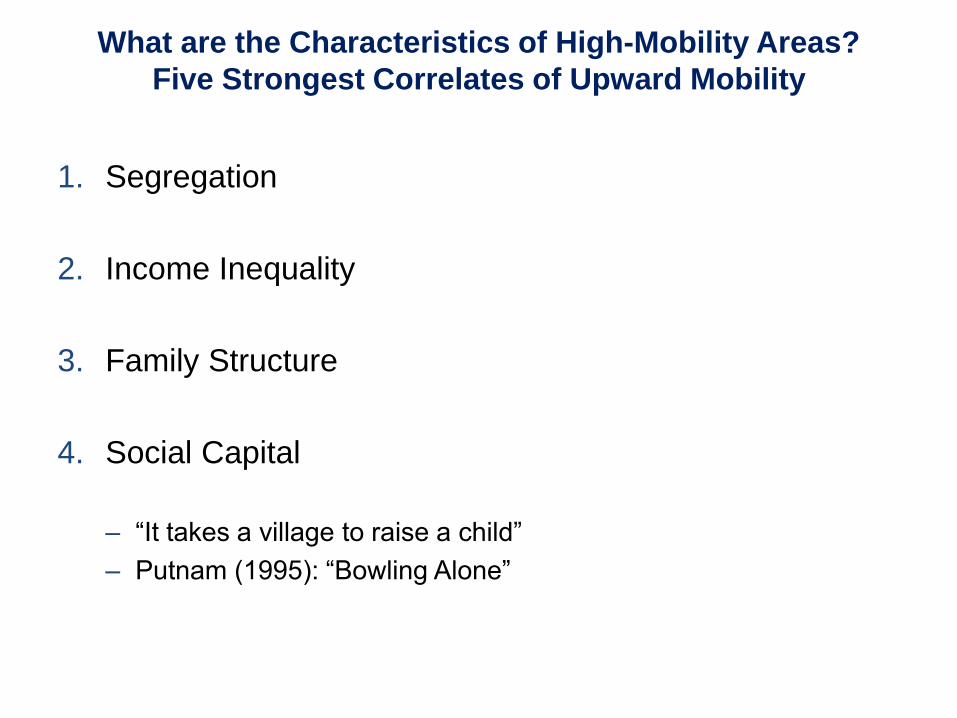
What are the Characteristics of High-Mobility Areas?
Five Strongest Correlates of Upward Mobility
1. Segregation
– Racial and income segregation associated with less mobility
– Long commute times (sprawl) associated with less mobility

1. Segregation
2. Income Inequality
– Places with smaller middle class have much less mobility
What are the Characteristics of High-Mobility Areas?
Five Strongest Correlates of Upward Mobility
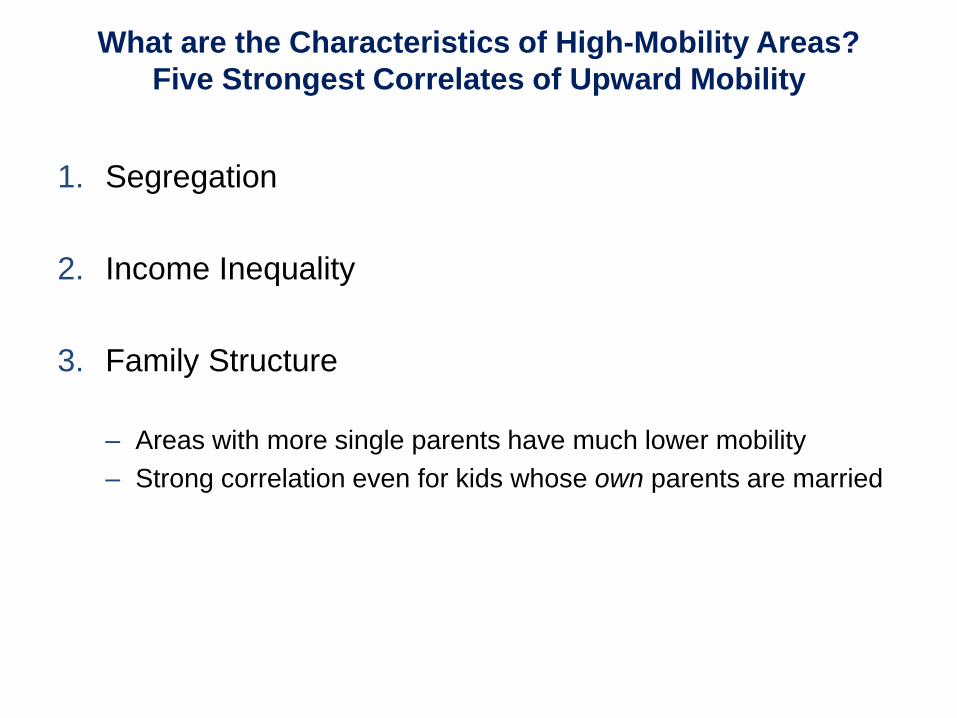
1. Segregation
2. Income Inequality
3. Family Structure
– Areas with more single parents have much lower mobility
– Strong correlation even for kids whose own parents are married
What are the Characteristics of High-Mobility Areas?
Five Strongest Correlates of Upward Mobility
1. Segregation
2. Income Inequality
3. Family Structure
4. Social Capital
– “It takes a village to raise a child”
– Putnam (1995): “Bowling Alone”
What are the Characteristics of High-Mobility Areas?
Five Strongest Correlates of Upward Mobility
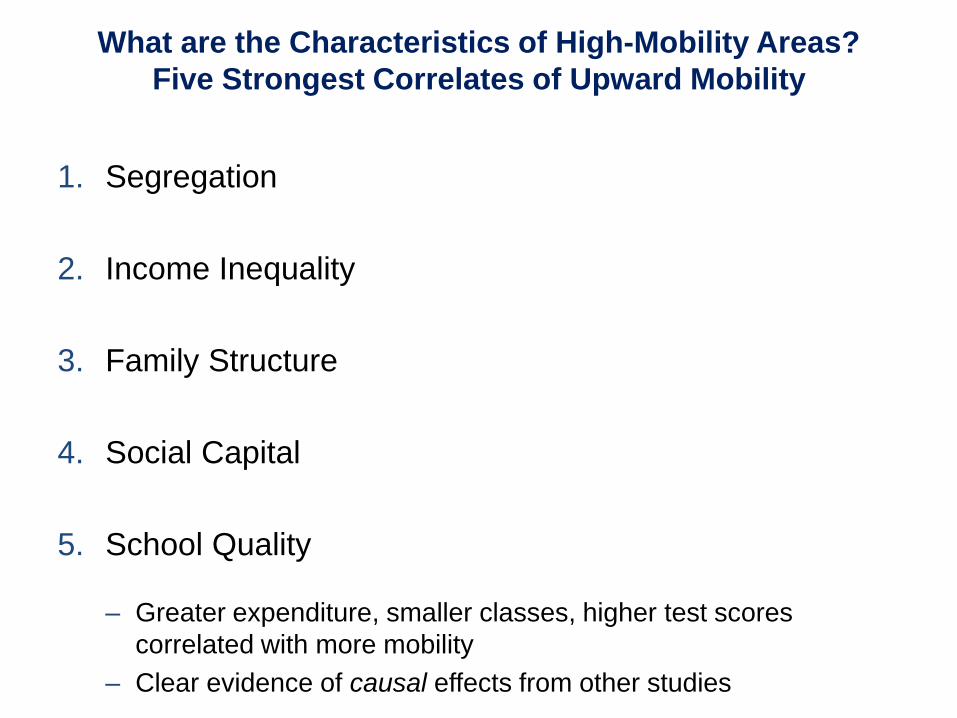
1. Segregation
2. Income Inequality
3. Family Structure
4. Social Capital
5. School Quality
– Greater expenditure, smaller classes, higher test scores
correlated with more mobility
– Clear evidence of causal effects from other studies
What are the Characteristics of High-Mobility Areas?
Five Strongest Correlates of Upward Mobility

Areas with larger African-American populations have
significantly lower levels of upward mobility
Movers evidence shows that this is not only because of
differences in mobility across racial groups
When a given family moves to a county with a larger African-
American population, children’s outcomes fall
Areas with larger African-American populations tend to have
less investment in public goods, schools, etc.
Key implication: place effects amplify racial inequality
We estimate that 20% of black-white earnings gap can be
attributed to county in which blacks vs. whites grow up
Race and Upward Mobility

1. Tackle social mobility at a local, not just national level
Focus on specific cities such as Baltimore and neighborhoods
within those cities
Policy Lessons

1. Tackle social mobility at a local, not just national level
2. Improve childhood environment
Childhood environment matters at all ages until age 20, not just
in early childhood
Policy Lessons

1. Tackle social mobility at a local, not just national level
2. Improve childhood environment
3. Harness big data to evaluate other policies scientifically and measure local progress and performance
Identify which neighborhoods are in greatest need of
improvement and which policies work
Policy Lessons

Download County-Level Data on Social Mobility in the U.S.
www.equality-of-opportunity.org/data

Metro Area Odds of Rising from
Bottom to Top Fifth
Dubuque, IA 17.9%
San Jose, CA 12.9%
Washington DC 10.5%
U.S. Average 7.5%
Chicago, IL 6.5%
Memphis, TN 2.6%
An Opportunity and a Challenge