
Economic migration, social cohesion and development: towards an integrated approach

1
Final report to the Migration Advisory Committee, January 2012 Note: This paper is for discussion purposes only – it does not represent MAC or Home Office policy.
THE IMPACTS OF MIGRATION ON SOCIAL
COHESION AND INTEGRATION
Shamit Saggar, Will Somerville, Rob Ford & Maria Sobolewska

2
Executive Summary
The central issue necessary to answer the question of whether migration has impacted on integration
and social cohesion is conceptual. Integration and social cohesion are elusive concepts that are defined
in different ways. Our approach has been to work backwards, from how the concepts are measured.
This inductive approach is imprecise but has allowed us to make three critical distinctions.
First, migration may have impacts on national identity. Measures here refer to perceptions of
Britishness, measured by opinion polls. The trend over time, such as one can be discerned, is of a move
from an ancestral understanding of Britishness, couched in ethno-cultural fixtures, to one based more
on civic values and responsibilities. There is little evidence that immigration played a role in this, but
those of immigrant heritage are likely to feel this more strongly, suggesting this trend may have been
accelerated by immigration. The broader historical and sociological literature supports this view,
suggesting religion, war, devolution and globalisation undergirds this shift, with migration specifically
playing a limited role.
Secondly, migration may have impacts on integration, defined as group outcomes set against the
societal average. Put differently, this is about understanding the trajectories of first (and second)
generation immigrant performance in a range of economic and social spheres (employment, housing,
health, social interaction, marriage and so on) and is measured in hard and soft ways. Here migration’s
impact assumes a great deal of importance—either complete importance if we understand this to be
migrant groups, or substantial importance as migration and policies that modulate migration have
impacts on trajectories. Notwithstanding that the choice of measure is critical, it is clear that different
immigrant groups perform very differently, with some exhibiting above average performance and others
below average. In policy terms, it is important to develop a sober understanding of those factors that lie
behind different performance records, and how far policy interventions can influence these factors.
Finally, migration may have impacts on cohesion. This refers to how migration affects neighbourhoods,
and is defined by people’s perceptions of how people get along with each other in their local area or
neighbourhood. The current policy emphasis is most associated with the concept of cohesion and as a
consequence this report focuses specifically on the impacts of migration on local areas. We measured
this in two ways, first by perceived positive or negative changes in neighbourliness and in respect and
interaction between social groups, and second by levels of trust in local institutions (such as the police).
Our analysis indicates that it is principally socio-economic deprivation—not migration—that best
explains peoples’ perceptions of their local area. However, existing diversity may partly explain
differences in levels of cohesion. In other words, new migration does not notably affect cohesion but
pre-existing diversity and high levels of poverty are predictors of lower social cohesion.
Our analysis also indicates that on soft measures of integration such as trust in political institutions and
a sense of belonging to Britain—migrants actually score more highly than native-born, native heritage
Britons. Migrants to Britain have a high opinion of British political institutions and rapidly come to feel

3
that they belong in the country. We looked also at values, and found consensus between migrants and
natives on most measures. The exceptions were on measures where migrants may have special
concerns – the value of distinct cultural traditions, the importance of ensuring equal opportunities for all
groups and the negative effects of offensive speech.
There are complexities and caveats to the three distinctions noted here. For example, they may interact:
cohesion perceptions may be nuanced by how immigrant groups perform (on integration) or by worries
among citizens from the white majority over national identity. And national political debate over
immigration—which is often fraught—may also create an anxious climate for local perceptions of
cohesion.
In conclusion, on the basis of both insufficiently robust measures and our headline finding that shows
new immigration has no significant impact on local neighbourhood cohesion, it would be wise for
policymakers to focus on deprivation rather than migration in setting policy on cohesion and integration.
Furthermore, we conclude that it is unfeasible to include a monetised dimension to understanding the
impact of migration on social cohesion within a full economic cost-benefit model; if included in such a
framework, the value should be zero.
Disclaimer
Members of the Migration Advisory Committee (MAC) and its secretariat met and corresponded with
the research authors in order to develop and steer this research project. However, the robustness of the
analysis is the responsibility of the authors, and the findings and views presented in this report do not
necessarily reflect those of the MAC.

4
THE IMPACTS OF MIGRATION
ON SOCIAL COHESION AND INTEGRATION
Contents
Background
Project team
Common acronyms
Tables and figures
Acknowledgements
Part I: Thinking about the social impacts of migration
1. Introduction
2. Method and structure
3. Integration and cohesion: historic and contemporary contexts
4. Integration and cohesion: key ideas and concepts
5. Integration and cohesion: extant empirical measures
Part II: Empirically measuring the social impacts of migration
6. Distilling options for empirical examination of the social impacts of migration
7. Measures and indicators of cohesion and integration
8. Measures and indicators of migration
9. Linking data in order to measure impacts at the local level
10. Measuring the impact of recent migration from within and outside the EEA
11. Research findings: the impact of European and non-European migration on social cohesion
12. Conclusions and policy implications
Appendix
Selected bibliography
5
Background
Background to the research project
The Migration Advisory Committee (MAC) was established in 2007 and advises the government on migration issues. It is a non-departmental public body, sponsored by the Home Office. MAC has considered public service and social impacts of migration as part of its commission from the Government to advise on the first annual limits to Tier 1 and Tier 2 of the Points Based System.1 In that report the MAC said that the evidence base on these impacts of migration was limited, particularly when trying to focus analysis on particular groups of the migrant population. MAC was subsequently commissioned by the Government 'to research the labour market, social and public service impacts of non-EEA migration; and to advise on the use of such evidence in cost-benefit analyses of migration policy decisions.' This report has been commissioned by MAC to inform its work in relation to this request by the Government. MAC specifically asked us to look at whether it is possible to:
Interrogate and improve current understanding of the evidence base
Compare impacts of EEA and non-EEA migration
Consider the impact of migration on social cohesion and integration within an economic cost-benefit framework.
The research team delivered two interim reports. The first dealt with a review of the literature on the concepts and ideas that surround and inform investigation into the impacts of migration on integration and social cohesion. The second was concerned with scoping available data sources and practical aspects of measuring of such impacts. The current report – and the Final Report of this project – consolidates this earlier work and includes a range of formal data analyses on particular impacts. It also addresses the underlying question of the social impacts of migration and their role within wider cost-benefit analytical frameworks.
1 http://www.ukba.homeoffice.gov.uk/aboutus/workingwithus/indbodies/mac/

6
Project team
Shamit Saggar is Professor of Political Science at the University of Sussex. He has published widely on
issues of migration, public policy, ethnic pluralism, counter-terrorism and regulation. His most recent
book – Pariah Politics: Western Radical Islamism and What Should be Done – was published by Oxford
University Press in 2011.
Will Somerville is a Senior Policy Analyst at the Migration Policy Institute (MPI). He has authored over
sixty articles and chapters on various aspects of migration. His most recent book is Immigration under
New Labour published by Policy Press in 2007.
Rob Ford is Hallsworth Research Fellow in the Institute for Social Change at the University of
Manchester. He has authored numerous articles on public attitudes to immigrants and ethnic minorities,
national identity, and voting for radical right parties. He is currently co-authoring a book on the extreme
right in Britain – Voting for Extremists – which is scheduled for publication with Routledge in 2012.
Maria Sobolewska is a Lecturer in Politics (Quantitative Methods) at the University of Manchester. She
specialises in minority integration and published on voting patterns and political alienation of ethnic
minorities and Muslims in Britain. She is currently co-authoring a book based on the findings of a new
Ethnic Minorities British Election Study for the Oxford University Press, due to appear in 2012.

7
List of common acronyms
APS Annual Population Survey
BES British Election Study 2010
BHPS British Household Panel
BSA British Social Attitudes survey
CAS Confirmation of Acceptance to Study (Tier 4 – students)
CS Citizenship Survey
DWP Department of Work and Pensions
EMBES Ethnic Minorities British Election Study 2010
IPS International Passenger Survey
LFS Labour Force Survey
MAC Migration Advisory Committee
NCSR National Centre for Social Research
NINO National Insurance Number
ONS Office for National Statistics
PEU Population Estimates Unit
UKHLS UK Household Longitudinal Study
US Understanding Society study (short name for UKHLS)
WRS Worker Registration Scheme

8
List of tables and figures
Tables
Table 1. Indicators used to measure social cohesion and integration and the clarification as to their
function
Table 2. Summary of measures available in individual and household level data sources
Table 3. Classifications of areas for the testing of the impact of immigration on social cohesion and
integration
Table 4. Time between arrival and registration for migrants registering in 2010/11 by world region of
origin
Table 5. Gross migration inflows and migration inflows as a share of population, 5 largest and 5 smallest
local authorities in our sample
Table 6. Predicting social cohesion, single variable regression models
Table 7. Predicting social cohesion, multiple variable regression models, non-EEA migration
Figures
Figure 1. EEA and non-EEA NINO registrations between 2002 and 2008
Figure 2(a). EEA and non-EEA migrant inflows, authorities with non-EEA inflows below 5%
Figure 2(b). EEA and non EEA migrant inflows, authorities with EEA inflows below 5%
Figure 3(a). Social cohesion scores and non-EEA NINO registrations
Figure 3(b). Social cohesion scores and EEA NINO registrations
Figure 4. Social cohesion scores and index of multiple deprivation scores
Figure 5. Trust in institutions by length of time in Britain
Figure 6. Trust in Parliament by ethnicity and country of birth
Figure 7. Recent migration and belonging to Britain

9
Figure 8. Levels of belonging to Britain by ethnicity and country of birth
Figure 9. Recent migration and strong agreement with maintaining ethnic traditions and ensuring equal
opportunities for groups
Figure 10(a). Strong agreements with “minorities should maintain own customs and traditions” by
ethnicity
Figure 10(b) Strong agreement with “government should make sure all groups have the same
opportunities” by ethnicity
Figure 11. Recent migration and agreement with “people should be free to say what they believe even if
it offends others”
Figure 12. Agreement with “people should be free to say what they believe even if it offends others” by
ethnicity

10
Acknowledgements
We are grateful to the Department of Communities and Local Government for making the Citizenship
Survey data publicly available, to the Department of Work and Pensions for making data on National
Insurance number registrations by nation of origin and local authority area publicly available, and to the
National Centre for Social Research for providing access to the geographical identifiers needed to link
these two sources of data.
We are also grateful to officials at MAC and at UKBA for providing written feedback on earlier drafts of
this report and the interim reports. Helpful verbal feedback was also provided by invited expert
participants at a Findings Workshop organised by the MAC, held at the Home Office in September 2011.

11
Part I: Thinking about the social impacts of migration
1. Introduction
Immigration has affected modern Britain in a number of ways. As a consequence of immigration, people
are different in significant ways from one another and these differences create both opportunities and
challenges. Government has given its name to the job of diluting particular differences that impede
economic inclusion and active citizenship. Other differences such as cultural identity have been forged
into new ways of defining and being British.
The impacts of immigration have been felt in areas ranging from jobs, education and housing through to
language, diet and the arts. The combined social, economic, political and cultural implications of
immigration have frequently been assessed as a whole and also in their discrete parts. Post-colonial
immigration in the mid twentieth century in particular has driven important re-assessments of national
character and opportunity structures, and these have been refined and amplified as Britain has been
touched by new patterns of migration from Europe and beyond.
Immigration results in specific challenges to reduce or remove particular differences between
newcomers and natives. This is what is meant by immigrant integration. There are real stakes involved in
ensuring that second generation migrant offspring experience the same life chances as their peers.
When this does not happen successfully and smoothly in education and employment, for example, the
odds worsen in terms of settled disadvantage giving rise to segregation, mistrust and grievance. Where
gaps are successfully closed, we can speak of a successfully integrated society that has extracted real,
lasting benefits for all through immigration. Both of these pictures are found in Britain today.
A significant component of any assessment is to look at how immigration has affected social
relationships within society. At one level, the impacts that have been felt in jobs, public services and so
on tend indirectly to colour the way in which individuals sense the impacts on the communities in which
they live and work. This may be felt by some more than others, depending on whether immigrants are
perceived to have brought competition or choice to local communities. Greater pressures in objectively
measured employment markets are likely to flow through into subjective felt anxieties about local
communities. The same is also true when looking at how local community relations are viewed and
affected by national political debates about immigration.
The social impacts of immigration are also felt in a more direct manner. This can be seen when
examining people’s sentiment towards their local neighbourhoods and specifically how far they feel that
those around them are pulling together and can be trusted and relied on when needed. “Togetherness”,
as this has been dubbed, has been frequently probed by researchers, partly in order to pin down its
essence, but also to isolate what is most likely to reinforce or unsettle this sentiment. It is notoriously
tricky to measure given that feelings of common purpose are often reflections of prosperous
communities laced with efficient public services.

12
Of course, there can be many things that bring local people together in their everyday lives even though
they may have little in common as a result of immigration. Such similarities and dissimilarities are the
subject of vibrant debate among those keen to know whether immigration’s social impacts are linked to
fragmentation and atomization of communities. When people report that they get along with others
locally, there are many unwritten, unspoken things that unite them. These places are cohesive as a
result.
But we have to be cautious: getting along is not just as an inactive, minimal outcome so long as there is
no overt conflict between people and groups. This may mask tensions and mistrust just below the
surface. A blunt way of thinking about this might be to say that ‘Just because people aren’t fighting,
hardly proves that they like one another!’ A more robust test, by contrast, would be to look for signs of
active cohesiveness in practice, whereby collective action happens and reciprocity is routinely
experienced and not just felt. Ultimately projecting a desire for robustness is a matter of political
judgement.
Formally testing social impacts
In this report we are concerned with probing immigration’s social impacts in the round and introducing
key distinctions in what we are discussing and measuring. The heart of this is a conceptual difficulty that
means that many things are unhelpfully bundled together under the headings of integration and
cohesion. Our initial purpose is to bring some much needed clarity to the matter. Thereafter, we are
concerned with developing a coherent strategy to measure the myriad of relationships between
immigration and a range of social impacts. There are numerous practical, intellectual, ethical,
operational and contextual hurdles along the way, and these are examined systematically in the report.
Finally, we offer an empirical case study that hones in on a particular aspect of cohesion and integration,
and tests the degree to which it is fair to say that immigration damages grassroots perceptions of
common purpose, and the degree to which new and established immigrants have adopted the values
and outlooks of the native born population. This not only identifies a practical way forward for further
empirical measurement but also shows that adverse direct impacts on social cohesion are not present,
and Britain’s migrants are well integrated into mainstream social values.
Finally, we are also interested in the capacity to weigh up the costs and benefits of migration including
its impacts on integration and social cohesion. In order to do so, we need conceptual clarity and
empirical robustness to test for both direct and indirect relationships. The framework and analysis in the
report take the reader through this pathway so that credible conclusions can be drawn about the wider
incorporation of our findings into a formal economic cost-benefit framework.

13
2. Method and structure
This report’s approach to the question of assessing the impacts of migration on integration and social
cohesion is informed by a review of the relevant literature, combined with an overview of potentially
useful data sources. This foundation shaped the strategy employed to identify and analyse particularly
appropriate data sources, enabling an innovative data analysis of the impacts of both European and
non-European migration on local areas, and an examination of the integration of new and old migrants
into mainstream British society.
Methodological overview
Our approach in this paper is in three parts. First, we explored the literature. A standard literature
review was not possible as “migration”, “integration” and “cohesion” span many thousands of published
outputs. Adopting a theoretical, deductive, prescriptive effort to define integration and social cohesion
and then exploring the links to the impacts of migration is unlikely to succeed (see for instance Castles
and Kosack, 1985) because every serious academic work on cohesion and integration refer to the
definitions of the terms being “contested” in some form, suggesting a top-down approach to be
something of a cul-de-sac as applied to the brief of this paper.
Instead, therefore, we took an inductive approach and sought to describe the main clusters/ dimensions
on which integration and cohesion had been analysed in past research. We paid particular attention to
recent official reports in the UK and to literature that referenced or directly referred to quantitative
measures and questions. This required a degree of authorial curation that should be openly
acknowledged. For example, there are at least 200 indicators of integration used across Europe (Council
of Europe, 1997) and it would unwieldy to include them all in a short review of the literature.
Second, we explored strategies for data analysis of the impacts of social cohesion. This involved
exploring individual data sources (we provide an overview of their strengths and weaknesses for the
research question) and how the data could be linked and then mined to address the research questions.
Third, we conducted, in a greater level of detail, an analysis of the impacts of European and non-
European migration on the social cohesion2 of neighbourhoods3. This involved linking local authority
data on migration to measures of cohesion found in the Citizenship survey and employing a series of
statistical techniques (factor analysis, regression analysis) to ascertain what is driving perceived levels of
cohesion and why and to what degree immigration is relevant. We also conducted an analysis of the
integration of migrant minorities, both new and established. This involved examining migrants’
responses in three key areas of “soft” integration – trust in British institutions, belonging to Britain and
values – and comparing these to the responses of native-born Britons to determine whether migrants
are “like” natives on the key measures, and whether they become “more like” natives over time and
across generations.
2 We used a factor analysis to highlight and group two measures of social cohesion: (1) how people get along with
different social groups and (2) trust in local institutions. See below for a full discussion. 3 Neighbourhoods were defined as local authorities; see discussion below for more detail.

14
Structure of the report
The report’s structure reflects our method. Part I assembles the key findings from the literature,
focusing on the essential historical context, key concepts, and finally the extant empirical measures that
can be found in the literature.
Part II of this report provides an overview of data sources and a detailed set of options of how to use
them to yield the most insights. We then focus on what particular research question—a case study—of
the impacts of European and non-European migration on local cohesion. The case study is valuable in its
own right—highlighting important insights for policymakers—but is also intended as an exemplar for
how to investigate similar questions of migration impacts on cohesion and integration.
We conclude with key findings from the data analysis (especially where it is supported in the literature)
and the implications for policymakers. We also point to priority areas for future research.

15
3. Integration and cohesion: historic and contemporary contexts
Contemporary history highlights the early importance policymakers attached to the social impacts of
immigration and the distance they perceived between immigrants and the receiving community. This
report is not directly concerned with integration and cohesion prior to the past decade but it is useful to
remember that Britain has faced a number of integration-centred dilemmas in relation to earlier waves
of immigration.
Post-war New Commonwealth immigration derived mainly from South Asian, African and Caribbean
countries. In the 1960s and 1970s, the perceived cultural gap between these groups and the receiving
society was thought to be large—despite a shared language and historical connection—and their
presence in Britain was highly visible in an overwhelmingly white society. Migration from European
countries, by contrast, was seen to be less challenging, irrespective of the educational, employment and
demographic characteristics of these groups.
Analysis of reports and surveys on integration-related questions from the time (Royal Commission,
1949; Scarman, 1981; Swann, 1985; Runnymede, 2000) indicates there are three crucial questions at the
heart of concerns:
1. “Are they like us?”
2. “Could they be made to be more like us?”
3. “Can we live together?”
To illustrate the point, the 1949 the Royal Commission on Population expressed a desire to ensure that
future cohorts of immigrants should be “of good human stock and not prevented by their religion or
race from intermarrying with the host population and becoming merged in it” (Royal Commission,
1949). This is now a dated point of view, but it nevertheless serves to focus attention on two of the
three key questions of integration: “Are they like us?” and “Could they be made to be more like us?”
The third question of cohesion: “Can we live together?” was asked from the 1950s onwards, as Britain
perceived itself to have a “race problem” in the wake of the 1958 Notting Hill riots (Parekh, 1988). It is
now accepted that there was significant racial discrimination in the post-war era and this hindered
integration outcomes and also perceptions of neighbourhoods by broader society. The work of Kenneth
Little and Anthony Richmond showed racial discrimination was rife for example (Little, 1947; Richmond,
1954). Large-scale surveys of the extent of racial prejudice and discrimination, such as the 1969 survey
by Social and Community Planning Research, successfully highlighted that the problem was endemic in
almost aspects of British society. This empirical knowledge gave impetus to government efforts to
strengthen early anti-discrimination legislation.
More recent work has also shown intolerance of faith in Britain, especially anti-Muslim public sentiment,
sometimes referred to as ‘Islamophobia’. An early survey of religious discrimination by the Home Office
in 2001 found that 86 per cent of Muslims thought that to some degree ignorance of their religion by

16
others was a serious problem, that 37 per cent of Muslims thought that hostility was a ‘very serious’
problem and that 28 per cent cited physical abuse as a problem (Home Office, 2001).
The three questions noted above have permeated immigration politics and policymaking across the
post-war period. Integration and cohesion policy was one of the two central pillars of post-war
policymaking in the period of immigrant settlement between 1948 and 1981.4 Then, policy was aimed at
first-generation immigrants, whereas today it has become associated with immigrants and ethnic
minorities (i.e. second, third, and fourth generations).
Given this change in emphasis, it may be helpful to recall the interpretation of policy from this period.
The best shorthand description remains that of Roy Jenkins, the then Labour Home Secretary, who
pithily described integration in 1966 as ‘not a flattening process of assimilation but equal opportunity
accompanied by cultural diversity in an atmosphere of mutual tolerance’ (Deakin, 1970). This
interpretation became embedded in law and practice and eventually in the concept of the race relations
model.5
The reference to assimilation is apposite to today’s discussion as modern policy discussion excludes such
goals. The goal of integration (or incorporation) seeks convergence in some areas (objective outcomes in
employment for instance) but not all (personal identity and emotions). Not all differences necessarily
reduce or are expected to do so. For instance, attitudes and sentiment among some immigrant groups
may be slow to adjust in terms of feeling of belonging. Among others, it may be quicker (Nazroo and
Karlsen, 2003). Drawing these distinctions and knowing why these variations exist is central to
understanding the potential role of policy.
Assimilation goals in the past focused on how different immigrants were, and what appetite and
capacity there was for making them like everyone else in every respect. In earlier decades, all
identifiable differences were to be reduced or eliminated, which is no longer the objective of
policymakers (Saggar, 1992; Spencer, 1997; Hansen, 2000).
Public and political concern has not however dissipated. A series of real-world events have been
connected to immigration and sparked national interest and anxiety. Three in particular took place at
virtually the same time in 2001: the riots involving minority communities in the northern towns of
Bradford, Burnley, and Oldham in the summer; the Sangatte refugee crisis; and the September 11
terrorist attacks. Such events make salient ongoing concerns. For example, there are long-standing a
proiri concerns with residential segregation and its impact on social cohesion.6 Official reports, such as
4 This period is symbolic, bookended by the major legislative landmarks of the 1948 British Nationality Act and the
1981 British Nationality Act. 5 The three key laws were the 1965, 1968 and 1976 Race Relations Acts.
6 Ghettos, according to this view, are undesirable. However some experts view immigrant enclaves as having
positive effects, at least initially, in terms of reinforcing bonding social capital that enables new immigrants to gain knowledge and support from one another.

17
the 2001 “Cantle Report”, have worried about geographical segregation, claiming it can lead to parallel
lives.
Politicians and commentators have also been deeply concerned by increasing voter support for the far
right British National Party (Ford and Goodwin, 2010). This is not new per se. A path-breaking early study
by Chris Husbands (1983) of anti-immigrant political sentiment pointed out that levels of public support
for far right political parties and movements surged in areas that bordered high immigrant settlement.
This was dubbed the “threat” hypothesis in that white, native opinion was most moved not by the direct
experience of living alongside immigrants but rather by the prospect of having to do so at some
undefined point in the future. However, the very substantial numbers now voting for the BNP have
increased the salience of this concern.
More recent discussions about, and policy measures on, integration and cohesion lack a unifying theme
but a “race relations” model is no longer appropriate. Instead, there are a number of policy measures
that might be bundled together, such as the expansion of human rights and equalities legislation; a
formal refugee integration strategy; community cohesion strategy (2001-2010); elements of counter
terrorism strategy post-2005; citizenship policy and legislation; and additional funding programmed for
minorities (Saggar and Somerville, 2012; Somerville, 2007). Regardless of whether one can describe the
policy shift on integration and cohesion as resembling a new model, the clear lesson from history is that
policy is likely to be a key variable. For example, educational access and programming support for
immigrant children or limitations on access to services for some immigrants will have critical impacts
(Spencer, 2006; 2011).
The historical context of immigration, cohesion and integration goes some way to explain empirical
difficulties with the research question—academia has long focused on minorities over immigrants for
example—but also underlines the perennial nature of concerns over (assumed negative) impacts of
immigration.
Summary
A brief historical overview reveals consistent public and political disquiet over half a century around
immigrant integration, especially around issues of whether or not immigrants share characteristics
similar to the “British” population, and whether those characteristics are becoming diluted over time.
However, the policy response has shifted over time, first away from a goal of assimilation to a model of
race relations, and more recently towards a bundle of broader policies that move beyond anti-
discrimination laws and initiatives.

18
4. Integration and cohesion: key ideas and concepts
In the subsequent section of this report, we move towards defining our approach through an analysis of
key measures. Before proceeding, however, it is important to recognise a number of key ideas in the
literature in order to avoid drawing the wrong conclusions when we narrow the parameters.
The questions highlighted earlier—“Are they like us?”; “Could they be made to be more like us?”; and
“Can we live together?”—point to a number of fundamental ideas that complicate and nuance
assessments of integration and cohesion as they relate to immigration.
First, the questions do not distinguish between processes and goals (Alba and Nee, 2003). Integration
and social cohesion involve elements of of both. To begin with, integration and social cohesion are the
product of ongoing interactions between immigrants and communities—a dynamic, continuous process
of change where immigrants and communities adapt to one another. But an integrated society and
cohesive communities are also thought of as an endpoint, reached when individuals in that society only
minimally perceive themselves and others in racial or ethnic terms, when these attributes have little
impact on opportunities and life chances, and/or when quality of life concerns in neighbourhoods do not
include issues pertaining to immigrants.
This crucial distinction has an important bearing on measures: we must decide how we wish to define
the ideal endpoint (for example, when an immigrant is integrated on the basis of a basket of objective
indicators, or when a community is cohesive, on the basis of good relationships). Thereafter, we must
decide how we assess progress towards this endpoint using snapshots which can only ever provide a
partial account of a dynamic process.
Second, questions about integration and cohesion refer both to differences between people (Are they
like us? Could they be made more like us?) and place (Can we live together?). Integration as a theory
and in general understanding refers to people. Integration as a theory is about identifying and
measuring ethnic, racial and religious dissimilarities, how society is structured around such
dissimilarities, and how social relations evolve over time to reinforce or dilute the effects of such
dissimilarities. Integration as an idea implies a dilution of differences – with the result that, for example,
educational and employment disadvantages narrow or disappear over time. These can usually be
specified and measured so that we can say with reliability how far gaps remain or have been eroded.
Cohesion, in contrast, generally refers to place (meaning neighbourhood or the local community, in a
somewhat different formulation). We do not tend to call a person “cohesive”.
Third, it is important to clarify what we understand, in reference to the first question, as the different
characteristics of immigrants. For instance, the 1949 Royal Commission’s outlook was that key
characteristics such as faith would block mixing across group boundaries; it particularly singled out some
South Asian faiths. This proposition can and has been tested. Research shows some immigrant faith
groups have intermarried outside their groups more than others, and some sections of the receiving

19
society have interacted more with immigrants than others. And the question can be frame from the
opposite end, namely by rates of marriage among indigenous whites to immigrants and the offspring of
children.
The focus on characteristics can be expanded. The critical point is that immigrant groups may have very
different outcomes and trajectories depending on what sphere of human life one is discussing. Different
immigrants and immigrant groups have significantly different voting patterns, settlement patterns, types
of social and cultural interactions, employment and wage rates, civic participation rates, and so on. A
decision on what sphere one is analyzing is a pre-condition of analyzing measures.
Fourth, there are critical caveats around how one measures the integration trajectory of immigrants,
assuming that we expect them to bend towards the societal mean. Two in particular are important. It is
important to acknowledge that migration itself may drive the difference or account for the size of the
“gap” between immigrants and the native-born (for instance lack of familiarity with the UK, may lead to
a slower response to labour market signals). It is also important to acknowledge the problem of the
comparator, i.e. who we are comparing against. A better comparator for progress would be new
immigrants versus longer-standing immigrant groups from the same country (which would help militate
against differences in human capital accumulation and so on). However, usually it is the societal
average, which is more complex. Furthermore, it is a moving average as society is changing.7
Different groups of immigrants to the UK show huge variance in employment rates, earnings, residency,
friendships, and so on. It is meaningless to report that immigrants and natives are not integrated
because the key indicators point to big, aggregate differences. Incisive analysis of immigrant integration
needs to disaggregate migrants according to factors which may influence their integration outcomes—in
particular their origin country, length of residency and skill levels. We should also not lump together
different forms of migration – the pattern of integration outcomes is likely to be very different for
refugees who have claimed asylum in Britain than labour migrants coming to Britain for work. Many
studies seeking to establish causation of a particular integration gap start with the assumption that
much of the gap will be inherent to the group, but also that the majority society (through laws, customs,
attitudes) are responsible in part for the underachievement, once intrinsic characteristics such as human
capital have been accounted for (see for example Dustmann et. al., 2003; Heath and Cheung, 2007).
Fifth, the attitudes and behaviours (typically through institutions) of the existing population have an
important impact on integration outcomes (in employment, housing, marriage etc.) for immigrants. The
main literature here is drawn from political science and includes broad surveys of public attitudes
towards immigration/immigrants (CLG, 2010), studies that differentiate attitudes in particular segments
of the public (Evans, 2003), and also the causes of underlying change in the social attitudes towards
immigration, diversity and race (Ford, 2008, 2011; Putnam, Clark and Fieldhouse, 2010).
7 The historical discussion earlier in this paper highlighted for instance patterns of racist attitudes and behaviours displayed by the UK public that have radically changed in the last 30 years.

20
The question for policymakers to consider in this case is whether, and in what ways, immigration drives
anti-immigrant social and political sentiment. This is particularly the case when the host population
exhibits prejudice and stereotypes, which may then lead to discriminatory practice. The previous section
of this report highlighted how this was important historically. Much work on xenophobia, prejudice and
discrimination comes from the social psychology literature—both its causes and how it might be
mitigated (Dovidio et. al., 2010). This often overlaps with the management of diversity—for example the
effectiveness of diversity training exercises (IES, 2003), broad surveys of changes in the workplace
(Özbilgin and Tatli, 2008), the benefits of diverse workforces (Thomas and Ely, 1996), organisational
adjustment and learning to address hidden bias in processes and policies (Kandola, 2009), and capturing
the lessons of best practice in government and public institutions (UN, 2001).
Sixth, there is the question of whether comparison should be over time (namely migrants compared
with their children) or across peer groups (natives and those descended from native born). This is a
sensitive point since improvement may be recorded in the former dimension more so than in the latter.
One inference can be that differential gaps have narrowed for second generation “migrants” insofar as
they have “moved on” from the position and status of their migrant parents.
The question of who we are talking about overlaps with other issues noted above. For example, a lack of
belonging caused by discrimination may particularly affect the children of immigrants. Sociological
research has pointed to the potential alienation effects that this can lead to, for example (Berthoud,
2000). Consequently, evidence purporting to show that immigrants and the children of immigrants do
not share a common identity or ties with others should be treated with some care.
Seventh, there is considerable debate about the definition of an immigrant. The United Nations
definition of an immigrant (used in official statistics) defines an immigrant as a person born abroad who
arrives with the intention of staying for more than 12 months. It will be obvious to readers that
communities and individuals on the ground do not view migrants or migration in quite this way
(Crawley, 2005). People may define immigrants on ethnic or racial grounds, definitions which may
include the native-born children or grandchildren of migrants, or they may use intended length of stay –
so international students, for example, may not form part of the popular understanding of “immigrant”
since such students are expected to leave once their courses are complete (Migration Observatory,
2011a). Opinion surveys tend to leave “immigrant” open-ended; and where they do not, the UN
definition is rarely employed. For example, the British Social Attitude survey module on immigration in
2003 defined immigrants as “people who come to Britain to settle”.
Finally, assessments of integration and cohesion cannot be entirely divorced from the realm of shared
identity, belonging and common values. A society that is integrated across immigrants and non-
immigrants may for instance not have a strong sense of national identity. A shared sense of national
identity, emphasised in government strategy towards integration and cohesion, can draw on, or repel,
immigrant national or ethnic identity. Much depends on how far an articulation of British national
identity is grounded in terms that are inclusive of cultural differences (Tilley, Exley and Heath, 2004). A
civic-based understanding of national identity seeks to by-pass this problem by focusing on shared

21
values based on democracy, rule of law, equality, freedom of expression, and so on (Smith, 1991). What
matters is the extent to which all groups and communities embrace those values, regardless of other
factors that may separate them.
The commentary thus far will have alerted the reader to the fact that integration is—in the words of
Michael Banton—a “treacherous concept” (2001, pp 151-2) and the same label could be applied to
cohesion. We now turn to defining integration and cohesion through an inductive analysis of
quantitative indicators and measures.
Summary
An examination of the key ideas of integration and cohesion reveals a significant number of caveats.
Without taking them into account, any discussion of integration and social cohesion quickly becomes
pointless and muddled, with different categories and definitions being compared without any degree of
consistency or precision. The main questions to consider in assessing the concepts involved include:
Whether integration and cohesion refer to a process or an endpoint (a dynamic process or a
static goal)
Whether the focus is on groups of immigrants or on a particular place
What aspect of life (economic, social, cultural) one is assessing “progress” on integration
Who one is comparing against—usually the societal mean—which is both a moving target and
one where both policy and the act of migration acts differentially, making any comparison
suspect to some degree
Whether one is comparing immigrants and/or their children over time
How far the attitudes and beliefs of the institutions and population of a country affect
integration and cohesion
How far integration and cohesion connect to Britishness, patriotism and national identity

22
5. Integration and cohesion: extant empirical measures
Our inductive analysis of the literature led us to grouping the various measures into three categories:
1. National identity measures
2. Integration by group measures
3. Cohesion measures in local neighbourhoods
Put in another way, we find measures could be found associated with (1) Britishness or ways of national
life (including feelings of belonging to England, Wales, Scotland and Northern Ireland; levels of
patriotism and so on); (2) with a range of measures associated with immigrants themselves—as a
religious or ethnic group—and their outcomes in education, jobs and so on; and (3) how people felt
about their local community, whether people showed each other respect and how far people felt they
lived in a safe and contented place.
The fact that one cannot remove the shadow of accumulated history and many of the caveats noted
above in relation to the key concepts, makes this a somewhat artificial exercise. For example, when
surveys ask about belonging, they typically focus on local areas (placing them in the third category,
related to the cohesion of neighbourhoods), but they also ask about national belonging (which would be
better placed in the first category, relating to national identity). Another example is that many measures
around personal and group networks and associations refer to encouraging social cohesion in
neighbourhoods. The general thesis is that the fabric of such networks and associations creates social
capital for individuals and groups and that this is essential to social cohesion. Specifically, it is claimed
that areas with low social capital are likely to have low social cohesion. However, social capital
(particularly the value and quality of networks) is also important to how groups progress in a range of
spheres (such as the jobs market), which refers to integration in terms of group outcomes.
It is also worth noting that definitions drawn from government and official reports often attempt to
cover several aspects of the above categories at one and the same time. The definition of integration
developed by the 2007 Commission on Integration and Cohesion (CIC) reflects at least four key
elements: on individual opportunity, institutional fairness, rights and responsibilities, and especially on
public perceptions of good relations between groups8 at local level (CIC, 2007, p 8).
Nevertheless, grouping the measures and indicators into three categories allows us to test empirically
certain aspects of integration and cohesion using proxies or direct measures with a measure of clarity as
to what we mean. The empirical investigation in the second part of this report is therefore shaped in
part by how we interpreted and grouped the literature and partly by what is feasible.
National identity
National identity refers to the inchoate attachment to country or to the development of Britishness
specifically. The majority of literature is historical (Colley, 1992). Where it is sociological (Nairn, 2007), it
8 It is worth stressing that these public perceptions are unlikely to isolate immigrants from minorities in general.

23
tends not to involve empirical measures. The exceptions to this are the work of James Tilly (2004) and
colleagues, and separately Anthony Heath (2007) and colleagues. More recently, there has been work at
the national level on belonging (MORI, 2010) and comparative work in Europe (European Commission,
2011).
There have also been immigrant or minority-only surveys and minority-booster samples that seek to
understand the immigrant perspective. For example, Ben Gidley’s (2011) survey of new citizens shows
strong identification with Britishness. Importantly Gidley finds no correlation between inter-ethnic
friendships and feelings of Britishness, suggesting perhaps that these are often wrongly conflated.
Integration (group outcomes)
A substantial literature seeks to measure the impacts of migration on integration by examining the
outcomes of immigrant groups. This typically examines hard, objectively defined measures, such as
employment rates, education attainment, health outcomes and so on. Much of the literature would
normally be referred to as “immigrant integration” or “immigrant incorporation”.
Examples of such meta-reviews include the work led by Castles and Vertovec in 2001-02 for the Home
Office and, in parallel, the measures of refugee integration (also developed by the Home Office) by Agar
and Strang (Castles et. al., 2001; Agar and Strang, 2008). These two reviews look to establish outcome
gaps, correcting and adjusting for as many circumstantial variables as possible. The literature typically
draws on the disciplines of sociology and economics, although the implicit debt to psychology and
Abraham Maslow’s hierarchy of needs (Maslow, 1943) should not be ignored; his landmark approach
threads through many integration studies today, as it is seen as having purchase on the question of
when—and why—someone feels they belong to a society.
The vast majority of the literature can be separated into policy areas, as noted above, for example
housing, employment, education and health. Indicators run the gamut from employment rates,
unemployment rates, levels of underemployment, earnings, health outcomes, quality of housing etc.
Each policy area has been extensively investigated in this way through a range of qualitative and
quantitative studies, and will not be covered at length here.
The majority of the literature (for example Spencer’s (2006) work for the Home Office that covered
many of these areas, synthesising the literature in the UK) makes the point that for particular groups of
immigrants, very poor outcomes are recorded, while others are at parity with or exceed the UK-born. In
the UK, for instance, there are poor outcomes along a range of indicators for the Bangladeshi and Somali
communities. The important insight here is that very elementary disaggregation between different
immigrant groups points to quite different patterns across a number of indicators. This is a crucial
finding in the UK context.
There is a clear concern throughout this literature—and with the range of indicators—with the socio-
economic integration of first generation immigrants against the native-born and typically, the second
generation against their native-born peers.

24
However, there are also significant literatures associated with other spheres of integration. The most
objective and well-used measure of social and cultural integration (given the intimacy and historic social
stigma involved) is the rate of intermarriage between immigrants and the host society (Muttarak, 2010).
Early US sociological studies of race relations, and later of immigrant/non-immigrant relations,
emphasise marriage as something of a “gold standard” in assessing integration.
Academic interest in family life and structures has also examined demographic differences set against
non-immigrants, highlighting trends towards convergence in birth rates and household size. These
differences can then be linked to the question of differential social needs and appropriate sensitisation
of policy.
The focus on the family here has been markedly different from studies looking at the continuing role of
hierarchy, tradition, customs and norms of expected behaviour in areas such as marriage selection,
inheritance and ritual. For instance, Bhachu’s (1985) study described the persisting influence of pre-
migration hierarchies and customs in regulating collective identity among Ramgarhia Sikhs in the UK.
Peach’s (2007) work has pointed to the importance of restricted marriage preferences comparing
Pakistani Muslims with Indian Sikhs, whilst Shaw’s (1990) study has shown how internal kinship
networks and norms among the former militates against the chances of geographic mobility and
dispersal.
A related issue is the study of the rapidly growing population of “mixed” ethnic/racial heritage, the
product of relationships between immigrant and native partners, or of partners from different minority
groups (Platt, 2009). For example, intermarriage rates among second and third generation descendents
of these early migrants have steadily risen; indeed over 50 percent of children with Afro-Caribbean
heritage in Britain today are the product of mixed partnerships. Among South Asian groups, the baseline
rates are significantly smaller, although trend lines appear to be accelerating for certain sub-groups who
are also associated with educational and employment upward mobility.
In addition to socio-economic and socio-cultural integration trajectories, there is also a substantial
literature on the civic involvement of immigrant groups. This particularly includes second and even third
or fourth generation immigrant group involvement. Measures might include membership of voluntary
organizations, voter registration and turnout, representational outcomes, factors shaping party choice,
etc. Typically the concern is that there is a deficit in political involvement or representation for
immigrant or immigrant descended groups, and that society may be weakened where there is not parity
of involvement. This category is mostly concerned with the political representation and involvement of
immigrants (see for example Cutts et. al., 2007).
This literature is underpinned by competing theories of the political integration of immigrants and
minorities (Saggar and Heath, 1999; Heath et. al., 2011). Some of these have centred on assessing the
degree to which political difference—in attitudes, opinions and behaviours—among immigrants are

25
adequately explained by the factors that psephologists use to account for political difference among
citizens/voters at large (Saggar, 2000).
Social cohesion (within local neighbourhoods)
There are a host of measures around trust and neighbourliness. Most are defined and measured in the
literature in terms of social capital (Fennema and Tillie, 2008). The debate over social capital has also
moved from academia into standard official tracking and analysis (the Office for National Statistics has
for example adopted the OECD’s definition of social capital networks, together with shared norms,
values and understandings that facilitate co-operation within or among groups). It is clear that certain
key aspects of social capital—for example the willingness to trust and cooperate with others and the
possession of wide social networks—are likely to have important consequences for social cohesion and
the part played by immigrants in fostering or impeding such cohesion.
Many of the measures of social capital or local cohesion are perception measures, revolving around
trust in institutions or perceptions of how groups are getting along within a certain locale or to a sense
of belonging of some kind (particularly but not exclusively to the local area). There has been significant
work done with these types of measures, for example with specific groups (Markova and Black, 2007;
Hickman, 2008) and generally (Best Value Indicators from the Audit Commission). (An in-depth
discussion on these measures is found on in the Appendix, p.69.)
There is also a significant literature—mainly emerging from geography, planning and demography—that
is concerned with where immigrants live and how space is shared between natives and migrant groups.
Owen (1994) represents an early example focused on ethnic group spatial patterns, and Finney and
Simpson (2009) more recently have sought to estimate (and cast doubt on) trends towards segregation
across different groups.
Summary
In précis, there are many measures and indicators (comparative indices run to many hundreds) but they
can be usefully sorted in three categories—indicators referencing national identity; indicators referring
to how migrants are advancing (or not) in a range of social, economic, cultural and political dimensions
of life; and finally indicators on local cohesion, meaning how a local community sees itself in terms of
mutual respect and togetherness.
In Part II of this report, to which we now turn, we begin to operationalise these categories, focusing
particularly on the latter.

26
Part II: Empirically measuring the social impacts of migration
6. Distilling options for empirical examination of the social impacts of migration
There are three main issues that will be considered here: the operationalisation and measurement of
the concepts of cohesion and integration; the availability and usability of data on migration levels and
flows as well as on cohesion and integration; and the issue of correct identification and specification of
impacts of immigration on cohesion and integration. These points will be discussed forthwith, but we
will start with the latter as it is of crucial importance for the rest of the discussion on measuring the
impact of immigration on cohesion and integration.
The main difficulty in establishing the impact of recent migration on social cohesion is that social
cohesion may also be influenced by the level of existing ethnic and religious diversity and social
deprivation in an area. There is a great difficulty in separating out the impacts of "new" migration (both
EEA and non-EEA) on cohesion and integration outcomes from the impact of other factors, in particular
"old" migration and pre-existing poverty in the area.
We need to take great care not to erroneously attribute differences in cohesion in these areas to new
migration, particularly given the sensitivity of such a conclusion. This is particularly problematic, of
course, because "new" migrants (particularly new migrants from non-EEA countries) tend to move to
areas which have both (i) lots of previous migrants and (ii) high social deprivation and (iii) also because
residents in these areas will often not recognise any distinction between "new" and "old" migrants.
The perception of immigration among survey respondents will most likely differ from the bureaucratic
definitions of migrant streams. It is highly likely that some respondents asked about migration and their
perception of the levels of migration in the country and their community, are likely to have in mind not
only recent migrants, but long settled migrants, and visible ethnic minorities who may have been born in
Britain. While voters recognise some distinctions – we would argue for example between asylum
seekers, Eastern Europeans and non-Europeans—these are very broad and unlikely to correspond with
bureaucratic criteria.

27
7. Measures and indicators of cohesion and integration
Social cohesion
Cohesion is a vague and elusive concept and there remain questions about the way in which it could be
measured. In the existing literature the preferred indicator is the subjective sense that the people living
in the local area get on well. At its most base level, it could even be used to describe the absence of
overt conflict in a community—such a conception would, however, carry the risk that research might
overlook tensions and strains in communities that did not (or had not yet) spilled over into open conflict.
It is also important to bear in mind that social cohesion is a characteristic of areas and of groups, not
individuals. Yet, most of the available indicators of cohesion are individual-level subjective assessments
of the cohesion of the area in which they live. Not only is the individual’s perception of the area’s
cohesiveness subjective, but so is the size and location of area itself as it is also left to the individual to
delineate subjectively. These are widely used, but may be challenging as we have to extrapolate from
individual level onto a local or group level. This problem, noted in previous studies (Ratcliffe et. al.,
2008), must be kept in mind throughout the analysis. Sadly, it does not have a clear solution in the
absence of more objective indicators. An effort has been made initially by the Home Office (2003) to set
out a number of these more objective indicators, but they have included such indicators as area
deprivation and levels of education of residents, which are usually thought of as predictors rather than
indicators of social cohesion.
It would be far better to base understanding on actual experience whereby respondents would be
probed not on their perceptions but rather concrete actions that involved people of different ethnic or
immigrant backgrounds doing thing together. These might include examples of assisting one another on
a routine daily basis or possibly in times of acute need or even crisis. It might also extend to voluntary
actions such as arranging for children to play together. In any case, the gain would be through less
reliance on subjective perceptions that may be coded with and coloured by various forms of existing
bias and distortion.
Some of the individual-level perceptions can be understood to be more ‘objective’, as they measure
more factual perceptions, than the largely speculative notion of ‘getting along’. These measures include
the individual’s reports that neighbours help each other (the wordings of all the measures are available
in the Appendix). In February 2004, The Economist newspaper dubbed this as a fairly objective test as to
whether neighbours did or did not borrow cups of sugar (or equivalent) from one another. Conceptually
this question lies close to the agreed concept of social cohesion, but there are two issues with using
these questions: first, they ask about neighbourhoods, which is described in the question as smaller than
the local area (the level at which cohesion and its predictors are usually measured), and secondly, these
questions usually form a part of larger battery of questions, some of which are equally speculative as the
social cohesion question (neighbourhood efficacy for example).

28
Such questions on the cohesion of neighbourhoods are often used in existing analyses as predictors and
explanatory factors in models of social cohesion in larger areas (Lawrence and Heath, 2008). Despite
these questions’ different wording, we do not believe they are sufficiently conceptually distinct to be
sure that they are measuring something separate from cohesion. If anything, one could argue that basic
cohesion is needed for the neighbourhoods to be helpful and efficacious and so the neighbourhood
questions measure a state of very deep cohesion. It is hard to imagine neighbours who do not get along
well, but who nevertheless help each other and get together to tackle local problems. As a result we
believe in cases where the preferred question on social cohesion of local area is not available, the
neighbourhood efficacy and helpfulness questions could be used as a proxy. They have in fact been used
as such in previous studies (Ratcliffe et. al., 2008).
Integration
Whereas cohesion and integration seek to address very different issues, as we have made clear, at the
level of measurement these two often get confused and there also is a severe overlap in the measures
used. Investigating whether particular groups are “integrated” focuses on the extent to which
immigrants and minorities share important or desirable characteristics and/or behaviours with the
majority group. These measures stand in contrast to the more objective indicators of integration such as
equal outcomes of immigrants and host population in terms of employment, educational attainment
and income levels (Heath and Cheung 2007, Portes and Rumbaud 2001).
However, for the purposes of this report, we will consider the socio-political measures of integration.
The socio-political (as opposed to labour market or educational) outcomes include voting and other
forms of political participation; feelings of influence locally and nationally; trust in political institutions;
questions about values, rights and responsibilities; shared identity and belonging (questions about
which aspects of identity respondents consider important); perceived conflict between ethnic and
religious identities on one hand and British identity on the other (all measures available in existing
datasets are included in the appendix). These measures concern the degree to which immigrants and
minorities are similar to the native British population.
Many of these measures, especially those of belonging and identity, but also shared values, are often
included in the concept and measurement of cohesion. Social trust is especially confounded as it is often
described as a measure of both cohesion both cohesion (Putnam, 2003; Leigh and Putnam, 2002) and
integration (Tillie 2007, Maxwell 2010).This is awkward, as these two are conceptually distinct, despite
their obvious relationship. So it may well be that to create cohesion, an area, or even the whole society,
needs to share a sense of belonging, identity or certain values, but these are not implicit in the notion
that people or groups ‘get along well’. In fact, an ultimate goal of policymakers may be to ensure that
people who do not share many important aspects of identity (such as ethnic or religious identity) do get
along well – that is, to achieve cohesion in the absence of integration on certain key dimensions.
However, even achieving this aim is likely to involve encouraging a sense of commonality across ethnic
or religious boundaries. Traditionally, in the academic literature, the sense of shared belonging and
identity fall within the remit of integration (see for example Maxwell, 2006).

29
In response to the issues outlined above, we have attempted to clarify which available indicators can
measure cohesion and integration—with the aim to limit any overlap—and which ones can help predict
cohesion and integration.
Table 1. Indicators used to measure social cohesion and integration and the clarification as to their
function
Description Indicator/
Cohesion
Indicator/
Integration
Predictor/
Cohesion
Predictor/
Integration
Headline indicator: people get on well in
area
Yes No No No
People respect ethnic/religious/value
differences in area/neighbourhood
Yes No No No
People share values in area/neighbourhood No Yes No No
Neighbourhood help Yes No No No
Neighbourhood efficacy (collective action) Yes No No No
Sense of belonging to Britain,
neighbourhood, area
No Yes Yes No
Sense of influence locally/nationally No Yes Possibly No
Trust in institutions locally/nationally No Yes Possibly No
Shared values (including rights and
responsibilities)
No Yes Yes No
Participation in civic affairs No Yes Possibly No
Racial discrimination and prejudice and
perceptions of these
No No Possibly Possibly
Socio-economic characteristics of
individuals, groups and areas
No Yes Yes Yes
We now turn to consider the application of these indicators and predictors from several specific data
sources.9
Citizenship Survey. The most extensive data set on social cohesion and integration, and the source used
in much current research on the subject, is the Citizenship Survey series, originated by the Home Office
in 2001 and taken over by the Department of Communities and Local Government in 2007. The survey
was initially biennial, but switched to a rolling quarterly design in 2007. The survey features large
samples (10,000 plus) and boosters of ethnic minorities. The CS surveys feature a rich set of indicators
of cohesion and integration. The CS series was recently cancelled, with the last data covering the period
9 All of these datasets and their documentation, apart from the Ethnic Minorities British Election Study 2010, can
be accessed from Economic and Social Data Service http://www.esds.ac.uk./. The Ethnic Minorities British Election Study 2010 – EMBES – can be found at http://bes2009-10.org/.

30
ending March 2011. Therefore, while it can provide rich insight on social cohesion and integration
outcomes over the past decade, it will not be available as a resource for examining these issues going
forward.
British Household Panel Study/Understanding Society Study. An alternative data source with measures
of social cohesion is the household survey: British Household Panel Study (BHPS)—which has now been
replaced with the expanded Understanding Society study (US). The survey is carried out at the Institute
for Social and Economic Research (ISER) of the University of Essex and is funded by the Economic and
Social Research Council (ESRC). Understanding Society enjoys an increased sample size and a
considerable ethnic minority booster. The main shortcoming of this data is that it samples households in
private ownership only. This is a panel study, so it could be particularly useful in developing a time-
frame of changing attitudes, and if any matching at all can be performed at the local authority level, it
would be possible to speak with greater confidence about the causal impact of migration inflows. The
study includes a measure of country of birth (whether in the UK or outside) and length of stay in the UK.
Understanding Society also includes the country of birth of parents of the respondent which would allow
us to look at the second generation migrants, who may also have an impact on the levels of social
cohesion, especially if they form visible immigrant-origin communities. The measures included there
contain various neighbourhood cohesion questions (in two waves). (Details of the questions available in
BHPS/US are included in the Appendix.) Considering the discontinuation of the CS surveys, this could
indeed become the most useful resource for measuring cohesion.
The British Social Attitudes surveys (BSA). The British Social Attitudes survey is a yearly, cross-sectional,
nationally representative survey, which provides the most in-depth picture of British people’s social and
political attitudes. Hence it is frustrating that issues of social cohesion and integration are hardly ever
included in this survey. Some neighbourhood help and identity items are included in many waves, but
this survey seems most likely to be of use in the future if MAC, or one of the government departments
interested in migration effects, was to sponsor a battery of questions on integration in one of the future
surveys. This survey is carried out by the National Centre for Social Research (NatCen), an independent
research organisation.
The Ethnic Minorities British Election Study (EMBES) 2010 and the British Election Study (BES) 2010
(useful as providing a comparison group for the EMBES only). The EMBES 2010 is a one-off survey of
ethnic minorities of Indian, Pakistani, Bangladeshi, African and Caribbean background conducted
following the last general election. It contains a large number of immigrants. It has a rich variety of
questions on integration from political trust and efficacy, to sense of commonality with British people,
British identity and levels of political engagement and participation. The main BES, which is conducted at
every general election, provides a comparable sample of white people as it shares a lot of questions with
the EMBES and it has been conducted at the same time (following the last general election 2010). The
EMBES also can provide a comparison of integration of more recent migrants with older migrants and
with the second and further generations of immigrant-origin Britons. This dataset contains a great level
of detail on immigration history, respondent’s age at migration, reasons for immigration, citizenship
status, and country of birth of respondents and their parents, as well as levels of involvement in the life

31
in the country of origin. It also contains in-depth information on objective indicators of integration such
as fluency in English, employment, education, income, co-ethnic networks and employment in co-ethnic
businesses, and political engagement. This data will be useful as a comparison between the levels and
patterns of integration among the post-colonial waves of immigration with the newer, EU and non-EU,
wave of immigration in the event that new data on integration of these new migrants would be
collected in the near future.
Table 2. Summary of measures available in individual and household level data sources
Citizenship
Survey
British
Household
Panel Study
British Social
Attitudes
EMBES and
BES 2010
Headline indicator: people get on
well in area
2003-2010 - - -
People respect
ethnic/religious/value differences in
area/neighbourhood
2003-2010 - - -
People share values/are similar in
area/neighbourhood
- Wave 13,18
(2005, 2008)
- -
Neighbourhood help 2001-2010 Wave 13,18
(2005,2008)
1998, 2000,
2005, 2007
-
Neighbourhood efficacy (collective
action)
2003-2010 Wave 13,18
(2005-,2008)
- -
Identity: British, ethnic, religious - 2000-2009 2010
EMBES
Sense of belonging to Britain,
neighbourhood, area
2003-2010 Wave 13,18
(2005,2008)
- -
Sense of influence locally/nationally 2001-2010 - 2000-2009 2010
EMBES, BES
Trust in institutions
locally/nationally
2001-2010 - 2000-3003,
2005-2007,
2009
2010
EMBES, BES
Shared values (including rights and
responsibilities)
2001-2010 - - -
Participation in civic affairs 2001-2010 - 2000-2009 2010,
EMBES, BES
Racial discrimination and prejudice
and perceptions of these
2001-2010 - 2000-2009 2010
EMBES
Socio-economic characteristics of
individuals, groups and areas
2001-2010 All waves All 2010
EMBES, all
BES

32
8. Measures and indicators of migration
There are essentially two kinds of information sources on migration available which could be utilised to
help assess migration impacts. The first type is based on administrative records of all people classified as
migrants that come under the remit of the administrative body collecting the data: such as GP
registrations or National Insurance Number registrations. This type is essentially the whole population of
migrants that are registered with the administrative body in question. The second type is survey based
data on migration, such as the Labour Force Survey and the International Passenger Survey. This type is
a sample of the population of immigrants, and therefore is only representative of the whole population
in so far as the quality of the sample is sound. Both types of data suffer from both known error
(systematic exclusion of certain types of migrants, situations or localities), and unknown error (mistakes
in records or unknown sources of bias in sampling), but arguably the sample-based survey data is easier
to adjust for the unknown sources of error.
The main problem with the administrative data is that it is more likely to cover a narrow set of migrants
as data collection is limited to the remit of the administrative body collecting these data. Surveys
normally are designed to cover a broader population and hence will include more types of migrants.
However, the major problem with using survey is that that more detailed analysis of lower geographical
units (neighbourhoods) and small sub-sets of migrants (for example temporary, lower skilled, non-EEA
only) are much harder to conduct, because the survey samples will contain only small numbers of cases
in each category, making the disaggregated estimates of migration highly uncertain.
Here we consider the general qualities of each data source and how each source might be used to
analyse the four comparative questions of interest to MAC: the impact of EEA versus non-EEA migration;
the impact of permanent versus temporary migration; local impacts compared with national impacts
and the impact of stocks of migrants compared with flows of new migrants.
The Office of National Statistics publishes regular updates to most of these data sources and their
estimates based on combination of these sources.10
Population Estimates Unit migration data (PEU). This data source is created by the Office for National
Statistics and is available from 2002 onwards. It consists of internal and international migration
“component of population change” estimates and is created by combining administrative and survey
data. The Population Estimates Unit at the ONS makes estimates of international migration from
multiple sources. At the regional level estimates are produced from a calibrated combination of
International Passenger Survey (IPS), which is a sample collected at points of entry to the UK, and Labour
Force Survey (LFS) data, which is a household survey commissioned by the Office for National Statistics
(ONS). Local authority estimates are produced by apportioning higher level estimates between different
10
The most recent ONS products are available at: http://www.ons.gov.uk/ons/publications/re-reference-
tables.html?edition=tcm%3A77-222711.

33
authorities according to a regression model, which brings in information from other sources of migration
data such as national insurance number issues (NINO) and local GP registration (Flag 4). Information on
asylum seekers populations is added in from Home Office estimates.
The PEU migration estimates are the most comprehensive available, bringing together information from
almost all the currently available data sources. The PEU is also the only measure to identify levels of
outflow as well as inflow. This enables a calculation of turnover or “churn” in the migrant population,
and therefore may provide a means for comparing the impact of temporary (albeit all migrants included
are long-term migrants of at least a year—including students—with ONS publishing separate figures for
very short term migration) versus permanent migration. Areas which experience very high migration
inflow and outflow may serve as a proxy for temporary migration. In fact, high “churn” may measure
something more valuable than temporary migration per se, namely low attachment to an area. Areas
which experience large volumes of migration inflow and outflow are very likely to have a large migrant
population which does not remain in the area long (though they may move to another area, or leave the
country and return somewhere else soon after). This is the kind of situation which may have integration
and cohesion consequences, as this migrant population is likely to have little interest or incentive to
integrate into the local community.
At present, we do not know if PEU data is disaggregated by region or country of origin, as it this
information is not published on the website (however the data sources used to produce this estimation
could contain this information), or whether PEU data can be disaggregated below local authority level.
The PEU data are likely to provide robust estimates of migration inflows, so if origin (by region)
disaggregation is possible, then this data will provide a high quality source for comparing the impact of
migrants from different regions of the world. The data are also likely to provide the most accurate
estimates of existing migrant and minority populations, and thus a good reference point for comparing
the impact of migrant stocks and migrant flows.
The main drawbacks of the PEU data are that it is only updated annually, and it does not provide
estimates of migration flows at lower levels of aggregation than local authority. Another drawback is the
current lack of disaggregation of migrant inflow and outflow by origins, but this could probably be
available from ONS for future research as many of the sources used to create these estimates includes
this information.
National Insurance Number (NINO) registrations. These data are administrative data collected and
released by the Department of Work and Pensions (DWP). They are available from 2004 onwards and
can be disaggregated by nationality and by region of origin using a publicly available data resource.
These data are updated on a quarterly basis. Anyone wanting to work legally in Britain or claim benefits
must possess a NINO, and there is no minimum stay so this data source captures both long and short
term labour migration. However, it is not able to capture migrants who do not enter the labour market
or the benefits system, for example children, illegal workers, non-working spouses and other
dependents. This is a serious issue as these types of migrants may be perceived to put more pressure on

34
resources such as health system and schools and so these may have actually a large impact on cohesion
that using this data will not capture.
Recent migration from certain countries of origin, such as Pakistan, features a large component of family
reunion migration and this may be systematically excluded by these data. On the other hand, the
combination of frequent updates, the capture of short and long term migrants and publicly available
information disaggregated by locality and by origin region, means that this data source has strong
potential for addressing all the comparisons of interest to MAC. The key unanswered issue with this data
source is whether it will be possible to disaggregate to a lower geographical level than local authority.
This possibility will need to be explored with the ONS and DWP, who gather these statistics. It is highly
likely that access to this data at lower levels will be subject to restrictions and safeguards given its
sensitivity.
The Annual Population Survey. This resource is a survey produced by the ONS quarterly. It combines
results from the main Labour Force Survey (LFS) with data from the Welsh and Scottish boosters for the
LFS. It is a household rather than an individual-level survey. The annual sample size is 120k households,
yielding approximately 360k respondents. Until 2008, this survey only counted migrants who had been
resident for at least 6 months; since 2008 all foreign-born are counted provided they regard the
surveyed address to be their usual residence. Local authority level data and ward level data is available
disaggregated by nation of origin. However, restrictions are applied to ward level data due to disclosure
risks. The large sample size and full population coverage of this dataset make it a potentially valuable
source of information. The principle disadvantages are that as a survey it could be distorted by
differential response rates; for example, migrants with poorer English language skills may be less likely
to participate; and that most communal establishments such as hotels and hostels are excluded from
the sample, which is likely to result in systematic exclusion of certain types of migrants. Also, it is only
available since 2004 so does not capture the earlier, pre-Accession period of migration settlement.
Flag 4 GP registrations. This is an administrative resource. The number of “Flag 4” registrations is
available in each local authority in the 12 months to 31st July each year. “Flag 4” indicates a first time
registration by someone who was born outside the UK and registers for the first time with a UK GP.
There are a number of drawbacks to this data: registration is not compulsory, and most migrants
generally only register when they require medical attention; registration rates vary systematically by age
and gender, with young men particularly unlikely to register; registration rates may vary by migrant
origin country and education level as well.
The main advantage of the dataset is that it captures groups who are not in the labour market—
economically inactive women, dependent children and retirement-age migrants—who may be missed
by other data sources. It is also updated regularly. It is not clear whether this indicator can be
disaggregated by regional of origin or nationality, although the GP registration forms usually do contain
a census question on origin; and it looks unlikely that it can be disaggregated further than local
authority. The drawbacks of this dataset mean it is unlikely to function as much more than a back up to

35
more comprehensive data, or as a complementary data source to NINO data as it is likely to pick up
exactly the kind of migrants that NINO is missing.
The Worker Registration Scheme (WRS). The WRS provides historical administrative data from May
2004 to May 2011 on A8 migrants, including all A8 migrants who stayed to work in Britain for longer
than a month. This data uses postcode address so may be available at ward level, and is definitely
available at local authority level, however the postcodes available are workplace (rather than
individuals’ place of residency) postcodes. Other limitations of the data include lack of coverage for the
self-employed or for those who are not working or claiming benefits; moreover, the fact that each
worker has to register once only, means that their further movements to other employments in other
locations are no longer recorded. This dataset provides an excellent resource for assessing the specific
impact of A8 migrants, as it is the most complete record of their initial settlement patterns. Further, as it
was gathered using postcode addresses, it should be feasible to link this data at low geographical
aggregation levels.
However, this data ceased to be collected in May 2011 following changes to the regulation of A8
migration, and as a result it can only function as a historical record of the first seven years of A8 migrant
settlement. Also, we do not have (and cannot feasibly get) postcode-level data for the relevant
measures of cohesion/integration; since this level of disaggregation cannot be matched by any
individual-level data, it does not actually assist us in measuring impacts at low levels of aggregation at
this point in time. However, matching at levels such as ward should be feasible in future work.
Locations of PBS and work permit applicants. This is administrative data on the locations of the
sponsors of out-of-country Tier 4, Tier 2, Tier 5 and Work permit main applicants who have used
certificates of sponsorship (but may not have been granted visas), disaggregated by postcode. We have
also received data for the locations of the sponsors of in-country and out-of-country Tier 4 main
applicants (but again may not have been granted visas or leave to remain). The utility of this data is
limited in the present because (i) the postcodes refer to workplaces, not residences; (ii) we do not have
(and cannot feasibly get) postcode data for the relevant measures of cohesion/integration, so we are at
present unable to conduct analysis of cohesion or integration outcomes at very low levels of
geographical aggregation; and (iii) Tier 5 and Tier 2 migrants area relatively small stream of highly skilled
workers, concentrated in London and university towns.
The latter group may not have as much impact on cohesion/integration anyway for two reasons. First of
all, they concentrate in areas more used to a steady inflow of highly skilled migration, which may not
have experienced the growth of recent years; secondly, highly skilled migrants may be perceived to put
less pressure on the community resources. Recent polling suggests that this is not the idea of ‘migrant’
held in the mind of public opinion (Migration Observatory, 2011b).
Summary
The best overall data sources to establish local levels and flows of immigration going forward are likely
to be the PEU estimates and the NINO registrations. The PEU figures provide the most robust estimate

36
of migrant inflows at the local authority level, and therefore will be the best place to start in estimating
and comparing impacts at this higher level of aggregation. However, these data currently do not provide
a breakdown by origin of the migrants. For the case study presented below, the NINO data, despite its
exclusion of dependants, illegal and economically inactive migrants, is the most usable resource at this
time. For future research we would recommend complementing NINO data with the Flag 4 data.

37
9. Linking data in order to measure impacts at the local level
The previous two chapters of this report provided an overview of specific cohesion and migration data
sources. To examine the impacts of migration on cohesion and integration outcomes, it is necessary to
link administrative data on migration levels to the survey data measuring the outcomes of interest to us.
Doing this requires access to geographical identifier data, enabling the two sources of information to be
matched.
A key issue for researchers examining this issue is to resolve is which geographical identifiers to use.
Judging the best approach involves a trade-off on two fronts. First, national or regional levels of
migration may impact cohesion and integration outcomes. This is because it could be the perception of
growing immigration, rather than the first-hand experience of it, which impacts on attitudes. This has
been shown to be the case for the relationship between ethnic diversity and levels of BNP support as
people in areas adjacent to diverse neighbourhood showed greater support for BNP than people
actually living among ethnically diverse neighbours (Biggs and Knauss, 2011). Secondly, lower levels of
geographical aggregation better reflect the day to day social environment in which individuals
experience the impacts of migration on their lives, and also capture greater variation in the level and
pattern of migration enabling more accurate analysis of different migration impacts.
However, identifiers tying individuals to smaller geographical areas also come with heightened
disclosure risk—the risk that a particular survey respondent or immigrant can be identified within the
dataset and have their privacy compromised. As a result, data administrators impose stricter restrictions
on the release of lower level geographical identifiers, which can greatly increase the time and resources
needed to undertake analysis. Many data sources also do not gather or retain information at the lowest
geographical levels, narrowing the range of data sources available to use in analysis. We consider four
different geographical levels of aggregation: nation; government office region; local authority; and ward.
Nation. Analysis conducted at the national level would link overall migration inflow figures to
aggregated average integration and social cohesion outcomes. The main source of variation in this case
would be time. National level analysis could look at overall trends in key cohesion and integration
indicators, and how these have evolved over time for particular subgroups such as social classes,
generations and ethnic groups.
The limitation of national analysis is that there is no scope for disaggregating migration impacts to
examine the more specific effects of interest to MAC. National level analysis can provide valuable
background information on the overall trend in key outcomes during a period of high migration, but
cannot tell us where specifically such impacts are being felt, or which migrant groups are generating
them. However, since as we mentioned before, national trends can shape perceptions of migration as
much as individual experience of it, it is an important level to include in more detailed studies.

38
Region. All the data sources discussed here contain identifiers for government office region. Such
regions are large, typically several million people, but are also unevenly sized both in population and
geographical terms. There are nine England regions plus Scotland, Wales and Northern Ireland each
form their own region. Some reflect a clear geographical and social reality, such as Wales or the North
East of England. Others are administrative constructs with little meaning for the people living in them,
such as the East of England. Regional borders do generally have a social and economic logic to them, and
as such regions tend to reflect significant and relatively distinct economic and social environments.
There are large variations in both pre-existing diversity and patterns of migration between regions. A
regional analysis, particularly when combined with trends over time, can significantly enrich the picture
of overall migration impacts, at relatively low cost in terms of data combination and preparation.
Regions, however, correspond very little to the everyday experience of citizens in Britain, or to the
settlement patterns of migrants, and this level may also be largely absent from people’s
consciousness—thus making it harder for the regional level variation to shape perceptions of
immigration. Each region is likely to have areas where migration has concentrated and others where it is
completely absent. Analysis of regions must necessarily aggregate together a great deal of such
variation, which is a serious limit on its utility.
Local authority. Most of the migration data sources discussed here provides information on migration
flows at local authority level, including information on flows disaggregated by region of origin and
perhaps on other criteria also. Local authority identifiers are also available on request for the main
indicator data sources, and we have already received authorisation for these to be released for CS and
BSA data held by the National Centre for Social Research. Thus, we can be very confident of being able
to carry out analysis at this geographical level. Local authorities’ boundaries have been developed over
long periods of time, and typically reflect social and economic features of importance for citizens. For
most citizens, a local authority will capture a key part of the area in which they live their everyday lives,
and hence the area in which migration impacts will be felt.
However, local authorities are too large to be considered a good proxy for an individual’s
“neighbourhood”—most have populations of several hundred thousand. They also vary greatly in size
and population—the largest local authority (Birmingham) has nearly a million people while the smallest
(West Somerset) has 35,000 people. A further complicating factor with undertaking analysis over time at
local authority level is the evolution in local government organisation, with some authorities being
reorganised or amalgamated, most recently in 2009. Still, considering data-access difficulties, the local
authority unit is the most viable option for any analysis in the short term, and will be used in our case
study.
Electoral ward. Electoral wards are the basic unit of political geography, used to elect local councillors
and to form the basis for drawing parliamentary constituency boundaries. The UK currently has 9,434
electoral wards, which have an average of 5,500 people in them. Wards are more uniform in size and
population than the larger geographical units of local authorities, and correspond more closely to the
subjective concept of “neighbourhood”. This is because wards encompass a compact contiguous unit of

39
a few thousand people, whose boundaries are usually drawn with an awareness of local identity and
local geography. At present we are aware of very few migration data source available disaggregated to
ward level—the Annual Population Survey being the prominent example.
The main note of caution is that access to ward level data is restricted: the data can only be used in a
secure location administered by the ONS Secure Data Service. Ward identifiers are likely to be available
for the CS, BSA and other survey data sources, but will also be subject to similar restrictions. Finding a
way of combining the two data sources will therefore require access negotiations with holders of both
the migration and the integration/cohesion datasets and further negotiations to find a way to combine
the two datasets. Data combination and analysis may require the researchers to travel to the location
where secure data is held, incurring significant time and transport costs. However, there are significant
advantages to conducting analysis at this level which make these costs worth bearing. Wards provide us
with a good proxy for the local area as experienced by individuals, and also provide a large set of
localities with varying migration experiences and pre-existing diversity. Disaggregated analysis of the
impact of different migration flows, such as temporary vs permanent, EEA vs non-EEA or stocks vs flows
will produce much clearer and more robust findings at this level than at higher levels of aggregation.
The ideal focus for analysis of migration impacts would be at the ward level, or even at lower levels of
aggregation such as Lower Super Output Area.11 This would enable fine grained analysis which could
begin to disaggregate the effects of different new migration flows, and of different kinds of local social
context on integration and cohesion outcomes. However, obtaining the migration data at such low level
of aggregation is in most cases not possible, and even if it were, securing the release of geographical
identifiers to match migration flows to local areas is often difficult. Also, since the data on levels of social
cohesion and integration are only available from sample-based surveys, the possibility of obtaining
reliable estimates on such a low level is very low. Therefore, we consider the ward level the lowest
useful level of disaggregation, and the local authority level to be the best starting point for analysis.
Although it has its limits, it has the considerable advantage that many public sources of data are already
available at this level.
The case study that follows in chapter 11 therefore analyses data at local authority level. However, a
further distinction is of particular interest to policymakers and the MAC specifically—comparing social
impacts between European and non-European migrants.
11
Lower Super Output Areas are small geographical units built from clusters of output areas, which in turn are defined by postcodes. They are small units of 1,000-1,500 people. They are employed as a standard ONS data category and therefore codes for them are available for many datasets.

40
10. Measuring the impact of recent migration from within and outside the EEA
Developing a strategy to assess impact by nationality or region of origin
A starting point for us is the degree to which the most recent inflow of migrants, particularly European
Union (EU) accession migrants, have settled over a much wider area than previous migrant flows. Earlier
settlement waves of New Commonwealth immigrants were concentrated on London, other large cities
and some northern mill towns. According to the NINO data examined here, the correlation between EEA
and non-EEA migration was very high (0.9) and both forms were concentrated in areas with high ethnic
diversity (London, other large cities)
New migration and previous diversity may interact with each other—for example, established minorities
may be particularly welcoming of new migrants, or particularly threatened by them; equally, migration
may have a larger impact on cohesion in areas with no experience of receiving and integrating new
migrant groups. (In terms of further research on the relationship between migration and cohesion and
integration specifically, it would helpful to think of particular ways of categorising the data. For example,
British neighbourhoods could be separated for such research into four categories, based on pre-existing
diversity and new migration flows, as Table 3 shows.)
Table 3. Classifications of areas for the testing of the impact of immigration on social cohesion and
integration
Existing minority population
Migration inflow since 2000
Homogenous authorities, low
recent migration
Diverse authorities, low recent
migration
Homogenous authorities, high
recent migration
Diverse authorities, high recent
migration
This in turn raises another question: how does the impact of recent migrants compare to the presence
of ‘older’ ethnic minority groups on local levels of social cohesion? Do immigrants and immigrant-origin
minorities perceive social cohesion differently to the native majority? We can also look at whether area
characteristics are associated with worse cohesion outcomes, but in the analysis for this report we can
only do so in a very limited fashion. These other factors could include the following: relative deprivation
(which was shown elsewhere to have an impact (Lawrence, 2011)), type of housing (social, rental versus
ownership), and socio-economic profile of the population (in particular pre-existing socio-economic
deprivation).

41
Alternative strategies
If we were to take a different approach and look more closely at the integration of particular immigrant
groups, more difficulties are surfaced. We would have to identify the groups whose integration
outcomes are of particular interest to policy-makers and the soft and hard measures of integration,
which are available for these groups. As noted in the broader literature, we would need to control for
the influence of a number of factors such as ethnicity, skills, origin region or destination region in
measuring immigrants’ integration outcomes.
It may be too early to conduct such work on certain Eastern European nationalities in particular. This is
because the inclusion of recent immigrants in any analytically useful numbers in established surveys is
unlikely and the administrative data measuring immigrant success on a range of measures is not yet
available.
Another option is to examine the success Britain has had in integrating the most recent influx of
migrants compared to earlier British migration waves or compared to other countries. The success of
integration of ‘new’ migrants will only be possible when the main data problems discussed above are
resolved. However, it is important to note that the integration outcomes of the ‘old’ postcolonial
immigration are available for comparison through a number of studies (some discussed earlier), which
have a booster sample of ethnic minorities.
In the case study analysis we adopt this approach – examining the responses of recent migrants on key
integration indicators – belonging, trust in institutions, values – and comparing these responses to those
of both more established migrants, the ethnic minority second generation and Britons with no migration
heritage.

42
11. Research findings: the impact of European and non-European migration on social cohesion
Assessing the impact of EEA and non-EEA migration on social cohesion and integration
To provide an initial examination of the impact of migration inflows from the European Economic Area
(EEA) and outside it, we employ three key sources of data. The first is the National Insurance Number
(NINO) registrations datasets maintained by the Department of Work and Pensions (DWP). These data
have some important advantages. As administrative data, they record the total number of migrants
coming into a region, rather than estimating them based on a survey sample as is done for other sources
such as the Annual Population Survey (based on the Labour Force Survey) and the ONS Long Term
International Migration estimates (based primarily on the International Passenger Survey). This
distinction is important when examining effects of migration flows at the local authority level, as we do
in this analysis, because survey based estimates of migration inflows to local authority will be based on a
small sample, and therefore subject to considerable error. The much greater coverage of the NINO
dataset – which includes all migrants registered for work – allows more robust disaggregation to lower
geographical levels.
However, the NINO data also have important shortcomings. They do not record the date a migrant
arrives, but only the date they register onto the NINO system, usually in order to work or claim benefits.
The delay between arrival and registration is typically a number of months, and varies somewhat
between migrant groups, and may also vary over time. The data also do not make any record of
migrants who have not yet registered to work or receive benefits in the UK. This may include significant
portions of the migrant population, for example family members who are caring for children full time, or
are past working age, and asylum seekers, who are not eligible to work. Conversely, people from such
migration streams may register for work a number of years after they arrive in Britain, for example as a
result of entering the labour force once children are grown, or having an asylum claim accepted. The
DWP also record the dates of arrival for migrants, but do not make these data public. Table 4 shows the
distribution of registration times for migrants from different origin regions.
Table 4. Time between arrival and registration for migrants registering in 2010/11 by world region of
origin
Region of origin Total
(‘000)
0-3
months
3-6
months
6-12
months
1-2 years 2 years
plus
EU (excluding A10) 134.96 57% 22% 11% 6% 5%
EU A10 224.76 53% 26% 12% 5% 4%
Non-EU Europe 16.64 32% 16% 15% 11% 26%
EEA total 376.36 53% 24% 12% 6% 8%
Africa 59.72 39% 10% 7% 5% 39%

43
Asia and Middle East 213.53 57% 14% 9% 6% 14%
Americas 32.78 44% 17% 13% 9% 18%
Australasia/Oceania 21.59 68% 18% 7% 3% 3%
Non-EEA total 327.62 53% 14% 9% 6% 18%
Source: DWP
We can see evidence of some variation between regions, particularly in the proportion of registrations
coming more than two years after arrival. While only 5% of EU migrants first registered so late, some
39% of national insurance numbers issued to Africans in 2010/11 were issued more than two years after
their first arrival in Britain. The overall differences between EEA and non-EEA regions are rather smaller,
however, as the origin regions supplying the bulk of migrants in both categories tend to register
relatively quickly. Overall, 89% of EEA migrants in the NINO database registered within a year of arrival,
and 76% of non-EEA migrants did likewise. The reasons for this disparity are not obvious based on these
data. The NINO data also does not record the departure of migrants, which is likely to lead to an over-
estimation of the total migration inflow, and to produce some further biases, as migration from regions
with higher rates of short term or circular migration is likely to be over-estimated.
Table 5. Gross migration inflows and migration inflows as a share of population, 5 largest and 5
smallest local authorities in our sample
Authority Population
2008
(‘000)
EEA NINOs
2002-8
(‘000)
Non-EEA
NINOs 2002-
8 (‘000)
EEA NINOs
(%)
Non-EEA
NINOs
(%)
Largest authorities
Birmingham 1019.2 28.6 47.2 2.8 4.6
Leeds 779.3 19.8 23.7 2.5 3.0
Sheffield 539.8 10.4 16.2 1.9 3.0
Bradford 501.4 12.9 17.2 2.6 3.4
Manchester 473.2 27.3 33.9 5.8 7.2
Smallest
authorities
West Somerset 35.6 0.84 0.15 2.4 0.4
Rutland 38.1 0.39 0.18 1.0 0.5
Eden 51.7 1.27 0.52 2.5 1.0
West Devon 52.8 0.79 0.21 1.5 0.4
Merthyr Tydfil 55.6 1.75 0.29 3.1 0.5

44
Despite these shortcomings, the NINO dataset does provide us with an up to date estimate of broad
patterns of migration inflow into British local authorities. We combined annual data from 2002 to 2008
to produce an estimate of the total migration inflows from EEA and non-EEA sources to each British local
authority over the seven year period. However, these raw estimates do not give an accurate picture of
migration inflows, as British local authorities vary greatly in size. A migration inflow of 10,000 to
Birmingham (population 1 million) local authority is likely to have much less impact than the same
inflow to West Somerset (population 36 thousand). We therefore need an up to date estimate of each
local authority in order to calculate migration inflows as a share of the total population. For this we use
the ONS Population Estimates Unit mid-year population estimates, the most comprehensive population
data source currently available on an annual basis for small areas. Table 5 above compares gross
migration inflows and flows as a share of the population for the five largest and smallest authorities in
our sample.
Figure 1. EEA and non-EEA NINO registrations between 2002 and 2008
05
10
15
20
% E
EA
mig
rant
NIN
O r
egis
tra
tio
n 2
002-8
0 5 10 15 20 25% non-EEA migrant NINO registrations 2002-8
Linear relationship Individual local authority
The measures of EEA and non-EEA inflows from 2002-8 as a share of 2008 estimated population in the
local authority provide us with our key independent measures. Table 5 provides some information on
which councils received the largest and smallest inflows of EEA and non-EEA migrant as shares of their

45
population between 2002 and 2008. How do these two migration streams relate to each other? Figure 1
above shows the relationship between the two migration inflows at local authority level. The size of the
circles in this figure represents the population size of the local authorities. As is clear from the figure, the
relationship between the two migrant flows is very strong – the correlation level is 0.86. In other words,
local authorities with high levels of EEA migration tend to have high non-EEA migration, and vice-versa.
This makes separating the impact of one form of migration from the other very difficult.
Figure 2(a). EEA and non-EEA migrant inflows, authorities with non-EEA inflows below 5%
05
10
15
EE
A m
igra
nt
NIN
O r
egis
tratins 2
002-8
0 1 2 3 4 5non-EEA migrant NINO registrations
Linear relationship Individual local authorities
Are there any areas with high inflows from one region, but few migrants settling from the other? Figure
2(a) tests this by looking at the pattern of migrant settlement in authorities receiving inflows equivalent
to less than 5% of their population from non-EEA regions. The first chart reveals a number of authorities
with very high EEA inflows but low non-EEA inflows – the circles located above and to the left of the
best-fit line. These include a number of rural English authorities such as Boston, Peterborough, Fenland
and Breckland, which have experienced large inflows of EEA migrants, most likely to work in agriculture,
but little or no non-EEA migrant inflow has occurred. A number of smaller English towns and cities also
feature – including Brighton, Bournemouth, Northampton and Rugby – suggesting that EEA migration
has spread to many smaller population centres which migrants from outside Europe have avoided.

46
Figure 2(b). EEA and non EEA migrant inflows, authorities with EEA inflows below 5% 0
24
68
Non
-EE
A m
igra
nt
NIN
O r
egis
tra
tio
ns 2
00
2-8
0 1 2 3 4 5EEA migrant NINO registrations 2002-8
Fitted values (mean) nino0208noneeash
The converse relationship is shown in figure 2(a). There are fewer outliers a long way above the line on
this chart, suggesting that there has been at least some EEA migration to most areas with significant
non-EEA migration. There are, however, a number of authorities clustered in the top right of the chart –
places where the portion of non-EEA migrants arriving between 2002 and 2008 is around double the
portion of EEA migrants. These tend to be in diverse outer London authorities such as Croydon,
Hillingdon and Redbridge, and cities with large established ethnic minority populations such as
Birmingham, Oldham and Sheffield. While many of the areas with high EEA migration but low non-EEA
migration tend to be areas with little previous ethnic diversity according to the 2001 census, areas
favoured by migrants from outside Europe but ignored by migrants from within Europe tend to be areas
which already had large ethnic minority communities in 2001. This fits with what we would expect from
research on migration over long distances: migrants tend to cluster in areas with an established
community from their own group, as they are likely to have social contacts in such areas. This may be
less of a concern for EEA migrants, many of whom may view their migration as short term, and who may
face less difficulty integrating into British society.
47
Establishing the impact of migration on social cohesion and integration
To measures social cohesion and integration, we turn to the Citizenship Survey (CS) 2008-9. This is the
latest wave of the CS for which we were able to secure local authority identifiers12 and therefore
provides us with the best estimate of the cumulative impact of recent migration inflows. Our analysis of
impacts will proceed in three steps. First, we will look at the aggregate relationship between migration
inflow and local authority mean scores on our indicators of social cohesion. We then examine whether
how these relationships are affected by controlling for two predictors of social cohesion and integration
which are often discussed in the literature – namely, socio-economic deprivation and ethnic diversity. To
examine integration, we turn to individual level data from the CS and compare the responses of recent
migrants, established migrants, the native born children of migrants and the majority population with
no migrant heritage on three key indicators: institutional trust, belonging to Britain and values.
The local authority is a relatively high level of geographical aggregation for examining factors such as
social cohesion and integration, which are likely to be mainly perceptions about conditions in an
individual’s immediate neighbourhood. The mean local authority in our sample has a population of
166,000 – much beyond what most people have in mind as their “local community”. As a result of their
large size, local authorities also tend to be socially heterogeneous: many local authorities are likely to
include both wealthy and poor areas, and ethnically homogenous areas alongside very diverse ones.
Local authorities’ distance from respondents’ everyday experience, and their social heterogeneity, are
likely to dilute any contextual effect of authority conditions on individuals’ perceptions of social
cohesion and integration. Respondents are unlikely to have the whole authority area in mind when
answering these questions about their local area, and our average figures will necessarily bring together
responses from people living in very different neighbourhood contexts. The influence of average
authority conditions is likely to be weak, and we should employ the most sensitive measures we can to
see if any can be detected.
Combining responses to several survey questions can provide a more sensitive measure of a concept, as
the range of possible responses is greater when several questions are combined. Of course, this is only
sensible if we can reasonably argue that the same concerns are driving responses to all of the questions
we combine in this fashion. Factor analysis is a statistical tool we can employ to test whether responses
to a set of questions can be treated as measures of a single underlying factor. We therefore selected
sets of items from the CS which seemed intuitively to deal with the common issues of social cohesion
and integration and subjected them to a series of factor analysis, looking for items we could combine
into reliable scales measuring these concepts.13 For social cohesion, we constructed a measure from
four items: whether respondents think local people would “pull together” to improve the
neighbourhood; whether they feel people in the neighbourhood can be trusted; how satisfied they are
with the neighbourhood as a place to live; and whether they regard the location as an area where
12
We are grateful to the National Centre for Social Research for assistance in constructing the integrated CS dataset with local authority identifiers 13
Details of the factor analysis results are available from the authors on request.

48
people get on well together. Our analysis indicated that these four items load strongly together strongly,
meaning they tap the same core concept, so we use them to build a scale of social cohesion.
We analyse integration at the individual level focusing on three measures: trust in three British
institutions—the police, their local council and parliament; a sense of belonging to Britain and measures
of support for key social values such as equal opportunities and free speech. We compare the responses
on these items given by recent and established migrants, the children of migrants and native born
Britons without migrant heritage.
Analysis 1: The link between migration and social cohesion
The first step is to look at the simple relationship between immigration settlement and social cohesion.
Figures 3 (a) and (b) below plots NINO registration rates from EEA and non-EEA countries against the
mean scores on the social cohesion scale in our sample of local authorities. The circles represent
individual local authorities; the size of each circle reflects the population of the local authority it
represents. Both scatter plots suggest a negative relationship between migrant inflows and social
cohesion. It therefore does seem that local authorities which have experienced larger inflows of
migrants are regarded by their residents as being less socially cohesive.
Figure 3(a). Social cohesion scores and non-EEA NINO registrations
.5.6
.7.8
.9
Mea
n lo
c a
uth
socia
l coh
esio
n (
0-1
scale
)
0 5 10 15 20 25non-EEA migrant NINO registrations 2002-8 (%)
95% CI Fitted values
Invidivual local authorities

49
Figure 3(b). Social cohesion scores and EEA NINO registrations
.5.6
.7.8
.9
Mea
n lo
c a
uth
socia
l coh
esio
n (
0-1
scale
)
0 5 10 15 20EEA migrant NINO registrations 2002-8 (%)
95% CI Fitted values
Individual local authorities
Table 6 below examines the strength of this relationship with two alternative explanations for low social
cohesion: economic and social deprivation, measured using the 2007 Index of Multiple Deprivation
average scores, and pre-existing social diversity, measured using the proportion of residents in the local
authority who were non-white at the time of the 2001 census. The regression models in table 6 suggest
that migration is a worse predictor of social cohesion than either of these alternative explanations. The
R-squared statistic summarises how well each factor seems to explain variation in social cohesion. For
the two different forms of migration, the R squared statistics are 0.09 and 0.11 suggesting they explain
around 10% of the variation between authorities. For diversity, the R squared rises to 0.13, while the
deprivation model performs best of all, with an R squared of 0.28. Over one quarter of all the variation
in cohesion scores can thus be explained using the authorities’ average scores on the index for multiple
deprivation. This provides a strong indication that perceptions of social cohesion are more related to
social and economic deprivation than to recent migration inflows.

50
Table 6. Predicting social cohesion, single variable regression models
Model 1: EEA
mig only
Model 2: non-
EEA mig only
Model 3:
deprivation
only
Model 4:
Diversity only
Intercept 0.73*** 0.73*** 0.78*** 0.73***
EEA NINO
registrations 2002-8
-0.0057*** * * *
Non-EEA NINO
registrations 2002-8
* -0.0058*** * *
Index of Multiple
Deprivation 2007
* * -0.0034*** *
% non-white (2001
Census)
* * * -0.0021***
R squared 0.09 0.11 0.28 0.13
F-statistic 31.8 38.6 112.5 45.3
N 302 302 293 299
This finding is illustrated in figure 4 below, which shows the relationship between social cohesion scores
and index for multiple deprivation scores. The individual authorities here cluster much more closely to
the regression line, suggesting that most do not deviate from the expected relationship. Increases in
local authority deprivation are nearly always associated with a decline in perceptions of social cohesion
among residents.

51
Figure 4. Social cohesion scores and index of multiple deprivation scores .5
.6.7
.8.9
Mea
n lo
c a
uth
socia
l coh
esio
n (
0-1
scale
)
0 10 20 30 40 50Mean score, index of multiple deprivation 2007
95% CI Fitted values
Individual local authorities
Recent immigration would thus seem to be less relevant in driving perceptions of social cohesion than
economic deprivation. However, it is possible that both factors play a role in driving perceptions. We
test this possibility in a series of regression models, in table 7. In multivariate regressions of this kind, we
can identify the strength of each factor’s relationship to social cohesion, while controlling for the effects
of other factors. By looking at the R squared scores, we can also see which combination of factors does
the best job in predicting social cohesion scores. Below we present a series of models combining non-
EEA migration with other factors. The findings are very similar for EEA migration, which is not shown for
reasons of space. These models reveal three things. Firstly, deprivation is clearly of critical importance in
explaining social cohesion scores. Models which control for it consistently outperform models which do
not. Secondly, adding in measures of diversity or recent migration add further explanatory value. In each
case, the R squared of the model improves, suggesting that social cohesion is related to these measures
even if we control for deprivation. Thirdly, it is not clear from these models whether it is recent
migration or previous diversity which influences social cohesion. When both measures are included in a
single model, migration becomes insignificant, and when deprivation is also added, all three become
insignificant.
The problem is that at local authority level, there is a strong correlation between previous diversity
levels and recent migration. This makes it very difficult to separate out the impact of recent migration
inflows from the impact of longstanding ethnic diversity. All we can say for certain with data of this kind

52
is that there is some evidence for an aggregate impact from one of these factors. Data at a lower level of
geographical aggregation would provide us with a better indication of which factor is driving the
relationship.
Table 7. Predicting social cohesion, multiple variable regression models, non-EEA migration
Model 1: non-
EEA mig only
Model 2: non-
EEA mig and
IMD
Model 3: non-
EEA mig and
diversity
Model 4: IMD
and diversity
Model 4: non-
EEA mig, IMD
and diversity
Intercept 0.73*** 0.78*** 0.73*** 0.78*** 0.78***
Non-EEA NINO
registrations 2002-8
-0.0058*** -0.0030** -0.0012 * -0.0021
Index of Multiple
Deprivation 2007
* -0.0030*** * -0.0030*** -0.0030***
% non-white (2001
Census)
* * -0.0017** -0.0010*** -0.0003
R squared 0.11 0.31 0.13 0.30 0.30
F-statistic 38.6 64.0 22.8 63.1 42.6
N 302 293 299 293 293
Analysis 2: The link between migration and integration
As we noted in the introductory section of the report, while cohesion is a question about the state of
neighbourhoods, integration is a question concerning individuals and groups. We consider integration as
being about answering two core questions: “are they like us?” and “are they becoming more like us?”
For both questions, we focus on trust in the political system and British identity, which strike us as two
strong indicators of integration. It is reasonable to conclude that immigrants who trust the British
political system and identify themselves as being British are better integrated into British society.
To answer the first question – are they like us? – we compare political trust levels and strength of British
identity expressed by recent migrants with those of British born respondents without migrant parents.
For the second question – are they becoming more like us – we compare the attitudes of recent
migrants, longer established migrants and the British born children of migrants with native born, native
descended Britons – to examine whether the attitudes of migrants converge on those of British natives
over time and across generations.
Trust and belonging
It is clear from figure 5 below that public trust in the police was very high at the time of the survey, and
widely distributed. Migrants show equal levels of trust to natives. Trust in political institutions is much
lower, but in this case migrants show consistently more trust than natives. We also observe convergence

53
on native values – recent migrants are very positive about British political institutions, but more long-
settled migrants adopt more cynical views closer to those of the majority. For example, 70% of non-EEA
migrants who had arrived in the past seven years expressed trust in Parliament, but the figure falls to
53% among longer term residents. Migrants thus seem to be integrating by losing the high levels of trust
in Britain political institutions which they arrive with, and converging on the negative outlook of native
born Britons. We may wonder if this is a desirable form of integration!
Figure 5. Trust in institutions by length of time in Britain, native born with native parents compared to
recent (settled within past seven years) and established (moved over seven years ago) migrants
What about intergenerational integration? Do the British born children of immigrants come to adopt
attitudes more like the native majority, or do they retain the views of their parents. Figure 6 below
shows the levels of trust in Parliament expressed by migrants from each of the major ethnic groups in
Britain, split between those born in Britain to migrant parents and those born abroad. We can see that
all ethnic minority groups express higher political trust than members of the white majority. Those born
abroad express higher trust than native born in each case, suggesting that the native born generation is
converging on the more negative attitudes of the white majority group. Despite this, many British born
minorities retain distinctive attitudes – native born Britons from all minority groups except the black

54
Caribbeans remain more trusting of Parliament than the white population. 4. Important variation exists
between groups – while British born citizens of Indian and Pakistani descent remain very much more
trusting than whites, those with Bangladeshi and African heritage are more negative, and British born
citizens of Caribbean descent are most negative, with attitudes indistinguishable from the white
majority.
Figure 6. Trust in Parliament by ethnicity and birth in UK or abroad, major ethnic groups in Britain
Note: White Britons are divided into UK born with UK parents (black), UK born with parents born abroad
(dark grey) and born abroad (light grey)
Looking at subjective belonging to Britain, we find the same patterns. Figure 7 below charts the
proportion of migrant and native respondents saying they feel “very strongly” or “fairly strongly” that
they belong to Britain. We can see that recent migrants from both inside and outside the EEA tend to
express a somewhat lower attachment to Britain – only three quarters of non-EEA migrants who have
settled in the last seven years felt at least fairly strongly attached to Britain, and only two thirds of EEA
migrants. However, among those who have lived in Britain for at least seven years, the figure is in fact
higher than among native born Britons – 90% of long settled EEA migrants feel a sense of belonging to
Britain and 92% of non-EEA migrants. Britain therefore seems to be doing a very good job at making

55
migrant settlers feel that they belong here, although it is also possible that the figure is boosted by
emigration: recent migrants who do not integrate well into British society may be more likely to
emigrate again.
Figure 7. Proportion of respondents who feel they belong to Britain, native born with native parents
compared to recent (settled within past seven years) and established (moved over seven years ago)
migrants
Is there evidence of a similar pattern across generations among the longer established migrant groups?
Figure 8 below suggests little evidence for this—there are different generational patterns for different
groups. Foreign born respondents with South Asian ethnicity express stronger belonging to Britain than
the white minority, and their British born co-ethnics retain this strong attachment. Conversely,
respondents with African heritage express slightly weaker attachment to Britain, whether they were
born here or not, and British born respondents with Caribbean heritage express weaker attachment to
Britain than those born in the Caribbean. There is no common pattern, but all groups tend to show very
high levels of attachment to Britain, comparable to those expressed white Britons if not higher.

56
Figure 8. Proportion saying they belong to Britain, by ethnicity and country of birth, major ethnic
groups in Britain
Note: White Britons are divided into UK born with UK parents (black), UK born with parents born abroad
(dark grey) and born abroad (light grey)
Values
So far, we have seen that immigrants coming to Britain express higher trust in British political
institutions as natives do, and also feel they belong in Britain as strongly as natives do, once they have
settled for the long term. However, we may still wonder if migrants coming from countries with very
different linguistic and political traditions may hold different values to native born Britons, and if so how
far such differences persist over time and across generations.
To look at the issue of value integration we turn to the 2007 Citizenship Survey, which asked a battery of
questions concerning respondents’ agreement with particular values, asking about freedom of speech,
respect for diversity, the obligation of minorities to blend into wider society, whether minorities should
maintain their customs and traditions, equal opportunities for all groups and taking responsibility to
help others in the community. On most of these values, the views of Britons with no migrant heritage,
migrants and minorities are indistinguishable. For example, between 83% and 93% of every group
agrees with the statement “people should respect the culture and religious beliefs of others even when
they oppose their own values”, and similar proportions agree that “different ethnic and religious groups

57
should adapt and blend into the larger society”. The high level of agreement may simply reflect the
choice of rather uncontroversial values. Nevertheless, it is worth knowing that the vast majority of
Britons, from all backgrounds, accept the value of diversity; the importance of integration and of equal
opportunity; the value of maintaining distinct cultural traditions and the responsibility to help others in
the community.
We identified three areas of contention. The first is on the statement “different ethnic and religious
groups should maintain their own customs and traditions”. Here, around 70% of white Britons without
foreign parents tended to agree with this, while for all minority groups, recent and well established, the
proportion tended to be around 80-90%. Minorities also felt much more intensely about this issue: 40-
60% said they strongly agreed with the statement, compared to 16% of white Britons with British born
parents. A second, and most likely related, area of divergence is over the statement “government should
make sure that all groups have the same opportunities”. Here the main issue is intensity of feeling, as
similarly lopsided majorities of all groups agree with this idea—between 80 and 90%. Around half of
white native born Britons strongly agree with this statement, while for immigrants and minority groups
the proportion is higher.
Figure 9 below compares the responses of British born migrants with British parents to those of recent
and more established migrants from within and outside the EEA. Both EEA and non-EEA migrants
express more intense support on both items, but support for both values is more intensely expressed by
the non-EEA migrants. In both cases, more established migrants have attitudes closer to the native
majority suggesting that integration – in the form of convergence with majority views – is occurring.

58
Figure 9. Proportion saying they strongly agree with maintaining ethnic traditions and ensuring equal
opportunities for groups, native born with native parents compared to recent (settled within past
seven years) and established (moved over seven years ago) migrants

59
Figure 10(a). Level of strong agreement with “minorities should maintain own customs and traditions”
by ethnicity, major ethnic groups in Britain
Note: White Britons are divided into UK born with UK parents (black), UK born with parents born abroad
(dark grey) and born abroad (light grey)

60
Figure 10(b) Strong agreement with “government should make sure all groups have the same
opportunities” by ethnicity, major ethnic groups in Britain
Note: White Britons are divided into UK born with UK parents (black), UK born with parents born abroad
(dark grey) and born abroad (light grey)
Figure 10 (a) and (b) above breaks down the results for the same two items by ethnicity and country of
birth. Only the largest ethnic groups are shown for reasons of space. It is clear that all of Britain’s main
minority groups express more intense attachment to the value of maintaining their own traditions, and
to the importance of government action to ensure equal opportunities for all groups. This remains so for
British born minorities, although there is some evidence of convergence towards majority attitudes in
several cases. These instances of distinct values probably reflect the situation and experiences of
minorities: the value of maintaining distinct ethnic customs and religions bears directly on their own
identities and lives, while government action to ensure equal opportunity for all groups is likely to
protect them, as minorities, from discrimination by the majority group. So it is hardly surprising, or
problematic, that in both instances they feel more strongly about these values. It is also reassuring to
note that in both cases the native born white majority also supports these values, although with
somewhat lower levels of intensity.
61
The final issue where we find divergence between white majority Britons and migrant minorities, both
old and new, is freedom of speech. Respondents were asked whether they agreed with the statement
“people should be free to say what they believe even if it offends others”. Around two thirds of white
Britons with native born parents agree with this statement, but in most cases migrants and minorities
are less supportive. Figure 11 shows the pattern of responses for EEA and non-EEA migrants. Support
among long established EEA migrants is somewhat lower at 61%, although support amongst recent EEA
migrants is very high at 77%, which may reflect the preponderance of migrants from the former
Communist states of Central Europe in this group – free speech may have special resonance for them.
Among non EEA migrants, support is notably lower at around 50%, and little higher among long
established migrants than recent arrivals.
Figure 12 charts the same attitude by ethnicity and country of birth. Here we see that the lower support
for free speech, even at the expense of offending others, is a feature common to all minority groups,
with support levels consistently at or below 50%. There is little evidence that British born minorities
converge on the white level of support for free speech – in fact, four of the five groups move in the
opposite direction, with lower levels of support among British born than foreign born. It is not clear
what this finding means – it seems unlikely that this is due to specific religious sensitivities or cultural
attitudes to free speech, as the lower support is common to all minority groups, despite large
differences in religious and cultural traditions between them. It may be that the reference to “offending
others” in the statement brings to mind racial or religious prejudice in the minds of minority
respondents, but does not have this effect on British respondents. So the trade-off implicit in the
question may be a stronger one for minorities than for members of the majority.
One piece of evidence in support of this interpretation comes from another question in the same
module, which posed a different free speech trade-off: respondents were asked whether they felt
protecting freedom of speech was more important than defending order in the nation. When the free
speech issue is framed in this way, support among white majority respondents drops sharply, and there
is no longer much difference in support for free speech between majority and minority respondents.

62
Figure 11. Levels of agreement with “people should be free to say what they believe even if it offends
others”, native born with native parents compared to recent (settled within past seven years) and
established (moved over seven years ago) migrants
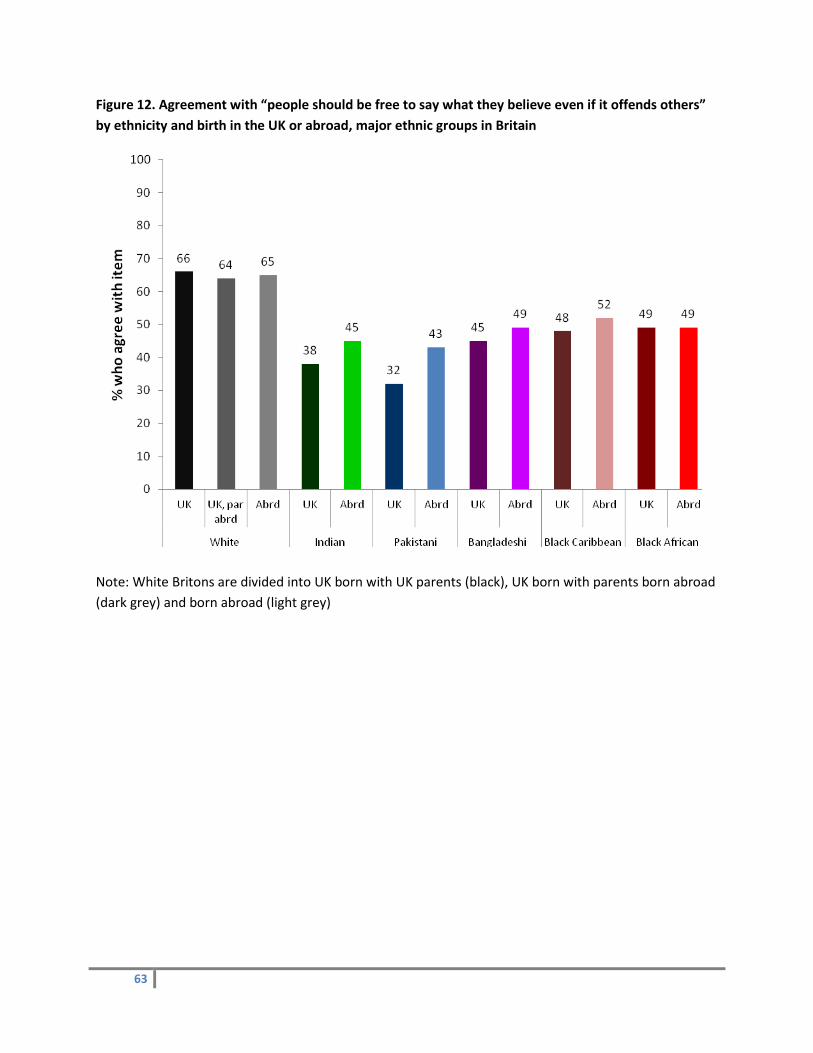
63
Figure 12. Agreement with “people should be free to say what they believe even if it offends others”
by ethnicity and birth in the UK or abroad, major ethnic groups in Britain
Note: White Britons are divided into UK born with UK parents (black), UK born with parents born abroad
(dark grey) and born abroad (light grey)

64
12. Conclusions and policy implications
Concepts and measurements
The central issue necessary to answer the question of whether migration has impacted on integration
and social cohesion is conceptual. Integration and social cohesion are elusive concepts that are defined
in different ways. Our approach has been to work backwards, pursuing our inquiry from how the
concepts are measured. This inductive approach is imprecise in some respects but has allowed us to
make three critical distinctions of direct relevance to assessing the social consequences and impacts of
migration.
First, migration may have impacts on national identity. Measures here refer to perceptions of
Britishness, measured by opinion polls.
Second, migration may have impacts on integration, defined as group outcomes set against the societal
average. Put differently, this concerns understanding the trajectories of first (and second) generation
immigrant performance in a range of economic and social spheres (employment, housing, health, social
interaction, marriage and so on) and measured in hard and soft ways. Here the impact of migration
assumes a great deal of importance (either complete importance if we understand this to be migrant
groups, or substantial importance as migration and policies that modulate migration have impacts on
trajectories).
Finally, migration may have impacts on cohesion. This refers to how migration affects neighbourhoods,
defined by people’s perceptions of how well people get along with each other in their local area or
neighbourhood. Our analysis also examined levels of trust in local institutions.
The current policy emphasis is most associated with the category of cohesion and as a consequence this
report focuses on the impacts of migration on local areas, as measured by perceived positive or negative
changes in neighbourliness and respect and interaction between social groups.
There are complexities and caveats to the three distinctions noted here. For example, they may interact:
cohesion perceptions may be nuanced by how immigrant groups perform (integration) or worries over
national identity.
Key findings
The following key findings are based on both a literature review and new data analysis. The new data
analysis was confined largely to impacts on cohesion and looked specifically at the impacts of European
versus non-European immigrants on social cohesion and at the patterns of integration among new
migrants compared with more established migrant groups.
For national identity, the trend over time, such as one can be discerned, is of a move from an ancestral
understanding of Britishness to one based more on civic values. There is little evidence that immigration

65
played a role in this, but those of immigrant heritage are likely to feel this more strongly, suggesting this
trend may have been accelerated by immigration. The broader historical and sociological literature
supports this view, suggesting religion, war, devolution and globalisation undergirds this shift,
confirming the claim that migration plays a limited role. The caveat to that interpretation is that debates
around, and conceptions of, national identity are at least partially influenced by the political far right
(the BNP in particular, and the mainstream political response). The animating feature of recent
increased voter support for the BNP is immigration and its perceived negative effective on British
culture.
For integration, at least three caveats are important. First, the choice of measure is critical—for example
whether we assess employment outcomes or the rates of intermarriage. The reason it is critical is that
different immigrant groups perform differently depending on the measure. For example Indian men
have low rates of intermarriage (a good social indicator)—around 1 in 20 Indian men marry a White
partner—but high employment rates, above that of the UK-born. Black African men have much higher
rates of intermarriage (1 in 7 marry a White partner) but a lower employment rate than the UK average.
Secondly, the societal average is an unreliable comparator—one is not comparing like with like, and
more to the point, the societal average is not constant (it is a moving average) and is therefore dynamic.
Integration does not stand still. Thirdly, policy is a very important variable, whether this involves
programmes to support integration, or regulations that inhibit, or at least alter, access to services and
the labour market. Policy thus has a differential effect on the integration outcomes of migrants versus
the average member of society, against whom they are being compared. Together, making judgements
on the performance of migrants is fraught with difficulty.
Notwithstanding the choice of measure or the dynamism of societal changes, it is clear that different
immigrant groups perform very differently, with some exhibiting above average performance and others
below average on a range of measures.
On cohesion, our analysis indicates that it is deprivation—not migration—that best explains peoples’
perceptions of their local area. However, existing diversity may partly explain differences in levels of
cohesion. In other words, new migration does not affect cohesion but pre-existing diversity (borne of
earlier immigration waves) and high levels of poverty are predictors of lower social cohesion.
The findings are supported by the British literature (Letki, 2008; Heath and Lawrence, 2010). Recent
evidence from the Longitudinal Study of Young People in England confirms this, explicitly dismissing in-
migration as a predictor of low cohesion (Demack et. al., 2010, p 52). The work of Robert Putnam (2007)
cannot however be ignored, as this takes a more sceptical line.
The literature is more mixed in terms of the dynamics of far right voting. Recent evidence suggests the
BNP has been particularly successful in areas with large Muslim populations, although in many cases
these populations are well established rather than recent migrants (Ford and Goodwin, 2010). However,
other research found little evidence of more intense anti-immigrant sentiment in areas with large

66
migrant populations (Studlar, 1977) or that local migration flows only trigger hostile responses when the
issue is salient nationally (Hopkins, 2011).
Our research focused on the differences between the impact of European (from the EEA) immigrants
and non-European immigrants. We found no significant difference between the impact of EEA and non-
EEA migration once diversity and deprivation are taken into account.
Our analysis of integration shows that recent and established migrants score very well on three
indicators—trust in institutions, belonging to Britain and values. Recent and established migrants
express higher levels of trust in British political institutions than native Britons, a tendency which is also
found among the children of migrants. Although recent migrants are less likely to say they belong to
Britain, this dissipates once migrants have been living longer in the country, and all established migrant
groups express high levels of belonging to Britain. Migrants share many values with the native-born
British, and the main differences which we identify come on issues which are particularly salient in the
lives of migrant communities – the desire to maintain distinct cultural traditions, the need for equal
treatment regardless of ethnic background and concerns about the negative impact of offensive speech.
In the first two cases, migrants and migrant minorities express similar support for the value to native
Britons, but express it more intensely. Only in the last case do we find any evidence of value conflict, and
even here we find suggestive evidence that the conflict depends on context—migrants who have
experienced prejudice and discrimination are likely to have a greater awareness of the damage caused
by offensive speech. When the free speech issue is presented in terms of a trade-off with social order,
the difference in views between migrants and native Britons disappears.
Reliability of findings
The findings above are based on both existing literature and the use of major government datasets. Our
findings are reassuringly supported by the existing UK literature, but also by European comparative
literature.
Nonetheless, we have alerted the careful reader to a series of caveats that affect the reliability of the
findings. They fall into two key categories, which bear repeating.
First, the concepts and definitions are slippery and need constant qualification. We have underlined the
difficult definitional and conceptual issues that academics and policymakers must grapple with, but it is
also important to recognize that—especially for our primary data analysis—we rely on perception
measures at a local or community level and therefore exclude hard measures of integration, or measures
tracking national identity concerns. There are significant problems associated with using perception
measures (see for example Saggar and Drean, 2001).
Second, the robustness of the findings is undermined by shortcomings in the data. The main
shortcomings (beyond the usual issues surrounding migration data and cohesion data, which are
manifold) are that we were unable, without incurring excessive cost and time, to drill down to ward

67
level in our analysis. This would be a better proxy of neighbourhood than local authority level. Another
relevant concern is that our use of the Citizenship Survey is not a choice that can be made much into the
future, as that survey data is no longer collected.
Our findings are therefore satisfactory and robust based on the parameters in how we defined and
examined the problem.
Implications for policy and regulation of migration
The impacts of migration on integration and cohesion are important questions for evidence-based policy
analysis. They are nested in a wider set of legitimate concerns about the social impacts of migration. If
immigration were to have positive or negative effects on national identity, integration, or social
cohesion, it would be important to weigh that in the design of immigration selection systems. Ideally, a
calculated monetary weight would be applied, in common with standard UK government practice.
At present, this report shows that such a judgement is not possible, and if the limited findings were to
be used in such a calculation, it should be weighted as zero. The case for such a judgement is two-fold.
Primarily, the conceptual and measurement difficulties remain formidable. Furthermore, the definition
of the impacts of migration on social cohesion and integration, as noted above, are about impacts on
perceptions of impacts on the local community. This two-step definition means that we cannot say with
certainty that such perceptions are not coloured by other considerations. Secondly, the evidence we
have assembled in this report indicates very clearly that, contrary to popular perception, immigration
has no discernible impact on social cohesion and that migrants are, on the whole, well integrated. Social
deprivation, set within areas of pre-existing ethnic diversity, is the root cause of low social cohesion, and
the policy implications should flow from the logic of that finding.
In the view of the authors, policy would be better informed if social cohesion and integration was
understood as the aggregate of the impacts of migration on various aspects of society. In part, this is
because of the case we make above, that a judgement on impacts on cohesion is not of value when
inputted in a traditional policy development fashion. We also recognize that perceptions of cohesion are
intertwined with views on public services (for example, key measures of neighbourliness and trust in
institutions relating to the performance of the police) and experiences of deprivation.
Finally, what can be inferred about other social and economic impacts of migration colouring
perceptions of social cohesion? Some caution is needed here. While labour market and social impacts
may well be anecdotally relevant, there is very little evidence at present that the actual objective
impacts of migration on, for example, competition for jobs or housing has important social cohesion
effects. There is some evidence that perceptions of competition in this area can matter, but these
perceptions are generally not related to direct experience.
This is not to say that such effects do not exist, just that there is no robust evidence for them and
alternative explanations. For example, scapegoating of migrants should be taken seriously. Similarly, the

68
scarce evidence that migration is correlated with crime does not prevent very frequent associations of
crime with migrants.
Future areas of research
This initial analysis represents a very tentative first step to understanding the impacts, if any, of
migration on social cohesion and integration. To develop a clearer and more robust picture of these
impacts, future research should look to employ data on migration from a lower level of analysis, most
likely electoral ward. This would provide both a closer fit to the area respondents have in mind when
making assessments of their local conditions, and much finer grained information on migration inflows.
Alongside this, a broader range of cohesion and integration indicators should be examined. We have
considered here just a select few of the possible measures available in the Citizenship Survey: a great
deal of work remains to be done examining other measures of impact and also considering how
different dimensions of cohesion and integration relate to each other as well as to migration and
diversity.
Finally, the distinction between EEA and non-EEA migration is a very limited way to conceptualise
migration impacts. Future work should look to develop a richer set of disaggregated migration impacts,
considering different types of inflow such as labour, student, asylum and family reunion migration, and
looking to consider more complex dynamics such as high rates of “churn” (high inflow and high outflow)
rather than focussing purely on inflow numbers.

69
Appendix
List of cohesion questions—these are available on-line from the MAC.

70
Selected bibliography14
Ager, A. and Strang, A. (2008). ‘Understanding Integration: A Conceptual Framework’. Journal of Refugee
Studies 21(2): 166-191
Alba, R. and Nee, V. (2003). Remaking the American Mainstream; Assimilation and Contemporary
Immigration. Cambridge: Harvard University Press.
Banton, M. (2001). ‘National Integration in France and Britain’. Journal of Ethnic and Migration Studies,
27(1): 151-168
Berthoud, R. (2000), Ethnic employment penalties in Britain. Journal of Ethnic and Migration Studies,
Volume 26(3): 389-416
Biggs, M., and Knauss, S. (2011). ‘Explaining Membership in the British National Party: A Multilevel
Analysis of Contact and Threat’, European Sociological Review, 27(3): 1-14.
Brown, R.J. (2010) Prejudice: its Social Psychology, 2nd edition. Oxford: Wiley-Blackwell
Cabinet Office (2002). Social Capital: A Discussion Paper. London: Cabinet Office
Cangiano A. (2010) UK Data Sources on International Migration and the Migrant Population: A Review and Appraisal. ESRC Centre on Migration Policy and Society (COMPAS).
Castles, S. and Kosack, G. (1985). Immigrant workers and class structure in Western Europe. Oxford:
Oxford University Press.
Castles S., Korac, M., Vasta, E., and Vertovec, S. (2001). Integration: Mapping the Field. Report of a
project carried out by the Centre for Migration and Policy Research and Refugee Studies Centre. Oxford:
University of Oxford.
Cheong, P., Edwards, R., Goulbourne, H., and Solomos, J. (2007) ‘Immigration, Social Cohesion and Social
Capital: A Critical Review’. Critical Social Policy, 27(1): 24-49
Clarke, H., Sanders, D., Stewart, M. and Whiteley, P. (2010) ‘British Election Study’.
Commission on Integration and Cohesion (2007). Our Shared Future.
14
One critical footnote with respect to data access is that it was not possible to reference ONS URLs because following the ONS website relaunch in summer 2011 all the links in their literature were broken.

71
Communities and Local Government (2010). Citizenship survey: 2009-10 (April 2009 – March 2010),
England. Cohesion Research, Statistical Release 12.
Available at: http://www.communities.gov.uk/documents/ statistics/pdf/164191.pdf
Council of Europe. (1997.) Measurement and Indicators of Integration. Strasbourg: COE.
Crawley, H. (2005). “Evidence on Attitudes to Asylum and Immigration: What We Know, Don't Know and
Need to Know.” COMPAS Working Paper WP-05-23, Centre on Migration, Policy and Society, University
of Oxford, Oxford.
Cutts, D., Fieldhouse, E., Purdam, K., Steel, D. Tranmer, M. (2007). "Voter Turnout in British South Asian
Communities at the 2001 General Election." British Journal of Politics and International Relations 9 (3):
396-412.
Deakin, N. (1970), Colour Citizenship and British Society. Harmsworth: Penguin.
Demack, S, Platts-Fowler, D, Robinson, D, Stevens, A, & Wilson, I. (2010). Young People and Community
Cohesion: Analysis from the Longitudinal Study of Young People in England. London: Department of
Education.
Available at: https://www.education.gov.uk/publications/eOrderingDownload/DFE-RR033.pdf
Department for Communities and Local Government (2009) Citizenship Survey, 2008-2009. DCLG and
National Centre for Social Research, Colchester, Essex: UK Data Archive [distributor].
Dovidio, J., Hewstone, M., Glick, P., & Esses, V. (2010). The SAGE Handbook on Prejudice, Stereotyping
and Discrimination. SAGE Publications.
DTZ (2007)
https://www.education.gov.uk/publications/eOrderingDownload/DFE-RR033.pdf
Dustmann, C. et. al., (2003). Labour Market performance of Immigrants in the UK Labour Market.
London: Home Office
Dustmann, C. and Faber, F (2005) “Immigrants in the British Labour market”, Fiscal Studies 26(4): 423-
470
Evans, G. (2003). ‘In search of tolerance’. British Social Attitudes: The 19th Report. Sage/NatCen.
Fennema, M. and Tillie, J. (2008). ‘Social Capital in Multicultural Society’ in Castiglione, J. et. al. (eds).
The Handbook of Social Capital. Oxford: Oxford University Press.
72
Finney, N. and Simpson, L. (2009) Sleepwalking to Segregation? Challenging myths about race and
migration, London: Policy Press
Ford, R. (2008) “Is racial prejudice declining in Britain?”, British Journal of Sociology 59(4): 609-36
Ford, R. (2011) “Acceptable and unacceptable immigrants: the ethnic hierarchy in British immigration
preferences”, Journal of Ethnic and Migration Studies Vol 37(7): 1017-1037
Forrest, H. and Kearns, A. (2001). ‘Social cohesion, social capital and the neighbourhood’. Urban Studies
38(12): 2125-2143.
Gidley, B and Jayaweera, H. (2011). An evidence base on migration and integration. Report
commissioned by the Greater London Authority, London: GLA.
Hansen, R. (2000). Citizenship and Immigration in Post-war Britain. Oxford: Oxford University Press.
Heath, A. and Yu, S. (2001). Explaining ethnic minority disadvantage. London: Cabinet Office.
Heath, A. and Cheung. S. (2006) Ethnic penalties in the labour market: Employers and discrimination.
DWP Research Report No. 341
Heath, A. and Cheung, S. (2007) Unequal Chances: Ethnic Minorities in Western Labour Markets, Oxford:
Oxford University Press.
Heath, A. Fisher, S., Sanders, D. and Sobolewska, M. (2011). ‘Ethnic Heterogeneity in the Social Bases of
Voting at the 2010 British General Election’. Journal of Elections, Public Opinion & Parties. Volume 21,
Issue 2.
Heath, A. Fisher, S., Sanders, D. and Sobolewska, M. (2011). ‘Ethnic Minority British Election Study ‘.
Helliwell, J. et. al. (2006). ‘Measuring and Modelling Interpersonal Trust’. In Kay, F. and Johnston, R.
(eds), Diversity, Social Capital and the Welfare State, Vancouver: UBC Press.
Hickman, M. (2008). Immigration and social cohesion in the UK. The rhythms and realities of everyday
life. York: Joseph Rowntree Foundation.
Home Office. (2000). Full and equal citizens – A strategy for the integration of refugees into the United
Kingdom, London: Home Office.
Home Office (2001). Religious Discrimination in England and Wales. London: Home Office.

73
Home Office (2003) Building a Picture of Community Cohesion: A guide for Local Authorities and their
partners. London: Home Office.
Home Office. (2005). Integration Matters: A National Refugee Strategy. London: Home Office.
Hopkins, D. (2011) “National Debates, Local Responses: The Origins of Local Concern about Immigration
in the UK and the US”, British Journal of Political Science, 2011, 41(3):499-524
House of Commons (2008). Community Cohesion and Migration. Tenth report of session 2007-08. House
of Commons Communities and Local Government Committee. London: Stationery Office.
Husbands, C. (1983) Racial Exclusionism and the City: The Urban Support of the National Front. London:
Allen & Unwin.
IES (2003). A Review of Training in Racism Awareness and Valuing Cultural Diversity. London: Home
Office.
Johnson, N. (2008). Citizenship, cohesion and solidarity. London: Smith Institute.
Johnston, R. et. al. (2008) Sleep-walking towards segregation’? The changing ethnic composition of
English schools, 1997-2003: an entry-cohort analysis. Transactions of the Institute of British
Geographers, pp. 73-90
Kandola, B. (2009). The Value of Difference: Eliminating Bias in Organisations. Oxford: Pearn Kandola
Publishing.
Kiwan, D. (2008) A journey to citizenship in the United Kingdom. International Journal on Multicultural
Societies 10 (1), pp. 60-75
Laurence, J. and Heath, A. (2008). ‘Predictors of community cohesion: multi- level modelling of the 2005
Citizenship Survey’. Report for the Department for Communities and Local Government. Available at:
http://www.communities.gov.uk/documents/communities/pdf/681539.pdf
Laurence, J. (2009). The effect of ethnic diversity and community disadvantage on social cohesion: a
multi-level analysis of social capital and interethnic relations in UK communities, European Sociological
Review
Layton-Henry, Z. (1992). The Politics of Immigration. Oxford: Blackwell.
Leigh, A. and Putnam, R. (2002) ‘Reviving Community: What Policy Makers Can Do to Build Social Capital in Britain and America’, Renewal 10(2): 15–20.

74
Letki, N. (2008). ‘Does diversity erode social cohesion? Social capital and race in British neighbourhoods’. Political Studies 56(1): 99-126.
Little, K. (1947). Negroes in Britain: A Study of Racial Relations in English Society. London: Kegan Paul.
Lloyd, C. (2010). 2008-09 Citizenship Survey. Community Cohesion Topic Report. London: Communities
and Local Government.
MacGregor, S. Bailey, G. and Dobson, A. (2009) “The New British Citizen: The political implications of
citizenship tests and ceremonies in the UK”, paper presented at the Political Studies Association
conference
Manning, A. and Roy, S. (2010). ‘Culture Clash or Culture Club? National Identity in Britain’. The
Economic Journal 120(542): 72-100.
Markova, E. and Black, R. (2007). New East European Immigration and Community Cohesion. York:
Joseph Rowntree Foundation.
Maslow, A. H. (1943). ‘A Theory of Human Motivation.’ Psychological Review, 50: 370-396.
Maxwell, R. (2006) ‘Muslims, South Asians, and the British Mainstream: A National Identity Crisis?’ West
European Politics, 29(4): 736-56.
Maxwell R. (2010) ‘Trust in Government among British Muslims: The Importance of Migration Status’, Political Behavior Volume 32, Number 1, 89-109
Migration Observatory (2011a). Briefing: ‘Non-European Student Migration to the UK’ - Available at:
http://migrationobservatory.ox.ac.uk/sites/files/migobs/Briefing%20-
%20Non%20European%20Student%20Migration%20to%20the%20UK.pdf
Migration Observatory (2011b). Briefing: ‘UK Public Opinion toward Migration: Determinants of Attitudes’ – Available at: http://migrationobservatory.ox.ac.uk/sites/files/migobs/Public%20Opinion-Determinants%20of%20Attitudes%20Briefing.pdf
Muttarak, R. and Heath, A. (2010) “Who intermarries in Britain? Explaining ethnic diversity in
intermarriage patterns”, British Journal of Sociology 61(2): 275-305
National Centre for Social Research, British Social Attitudes Survey 1983-2009. Colchester, Essex: UK
Data Archive [distributor].
Nazroo, J. and Karlsen, S. (2003) “Patterns of identity among ethnic minority people: diversity and
commonality”, Ethnic and Racial Studies 26(5): 902-930

75
ONS (2008). Estimating International Migration: An exploration of the definitional differences between the Labour Force Survey, Annual Population Survey, International Passenger Survey and Long-Term International Migration. ONS (2010). Improving Migration and Population Statistics. Overview of the package of improvements. Özbilgin, M. and Tatli, A. (2008). Global Diversity Management: An Evidence Based Approach. Basingstoke and New York: Palgrave.
Owen, D. (1994), ‘Spatial variation in ethnic minority group populations in Great Britain’. Population
Trends (78), pp. 23-33.
Parekh, B. (1998). ‘Integrating Minorities’ in T. Blackstone, B. Parekh, and P. Sanders (ed), Race in
Britain: A Developing Agenda. London: Routledge.
Parekh, B. (2000). The Future of Multi-Ethnic Britain. The Parekh Report. London: Runnymede Trust.
Peach, C., (2007). Muslim Population of Europe: A Brief Overview of Demographic Trends and
Socioeconomic Integration, with Particular Reference to Britain. Centre for Strategic and International
Studies
Platt, L. (2009). Ethnicity and family Relationships within and between ethnic groups: An analysis using
the Labour Force Survey. Colchester: Institute for Social and Economic Research.
Putnam, R. (2007). ‘E Pluribus Unum: Diversity and Community in the Twenty-first Century’.
Scandinavian Political Studies 30(2): 137-174.
Putnam, R., Clark, T. and Fieldhouse, E. (2010). The Age of Obama: The Changing Place of Minorities in
British and American Society, Manchester: Manchester University Press
Portes A. and R. C. Rumbaut (2001). Legacies: The story of the immigrant second generation. University of California Press
Putnam, R. (2003) ‘Ethnic Diversity and Social Capital’, paper presented at the ‘Ethnic Diversity and Social Capital’ seminar, Families and Social Capital ESRC Research Group in association with the Economic and Social Research Council and the British Academy, 24 June, British Academy, London.
Ratcliffe, P. with Newman, I. and Fuller, C. (2008). Community Cohesion: A Literature and Data Review.
Commissioned by the Audit Commission. Warwick: Warwick Business School. Available at:
http://www2.warwick.ac.uk/fac/soc/wbs/research/lgc/latest/community_cohesion_-
a_literature_and_data_review.pdf

76
Rees P., Stillwell J., Boden P. & Dennet A. (2009). A review of migration statistics literature. In UKSA
(2009). Migration Statistics: the Way Ahead? London: UK Statistics Authority. Available at:
http://www.statisticsauthority.gov.uk/reports---correspondence/reports/index.html, p.52-140
Richmond, A. (1954) Colour Prejudice in Britain: A Study of West Indian Workers in Liverpool, 1941-1951.
London: Routledge and Kegan Paul.
Royal Commission on Population (1949) Royal Commission on Population, Cmd 7695 London, HMSO.
Saggar, S. (1992) Race and Politics in Britain. London: Harvester Wheatsheaf.
Saggar, S. (2000). Race and Representation. Manchester: Manchester University Press.
Saggar, S. and Drean, J. (2001). Public Attitudes and Ethnic Minorities. London: Cabinet Office.
Saggar, S. and Heath, A., (1999). ‘Race: Towards a Multicultural Electorate?’ In: G. Evans and P. Norris
(eds), Critical Elections: British Parties and Voters in Long-term Perspective. London: Sage.
Saggar, S. and Somerville, W. (2012) UK Immigrant Integration Policy: Cause and Effect. Washington DC:
Migration Policy Institute.
Saxenian, A. (2000). ‘Brain circulation: How high skilled immigration makes everyone better off’. The
Brookings Review 20(1): 28-31.
Scarman, L. Lord (1981): Brixton disorders 10-12 April 1981: report of an inquiry by the Rt. Hon. the Lord
Scarman, OBE, (Scarman Report). London: HMSO.
Smith, A. (1991) National Identity. London: Penguin.
Somerville, W. (2007). Immigration under New Labour. Bristol: Policy Press.
Somerville, W., and Goodman, S. (2010.) “The Role of Networks in the Development of UK Migration
Policy.” Political Studies, volume 58 (5): pp. 951-970
Spencer, I. (1997) British Immigration Policy since 1939. Oxford: Routledge.
Spencer, S. (2011). The Migration Debate. Bristol: Policy Press.
Spencer, S. (2006). Refugees and other new migrants: a review of the evidence on successful approaches
to integration. Report commissioned by the Home Office, London: Home Office.

77
Studlar, D (1977) “Social Context and Attitudes towards Coloured Immigrants,” British Journal of
Sociology 28 (July): 168-184.
Swann, C. Lord (1985), Education for All: The Report of the Committee of Inquiry into the Education of
Children from Ethnic Minority Groups. London: HMSO.
Tajfel, H. and Turner, J. C. (1986) ‘The social identity theory of inter-group behaviour’ in S. Worchel & L.
W. Austin (eds.), Psychology of Intergroup Relations. Chicago: Nelson-Hall.
Taylor, C. (1992). The Politics of Recognition. Princeton: Princeton University Press.
Taylor, M. (ed), with Brice, J., Buck, N. and Prentice-Lane, E. (2010). British Household Panel Survey User
Manual Volume A: Introduction, Technical Report and Appendices. Colchester: University of Essex.
Thomas, D. and Ely, R. (1996). 'Making Differences Matter: A New Paradigm for Managing Diversity'.
Harvard Business Review, Sept-Oct: 79-90
Tilley, J. Exley, S. and Heath, A. (2004). “Dimensions of British Identity”, in Park, A., Curtice, J., Thomson,
K., Bromley, C. and Phillips, M. (eds) British Social Attitudes: the 21st Report. London: Sage.
Tillie J. 2007 ‘Social capital of organisations and their members: explaining the political integration of
immigrants in Amsterdam’ Journal of Ethnic and Migration Studies, Vol. 30, Issue. 3: 529-541
Tolbert, C. (2003). "Revisiting the Racial Threat Hypothesis: White Voter Support for California’s
Proposition 209" State Politics and Policy Quarterly 3.2, 183-202.
UK Border Agency (2009). Public Attitudes Survey, Wave 6 – September 2009. Available at:
http://webarchive. nationalarchives.gov.uk/20100503160445/
http:/www.ukba.homeoffice.gov.uk/ sitecontent/documents/aboutus/public- attitudes-surveys/
UN (2001). Best Practices in Diversity Management. New York: United Nations Expert Group on
Managing Diversity in the Civil Service.
Walvin, J, (2000). Making the Black Atlantic. Leicester: Leicester University Press.

![Year ended March 31, 2006 [PDF 1.3MB]](https://static.fdocuments.in/doc/165x107/5854869d1a28abfa39906cc2/year-ended-march-31-2006-pdf-13mb.jpg)
![PFI brochure [PDF - 1.3MB]](https://static.fdocuments.in/doc/165x107/586a1ccd1a28ab847d8bcc1c/pfi-brochure-pdf-13mb.jpg)


![Introduction to the SAAT presentation [1.3Mb]](https://static.fdocuments.in/doc/165x107/555988cad8b42ac7648b480d/introduction-to-the-saat-presentation-13mb.jpg)


![HV BPL Project Summary [PDF-1.3MB]](https://static.fdocuments.in/doc/165x107/589d92df1a28abe5498bbb0f/hv-bpl-project-summary-pdf-13mb.jpg)
