EMV Impacts On Fraud 15 th October 2012 Atlanta Federal Reserve

The Impacts of Federal Environmental Regulations on Indiana Electricity Prices
Prepared by:
Marco A. Velastegui Douglas J. Gotham Timothy A. Phillips
Paul V. Preckel David G. Nderitu
State Utility Forecasting Group The Energy Center at Discovery Park
Purdue University West Lafayette, Indiana
January 2012
Prepared for:
Indiana Utility Regulatory Commission Indianapolis, Indiana

State Utility Forecasting Group 1
Executive Summary
This report estimates the impact of a number of recently finalized or proposed federal environmental regulations on the projected prices of electricity and the use of electric energy in the state of Indiana. These rules from the U. S. Environmental Protection Agency (EPA) include the Cross-State Air Pollution Rule (finalized in July 2011 but stayed by a federal appeals court in December), the Mercury and Air Toxics Standards (finalized in December 2011), greenhouse gases regulations (proposed rule expected in early 2012), cooling water regulations (final rule expected in July 2012), and regulations on coal ash (date for final rule unknown). Due to uncertainty over the form and timing of these rules, they were not included in the most recent set of electricity projections from the State Utility Forecasting Group (SUFG), Indiana Electricity Projections: The 2011 Forecast. While considerable uncertainty remains regarding the details of these rules, this report presents an analysis based on the information available at the time it was prepared. The analysis documented here focuses on the impacts of the regulations on the electric energy sector of the economy and does not address the benefits of reduced emissions. The analysis is performed using a traditional regulation forecasting model developed by the State Utility Forecasting Group (SUFG) at Purdue University. This is a sector model that takes the overall economic activity in the state as a given (e.g., the level of gross state product, employment, etc.) and projects changes in electricity usage reflecting demand growth and conservation. Compliance strategies for each generating unit were developed for the analysis based on the expected cost of retrofitting the units to bring them into compliance with the rules. Retrofit costs were estimated from average cost curves, in dollars per megawatt (MW), used by the North American Electric Reliability Corporation (NERC) in a previous study. If the expected retrofit cost exceeded the expected cost of new natural gas-fired generation, the generating unit was retired for purposes of this analysis. About 2,280 MW was modeled as being retired. Some of the retired units were being retired at a later date in the 2011 forecast while others were not retired at all. The analysis leads to small projected changes in electricity prices beginning in 2012 when the Cross-State Air Pollution Rule is assumed to go into effect. Once all regulations are in effect, the prices in the EPA regulations scenario are about 14 percent higher than those in the 2011 forecast. It should be noted that this increase adds to the approximately 20 percent increase in real (or inflation-adjusted) prices projected in the 2011 forecast but is still lower than the real prices experienced in the 1980s. It should also be noted that since the timing and stringency of the regulations are largely unknown and due to the complexity of modeling the various factors affecting the production, delivery and consumption of electricity, there is considerable uncertainty over the exact

State Utility Forecasting Group 2
impact of the regulations. Thus, the price impact resulting from the analysis should be viewed as being approximate rather than absolute. Due to the state’s heavy reliance on coal as a fuel source for electricity generation, Indiana is expected to experience larger price increases than those projected on a regional or national level. Similar studies by other entities have shown projected electricity price increases at the regional or national level of roughly half those indicated in this study. The impacts on demand are also significant. The annualized growth rate in total electricity demand over the 2011-2029 period falls from 1.31 percent in the base case without the new EPA regulations to 1.13 percent when they are included. In the residential sector, the annualized growth rate declines from 0.71 percent to 0.55 percent; in the commercial sector, the decline is from 0.89 percent to 0.83 percent; and in the industrial sector, the decline is from 2.11 percent to 1.83 percent. These demand reductions imply a substitution of alternative energy sources, the use of more efficient energy-consuming technology, and energy conservation. The retirement of over 2,000 MW of generating capacity has a significant impact on resource requirements, especially in the early years of the analysis period. In 2015, the analysis indicates that 1,830 MW of additional resources will be needed, compared to 730 MW in the 2011 forecast. This difference lessens over time due to the reduced demand in the EPA regulations analysis and due to the retirements of units during the later years in the 2011 forecast. By 2025, resource requirements for the two cases are nearly identical. Afterwards, resource requirements for the EPA regulations case fall below those for the 2011 forecast. Given the complexity and uncertainty associated with predicting twenty years worth of utility and consumer behavior in an emission constrained environment, it is not possible to model everything that may affect electricity prices. Thus, a number of caveats are provided. First, there is a great deal of uncertainty about the timing and stringency of the yet to be finalized rules. Next, the retirement of existing units and the construction of new units will have an unknown impact on the need for investment in the transmission system. The compliance strategy used for the analysis cannot capture all of the site specific challenges and compliance options that individual units face. Also, the analysis does not capture the effect of large price increases on the overall economic activity in the state. While the restrictions imposed by the regulations are likely to spur new technological developments, it is not possible to predict what developments will occur and when they will be commercially available.

State Utility Forecasting Group 3
Introduction The U. S. Environmental Protection Agency (EPA) is developing a number of environmental regulations that are likely to have a significant effect on Indiana’s electricity generation sector, particularly in terms of coal-fired generation. These rules were not included in the most recent set of electricity projections from the State Utility Forecasting Group (SUFG), Indiana Electricity Projections: The 2011 Forecast [1], due to the considerable uncertainty over the timing and stringency of the regulations. This report examines the potential impact of federal environmental regulations on the projected prices of electricity in the state of Indiana. The analysis was performed using a traditional regulation forecasting model that equilibrates between price and demand. This is a sector model that takes the overall economic activity in the state as a given (e.g., the level of gross state product, employment, etc.) and projects changes in electricity usage reflecting demand growth and conservation. Thus, the effects of price changes on electricity demand levels were captured. Price impacts are presented at an overall average level as well as by customer class. This report does not attempt to compare the costs of emissions controls with the benefits of reduced emissions. The price projections here are the average retail regulated rates paid by the consumer. Therefore, non-utility generators are not included. While SUFG models both the investor-owned and not-for-profit utilities in the state, the prices for the not-for-profit utilities are only modeled at the wholesale level (i.e., the price at which the utility sells to its member cooperative or municipal member). Thus, the price projections presented here are only for the investor-owned utilities. The emissions control scenarios included here were developed using the same set of electricity usage growth assumptions that SUFG employed for the 2011 forecast. SUFG then changed those parameters affected specifically by the emissions regulations analyzed for this report. Thus, a direct comparison of the 2011 SUFG base case price projections and the emissions regulations price projections is valid.
Summary of Proposed and Recently Finalized Regulations There are five new regulations that are either proposed or have been recently finalized. These are Cross-State Air Pollution Rule (CSAPR), Mercury and Air Toxics Standards (MATS), Greenhouse Gases, Cooling Water Intake Structures, and Coal Combustion Residuals.

State Utility Forecasting Group 4
Cross-State Air Pollution Rule (CSAPR) Finalized in July 2011 (after the inputs to the SUFG modeling system for the 2011 forecast had been finalized) under the Clean Air Act, this rule affects 27 states including Indiana, requiring reductions in sulfur dioxide (SO2) and nitrogen oxides (NOx) emissions beginning in 2012, with stricter reductions in 2014. The rule establishes an SO2 emissions cap that is considerably smaller for Indiana (43.6 percent lower in 2014 than in 2012) and limits the trading region for SO2 emission permits by separating affected states into two groups with no trading between the groups. It replaces the Clean Air Interstate Rule (CAIR). On December 30, 2011, a U. S. District Court of Appeals issued a stay delaying implementation of CSAPR pending the outcome of a legal appeal. Mercury and Air Toxics Standards (MATS) Proposed under the Clean Air Act, this rule would limit emissions from mercury, acid gases, and other pollutants from power plants. It would prevent 91 percent of the mercury in coal from being released. The rule would replace the court-vacated Clean Air Mercury Rule. MATS was proposed in May 2011, with comments accepted until August 2011. The final rule was originally due in November 2011 but has been delayed for a month. The final rule was issued on December 21, 2011. The rule is expected to go into effect three years after being finalized. Thus, it would go into effect in 2015. A 1-year extension may be granted if additional time is needed to install controls. It is expected that coal-fired generators will need to have a combination of flue gas desulfurization, activated carbon injection and fabric filters in order to comply with the standards. Greenhouse Gases This rule, to be proposed under the Clean Air Act, would establish performance standards for new and modified generating units, along with emissions guidelines for existing generating units. The proposed rule was delayed from its expected September 2011 date and is now expected early in 2012. Guidance issued by EPA emphasizes improvements in energy efficiency rather than a cap on emissions. Cooling Water Intake Structures Proposed under section §316(b) of the Clean Water Act, the rule is intended to reduce damage to aquatic life through impingement, when the organisms are trapped against inlet screens, or entrainment, when they are drawn into the generator’s cooling water

State Utility Forecasting Group 5
system. Facilities that withdraw at least 2 million gallons per day would be subject to a limit on the number of fish that can be killed through impingement. Facilities that withdraw at least 125 million gallons per day and new units at existing facilities may be subject to more stringent restrictions. The rule was proposed in April 2011, with comments accepted until August 2011 and a final rule expected in July 2012. There is considerable uncertainty regarding when the regulations would be effective and the steps that would have to be taken in order to meet them. The impingement standard would go into effect in the 2013 to 2020 timeframe and the entrainment deadline is expected to be set by the individual states. Compliance actions range from enhancing screening and reconfiguring of water intake systems to reducing flow rate to installing cooling towers. Coal Combustion Residuals In response to concerns over the potential structural failure of coal ash impoundment facilities, such as the one that occurred at a Tennessee Valley Authority facility, EPA has proposed changing the classification of coal combustion residuals from its current status of an exempt waste. Two options were proposed under the Resource Conservation and Recovery Act: (1) list residuals as special hazardous wastes when destined for disposal in landfills or surface impoundments and (2) regulate as a non-hazardous waste. The proposed rule was released in June 2010 and comments were received through November 2010. EPA has not yet announced an expected date for the release of the final rule. The effective date is believed to be dependent on which option is selected. If coal combustion residuals are classified as non-hazardous wastes, the compliance date is expected to be around 2018. A special hazardous waste designation would likely push compliance out until about 2020.
SUFG Modeling System The analysis was performed using SUFG’s integrated electricity modeling system for each of the five investor-owned utilities (Indiana Michigan Power Company, Indianapolis Power & Light Company, Northern Indiana Public Service Company, Duke Energy Indiana, and Southern Indiana Gas & Electric Company) and the three not-for-profit utilities (Hoosier Energy Rural Electric Cooperative, Indiana Municipal Power Agency, and Wabash Valley Power Association) that supply electric power to Indiana customers. The statewide electricity prices reported here were determined using energy-weighted averages of the five investor-owned utilities for the residential, commercial, and industrial sectors as well as for all customer groups combined.

State Utility Forecasting Group 6
To determine the impacts of the EPA regulations on prices, a scenario was analyzed using the traditional regulation forecasting model developed by the SUFG [1]. This model projects electric energy sales and peak demand as well as future electric rates given a set of exogenous factors. These factors describe the future of the Indiana economy and prices of fuels that compete with electricity in providing end-use services or are used to generate electricity. Combinations of econometric and end-use models are used to project electricity use for the major customer groups - residential, commercial, and industrial. The modeling system predicts future electricity rates for these sectors by simulating the cost-of-service based rate structure traditionally used to determine rates under regulation. Under this type of rate structure, ratepayers are typically allocated a portion of capital costs and fixed operating costs based on the customers’ service requirements and are assigned fuel and other variable operating costs based upon the electric utility’s out-of-pocket operating costs. To maintain consistency in the analysis, the economic activity forecasts that form some of the primary drivers of these models were not changed from the 2011 forecast base case to the EPA regulations scenario. The other major electric energy driver, the price of electricity, is determined within the framework of the overall modeling system and varies according to the results of the scenario. Therefore, any changes in customer demand from this scenario relative to the base case result entirely from changes in electricity prices due to the potential environmental regulations. Using an initial set of electricity prices for each utility, a forecast of customer demands is developed. These demands are then sent through a generation dispatch model to determine the operating costs associated with meeting the demands. The operating costs and demands are sent to a utility finance and rates model that determines a new set of electricity prices for each utility. These new prices are sent to the energy and demand model and a new iteration begins. The process is repeated until an equilibrium state is reached where prices, supply, and demands are consistent. Thus, the model includes a feedback mechanism that equilibrates energy supply and demand simultaneously with electric rates (Figure 1).

State Utility Forecasting Group 7
Figure 1 - Cost-Price-Demand Feedback Loop
While the SUFG modeling system captures the impact of electricity price increases at the microeconomic level (i.e., a firm or individual’s decision to use an alternate source of energy or a more efficient process), it does not capture the impact of price increases at the macroeconomic level (i.e., the effect of electricity prices on the state’s economic development as firms decide where to locate new facilities). All scenarios included in this report were developed from the same set of macroeconomic assumptions. Throughout these analyses, new resources are needed for the utilities to adequately meet the load. This is accomplished through another iterative process with the costs associated with acquiring these resources (either through purchases, construction or conservation) affecting the rates accordingly. Since the demand levels in the EPA regulations scenario differ due to the price impacts, the amount of required resources changes as well. However, the criteria for determining resource requirements are held constant to ensure consistency between the base case and alternative scenarios.
Methodology In order to determine the impacts of the environmental regulations proposed by EPA, it is necessary to develop a compliance strategy. Each utility will make decisions regarding the operation or retirement of their generating units based on a number of factors, such as the age, size, efficiency and operating condition of the unit; emissions control devices currently installed; the type of cooling system and ash disposal used by the facility; and physical characteristics of the site. Thus, a generating unit facing major expenditures to replace existing equipment in addition to costs associated with regulations compliance
Cost
Demand
Price
InitialPrices
CustomerEnergy
andDemand
UtilitySupply
UtilityFinance
andRates
EquilibriumPrices

State Utility Forecasting Group 8
may be retired while a similar unit facing no major replacement expenditures may not. Similarly, a unit with severe space limitations would face higher costs associated with retrofits than one with adequate space. While SUFG has collected information regarding existing emissions controls, cooling water systems, and ash disposal systems, it has no information regarding the other factors. Thus, the strategy included in SUFG’s modeling for this analysis uses average retrofit costs for all units and is likely to vary somewhat from the strategies developed by the utilities. SUFG collected information on the status of emissions control devices currently installed, cooling water systems, and ash disposal systems from utility filings with EIA and data requests to the utilities. This information was used for a generation unit-by-unit analysis to identify the type of environmental controls required by a particular facility to comply with each regulation. As a proxy of the unit’s retrofit cost, SUFG used the environmental control costing curves estimated by the North American Electric Reliability Corporation (NERC) in its 2010 Special Reliability Scenario Assessment: Resource Adequacy Impacts of Potential U.S. Environmental Regulations study [2]. This assessment develops compliance costs ($/kW) as a function of generation unit size (MW) based upon average retrofit costs with existing technology market conditions for specific EPA regulations. Although it presents two sensitivity scenario cases (moderate and strict case), SUFG used the moderate case results to identify the corresponding compliance cost for each of the generating units owned or operated by the utilities under analysis. As an estimate of the total compliance cost per generation unit, SUFG aggregated the costs of all the specific technologies needed for retrofitting to ensure compliance with the combined EPA regulations. A number of technology options exist for meeting the prescribed pollution limits. The NERC assessment identified the implementation costs for existing technologies whose installation is required by EPA or that represent a typical control option for power plants. The control technologies for the CSAPR and the MATS rule are similar. For purposes of this analysis, if a unit does not have a flue-gas desulfurization (FGD) unit installed for SO2 control, a wet FGD retrofit is required. For NOx control, a selective catalytic reduction unit (SCR) is required, while activated carbon injection and bag-house (fabric filter) is required for mercury control.1 Since CSAPR has stricter SO2 cap levels in 2012 than the previous levels under CAIR, an indirect cost was included in the economic dispatch algorithm to reflect the expected higher prices of SO2 allowances. The indirect
1 While other control technologies may be sufficient for compliance for specific generators, it is not feasible to examine each generator at a site-specific level for this analysis.

State Utility Forecasting Group 9
cost penalizes SO2 emitting generators so that the modeling system will choose higher cost, less SO2 intensive generators. The cost, $500/ton of SO2 emitted, is based on analyses performed by the Midwest Independent System Operator (MISO) [3]. In order to comply with the cooling water rule, this reliability assessment estimated the capital cost of converting from once-through cooling water to recirculating cooling water systems. This rule was assumed to impact all nuclear, oil, gas, and coal-fired steam generation facilities that currently use once-through cooling. For the proposed regulation of coal combustion residuals, the cost of converting from wet to dry ash handling systems was considered. Only coal-fired generation units were assumed to be affected by these rules. The new source performance standard for greenhouse gases would impact new units constructed during the forecast period. In the 2011 forecast, SUFG modeled new resource costs on the most efficient types of the natural gas combustion turbines and combined cycle units for which it had cost and efficiency information. Thus, no change in the costs of new resources was incorporated in the analysis. Based on these assumptions and the information collected from the utilities, SUFG assigned the capital cost accordingly to each generation unit when a particular type of environmental control was not in place. For example, if a wet or dry FGD was absent, the investment cost of a wet FGD was added for that particular generation unit. If a particular unit already had the necessary technology, no cost was included for that particular rule. In the end, the unit’s total retrofit investment equals the sum of the compliance costs for each required technology. The compliance strategy used in this analysis considers only two basic choices: retrofit the generation unit and continue operations or retire the generation unit. For this study, the capital cost estimate of building a natural gas combined cycle unit was selected as the comparative cost of replacement power. If the estimated unit’s compliance total investment was greater than this replacement cost, then the unit was selected for retirement. The capital cost for a natural gas-fired combined cycle plant was estimated by the Energy Information Administration (EIA) at approximately $1,000 per kW in 2010 dollars [4]. In order to model the timing of the financial costs faced by the utilities when retrofitting a unit, the potential compliance schedule of each rule had to be estimated. In the case of those rules that are yet to be finalized, the final compliance time line is still uncertain. Table 1 lists the years in which each rule was assumed to go into effect.
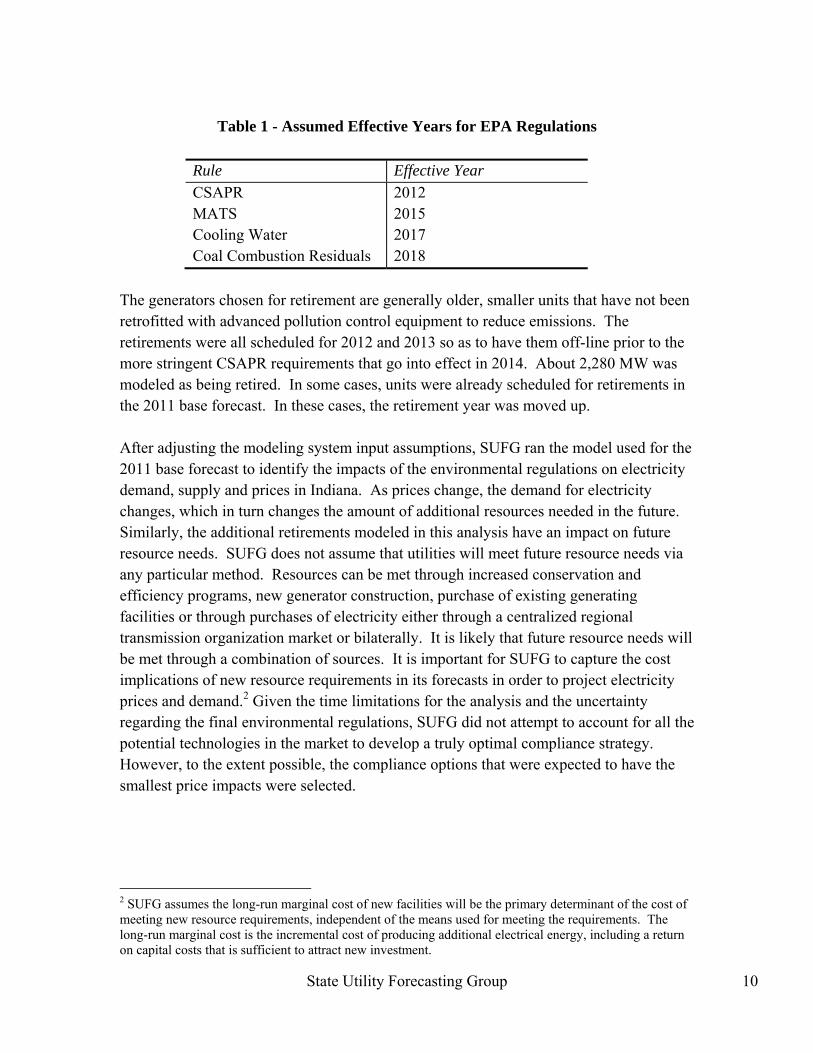
State Utility Forecasting Group 10
Table 1 - Assumed Effective Years for EPA Regulations
Rule Effective Year CSAPR 2012 MATS 2015 Cooling Water 2017 Coal Combustion Residuals 2018
The generators chosen for retirement are generally older, smaller units that have not been retrofitted with advanced pollution control equipment to reduce emissions. The retirements were all scheduled for 2012 and 2013 so as to have them off-line prior to the more stringent CSAPR requirements that go into effect in 2014. About 2,280 MW was modeled as being retired. In some cases, units were already scheduled for retirements in the 2011 base forecast. In these cases, the retirement year was moved up. After adjusting the modeling system input assumptions, SUFG ran the model used for the 2011 base forecast to identify the impacts of the environmental regulations on electricity demand, supply and prices in Indiana. As prices change, the demand for electricity changes, which in turn changes the amount of additional resources needed in the future. Similarly, the additional retirements modeled in this analysis have an impact on future resource needs. SUFG does not assume that utilities will meet future resource needs via any particular method. Resources can be met through increased conservation and efficiency programs, new generator construction, purchase of existing generating facilities or through purchases of electricity either through a centralized regional transmission organization market or bilaterally. It is likely that future resource needs will be met through a combination of sources. It is important for SUFG to capture the cost implications of new resource requirements in its forecasts in order to project electricity prices and demand.2 Given the time limitations for the analysis and the uncertainty regarding the final environmental regulations, SUFG did not attempt to account for all the potential technologies in the market to develop a truly optimal compliance strategy. However, to the extent possible, the compliance options that were expected to have the smallest price impacts were selected.
2 SUFG assumes the long-run marginal cost of new facilities will be the primary determinant of the cost of meeting new resource requirements, independent of the means used for meeting the requirements. The long-run marginal cost is the incremental cost of producing additional electrical energy, including a return on capital costs that is sufficient to attract new investment.

State Utility Forecasting Group 11
In summary, the adjustments to the modeling system inputs were:
● Incorporate total capital cost for each generation unit selected for retrofitting. ● Retire generation units with a potential total compliance investment greater than
replacement cost. ● Incorporate emission SO2 indirect cost.
Results Price Impacts Figure 2 shows the projections of real (inflation-adjusted) electricity prices in cents per kilowatt-hour (kWh) for the 2011 SUFG forecast (base case) and the scenario based on the EPA regulations case. These prices represent an energy-weighted average retail price for the investor-owned utilities in the state of Indiana across the residential, commercial, and industrial sectors. The base case projects a 20 percent price increase from 2010 to 2017 due to a combination of costs associated with ongoing new plant construction, costs associated with extending the life of existing generating facilities, and costs associated with meeting some of the environmental rules. After 2017, prices level off through the remaining of the forecast. The EPA regulations case exhibits a large increase in 2018, the latest modeled compliance year of the potential EPA regulations in the analysis. This increase of about 13 percent is caused by the various steps taken to comply with the rules under development, such as retirement of existing units, addition of the $500/ton SO2 emissions indirect costs, and retrofitting existing units with environmental controls. After this year, real prices are projected to level off through 2021 and then slowly drift downward for the remainder of the forecast period.

State Utility Forecasting Group 12
Figure 2 - Indiana Real Electricity Prices (2011 Base vs. EPA rules)
Once all regulations are in effect, the prices in the EPA regulations scenario are about 14 percent higher than those in the 2011 forecast. Thus, the incremental impact of the EPA regulations is expected to be about 14 percent. It should be noted that this increase is in addition to the approximately 20 percent increase in real prices3 projected in the 2011 forecast but is still lower than the prices experienced in the 1980s after adjusting for inflation. Tables 2 through 4 provide the sectoral and overall average prices for the 2011 base case and the EPA regulations case, along with the percent change between them for three different years in the study period.
Table 2 - Indiana Real Electricity Prices in 2015 (2009 cents/kWh)
Sector 2011 Base EPA Rules ChangeResidential 9.85 10.21 3.62 % Commercial 8.40 8.75 4.18 % Industrial 5.80 6.10 5.12 % Total 7.80 8.14 4.43 %
3 Real prices refer prices that have been adjusted to remove the impact of inflation on the purchasing power of the dollar.
0
2
4
6
8
10
12
2000 2002 2004 2006 2008 2010 2012 2014 2016 2018 2020 2022 2024 2026 2028
EPA Rules 2011 BaseCe
nts/
kWh
(200
9$)
Year
History Forecast

State Utility Forecasting Group 13
Table 3 - Indiana Real Electricity Prices in 2020 (2009 cents/kWh)
Sector 2011 Base EPA Rules Change Residential 11.19 12.75 13.95 %Commercial 9.52 10.84 13.84 %Industrial 6.54 7.31 11.80 %Total 8.74 9.96 13.93 %
Table 4 - Indiana Real Electricity Prices in 2025 (2009 cents/kWh)
Sector 2011 Base EPA Rules Change Residential 10.98 12.44 13.27 %Commercial 9.44 10.67 13.09 %Industrial 6.78 7.45 9.86 % Total 8.67 9.76 12.52 %
Electric Energy Impacts The SUFG modeling system captures the microeconomic effect of price changes on electricity consumption. For instance, some customers will react to an increase in the electricity price by switching to a different energy source or by using electricity in a more efficient manner. The sensitivity of consumption to price varies by customer class, with the industrial sector being the most sensitive. Table 5 shows the average compound growth rates (ACGR) by customer class for the 2011 base and EPA regulations cases for the time period 2010-2029. While the residential and commercial sectors are impacted to some degree, the industrial sector is most heavily affected because electricity consumption is most sensitive to price changes in the industrial sector. These results should be used with caution because the magnitude of price increases seen in this analysis lie outside the historical experience that serves as the basis for calibration of the energy models and because there are no macroeconomic effects modeled (see the Caveats section for more information on these issues).
Table 5 - Indiana Electricity Retail Sales Growth (ACGR, 2010-2029)
Sector 2011 Base EPA RulesResidential 0.71 % 0.55 % Commercial 0.89 % 0.83 % Industrial 2.11 % 1.83 % Total 1.31 % 1.13 %

State Utility Forecasting Group 14
Resource Requirements This section includes projections of the three types of resources modeled: baseload, cycling or intermediate, and peaking. For the EPA regulations analysis, a need for 370 MW of peaking, 770 MW of cycling, and 690 MW for baseload resources by 2015 is identified. In this year, the total requirements are about 1,100 MW higher than those indentified in the 2011 forecast because the additional and earlier generation unit retirements modeled. Approximately 2,960 MW of resources additions are required by 2020, and about 4,380 MW by 2025. After 2025, this analysis projects lower total requirements than those projected in the base case. Tables 6 through 8 provide the projected additional resources for the 2011 base case and the EPA regulations case in three different years in the study period. While SUFG identifies resource needs in its forecasts, it does not advocate any specific means of meeting them. Required resources could be met through conservation measures, purchases from merchant generators or other utilities, construction of new facilities or some combination thereof. The best method for meeting resource requirements may vary from one utility to another.
Table 6 - Indiana Additional Resource Requirements in 2015 (MW)
Type 2011 Base EPA RulesPeaking 310 370 Cycling 90 770 Baseload 330 690 Total 730 1830
Table 7 - Indiana Additional Resource Requirements in 2020 (MW)
Type 2011 Base EPA RulesPeaking 770 720 Cycling 640 1040 Baseload 1190 1200 Total 2600 2960

State Utility Forecasting Group 15
Table 8 - Indiana Additional Resource Requirements in 2025 (MW)
Type 2011 Base EPA RulesPeaking 1030 990 Cycling 1090 1420 Baseload 2110 1970 Total 4230 4380
Comparison to Other Studies SUFG compared the results of its analysis to two other studies - “EPA Impact Analysis: Impacts from the EPA Regulations on MISO October 2011” prepared by the Midwest Independent Transmission System Operator, Inc. (MISO) [5] and “Potential Impacts of EPA Air, Coal Combustion Residuals, and Cooling Water Regulations” prepared in September 2011 for the American Coalition for Clean Coal Electricity by National Economic Research Associates, Inc. (NERA) [6]. These studies have many similarities to this one in terms of the technical compliance, some economic assumptions and the way capital compliance and replacement costs are assigned. However there are differences in the scheduled timeline for regulations implementation and the evaluation period, so we cannot make a strict apples-to-apples comparison. MISO’s study evaluated the combined impact in the MISO system region of the four proposed regulations and identified the increase of all the costs to maintain regulation compliance and system reliability. The bulk of the capital investment for retrofits and cost of replacement capacity is expected to occur in the 2014-2015 timeframe. MISO’s most likely compliance scenario results in a 7.6 percent increase in prices in the 2016 time frame when they assume compliance with all the regulations being met. NERA’s study evaluated the potential effects of the four major environmental regulations on the U.S. electricity prices from 2012 to 2020. NERA’s study shows a 6.5 percent price increase compared to their reference case. While these price increases are lower than SUFG’s results, it is important to note that this is not necessarily unexpected or unreasonable. MISO’s study is for the MISO region which consists of all or part of 12 states and the Canadian province of Manitoba. NERA’s study is national. SUFG’s study, on the other hand, is for Indiana only. Electricity production in Indiana is much more coal intensive than many other states in the MISO region and the nation. About 85 percent of the electricity used in Indiana uses coal as its fuel source [7], which is the highest of all MISO states and significantly higher than many of them. Conversely, EIA data shows that only 45 percent of the nation’s energy in 2010 came from coal [8].

State Utility Forecasting Group 16
Caveats Forecasting is by its very nature an inexact science. This is especially true of long-term forecasting and even more so when forecasting something with as much uncertainty as how utilities and their customers will respond to environmental regulations. While it is not possible to capture all of the uncertainty, or even to put boundaries on it, it is valuable to identify sources of uncertainty and their possible impacts. Uncertainty in EPA rules Since this analysis was performed prior to the finalization of most of the EPA regulations, there is a great deal of uncertainty regarding the timing and stringency of the rules. Based on information from a number of sources, the modeling of the regulations has been done in a manner that SUFG considers to be reasonably likely. However, it is almost certain that the final forms of the rules will differ from the way they were modeled in this analysis. If the final regulations are more stringent, the price impact will be higher. Conversely, less stringent rules will reduce the price impact. Furthermore, given the number of potential options available to comply with these regulations, it is quite possible that the results would differ substantially with those modeled in this analysis. For example, this assessment does not examine the possibility that Indiana’s utilities may be unable to meet the compliance deadlines and may need to apply for waivers and potential extensions in order to complete a retrofit project instead of retiring that generation unit. Additionally, since the final regulations may mandate stronger emission limitations for some states, the potential implementation of a national trading program that allows more flexibility in meeting these limits is not taken in account in this assessment. Transmission lines investment Given the likely need for retiring older coal-fired facilities in Indiana to meet environmental regulations standards, the state may be facing significant capital investments to ensure power system reliability. These old units selected for retirement could represent key points within the transmission grid which have been strategically placed near load centers. If the location of the new generation units to be built is different in relation to the load and the existing transmission facilities, substantial investment in new transmission facilities may be needed to connect these units to the transmission system. This analysis includes only a nominal investment needed in order to connect the new units to nearby transmission lines. If significant investment in the

State Utility Forecasting Group 17
transmission system were needed, either to upgrade existing facilities or construct new ones, it would result in a corresponding increase in electricity prices. In addition, the importance of these facilities for the overall system could raise operational and financial concerns with regards to the viability of retiring that particular unit and could result in the choice to retrofit the unit for environmental compliance even though this was not the least cost option. Fuel Switching This analysis does not include reduction of emissions by switching from coal to another fuel or from one type of coal to another. A utility could accomplish a reduction of emissions by retrofitting an existing coal-fired generation unit to burn a different fuel, such as natural gas. Similarly, switching to or blending with a biomass feedstock may be an option for reducing certain types of emissions. Under previous levels of SO2 caps, some generators switched types of coal to one with lower sulfur content as an alternative to installing scrubbers. To the degree that scrubber installation will be needed for compliance with future regulations, it may be desirable for those units to switch back. While these fuel switching measures may be more attractive economically under the high cost of advanced technologies for the control of emissions, quantifying the feasibility and cost impact associated with fuel switching was not feasible in the timeframe available for this analysis. Price elasticity As is common in forecasting, SUFG’s modeling system uses observations from the past to project what is likely to happen in the future. Many years worth of historical observations are used to estimate the relationship between a number of explanatory factors and the parameter of interest. In this case, the explanatory factors include such things as population, economic activity, fossil fuel prices, and electricity prices. In general, the closer the projected input parameters match the observed historical values, the better the performance of the model will be. In this analysis, the projected changes in electricity price occur at a magnitude greater than those in the historical observation years. While the modeling system will extrapolate the impact of smaller observed price changes to the larger projected one, the accuracy of that extrapolation is uncertain. Macroeconomic effects While the SUFG modeling system captures the impact of higher prices on a microeconomic level, it does not capture the macroeconomic effects. The modeling system uses projections of macroeconomic variables, such as gross state product at the

State Utility Forecasting Group 18
individual industry level and demographics, as inputs. If the electricity price increase causes a customer to switch to another fuel source or use electricity more efficiently, it is a microeconomic effect and the model captures it. If the price increase causes a consumer to shut down her business or decide not to locate in the state, it is a macroeconomic effect and it is not captured. Given the potential price impacts for industrial customers, the macroeconomic effects could be substantial. Technological innovations Since the compliance costs are based upon average retrofit costs of specific existing technologies, other feasible environmental controls were not modeled as an alternative in this assessment. For example, the NERC study used to provide the cost estimates in this analysis did not examine the retrofit cost of using other sorbent injection technologies (e.g., trona) as an alternative. It is believed that the capital costs of this technology would be lower, but it would result in higher operating costs. Furthermore, while it is likely that EPA environmental regulations will provide increased incentives for new technological developments, it is not possible to predict what developments will occur and when they will be commercially available. The development and implementation of new technological innovations would tend to reduce the price impact of these regulations. Compliance strategy As explained previously, the compliance strategy employed by SUFG to perform this study was built in house and not provided by the utilities. It should therefore not be construed to be optimal. While the least cost options have been selected as much as possible, the best strategy for individual utilities may differ from what SUFG has modeled. If a lower cost strategy exists, the price impact of these environmental rules would be reduced. Additionally, facilities retirements were simulated to occur within the period 2012-2013, but utilities have the ability to delay retirement until immediately prior to the compliance deadline. If a unit retirement is delayed, this decision is likely to lessen the impact on capital investment requirements and electricity rates. Engineering considerations The compliance costs included in this analysis are based on expected average costs for making the plant adjustments necessary for meeting the various regulations. The actual cost incurred will vary based on a number of engineering considerations, including space availability and plant configuration. Variations in actual cost will result in corresponding variations in price impacts.

State Utility Forecasting Group 19
Materials and labor premiums If a large number of generating units are required to undergo similar retrofits of emission control devices in a relatively short time period, it could result in tight supply availability for materials, engineering services, skilled construction labor, and financing. A study by the Brattle Group used a doubling of retrofit costs for FGDs and SCRs [9]. Thus, cost increases may occur that result in a greater rate impact. These cost premiums could be exacerbated by a corresponding increase in new generation construction to replace generators that are retired rather than retrofit. This assessment does not evaluate the potential impact of an increase on either retrofit or new construction costs tied to a surge in demand for these resources. Efficiency and outage impacts The assessment presented in this paper does not include the potential reduction in unit efficiency due to the energy used by the environmental control equipment, which should cause the variable cost of generating electricity to increase. The study also does not include reduced unit availability during the installation process, as the unit would have to be shut down for periods of time. Increased maintenance outages will cause units with higher variable costs to be utilized.
References [1] State Utility Forecasting Group, “Indiana Electricity Projections: The 2011
Forecast,” Purdue University, West Lafayette, IN, September 2011. Available at: http://www.purdue.edu/discoverypark/energy/assets/pdfs/SUFG/publications/2011%20SUFG%20Forecast.pdf
[2] North American Electric Reliability Corporation, “2010 Special Reliability
Scenario Assessment: Resource Adequacy Impacts of Potential U.S. Environmental Regulations,” Princeton, NJ, October 2010. Available at: http://www.nerc.com/files/EPA_Scenario_Final.pdf
[3] Smith, J. T., “Initial PROMOD Analysis Modeling CSAPR,” Midwest
Independent Transmission System Operator, presentation to Planning Advisory Committee Meeting, November 2011. Available at: https://www.midwestiso.org/Library/Repository/Meeting%20Material/Stakeholder/PAC/2011/20111130/20111130%20PAC%20Item%2005%20Initial%20PROMOD%20Analysis%20Modeling%20CSAPR.pdf
State Utility Forecasting Group 20
[4] U. S. Energy Information Administration, Office of Energy Analysis, “Updated Capital Cost Estimates for Electricity Generation Plants,” U. S. Department of Energy, Washington, DC, November 2010. Available at: http://www.eia.gov/oiaf/beck_plantcosts/
[5] Midwest Independent Transmission System Operator, Inc., “EPA Impact analysis
Impacts from the EPA Regulation on MISO,” October 2011. Available at: https://www.midwestiso.org/_layouts/miso/ecm/redirect.aspx?id=119399
[6] National Economic Research Associates, Inc. “Potential Impacts of EPA Air,
Coal Combustion Residuals, and Cooling Water Regulations,” Prepared for American Coalition for Clean Coal Electricity, September 2011. Available at: http://www.americaspower.org/sites/default/files/NERA_Four_Rule_Report_Sept_21.pdf
[7] Indiana Utility Regulatory Commission, “Report to the Regulatory Flexibility
Committee of the Indiana General Assembly 2011,” September 2011. Available at:
http://www.state.in.us/iurc/files/2011_Regulatory_Flexibility_Report.pdf [8] U. S. Energy Information Administration, “Monthly Energy Review,”
Percentages based on Table 7.2a, preliminary 2010 data, June 2011. Available at: http://www.eia.gov/FTPROOT/multifuel/mer/00351106.pdf
[9] Celebi, M., et al, “Potential Coal Plant Retirements Under Emerging
Environmental Regulations,” The Brattle Group, presentation to Electric Utility Consultants, Inc. webinar, December 2010. Available at:
http://www.brattle.com/_documents/UploadLibrary/Upload898.pdf