The impacts of energy trends and policies on Taiwan’s … The impacts of energy trends and...
30
The impacts of energy trends and policies on Taiwan’s power generation systems Po-Yao Kuo Chung-Hua Institution for Economic Research, Taipei, Taiwan Working Paper Series Vol. 2015-10 March 2015 The views expressed in this publication are those of the author(s) and do not necessarily reflect those of the Institute. No part of this article may be used reproduced in any manner whatsoever without written permission except in the case of brief quotations embodied in articles and reviews. For information, please write to the Institute. Asian Growth Research Institute
Transcript of The impacts of energy trends and policies on Taiwan’s … The impacts of energy trends and...
The impacts of energy trends and policies on Taiwan’s
power generation systems
Po-Yao Kuo
Chung-Hua Institution for Economic Research, Taipei, Taiwan
Working Paper Series Vol. 2015-10
March 2015
The views expressed in this publication are those of the author(s) and
do not necessarily reflect those of the Institute.
No part of this article may be used reproduced in any manner
whatsoever without written permission except in the case of brief
quotations embodied in articles and reviews. For information, please
write to the Institute.
Asian Growth Research Institute

1
The impacts of energy trends and policies on Taiwan’s
power generation systems Dr. Po-Yao Kuo
Chung-Hua Institution for Economic Research, Taipei, Taiwan
Abstract
Countries use greater quantities of electrical power as they develop economically.
It is crucial to consider policies for Taiwan to realize available, economic, reliable and
sustainable electricity systems in the future. The developments of global energy
supply trends and the energy situations in various major economies, such as their
energy self- sufficiency, electricity fuel mix and electricity carbon emission factors for
electricity generation, are affecting the energy policy debate in Taiwan in recent years.
Taiwan’s previous energy policies were implemented in response to energy security
and global warming with an intention to expand the nuclear power usage. However,
following on from the Fukushima nuclear accident in 2011, Taiwan is now in the
throes of reconstructing its new power policy. Taiwan’s government has decided to
reduce nuclear capacity progressively and the construction of new nuclear power plant
has been frozen. Taiwan’s renewable energy deployment targets have been escalated
and more natural gas power plants will be used. However, the costs for alternative
power options are lack of effective communication with the public. Due to strong
protests from anti-nuclear activists, there were no solid conclusions formed in the
National Energy Conference in January 2015 and a responsible energy policy was
failed to be reached. It is obvious that the electricity reserve rates in Taiwan will be
too low to avoid the risks of power rationing or power disruptions in the near future
and if Taiwan’s energy dilemma can’t be solved.

2
1. Introduction
Economic growth demands energy, especially electricity. According to the
International Energy Agency, global power generation consumed approximately 38%
of global primary energy use in 2011. Countries use greater quantities of electrical
power as they develop economically. Electricity generations in the World from 1990
to 2013 are listed in Table 1. The ability to ensure the availability, reliability and
sustainability of electricity supply and the affordability of electricity prices is of great
importance to the governments and all citizens. However, how to deal with these
issues are very challenging. For example, heat-trapping greenhouse gases causing
global warming. CO2 is a primary greenhouse gas emitted through human activities,
and manmade CO2 emissions are largely based on burning oil, coal and natural gas.
Due to reliance on fossil fuels for approximately two-third of global electricity
generation, global power generation emitted approximately 39% of global
energy-related CO2 emissions.
Table 1. Global electricity generations, 1990-2013
Source: BP, “Statistical Review of World Energy 2014,” June 2014
This study at first reviews the trends of coal, natural gas, nuclear and renewable
energy. Furthermore, it then compares the situations of energy self- sufficiency,
electricity fuel mix and electricity carbon emission factors for electricity generation in
different countries. Moreover, the trends of power generation in Taiwan and the
impacts of global energy trends and policies on Taiwan’s energy policies are discussed.
Finally, the impacts of global trends and national policies on Taiwan’s power
generation system are analyzed.
2. The Trends of Coal, Natural Gas, Nuclear and Renewable Energy
(1) Global fossil fuel reserves
Global fossil fuel supply and demand will not be constrained by the energy
reserves in the world in the near future because total proven reserves for coal, natural
gas and oil are estimated to be enough to sustain current levels of production for 142,
61 and 54 years, respectively. Furthermore, total remaining recoverable reserves for
coal, natural gas and oil are also estimated to be equal to 3050, 233 and 178 years,
respectively, of current levels of production (as shown in Figure 1)1. High oil and
1 IEA, “World Energy Outlook 2013,” International Energy Agency, Nov. 12, 2013
Terawatt-hours 1990 2000 2010 2013
Total World 11862.9 15407.5 21423.0 23127.0

3
natural gas prices have pushed the development of new sources, such as oil sand, and
new technologies, such as hydraulic fracturing. The new development unlock
resources which were originally not considered recoverable only several years ago.
Source:IEA, “World Energy Outlook 2013,” 2013
Fig 1. Global fossil energy resources by type
(2) The development of coal power generation
Coal is the main source of electricity generation by far. From 2000 to 2010,
growth in generation from coal in the whole world was 45%. In the same period,
growth in generation from non-fossil fuel sources was only 25%.
Non-OECD countries, especially China and India, have played a key role in
driving global coal demand growth. However, generation from coal in OECD
Europe, originally see themselves leading the world in reducing GHG emissions and
mitigating climate change, also roses in recent years, because of plummeting coal
prices since 2011 (as shown in Figure 2) caused by an excess of coal on the market,
high Europe’s natural gas prices and a drop in carbon price. The excess of coal on
the market in Europe have been created by significant increase of US coal exports
because of the shale gas boom. Cheap natural gas in the U.S. due to large amount of
shale gas displaces coal, and U.S. coal producers sell their extra coal to the European
market with lower prices. In the same period of time, Europe’s natural gas prices
have been driven up because of rising LNG demand to compensate for idle nuclear
capacity following the Fukushima disaster in Japan and rising natural gas demand in
China for the need to support economy growth and combat again environmental
challenges. Moreover, about one-half of European natural gas supply is indexed to
oil, and high oil prices in recent years affect the prices of natural gas in Europe. The
drop in carbon prices that industry has to pay to emit carbon dioxide in the European
4
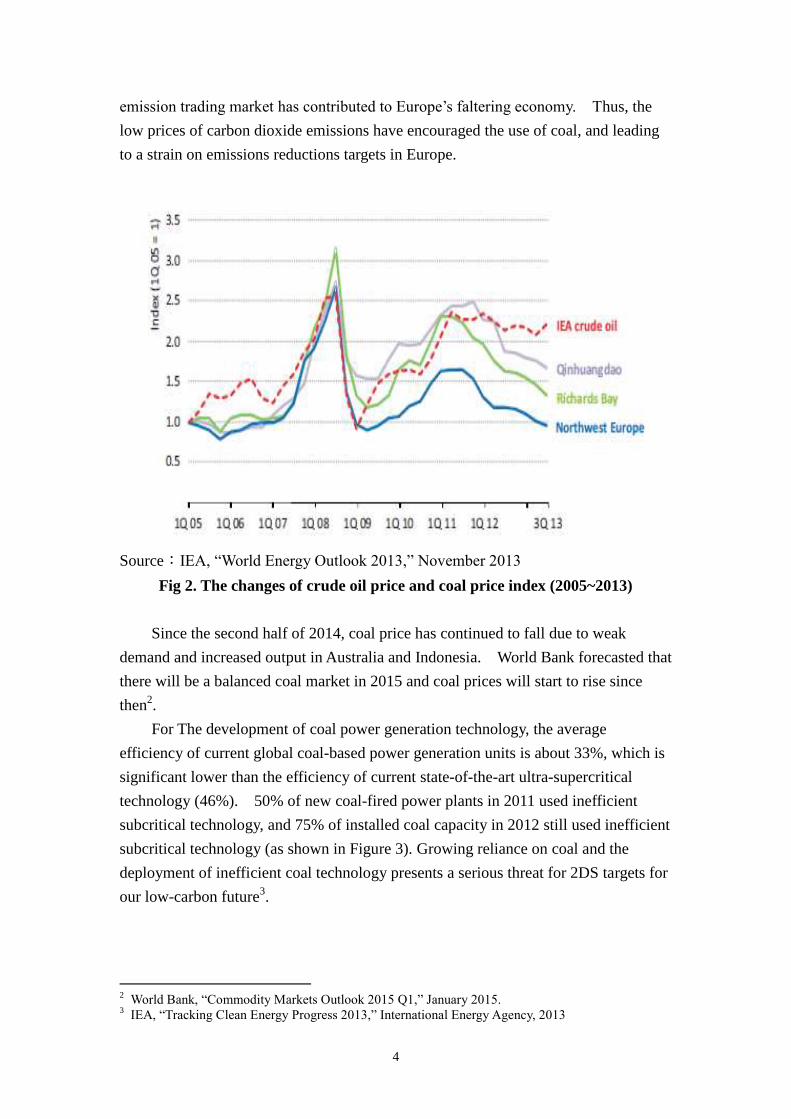
emission trading market has contributed to Europe’s faltering economy. Thus, the
low prices of carbon dioxide emissions have encouraged the use of coal, and leading
to a strain on emissions reductions targets in Europe.
Source:IEA, “World Energy Outlook 2013,” November 2013
Fig 2. The changes of crude oil price and coal price index (2005~2013)
Since the second half of 2014, coal price has continued to fall due to weak
demand and increased output in Australia and Indonesia. World Bank forecasted that
there will be a balanced coal market in 2015 and coal prices will start to rise since
then2.
For The development of coal power generation technology, the average
efficiency of current global coal-based power generation units is about 33%, which is
significant lower than the efficiency of current state-of-the-art ultra-supercritical
technology (46%). 50% of new coal-fired power plants in 2011 used inefficient
subcritical technology, and 75% of installed coal capacity in 2012 still used inefficient
subcritical technology (as shown in Figure 3). Growing reliance on coal and the
deployment of inefficient coal technology presents a serious threat for 2DS targets for
our low-carbon future3.
2 World Bank, “Commodity Markets Outlook 2015 Q1,” January 2015.
3 IEA, “Tracking Clean Energy Progress 2013,” International Energy Agency, 2013

5
Source:IEA, “Tracking Clean Energy Progress 2013,” 2013
Fig 3. Coal-based power generation capacity by type in major countries
At present, there are no sufficient actions in the whole world to reduce the impact
of increasing coal use. Some countries have decided to implement measures and
policies to halt the upwards trend in the deployment of coal-fired power generation
units, reduce generation from inefficient coal-fired generation units and control
pollution. The policies of several important countries are summarized in Table 24.
However, current policies and measures in the whole world are not sufficient to
halt the upward figures in coal deployment, to phase out inefficient units, to drive a
switch from coal to low emission units and to ease the growth in emissions from coal
generation.
4 IEA, “Tracking Clean Energy Progress 2013,” International Energy Agency, 2013
6
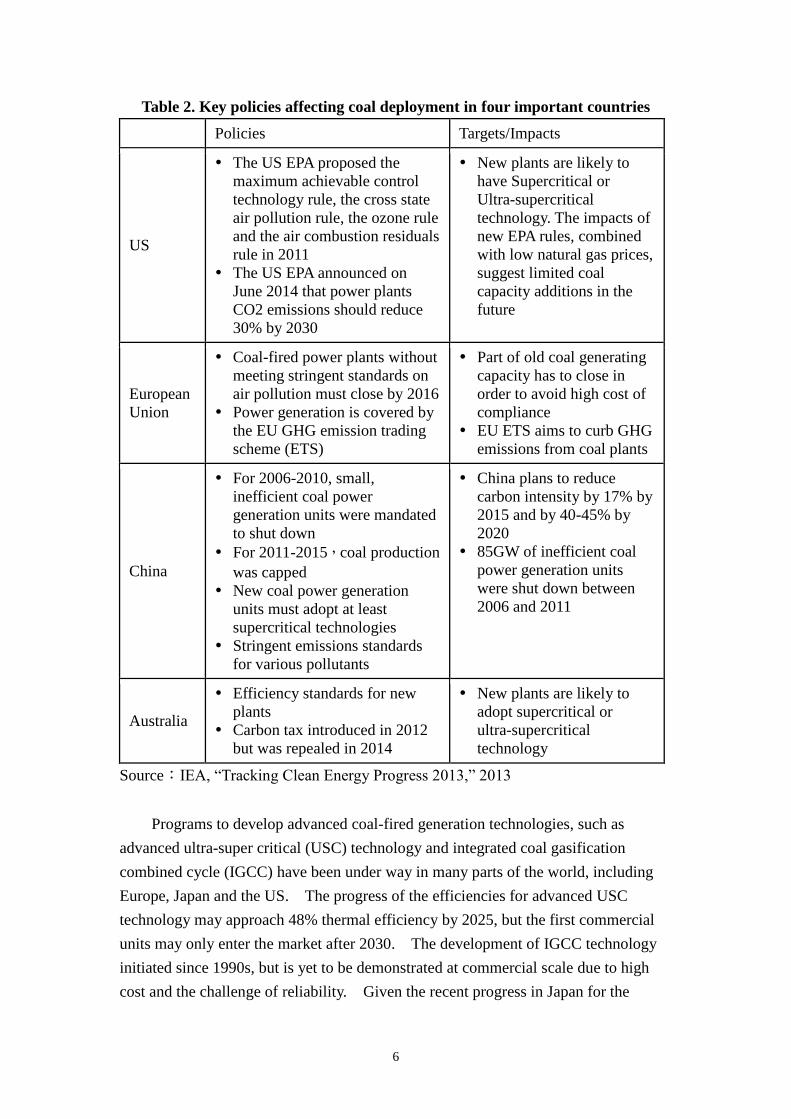
Table 2. Key policies affecting coal deployment in four important countries
Policies Targets/Impacts
US
The US EPA proposed the
maximum achievable control
technology rule, the cross state
air pollution rule, the ozone rule
and the air combustion residuals
rule in 2011
The US EPA announced on
June 2014 that power plants
CO2 emissions should reduce
30% by 2030
New plants are likely to
have Supercritical or
Ultra-supercritical
technology. The impacts of
new EPA rules, combined
with low natural gas prices,
suggest limited coal
capacity additions in the
future
European
Union
Coal-fired power plants without
meeting stringent standards on
air pollution must close by 2016
Power generation is covered by
the EU GHG emission trading
scheme (ETS)
Part of old coal generating
capacity has to close in
order to avoid high cost of
compliance
EU ETS aims to curb GHG
emissions from coal plants
China
For 2006-2010, small,
inefficient coal power
generation units were mandated
to shut down
For 2011-2015,coal production
was capped
New coal power generation
units must adopt at least
supercritical technologies
Stringent emissions standards
for various pollutants
China plans to reduce
carbon intensity by 17% by
2015 and by 40-45% by
2020
85GW of inefficient coal
power generation units
were shut down between
2006 and 2011
Australia
Efficiency standards for new
plants
Carbon tax introduced in 2012
but was repealed in 2014
New plants are likely to
adopt supercritical or
ultra-supercritical
technology
Source:IEA, “Tracking Clean Energy Progress 2013,” 2013
Programs to develop advanced coal-fired generation technologies, such as
advanced ultra-super critical (USC) technology and integrated coal gasification
combined cycle (IGCC) have been under way in many parts of the world, including
Europe, Japan and the US. The progress of the efficiencies for advanced USC
technology may approach 48% thermal efficiency by 2025, but the first commercial
units may only enter the market after 2030. The development of IGCC technology
initiated since 1990s, but is yet to be demonstrated at commercial scale due to high
cost and the challenge of reliability. Given the recent progress in Japan for the

7
development of IGCC technology, first commercial-scale IGCC with 50% thermal
efficiency is expected to operate in 2019. Thus, it is expected that IGCC technology
may enter the market earlier than USC technology.
(3) The development of natural gas power generation
Ongoing improvements in advanced technologies such as hydraulic fracturing for
natural gas production in the US have dramatically lowered the cost of extracting U.S.
shale gas and continue to lift domestic natural gas supply. US natural gas prices in
2013 have fallen to around $3 to $4 per million British thermal units, compared to the
$9 to $11 and $16 to $17 ranges seen in Europe and Asia (Japan and Taiwan)
respectively, as shown in Figure 4. The varying natural gas prices in different areas
demonstrate that global natural-gas markets are not integrated at present.
Fig 4. Natural gas price trends in selected countries
The global LNG market is experiencing a large regional price divergence due to
differences in transportation methods, transportation distances as well as long-term
contract pricing mechanisms, as shown in Figure 5.

8
Source:Kyoichi Miyazaki et al., “Will LNG exports from North America / East Africa
drive global price integration?” Presented at the 17th
International Conference &
Exhibition on Liquefied Natural Gas (LNG 17), May 6, 2013
http://www.gastechnology.org/Training/Documents/LNG17-proceedings/3-6-Kyoichi
_Miyazaki.pdf.
Fig 5. Regional long-term natural gas contract pricing mechanisms
Natural gas price levels for North America and the UK have been traded based
on gas-on-gas market pricing mechanisms (Henry Hub and National Balancing Point).
The price levels for North America have had large discounts compared to other
natural gas price levels globally due to growing low-cost local shale gas production
with short transport distances through pipeline. Continental Europe has established a
network including pipeline natural gas, mainly from Russia, and LNG. These
natural gas markets are developed based on a mixture of oil product-linked and
hub-priced mechanisms. Asia, on the other hand, remains a predominantly
oil-linked LNG market. Most of traditional Asian LNG contracts link the prices paid
for natural gas to the values of crude oil due to their traditional competition
relationship for power generation, heating or industry use, as shown in Figure 6. If
crude oil became more expensive, the gas price following oil-linked LNG pricing
mechanism would rise, but still be competitive with crude oil.

9
Fig 6. The results of traditional oil-linked LNG pricing mechanisms
Low natural gas prices in the US and high crude oil prices are generating strong
interest in exporting LNG from North America and impact traditional oil-linked LNG
pricing mechanisms in Asia. Based on the New Policies Scenario for energy prices
projections from International Energy Agency, Japan’s LNG import prices will
decrease from around US$17/MBtu currently to reach the floor near US$14/MBtu
around 2020, and increase gradually from 2020 to 2035 (as shown in Figure 7).
Source:IEA, “World Energy Outlook 2013,” 2013
Fig 7. Natural gas prices projections in selected countries
10
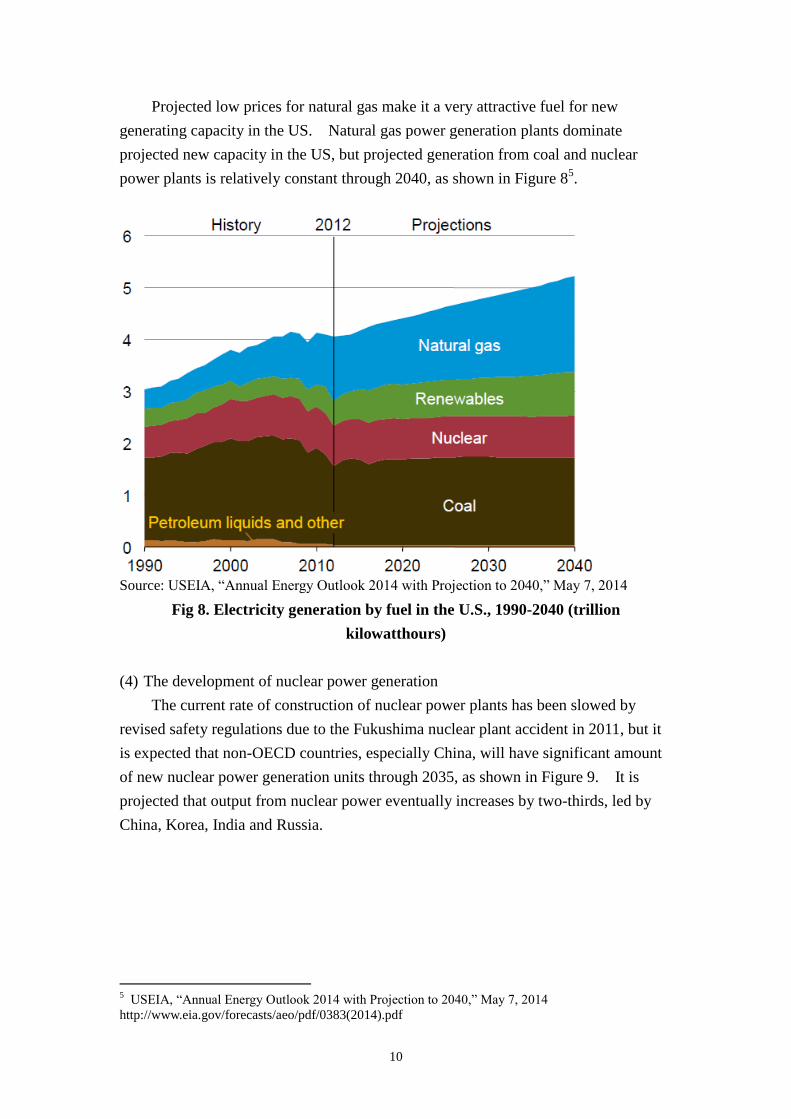
Projected low prices for natural gas make it a very attractive fuel for new
generating capacity in the US. Natural gas power generation plants dominate
projected new capacity in the US, but projected generation from coal and nuclear
power plants is relatively constant through 2040, as shown in Figure 85.
Source: USEIA, “Annual Energy Outlook 2014 with Projection to 2040,” May 7, 2014
Fig 8. Electricity generation by fuel in the U.S., 1990-2040 (trillion
kilowatthours)
(4) The development of nuclear power generation
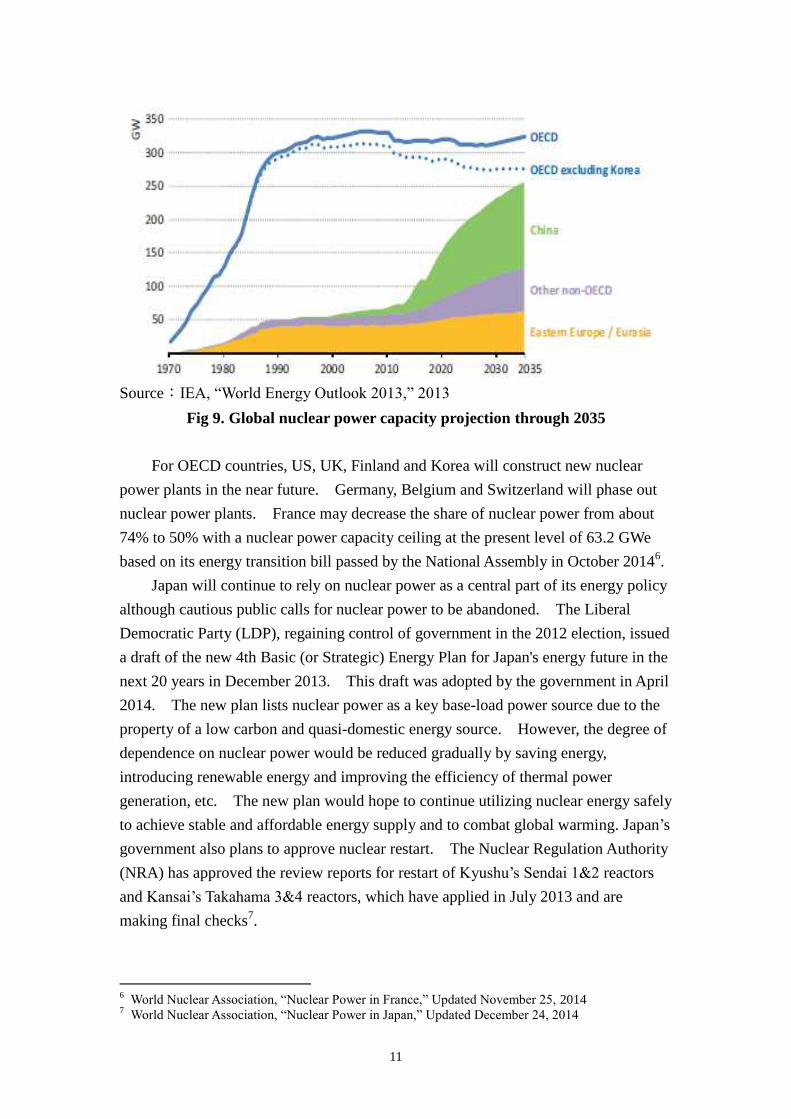
The current rate of construction of nuclear power plants has been slowed by
revised safety regulations due to the Fukushima nuclear plant accident in 2011, but it
is expected that non-OECD countries, especially China, will have significant amount
of new nuclear power generation units through 2035, as shown in Figure 9. It is
projected that output from nuclear power eventually increases by two-thirds, led by
China, Korea, India and Russia.
5 USEIA, “Annual Energy Outlook 2014 with Projection to 2040,” May 7, 2014
http://www.eia.gov/forecasts/aeo/pdf/0383(2014).pdf
11
Source:IEA, “World Energy Outlook 2013,” 2013
Fig 9. Global nuclear power capacity projection through 2035
For OECD countries, US, UK, Finland and Korea will construct new nuclear
power plants in the near future. Germany, Belgium and Switzerland will phase out
nuclear power plants. France may decrease the share of nuclear power from about
74% to 50% with a nuclear power capacity ceiling at the present level of 63.2 GWe
based on its energy transition bill passed by the National Assembly in October 20146.
Japan will continue to rely on nuclear power as a central part of its energy policy
although cautious public calls for nuclear power to be abandoned. The Liberal
Democratic Party (LDP), regaining control of government in the 2012 election, issued
a draft of the new 4th Basic (or Strategic) Energy Plan for Japan's energy future in the
next 20 years in December 2013. This draft was adopted by the government in April
2014. The new plan lists nuclear power as a key base-load power source due to the
property of a low carbon and quasi-domestic energy source. However, the degree of
dependence on nuclear power would be reduced gradually by saving energy,
introducing renewable energy and improving the efficiency of thermal power
generation, etc. The new plan would hope to continue utilizing nuclear energy safely
to achieve stable and affordable energy supply and to combat global warming. Japan’s
government also plans to approve nuclear restart. The Nuclear Regulation Authority
(NRA) has approved the review reports for restart of Kyushu’s Sendai 1&2 reactors
and Kansai’s Takahama 3&4 reactors, which have applied in July 2013 and are
making final checks7.
6 World Nuclear Association, “Nuclear Power in France,” Updated November 25, 2014
7 World Nuclear Association, “Nuclear Power in Japan,” Updated December 24, 2014

12
(5) The development of renewable power generation
With today’s growing environmental concerns, renewables appears to play an
increasingly important role in meeting the world’s energy needs. Since 2012, more
new renewables capacity is being installed than new capacity in fossil fuel and nuclear
power combined. Thus, renewables have accounted for more than half of net
capacity additions in the global power sector, as shown in Figure 108.
Source:IRENA, “Rethinking Energy: Towards A New Power System,” International
Renewable Energy Agency, 2014
Fig 10. Renewables as a share of global capacity additions (2001–2013)
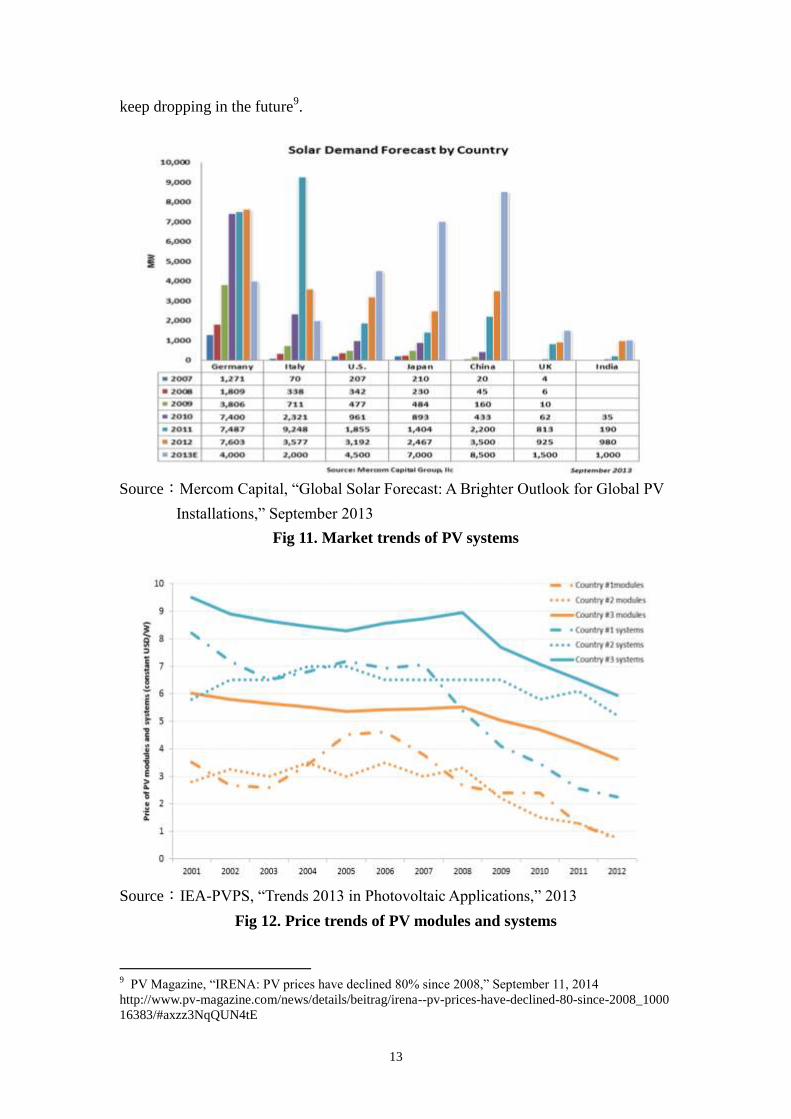
PV deployment outpaced wind for the first time in 2013 due to increasing
efficiencies, decreasing technology costs and rising electricity prices. PV Costs
decreases, although are different from market to market, play the key role for the
dramatic development of solar photovoltaic. There has been a succession of
countries leading the world as the world's top installers for solar photovoltaics.
Before 2012, global leading countries for PV Installations were mainly European
countries, such as Germany and Italy. However, the rapid PV growth happened in
China, Japan and US, and their new installations have surpassed Germany's new
installation capacity in 2013. Actually, European PV deployment has slowed down
by half compared to the record year of 2011 mainly due to the strong decline of new
installations in Germany and Italy, as shown in Figure 11. It was estimated that PV
prices have fallen by 80% since 2008, as shown in Figure 12, and are projected to
8 IRENA, “Rethinking Energy: Towards A New Power System,” International Renewable Energy
Agency, 2014 http://www.irena.org/rethinking/Rethinking_FullReport_web.pdf
13
keep dropping in the future9.
Source:Mercom Capital, “Global Solar Forecast: A Brighter Outlook for Global PV
Installations,” September 2013
Fig 11. Market trends of PV systems
Source:IEA-PVPS, “Trends 2013 in Photovoltaic Applications,” 2013
Fig 12. Price trends of PV modules and systems
9 PV Magazine, “IRENA: PV prices have declined 80% since 2008,” September 11, 2014
http://www.pv-magazine.com/news/details/beitrag/irena--pv-prices-have-declined-80-since-2008_1000
16383/#axzz3NqQUN4tE
14
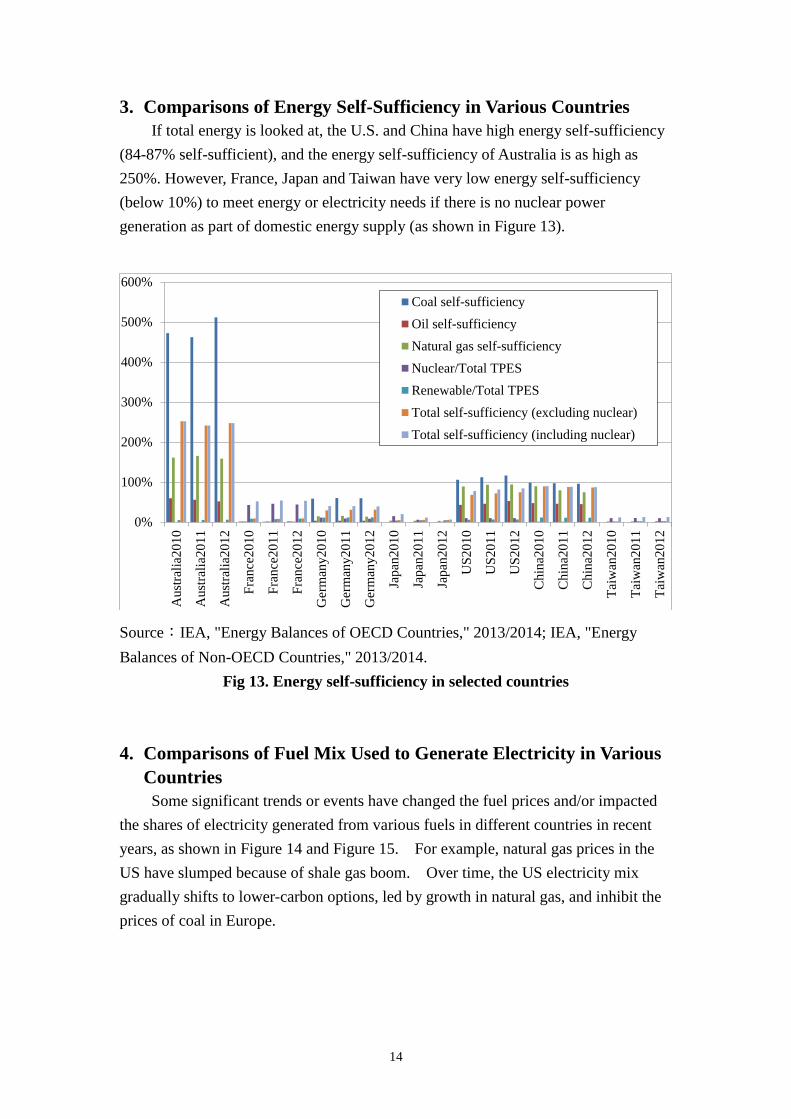
3. Comparisons of Energy Self-Sufficiency in Various Countries
If total energy is looked at, the U.S. and China have high energy self-sufficiency
(84-87% self-sufficient), and the energy self-sufficiency of Australia is as high as
250%. However, France, Japan and Taiwan have very low energy self-sufficiency
(below 10%) to meet energy or electricity needs if there is no nuclear power
generation as part of domestic energy supply (as shown in Figure 13).
Source:IEA, "Energy Balances of OECD Countries," 2013/2014; IEA, "Energy
Balances of Non-OECD Countries," 2013/2014.
Fig 13. Energy self-sufficiency in selected countries
4. Comparisons of Fuel Mix Used to Generate Electricity in Various
Countries
Some significant trends or events have changed the fuel prices and/or impacted
the shares of electricity generated from various fuels in different countries in recent
years, as shown in Figure 14 and Figure 15. For example, natural gas prices in the
US have slumped because of shale gas boom. Over time, the US electricity mix
gradually shifts to lower-carbon options, led by growth in natural gas, and inhibit the
prices of coal in Europe.
0%
100%
200%
300%
400%
500%
600%
Aust
rali
a2010
Au
stra
lia2
01
1
Au
stra
lia2
01
2
Fra
nce
20
10
Fra
nce
20
11
Fra
nce
20
12
Ger
man
y2
01
0
Ger
man
y2
01
1
Ger
man
y2
01
2
Japan
2010
Jap
an2
01
1
Jap
an2
01
2
US
20
10
US
20
11
US
20
12
Ch
ina2
01
0
Ch
ina2
01
1
Ch
ina2
01
2
Tai
wan
20
10
Tai
wan
20
11
Tai
wan
20
12
Coal self-sufficiency
Oil self-sufficiency
Natural gas self-sufficiency
Nuclear/Total TPES
Renewable/Total TPES
Total self-sufficiency (excluding nuclear)
Total self-sufficiency (including nuclear)

15
Source: IEA, 2013; IEA, 2014
Fig 14. Electricity generation by fuel type in various countries, 2010-2012
Source: IEA, 2013; IEA, 2014
Fig 15. Shares of electricity fuel mix in various countries, 2010-2012
Europe’s low coal prices and relatively high natural gas prices, however, enhance
coal power generation and inhibit natural gas power generation in Germany. Thus,
electricity carbon emission factors in Germany have increased slightly.
0
500
1000
1500
2000
2500
3000
3500
4000
4500
5000
Aust
rali
a2010
Aust
rali
a2011
Aust
rali
a2012
Fra
nce
2010
Fra
nce
2011
Fra
nce
2012
Ger
man
y2010
Ger
man
y2011
Ger
man
y2012
Japan
2010
Japan
2011
Japan
2012
US
2010
US
2011
US
2012
Chin
a2010
Chin
a2011
Chin
a2012
Tai
wan
2010
Tai
wan
2011
Tai
wan
2012Ele
ctri
city
gen
erat
ed (
incl
udin
g C
HP
), T
Wh
Other Renewable
Hydro
Nuclear
Natural Gas
Oil
Coal & Peat
16
In Japan, an unprecedented situation after the Fukushima nuclear plant accident
in 2011 has occurred. Nuclear power originally represented about 26% of Japan’s
power generation in 2010. After the accident, Japan replaced the significant loss of
nuclear base load, removed from service for safety reason, with generation from
imported natural gas, oil and coal. Since Japan is the top-ranked LNG imported
country, this shift has pushed up global LNG prices.
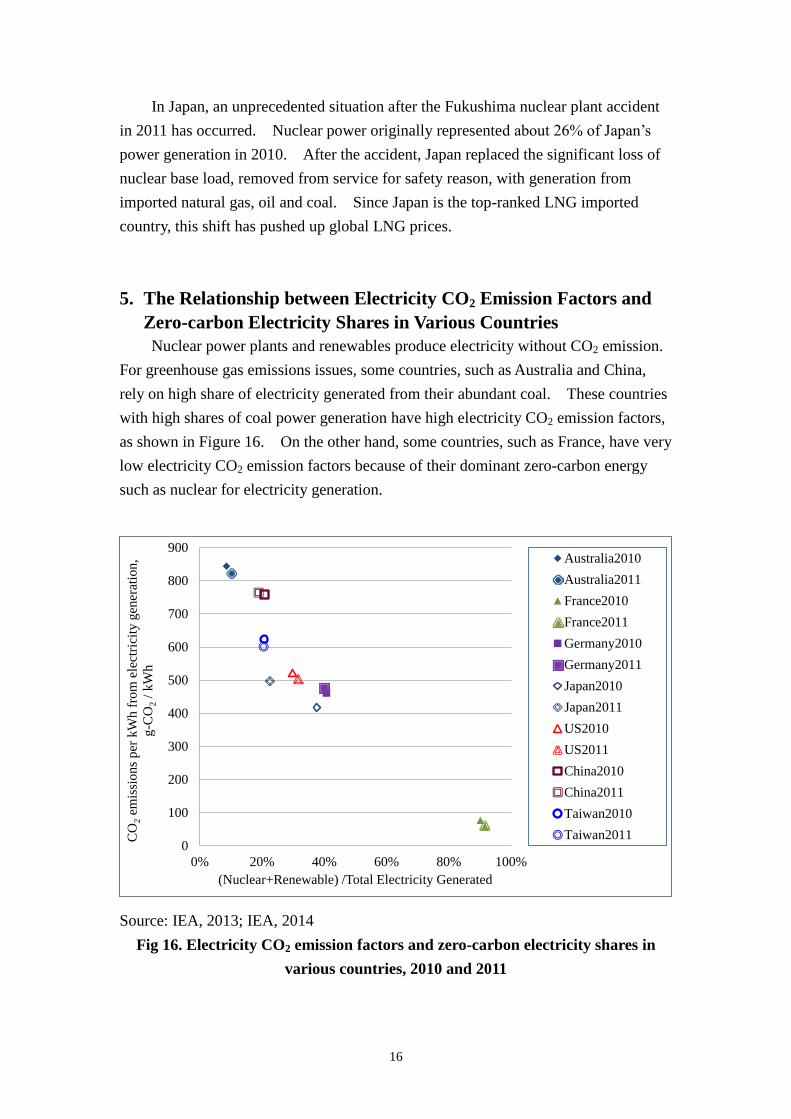
5. The Relationship between Electricity CO2 Emission Factors and
Zero-carbon Electricity Shares in Various Countries
Nuclear power plants and renewables produce electricity without CO2 emission.
For greenhouse gas emissions issues, some countries, such as Australia and China,
rely on high share of electricity generated from their abundant coal. These countries
with high shares of coal power generation have high electricity CO2 emission factors,
as shown in Figure 16. On the other hand, some countries, such as France, have very
low electricity CO2 emission factors because of their dominant zero-carbon energy
such as nuclear for electricity generation.
Source: IEA, 2013; IEA, 2014
Fig 16. Electricity CO2 emission factors and zero-carbon electricity shares in
various countries, 2010 and 2011
0
100
200
300
400
500
600
700
800
900
0% 20% 40% 60% 80% 100%
CO
2em
issi
ons
per
kW
h f
rom
ele
ctri
city
gen
erat
ion,
g-C
O2
/ kW
h
(Nuclear+Renewable) /Total Electricity Generated
Australia2010
Australia2011
France2010
France2011
Germany2010
Germany2011
Japan2010
Japan2011
US2010
US2011
China2010
China2011
Taiwan2010
Taiwan2011

17
The electricity CO2 emission factors in Germany and US in 2010 and 2011were
similar because of their similar fuel mix to generate electricity except relatively lower
share of natural gas and higher share of renewable in Germany’s generation mix
relative to those in the US.
The electricity CO2 emission factor in Japan was originally lower than those in
Germany and the US in 2010 due to high share of electricity generated from natural
gas and nuclear power. Furthermore, Japan’s electricity generation from coal was
also lower compared to those in Germany and in the US in 2010. However, Japan’s
electricity CO2 emission factor has become similar to those relative to Germany and
US in 2011 because of higher share of natural gas and oil and lower share of nuclear
power in its generation mix caused by the Fukushima nuclear disaster in 2011.
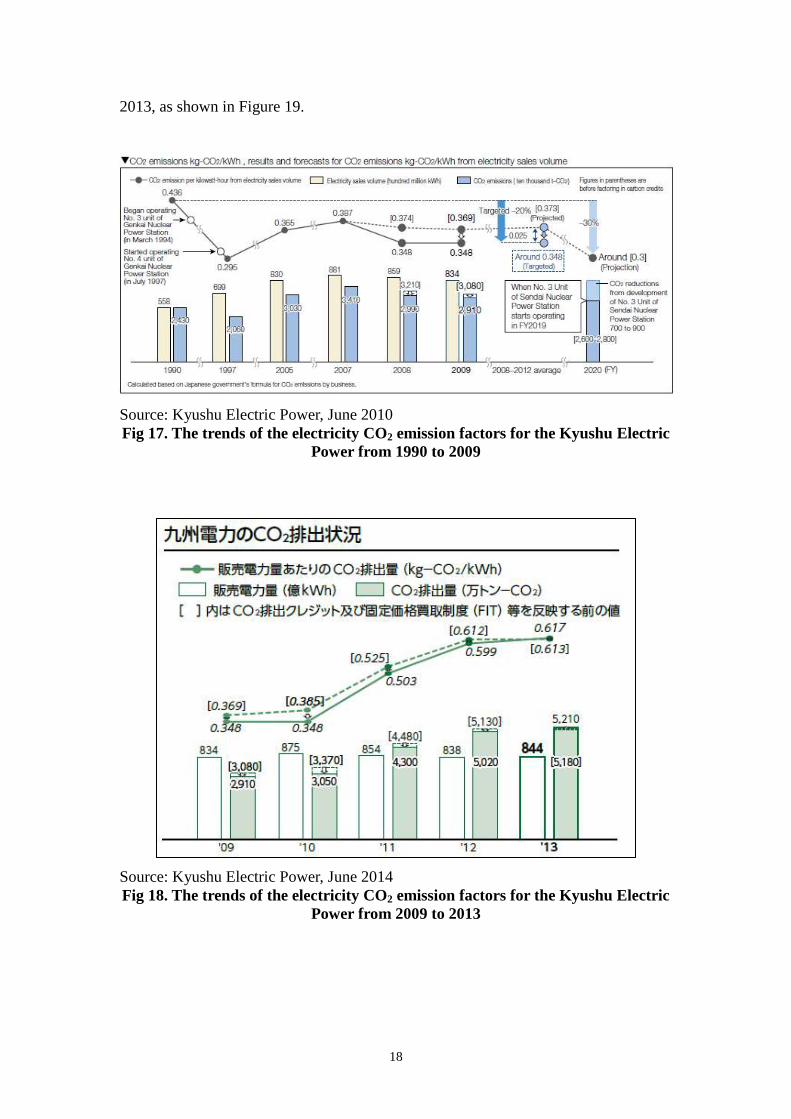
6. The Impact of Fukushima Nuclear Disaster on Japan’s Electricity
CO2 Emissions
In the 1997 Kyoto Protocol, Japan promised to reduce its emissions by 6% for
2008 to 2012 compared with its 1990 levels. In March 2010, Japan’s government
also approved its new GHG emission target, promising to reduce emissions by 25%
by 2020 compared to the 1990 level. However, these promises have eroded by the
incident of the Fukushima nuclear disaster in 2011. Because of the shutdown of
Japan’s all nuclear power reactors, carbon dioxide intensities from Japan's electricity
industry have climbed since 2011. For example, electricity CO2 emission factors for
the Kyushu Electric Power have decreased from 436 g-CO2/kWh in 1990 to 348
g-CO2/kWh in 2009 and 2010, but have increased to 599 g-CO2/kWh in 2012 and 617
g-CO2/kWh in 2013 due to the loss of nuclear power and the increase of fossil fuel
power generation, as shown in Figure 17 and Figure 1810,11
. It is estimated that carbon
dioxide intensity from the Kyushu Electric Power has increased by 77.3% from 2010
to 2013.
Due to the shift of carbon dioxide intensity from the Kyushu Electric Power, the
efforts of energy saving and greenhouse gas emissions reductions achieved by the
industry sector in Kyushu in recent years have been eroded. For example, total
amount of the Toyota Kyushu’s CO2 emission would decrease by 17% from 2005 to
2013 if the electricity CO2 emission factors for the Kyushu Electric Power were
similar to those in 2010. However, total amount of the Toyota Kyushu’s CO2
emission in the real-world has increased by 48% in 2013 because of the significant
increase of the values for electricity CO2 emission factors of Kyushu’s electricity in
10
Kyushu Electric Power, The Kyushu Electric Power CSR Report 2010, June 2010. 11
Kyushu Electric Power, 九州電力 CSRダイジェスト 2014, June 2014.
18
2013, as shown in Figure 19.
Source: Kyushu Electric Power, June 2010
Fig 17. The trends of the electricity CO2 emission factors for the Kyushu Electric
Power from 1990 to 2009
Source: Kyushu Electric Power, June 2014
Fig 18. The trends of the electricity CO2 emission factors for the Kyushu Electric
Power from 2009 to 2013
Source: Kyushu Electric Power, The Kyushu Electric Power CSR Report 2010, June 2010

19
Source: Kyushu Electric Power, June 2014; Toyota Kyushu, October 2014
Fig 19. The impacts of the differences of the electricity CO2 emission factors for
the Kyushu Electric Power on Toyota Kyushu’s CO2 emission
7. The Trends of Power Generation in Taiwan
In Taiwan, the power sector was estimated to consume approximately 50% of
Taiwan’s primary energy use in 2011, which was about 1.0% of global primary energy
consumed for power generation. Because Taiwan has a very high population density
(639 persons per km2) and is an island that lacks energy and natural resources, Taiwan
depends heavily on imported energy and the majority of which is high-carbon fossil
fuels.
The power generation capacity installed in Taiwan amounted to about 7.78, 16.93,
34.76, 42.13, 48.61 and 48.86 GW, respectively, in 1980, 1990, 2000, 2005, 2010 and
2013. Thus, the power plant capacity installed in Taiwan has been more than double
from 1980 to 1990 and triple from 1990 to 2013, as shown in Figure 20. Since 1990,
the decline of the shares of nuclear and oil and the rise of the shares of natural gas and
CHP have been the most marked features, as listed in Table 3. Nuclear power
accounts for 5,028 MW of capacity by means of 3 active plants (each of which
comprises two reactors) and all existing plants began to operate before 1985.
Installed capacity of wind has increased from 2.6 MW in 2000 to 186 MW in 2007
and to 614.2 MW in 2013. Installed capacity of PV has increased from 0.1 MW in
2000 to 2.4 MW in 2007 and to 392 MW in 2013.

20
Fig 20. Installed Power Generation Capacity in Taiwan (1980-2013)
Table 3. Shares of installed generating capacity by fuel type in Taiwan
Nuclear Coal Natural
Gas Oil Hydro
Pump
Storage
Hydro
CHP Wind PV
1980 16.3% 20.6% 6.4% 38.9% 17.8% 0.0% 0.0% 0.0% 0.0%
1990 30.4% 21.9% 7.5% 19.7% 9.2% 5.9% 5.5% 0.0% 0.0%
2000 14.8% 28.5% 19.0% 10.3% 5.2% 7.5% 14.8% 0.0% 0.0%
2005 12.2% 27.9% 24.5% 7.9% 4.5% 6.2% 16.7% 0.1% 0.0%
2010 10.6% 24.5% 31.3% 6.9% 4.1% 5.4% 16.3% 1.0% 0.0%
2013 10.5% 23.1% 31.2% 6.2% 4.3% 5.3% 16.7% 1.3% 0.8%
From 1990 to 2013, supply of grid electricity in Taiwan has increased by159 %
(from 82.1 TWh in 1990 to 212.7 TWh in 2013). The mix of fuels used to generate
grid electricity in Taiwan has changed over the past decades, as shown in Figure 21.
The following table (Table 4) provides a breakdown of the mix of fuels used to
generate grid electricity for Taiwan from 1980 to 2013. The shares of electricity
supplied from oil decreased from 58.8% in 1980 to 25.6% in 1990 and 2.0% in 2013,
as oil prices increased sharply. The shares of hydropower also decreased
significantly because of limited available water resources. The shares of nuclear
power reached peak before 1990’s but decreased gradually due to no construction of
new nuclear power plant. On the other hand, there were increases in supply from
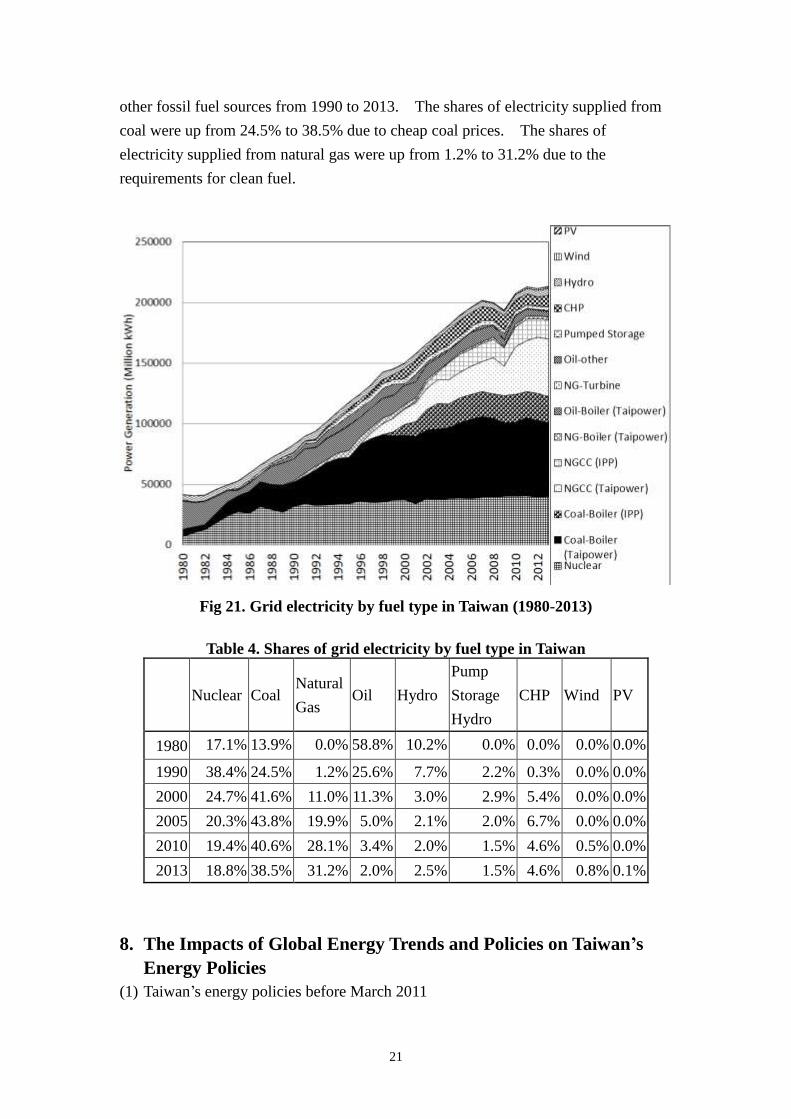
21
other fossil fuel sources from 1990 to 2013. The shares of electricity supplied from
coal were up from 24.5% to 38.5% due to cheap coal prices. The shares of
electricity supplied from natural gas were up from 1.2% to 31.2% due to the
requirements for clean fuel.
Fig 21. Grid electricity by fuel type in Taiwan (1980-2013)
Table 4. Shares of grid electricity by fuel type in Taiwan
Nuclear Coal Natural
Gas Oil Hydro
Pump
Storage
Hydro
CHP Wind PV
1980 17.1% 13.9% 0.0% 58.8% 10.2% 0.0% 0.0% 0.0% 0.0%
1990 38.4% 24.5% 1.2% 25.6% 7.7% 2.2% 0.3% 0.0% 0.0%
2000 24.7% 41.6% 11.0% 11.3% 3.0% 2.9% 5.4% 0.0% 0.0%
2005 20.3% 43.8% 19.9% 5.0% 2.1% 2.0% 6.7% 0.0% 0.0%
2010 19.4% 40.6% 28.1% 3.4% 2.0% 1.5% 4.6% 0.5% 0.0%
2013 18.8% 38.5% 31.2% 2.0% 2.5% 1.5% 4.6% 0.8% 0.1%
8. The Impacts of Global Energy Trends and Policies on Taiwan’s
Energy Policies
(1) Taiwan’s energy policies before March 2011

22
Before the Fukushima nuclear disaster in Japan in March 2011, some countries
promoted nuclear power generation because that they were sensitive to energy
security, and nuclear power is considered as a semi-domestic energy source.
Furthermore, nuclear power plants produce electricity without CO2 emission. Thus,
expanding the proportion of nuclear power generation to reduce carbon emissions
from electric power plants is being considered by many countries as an important
GHG mitigation option. On the other hand, many countries prefer to promote
renewable energy technologies, which are clean and are import-free, in order to
conquer climate change and enhance energy self-sufficiency. The market success of
some renewable energy technologies, such as wind and solar power, in some countries
has been driven by policy support during the last two decades.
In light of the country's lack of sufficient domestic hydrocarbon resources and
the urgency of reducing greenhouse gas emissions, the previous energy policies in
Taiwan were implemented with an intention to maintain or expand the nuclear power
and renewable energy usage in response to energy security and global warming.
Since President Ma Ying-jeou took office in May 2008, one of the government’s
priority policies is developing strategies to balance energy security, economic
development and environmental protection. Thus, the Ma administration laid down
the “Framework of Taiwan’s Sustainable Energy Policy” in June 2008, which includes
the following targets:
(a) Improving energy efficiency by more than 2% per annum and decreasing
energy intensity by 20% by 2015, and by 30% by 2025 depending on
further technological breakthroughs and proper administrative measures;
(b) Reducing nationwide CO2 emissions to their 2008 level between 2016-2020,
and to the 2000 level in 2025;
(c) Increasing the share of low-carbon installed power generation capacity from
40% to 55% in 2025, which includes the share of renewable energy to 8%
and the share of natural gas to 25%;
(d) Promoting energy conservation schemes, especially an increase of 30% in
terms of the carbon intensity of the industrial sector and 25% of the fuel
efficiency standards for private vehicles by 2015;
(e) Providing a comprehensive regulatory framework and relevant mechanisms,
including legislation on the four GHG reduction acts, the establishment of a
fair, efficient and open energy market, an increased annual energy research
budget, the design of a carbon emission trading scheme, and the promotion
of education on energy and climate change; and
(f) Securing a stable energy supply.
Some new guidelines have also been developed in Taiwan’s Third National

23
Energy Conference held on April 2009 based on three goals as below:
(a) To work toward a “low-carbon homeland”;
(b) To developing a future economy, society, environment and technology
based on the concerns of energy; and
(c) To coordinate government policies to achieve a “low-carbon society” and
“low-carbon economy.”
In accordance with the framework and the conference conclusions, nuclear
energy is considered to be one of important low-carbon power sources, especially its
role as a semi-domestic baseload power source. During this period of time, Taiwan’s
fourth nuclear power plant was under construction. Extending the lifetimes of
Taiwan's three existing nuclear power plants was considered. Furthermore, the
Legislative Yuan has quickly passed the “Renewable Energy Development Act” in
July 2009, which sets a target of 6.5-10 GW for the rewardable gross capacity of
renewable energy, as well as the amendments to the “Energy Management Act” in
July 2009, which tighten energy efficiency standards and establish energy information
labeling systems for energy end-use products and require advanced management for
large energy users, in 2009. Moreover, the “Greenhouse Gas Reduction bill” has
been designed to implement compulsory inventory and reporting, adopt an emission
trading system and efficiency standards, and promote a cap-and-trade and emission
offset trading scheme. Finally, the Executive Yuan in Taiwan established the
cross-ministry Energy-Saving and Carbon-Reducing Promotion Committee and New
Energy Development Promotion Committee in the end of 2009.
(2) Taiwan’s energy policies after March 2011
The Fukushima nuclear disaster in Japan in March 2011 exposed the discussion
of the nuclear safety issues in Japan, as well as in Taiwan. Public confidence in
safety of nuclear power in Japan was greatly damaged by the Fukushima nuclear
disaster in 2011 and called for a reduction in the Japan's reliance on nuclear power.
Similar situation happened in Taiwan, too. Therefore, Taiwan’s government
announced a new energy policy for “ensuring nuclear safety and steadily reducing
nuclear dependency as well as creating a low-carbon green energy environment and
gradually moving towards a nuclear-free homeland" in November 2011. The key
points of the new energy policy were summarized in Table 5. The government
decided to conduct a comprehensive review of the operation of three existing nuclear
power plants to find out how to guard against earthquakes and flash floods and
whether it is necessary to institute an anti-tsunami capacity. All nuclear power
plants have established emergency procedures and periodic drills for situations with

24
the design basis. These plants were also required to follow new safety procedures
and to take new measures to deal with and avoid the reactor meltdown and the leak of
radioactive material. Furthermore, all existing plants will be decommissioned
without extending operational lifetime. Moreover, nuclear power plant safety issues
also highlight the challenges of Taiwan's fourth nuclear power plant as to whether it
should begin operation after its construction is finished. Taiwan’s government
promised in the new energy policy that the fourth nuclear power plant must come
under close scrutiny by international experts before the plant begins operation.
Table 5. Key points of Taiwan’s new energy policy in November 2011
Reducing
Nuclear
Progressively
1. Nuclear 4 will operate if safety is granted.
2. The existing three nuclear plants will retire without
further extension.
3. Nuclear 1 might retired in 2016, i.e., 2 years earlier than
the schedule.
Energy
Substitution
1. The renewables will increase 3.4 times of present level.
Renewables will totally 12,500 MW by 2030, accounting
for 16% and 8% of total electricity installment and
electricity generation respectively
2. Nature gas will increase from 12 million tones at present
to 20 million tones by 2030
Energy
Efficiency
1. Materializing rational energy pricing policy
2. Energy tax (carbon tax)
3. Greenhouse gas reduction Act
4. Regulation on Energy Efficiency
Nuclear Safety 1. The Safety of Nuclear should be verified by pressure
testing and operation test. Both domestic and foreign
experts should work with Atomic Energy Council to
verify the safety testing.
2. Establishing a standard operation procedure (SOP) for
ultimate plant abandonment.
Flexibility 1. The progressive nuclear reduction plan will be carried
out under the following three preconditions.
(1) No electricity shortage
(2) Reasonable electricity price
(3) Maintaining the promise of CO2 emission reduction
2. Doing progress re-evaluation every year and the whole
policy re-evaluation every 4 years

25
(3) Taiwan’s new renewable targets in January 2014
Taiwan’s Renewable Energy Development Act passed in July 2009 set a
renewable energy target of 6,500~10,000 MW of installed power capacity, and began
implementing feed-in tariffs(FITs) mechanism. In the 2nd
meeting for the New
Energy Development Promotion Committee in 2010, the Ministry of Economic
Affairs suggested the renewable energy target of 8,968 MW by 2025 and 10,858 MW
by 2030. After Fukushima event in 2011, Taiwan’s government reviewed the
renewable energy deployment target and raised it to 12,500 MW by 2030.
Taiwan’s government announced new renewable energy deployment target again
on January 13, 2014, as shown in Table 6. The new target for the installed
renewable energy capacity adjusted to 13,750 MW by 2030, which is 10% increases
compared to the target originally suggested in 2011.
Table 6. Taiwan’s new renewable targets announced in January 2014
2012 2013 2014 2015 2020 2025 2030
Cumul. Cumul. Cumul. Cumul. Cumul. Cumul. Cumul.
PV 222 397 607 847 2,120 4,100 6,200
Wind
Onshore 571 614 714 814 1,200 1,200 1,200
Offshore - - - 15 320 1,520 3,000
Biomass 740 740 741 745 768 813 950
Hydro 2,081 2,081 2,081 2,089 2,100 2,150 2,200
Geothermal - - 1 4 66 150 200
Ocean - - - - - - -
Fuel Cell - - - - - - -
Total 3,614 3,832 4,144 4,514 6,574 9,933 13,750
(4) Halting construction at the fourth nuclear power plant in April 2014
State-owned Taiwan Power Company operates three nuclear power plants, and
the existed Nuclear 1 (expected to retired in 2018、2019), Nuclear 2 (expected to
retired in 2012、2023) and Nuclear 3 (expected to retired in 2024、2025) will be
decommissioned between 2018 and 2025 when their authorized 40-year lifespans
expire. On the other hand, the Fourth Nuclear Power Plant is being constructed.
However, the safety concerns triggered by the 2011 Fukushima disaster in Japan were
26
lingering in Taiwan continuously. Thus, Taiwan’s government was forced by
buoyant anti-nuclear protests to rethink their policy on nuclear following the
Fukushima disaster.
On April 22, 2014, Lin Yi-hsiung, the 8th
former chairman of the opposition
Democratic Progressive Party and a longtime anti-nuclear activist, began a hunger
strike to demand that the government halts the construction of the fourth nuclear
power plant. On April 27, 2014, the spokesman for the ruling Kuomintang party said
the government and the ruling party agreed that after the pre-operational safety
inspection process has been completed for unit 1 of the fourth nuclear power plant, it
won't go into operation, but will be in mothballs. Meanwhile, all construction work
on unit 2 will be halted immediately. In January 2015, the Atomic Energy Council,
Taiwan's state regulator of nuclear power, approved a proposal by state-owned Taiwan
Power Co. to freeze construction of the fourth nuclear power plant.
(5) Holding the National Energy Conference 2015 in January 2015
The challenges for the use of nuclear energy affect Taiwan’s future of electricity
supply security, which is also a major challenge for Taiwan’s long-term energy policy.
While Taiwan’s government decided to halt the remaining construction of the 4th
nuclear power plant in April 2014, the spokesman for the ruling party also said that
the cabinet agreed to hold a national energy conference as soon as possible to ensure
the future of energy supply.
On January 25-26, 2015, the National Energy Conference 2015 was held. The
retirement of existing nuclear reactors and the fate of the 4th
nuclear power plant were
significant issues during this conference. Some have asked to extend the life of the
existing nuclear power plants from 40 to 60 years, and have wanted Nuke 4 to begin
operations as early as possible for enhancing energy security, inhibiting electricity
price rise and combating climate change. Anti-nuclear activists, however, strongly
opposed the measures. Since nuclear issues were very controversial, the participants
had been unable to reach a consensus on whether the nuke plants should continue
operating after the heated debates. After this two-day energy meeting, the Cabinet
could not make a clear conclusion on the development or abolishment of Taiwan's
nuclear power, and Premier Mao Chi-kuo concluded with remarks that the Cabinet
will not be commenting directly on its stance regarding all nuclear energy-related
issues. This result means that Taiwan’s government has not been able to resist the
anti-nuclear protests and to retain nuclear power as one of major energy sources in the
future. However, there were no proper alternative suggestions concluded and a
responsible energy policy needed for the economic growth of Taiwan was failed to be
reached by this time.
27
9. The Impacts of Global Trends and National Policies on Taiwan’s
Power Generation System
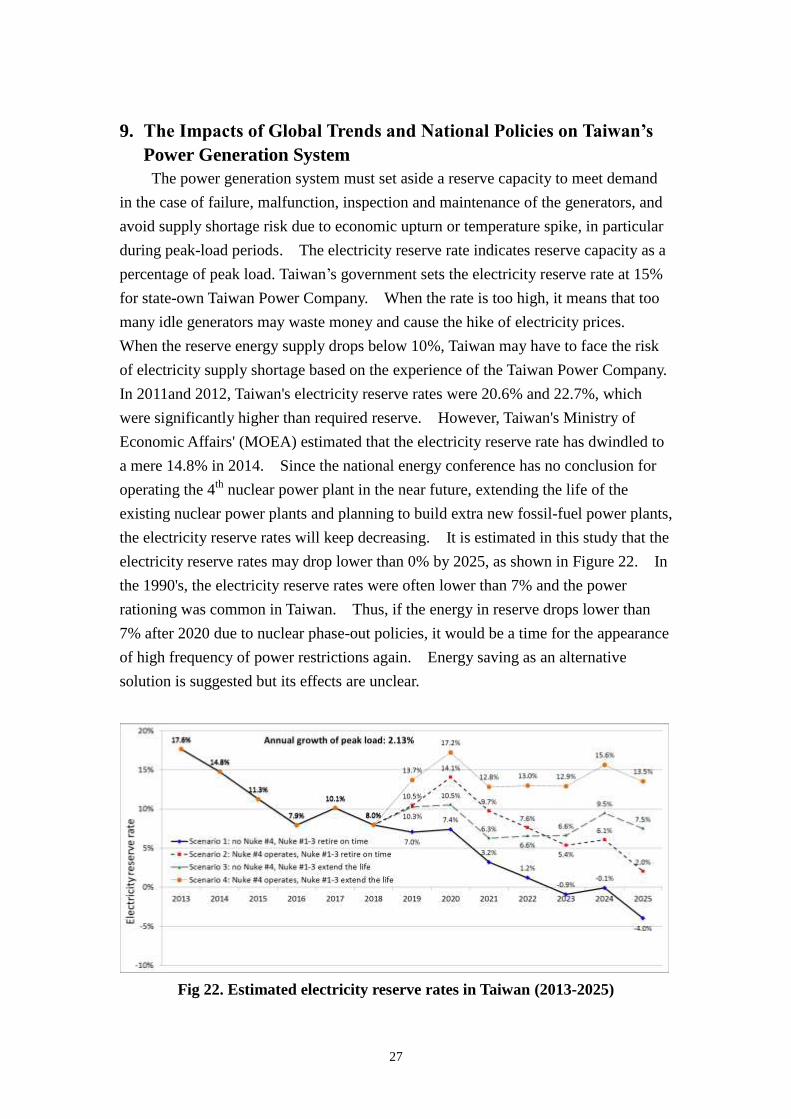
The power generation system must set aside a reserve capacity to meet demand
in the case of failure, malfunction, inspection and maintenance of the generators, and
avoid supply shortage risk due to economic upturn or temperature spike, in particular
during peak-load periods. The electricity reserve rate indicates reserve capacity as a
percentage of peak load. Taiwan’s government sets the electricity reserve rate at 15%
for state-own Taiwan Power Company. When the rate is too high, it means that too
many idle generators may waste money and cause the hike of electricity prices.
When the reserve energy supply drops below 10%, Taiwan may have to face the risk
of electricity supply shortage based on the experience of the Taiwan Power Company.
In 2011and 2012, Taiwan's electricity reserve rates were 20.6% and 22.7%, which
were significantly higher than required reserve. However, Taiwan's Ministry of
Economic Affairs' (MOEA) estimated that the electricity reserve rate has dwindled to
a mere 14.8% in 2014. Since the national energy conference has no conclusion for
operating the 4th
nuclear power plant in the near future, extending the life of the
existing nuclear power plants and planning to build extra new fossil-fuel power plants,
the electricity reserve rates will keep decreasing. It is estimated in this study that the
electricity reserve rates may drop lower than 0% by 2025, as shown in Figure 22. In
the 1990's, the electricity reserve rates were often lower than 7% and the power
rationing was common in Taiwan. Thus, if the energy in reserve drops lower than
7% after 2020 due to nuclear phase-out policies, it would be a time for the appearance
of high frequency of power restrictions again. Energy saving as an alternative
solution is suggested but its effects are unclear.
Fig 22. Estimated electricity reserve rates in Taiwan (2013-2025)
28
Conclusion
Taiwan depends heavily on imported energy and the majority of which is
high-carbon fossil fuels. For demonstrating the impacts of low fuel self- sufficiency
and reliance on imported fossil fuels for electricity generation in Taiwan, this study
discussed the historical trends of fuel mix for electricity generation in Taiwan.
Because Taiwan needs to move towards a long-term reliable, affordable and
sustainable energy strategy that guarantees security of power supply, Taiwan’s
previous energy policies were implemented in response to energy security and global
warming with an intention to expand the nuclear power usage. In the aftermath of
Japan's Fukushima nuclear accident, a new Taiwan’s energy policy was drawn up in
2011, including commissioning the 4th
nuclear power plants with strict safety
requirements and decommissioning the existing plants without extending operational
lifetime. Also, the expanding of renewable energy and natural gas usage are
expected. However, how to deal with challenges regarding enough, affordable,
stable and clean supply for electricity generation are difficult for Taiwan’s government
to answer. For lack of new construction of a large power plant and Taiwan’s nuclear
dilemma continues, if the fourth nuclear power plant cannot begin operation within
the next few years or existing nuclear capacity stop operating on schedule, the power
reserve capacity will be reduced to an all-time low level and Taiwan may have to face
power shortage nationwide. Since there are no solid conclusions to conquer these
challenges in the National Energy Conference held in January 2015, Taiwan’s
government may need to limit the electricity in different areas in order to pass the
hard times in the near future. Some suggest that Taiwan should rely on the people to
preserve energy. Further study may be needed in order to assess if energy saving is a
potential way to avoid the worst situations of power shortage and what cost will be
needed to achieve the goal of energy saving.
Reference
1. BOE, “Ensure Nuclear Security, Steadily Reduce Nuclear Dependency, Create a
Low Create a Low carbon Green Energy Environment & Gradually Move
Towards a Nuclear-free Homeland,” Taiwan’s Bureau of Energy, Ministry of
Economic Affairs, November 3, 2011.
2. BP, “BP Statistical Review of World Energy,” June 2014.
3. IEA, “World Energy Outlook 2013,” International Energy Agency, Nov. 12,
2013.
4. IEA, “Tracking Clean Energy Progress 2013,” International Energy Agency,
2013.

29
5. IEA, "Energy Balances of OECD Countries (2013 edition)," July 3, 2013.
6. IEA, "Energy Balances of OECD Countries (2014 edition)," July 17, 2014.
7. IEA, "Energy Balances of Non-OECD Countries (2013 edition)," August 13,
2013.
8. IEA, "Energy Balances of Non-OECD Countries (2014 edition)," August 19,
2014.
9. IEA-PVPS, “Trends 2013 in Photovoltaic Applications,” 2013.
10. IRENA, “Rethinking Energy: Towards A New Power System,” International
Renewable Energy Agency, 2014.
11. Kyoichi Miyazaki et al., “Will LNG exports from North America / East Africa
drive global price integration?” Presented at the 17th International Conference &
Exhibition on Liquefied Natural Gas (LNG 17), May 6, 2013.
12. Kyushu Electric Power, The Kyushu Electric Power CSR Report 2010, June 2010.
13. Kyushu Electric Power, 九州電力 CSRダイジェスト 2014, June 2014.
14. Mercom Capital, “Global Solar Forecast: A Brighter Outlook for Global PV
Installations,” September 2013.
15. PV Magazine, “IRENA: PV prices have declined 80% since 2008,” September 11, 2014.
16. USEIA, “Annual Energy Outlook 2014 with Projection to 2040,” May 7, 2014.
17. World Bank, “Commodity Markets Outlook 2015 Q1,” January 2015.
18. World Nuclear Association, “Nuclear Power in France,” Updated November 25,
2014.
19. World Nuclear Association, “Nuclear Power in Japan,” Updated December 24,
2014.