Irish Healthcare Costs - unsustainable, unaffordable, unreformable?

The Impact of Unsustainable Ground
WaterWater
Frederick Bloetscher, Ph.D., P.E.
Florida Atlantic University
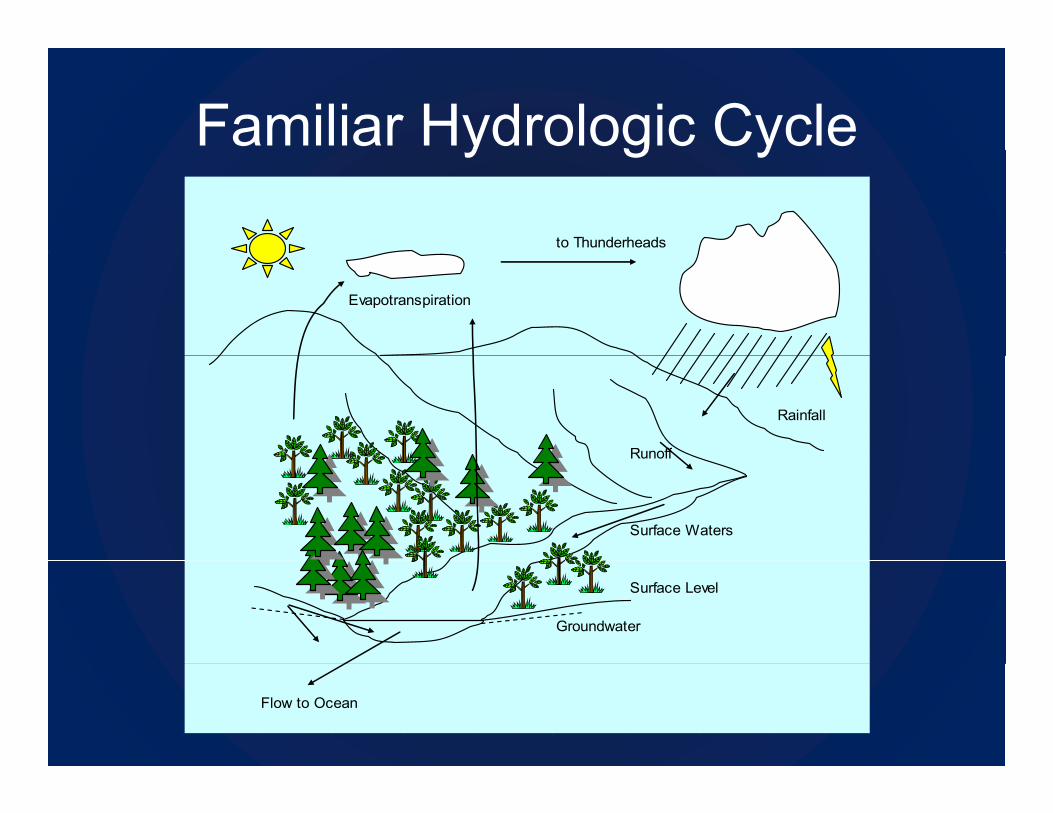
Familiar Hydrologic Cycley g y
to Thunderheads
Evapotranspiration
Rainfall
RunoffRunoff
Surface Waters
Surface Level
Groundwater
Flow to Ocean

In Action…In Action…

Sustainable Withdrawals < Consumption + Returns (to
hydrologic cycle)hydrologic cycle)

Groundwater must be extracted -overpumping may become a biggeroverpumping may become a bigger
problem where recharge is reduced or t i bl i ld i d dsustainable yield is exceeded
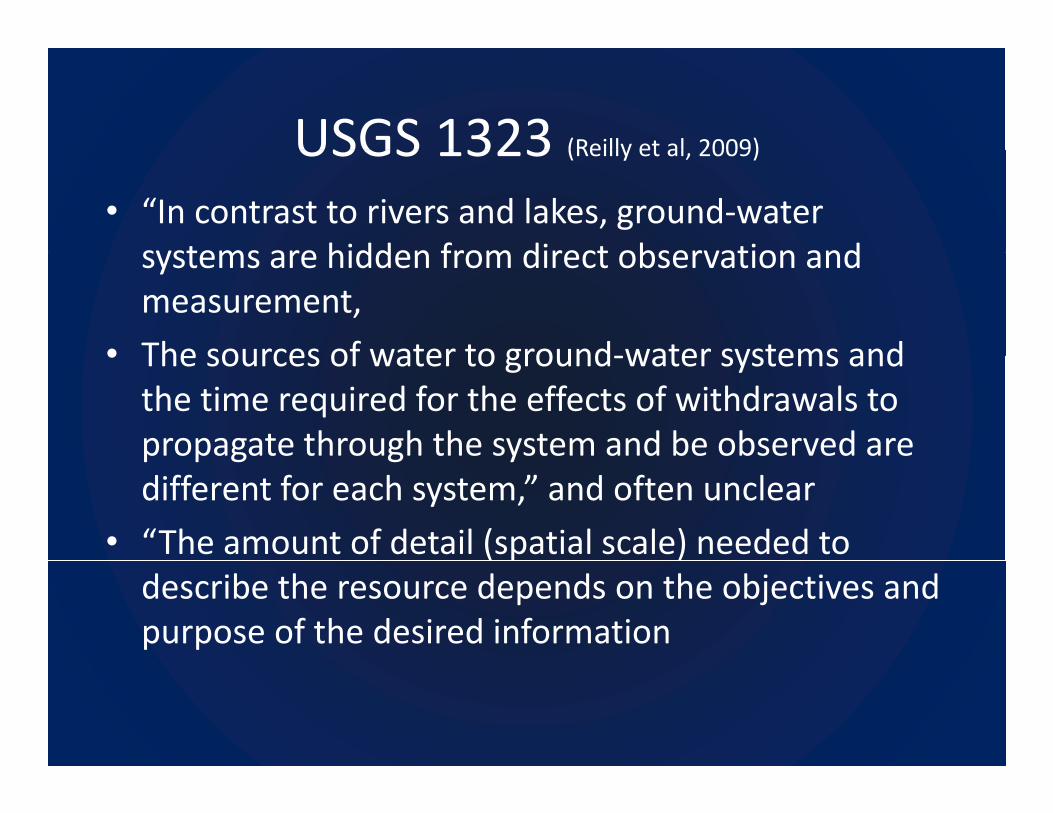
USGS 1323 (Reilly et al 2009)USGS 1323 (Reilly et al, 2009)• “In contrast to rivers and lakes, ground‐water systems are hidden from direct observation andsystems are hidden from direct observation and measurement,
• The sources of water to ground water systems and• The sources of water to ground‐water systems and the time required for the effects of withdrawals to propagate through the system and be observed are p p g g ydifferent for each system,” and often unclear
• “The amount of detail (spatial scale) needed to describe the resource depends on the objectives and purpose of the desired information

USGS 1323 (Reilly et al 2009)USGS 1323 (Reilly et al, 2009)• The amount of change in ground‐water levels that is i i diff f diff dimportant is different for different ground‐water systems
N t ll t d i d d h f th• Not all water pumped is consumed and much of the water pumped is redistributed and changes the ground‐water flow system andground water flow system, and
• The chemical quality of the water is important in determining its suitability (and thus its availability)determining its suitability (and thus its availability) for various uses.”
• Groundwater withdrawals can and usually do affect ythe amount (and quality) of surface water.”

Groundwater intercepts – if surface water is lower, groundwater will be
reduced…..
Land SurfaceLand SurfaceSurface Water
Groundwater Level
Groundwater/Surface Water InterfaceGroundwater/Surface Water Interface
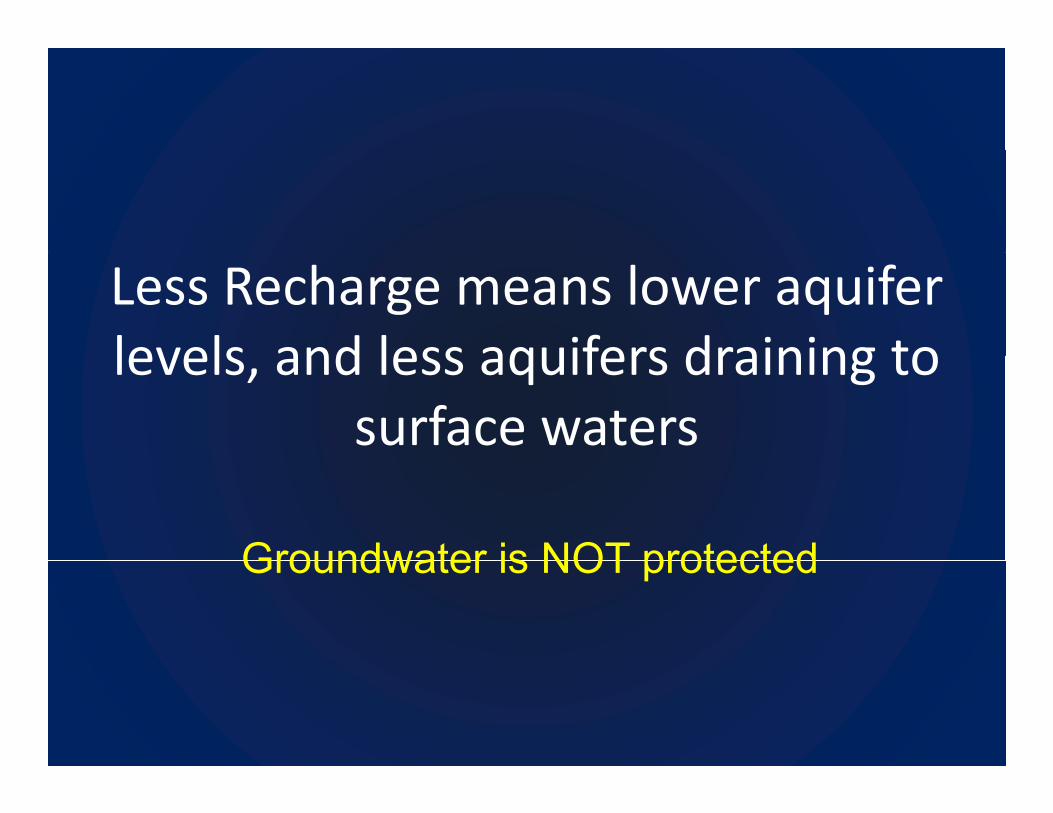
Less Recharge means lower aquifer levels and less aquifers draining tolevels, and less aquifers draining to
surface waters
Groundwater is NOT protectedGroundwater is NOT protected

Average RainfallAverage Rainfall
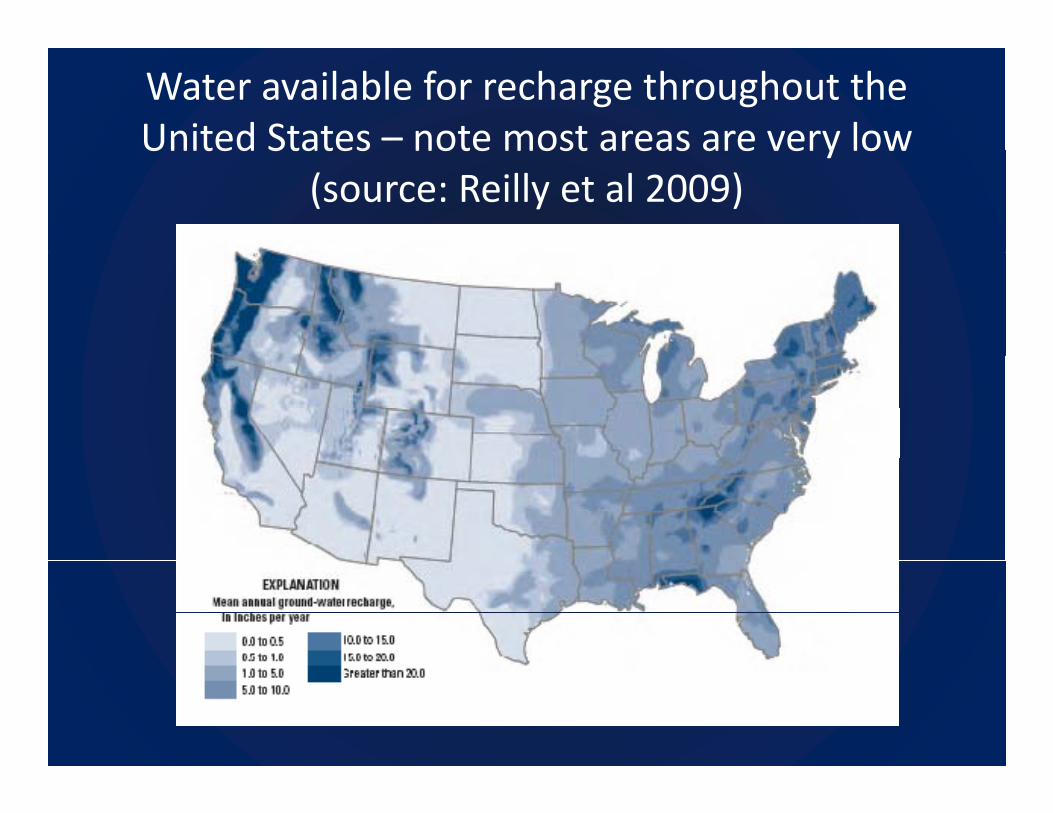
Water available for recharge throughout the United States – note most areas are very lowUnited States note most areas are very low
(source: Reilly et al 2009)

Groundwater PumpingGroundwater Pumping
• USGS estimates that the pumpage of freshUSGS estimates that the pumpage of fresh ground water in the US is approximately 83 BGD or about 8 percent of the estimated 1Unless it is in the wrong places!!BGD or about 8 percent of the estimated 1 trillion gallons per day of natural recharge to the Nation’s ground‐water systems (Hutson
Unless it is in the wrong places!!
the Nation s ground water systems, (Hutson and others, 2004)
• Doesn’t sound so bad right?• Doesn t sound so bad right?
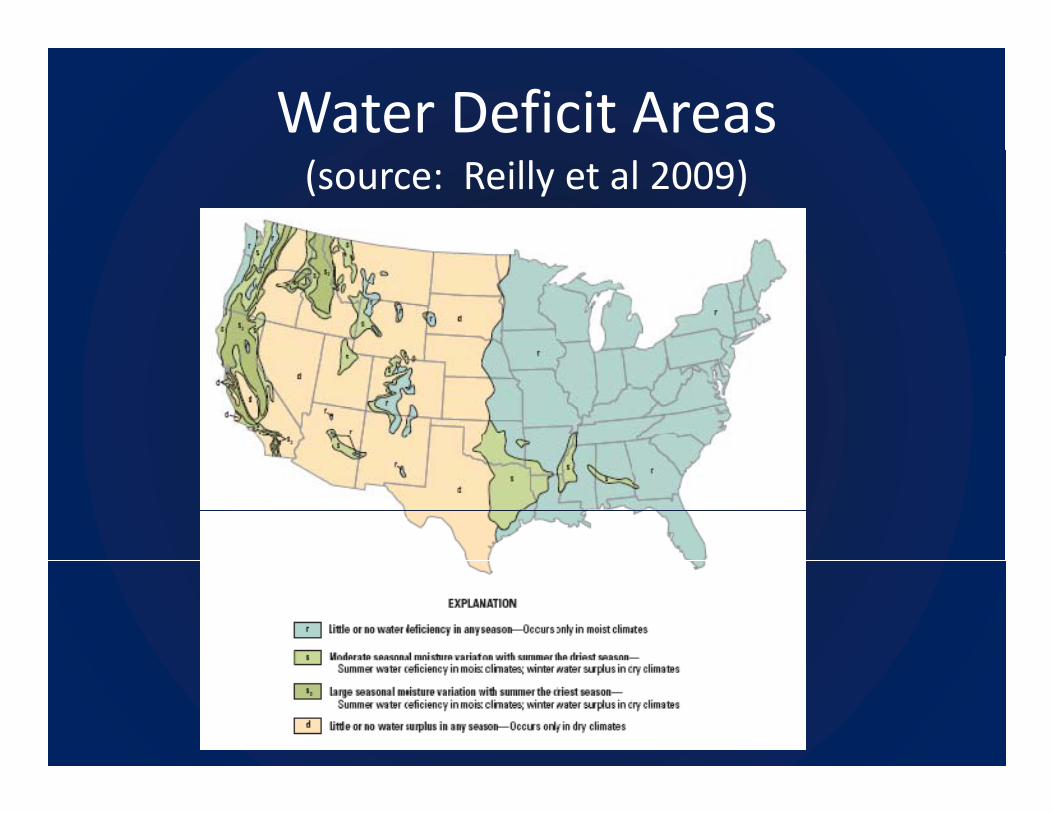
Water Deficit Areas (source: Reilly et al 2009)
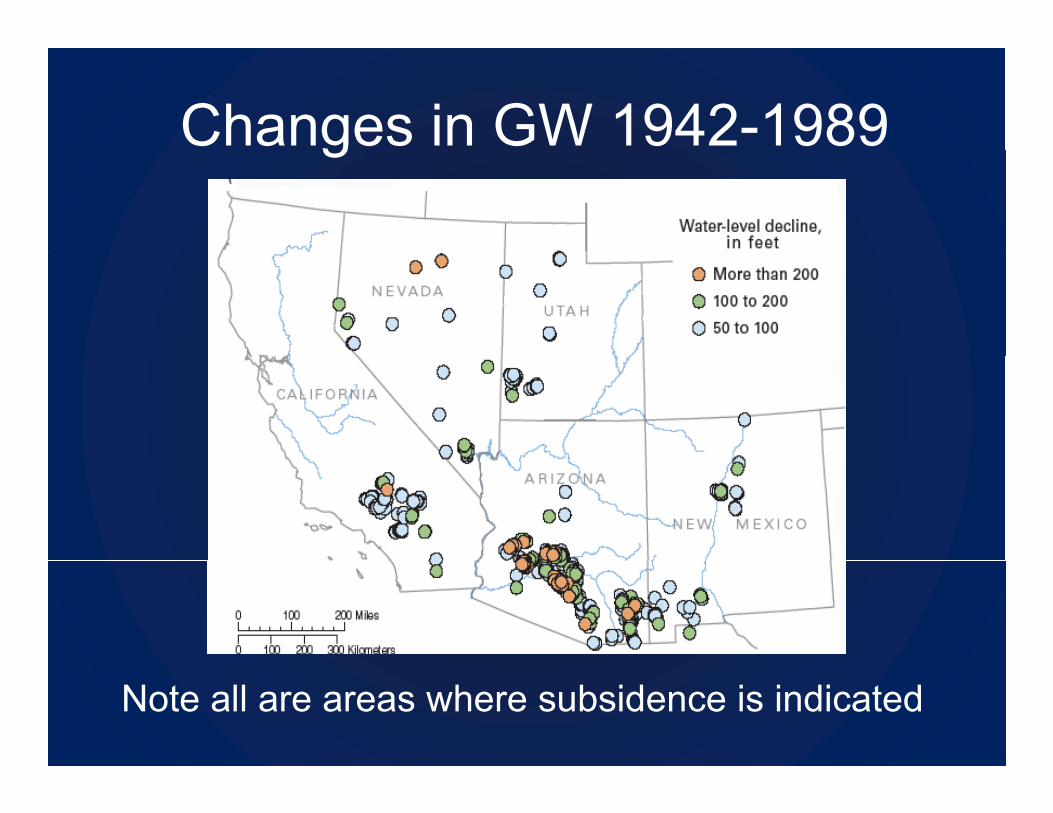
Changes in GW 1942-1989g
Note all are areas where subsidence is indicated

Where is the Recharge?g0
SurficialA if
200
400
Aquifer
Fresh WaterWater Table AquiferHighly Productive
600Hawthorn
Group
Silts and ClaysConfining Unit
800
1000
Confining Unit
1200
1400
FloridanAquiferSystem
Semi-Confined AquiferBrackish Water Productive
1600
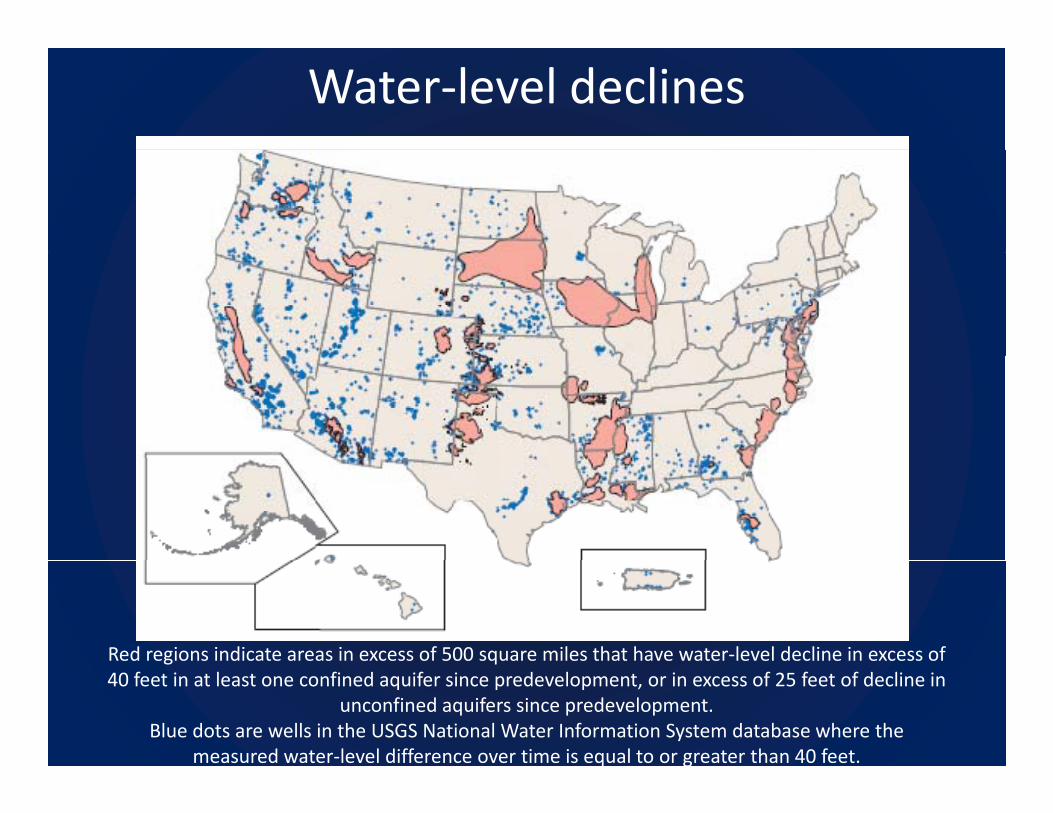
Water‐level declines
Red regions indicate areas in excess of 500 square miles that have water‐level decline in excess of g q40 feet in at least one confined aquifer since predevelopment, or in excess of 25 feet of decline in
unconfined aquifers since predevelopment. Blue dots are wells in the USGS National Water Information System database where the
measured water‐level difference over time is equal to or greater than 40 feet.
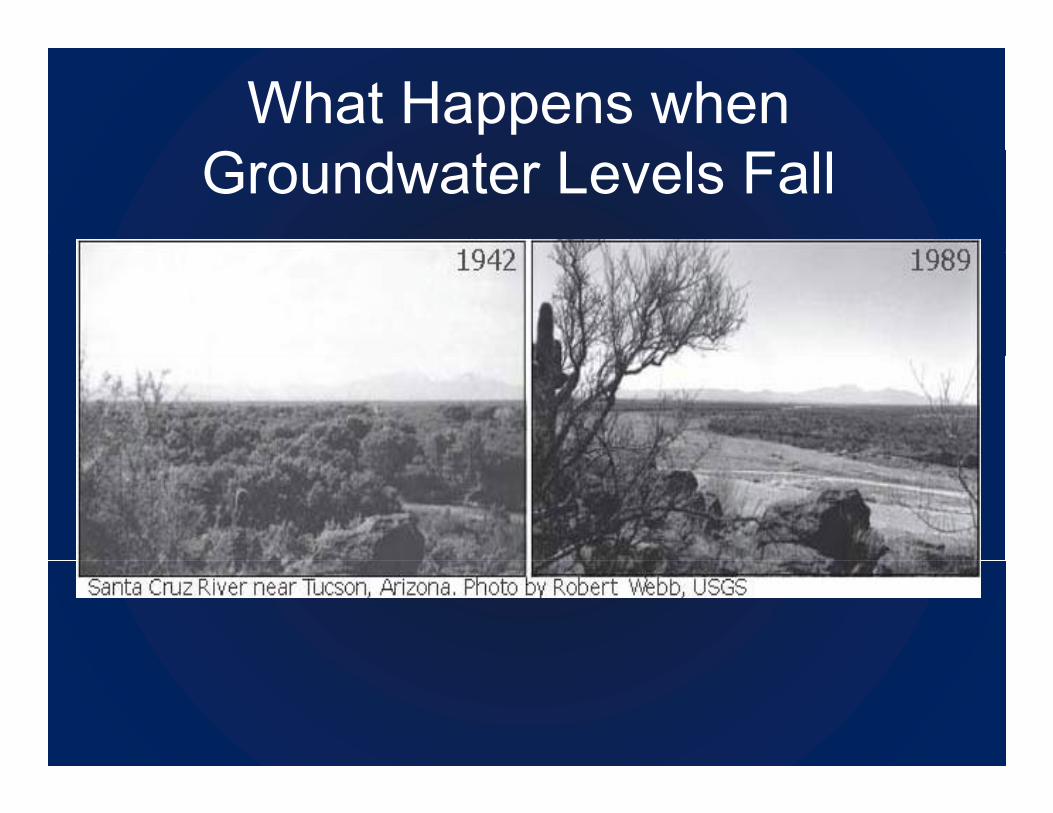
What Happens when Groundwater Levels Fall

Land subsidence
Sustainable (?) Groundwater WaterSustainable (?) Groundwater Water Examples

Water BudgetET
HYDROPOWER
Water Budget
RUNOFFOUTFLOW
AG USAGEAG USAGEURBAN USAGE
P ET + Runoff Outflow GW ΔSP- ET + Runoff – Outflow – GW = ΔS
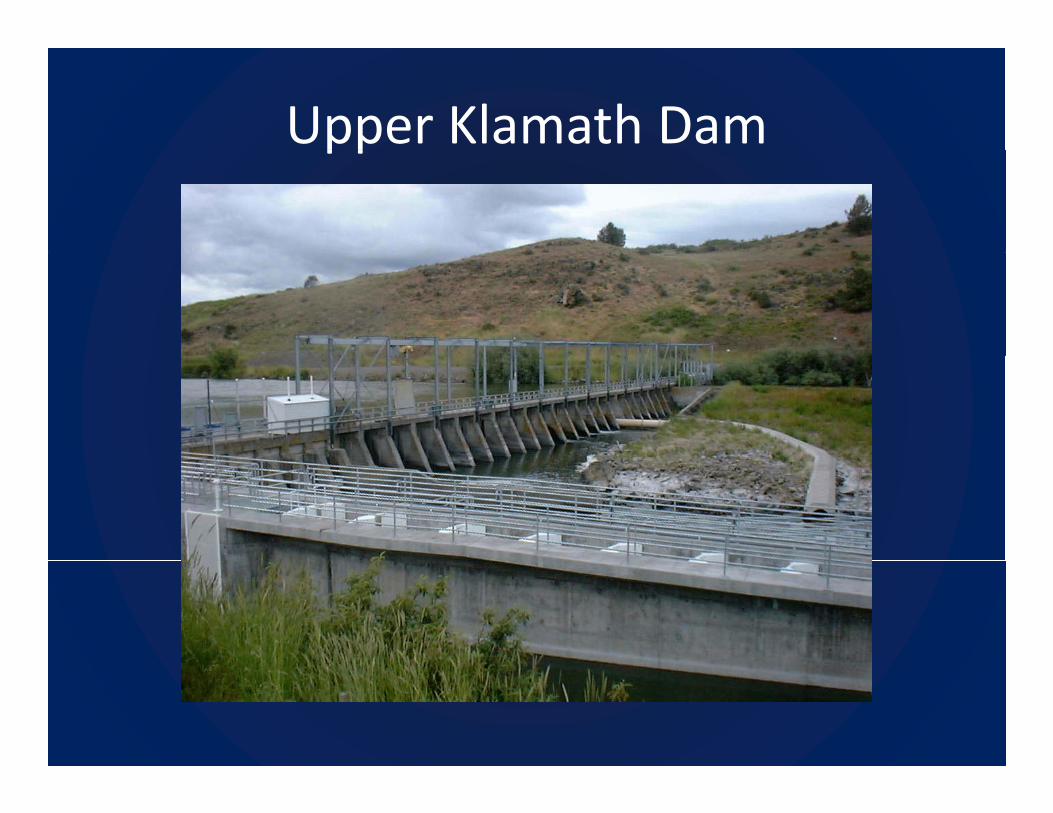
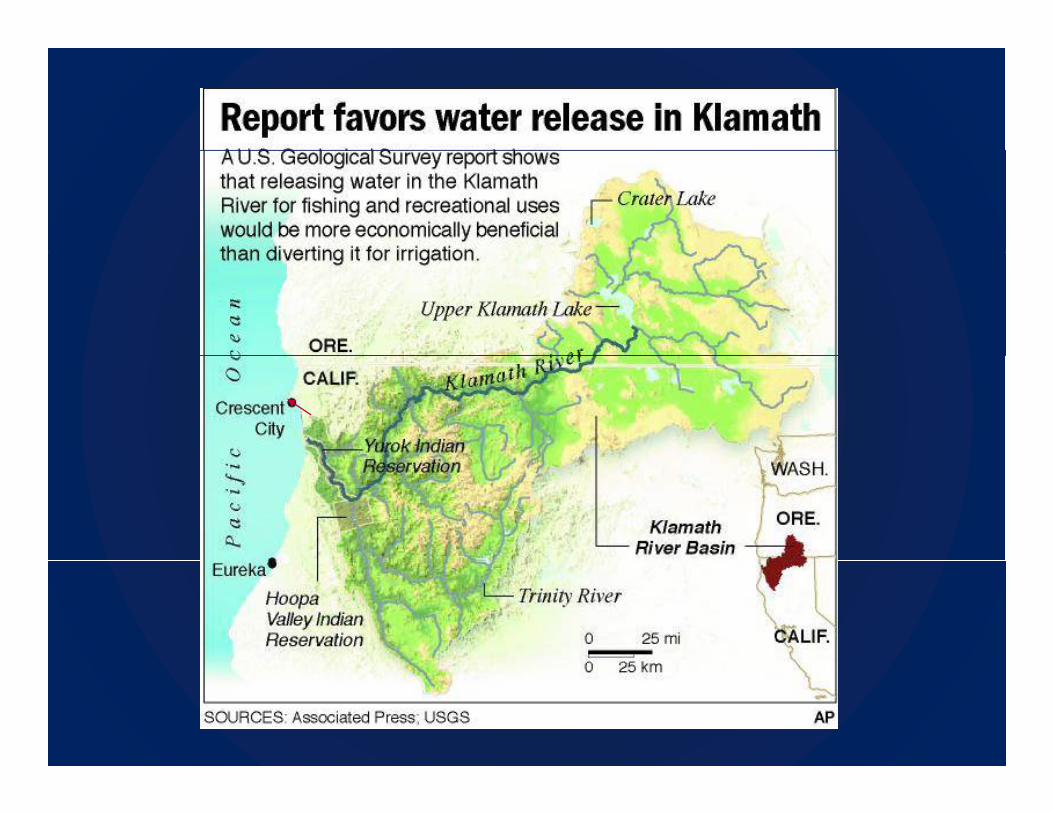
Upper Klamath Dampp
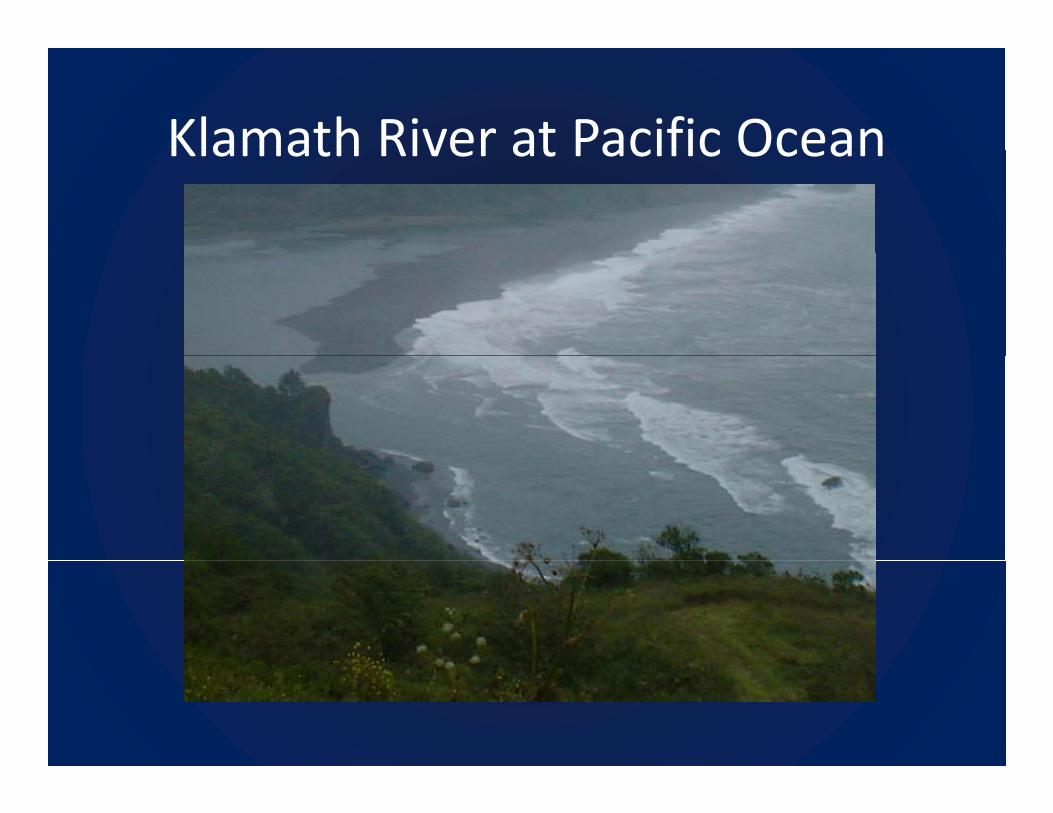
Klamath River at Pacific OceanKlamath River at Pacific Ocean

24
Water Supply Variables pp y
Q tQoutKlamath Tribe
Agriculture/StockQ g
Agriculture/Crops
Public Supply
Qin •rainfall
•groundwater
Klam
ath
Tourism/Wildlife Refuge
Industrial/Fishermen
g
•surface water
hMust balance:
Q = QDepartment of Civil Engineering • Bloetscher • EES 6025 • Fall 2005
Qin = Qout

Department of Civil Engineering • Bloetscher • EES 6025 • Fall 2005
25

Priority to Maximize Economic V l f th Kl th B iValue of the Klamath Basin
2000 value
Potential Value
Current Priority Water
Economic Valued
Industryvalue
($M/yr)Value
($M/yr)Water Rights
c Valued Priority
Agriculture $ 200 $ 200 1 4Tourism $ 700 $ 1,500 2Commercial
$ $Fishery $ 70 $ 4,500 n/a 1Timber $ 250 $ 250 n/a 3Tribes n/a n/a 2 1aTribes n/a n/a 2 1a
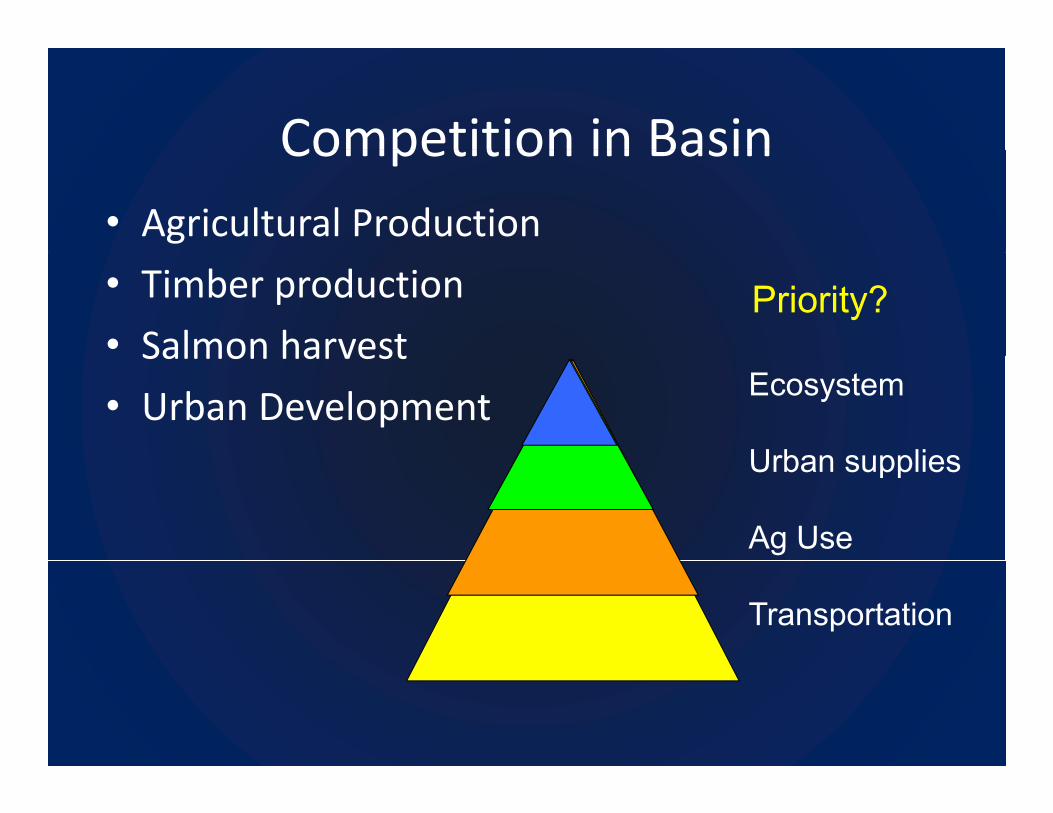
Competition in BasinCompetition in Basin• Agricultural Production
• Timber production
• Salmon harvestPriority?
Salmon harvest
• Urban DevelopmentEcosystem
Urban suppliesUrban supplies
Ag Use
Transportation

Impact of Loss of Groundwaterp
Impact of Primary Water Potential
IndustryLost of
GWSources Losses
($M)65%
Agriculture high
65% Surface, 35% GW $200
Tourism medium GW est $500
Commercial SW w/GW $70Commercial Fishery high
SW w/GW back-up
$70 present
Timber low SW 0Tribes low SW 0Power low SW 0

Comparison of User Values (AW)Based on Optimal DecisionBased on Optimal Decision

Economic IssuesEconomic Issues
• The higher water quality and increasedThe higher water quality and increased salmon population will cause an increase in tourism
• 1:10 Ag crops would be lost• Timber production may be reduced by 13%Timber production may be reduced by 13% because their water usage was decreased by 13%
• Capital costs associated with implementing re‐use facilities
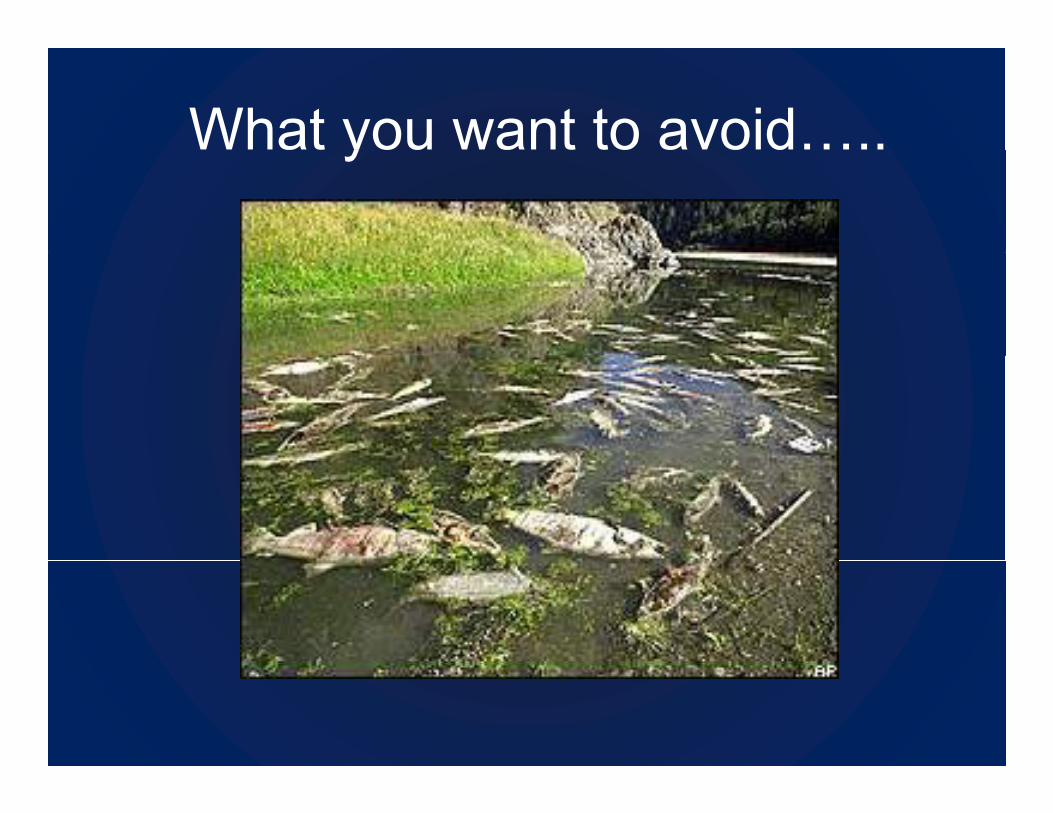
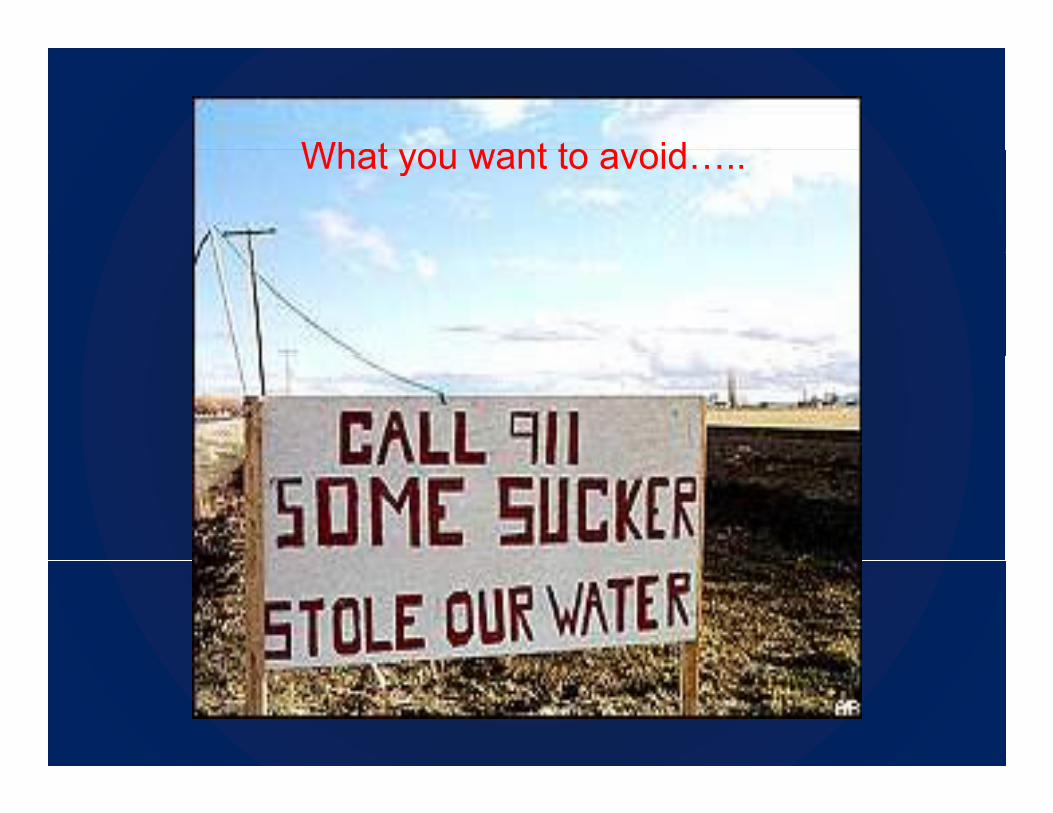
What you want to avoid…..y

Dakota Aquifersq
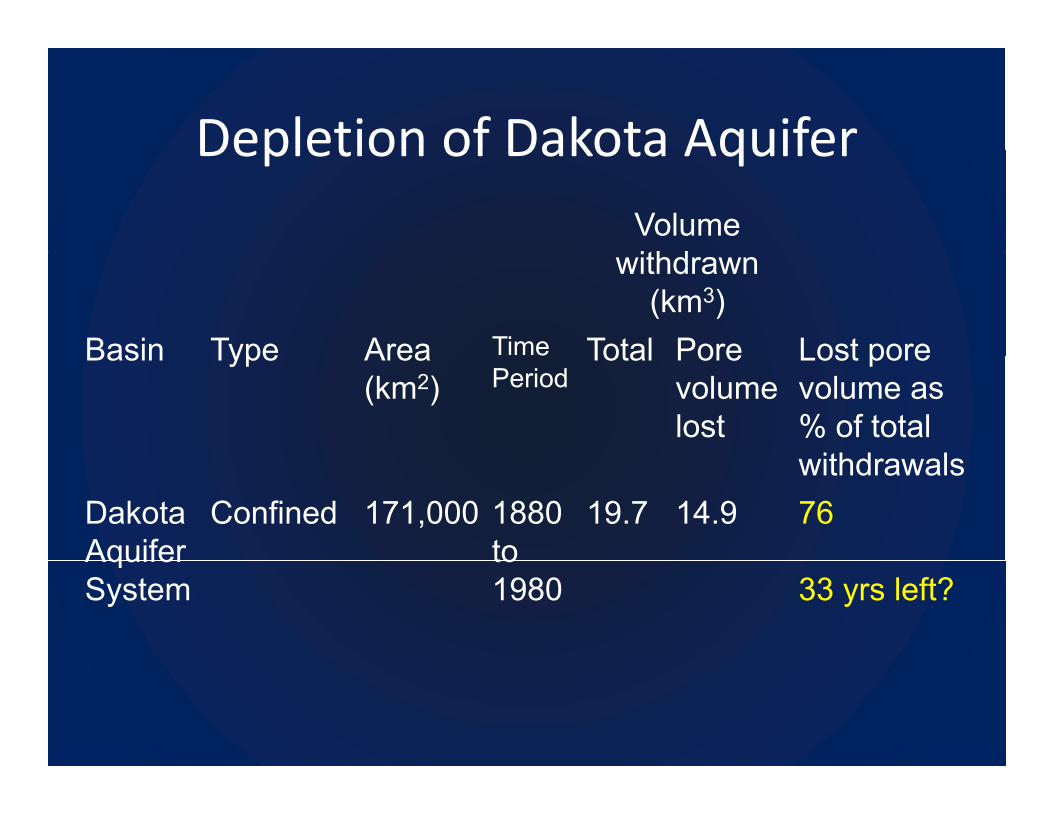
Depletion of Dakota AquiferDepletion of Dakota AquiferVolume ithdwithdrawn (km3)
Basin Type Area Time Total Pore Lost poreBasin Type Area (km2)
ePeriod
Total Pore volume lost
Lost pore volume as % of total
ithd lwithdrawalsDakota Aquifer
Confined 171,000 1880 to
19.7 14.9 76Aquifer System
to1980 33 yrs left?

Dakota ConcernDakota Concern
• Public drinking water supplies include 251Public drinking water supplies include 251 MGD from ground water serving 545,104 people or 78 percent of the total population
.
people, or 78 percent of the total population of the state of South Dakota
• There are not sufficient widespread surface• There are not sufficient, widespread surface water to replace it

Dakota Hydro CycleDakota Hydro Cycle
• Rainfall averages around 20 in/yr
• particularly limited in the summer months when temperatures climb into the high 90s.when temperatures climb into the high 90s.
• ET is high.
Hi t i ll h f th f h d• Historically much of the surface was parched during summer months
Dakota IndustryDakota Industry• Large scale agriculture was encouraged. Cropping of the Dakotas began in the late 19th century and hasthe Dakotas began in the late 19th century and has accelerated with the advent of groundwater pumping systems. p p g y
• South Dakota is home to 21.9 million acres of rangeland, 16.7 million acres of cropland, over 2 g pmillion acres of pasture, and over 500,000 acres of forest.
• The combined value of these and other agricultural products in South Dakota exceeds $3.8 billion
llannually
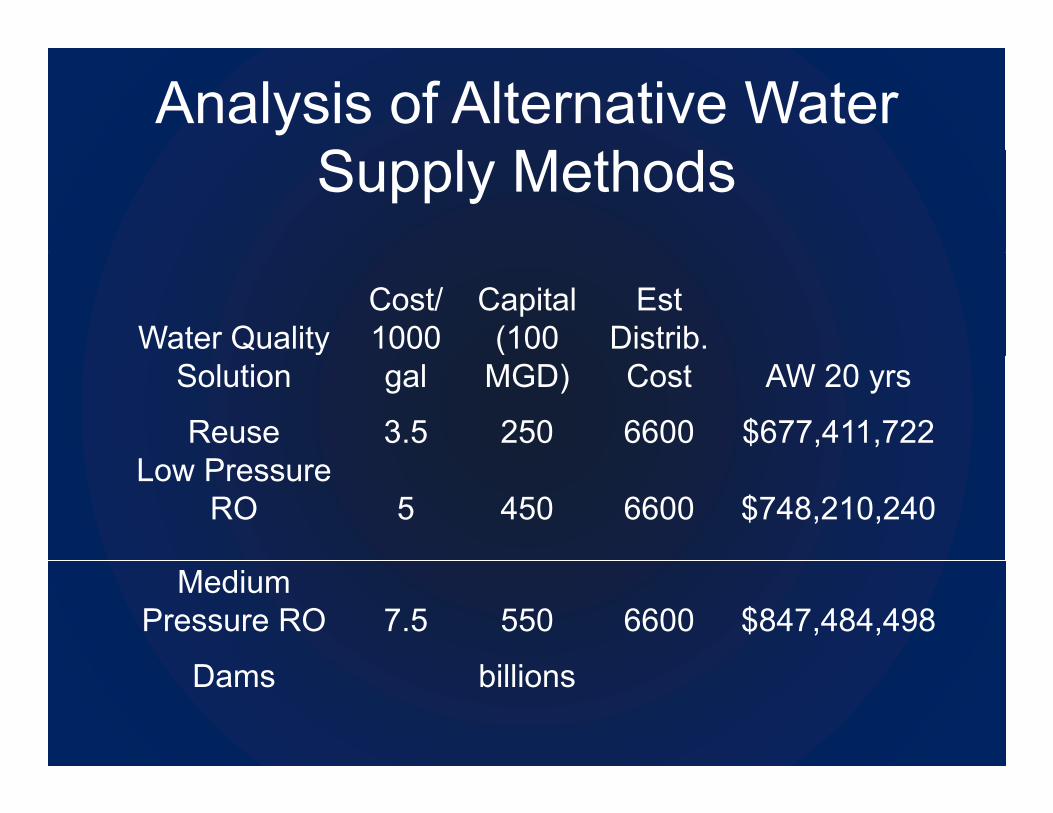
Analysis of Alternative Water S l M h dSupply Methods
Water Quality Cost/1000
Capital (100
EstDistrib.
Solution gal MGD) Cost AW 20 yrs
Reuse 3.5 250 6600 $677,411,722Low Pressure
RO 5 450 6600 $748,210,240
Medium Pressure RO 7.5 550 6600 $847,484,498
Dams billions
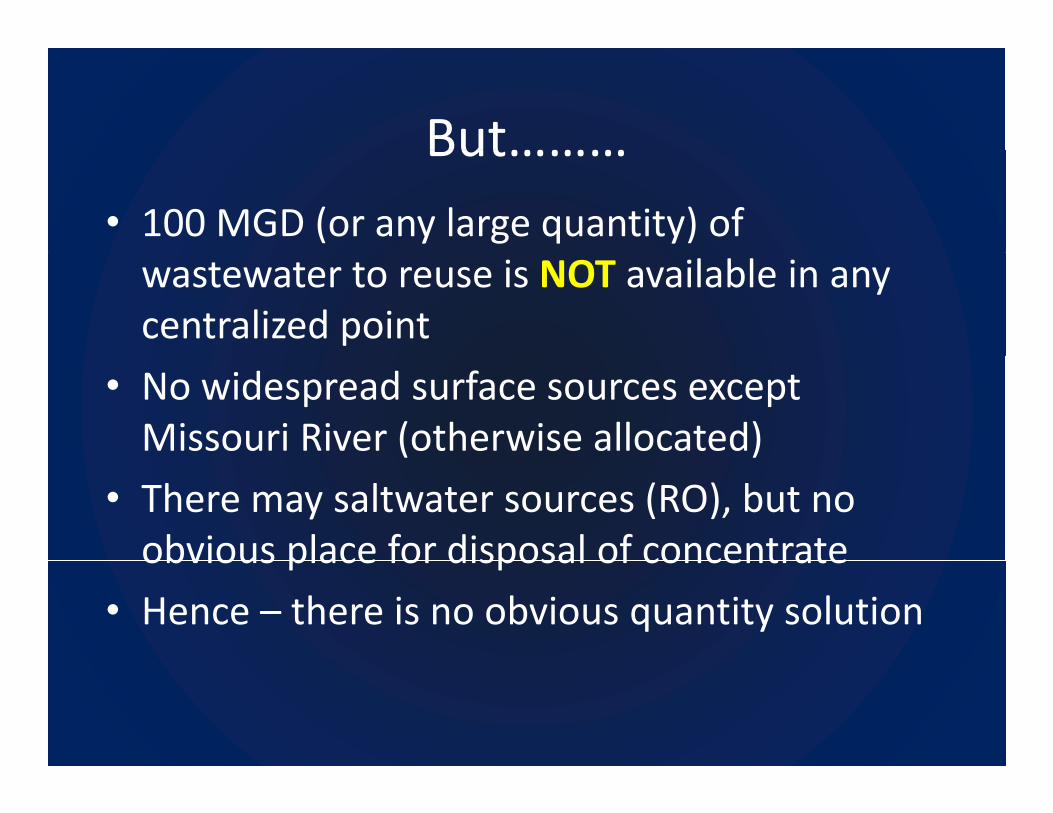
But………But………• 100 MGD (or any large quantity) of wastewater to reuse is NOT available in any centralized point
• No widespread surface sources except Missouri River (otherwise allocated)
• There may saltwater sources (RO), but no obvious place for disposal of concentrateobvious place for disposal of concentrate
• Hence – there is no obvious quantity solution
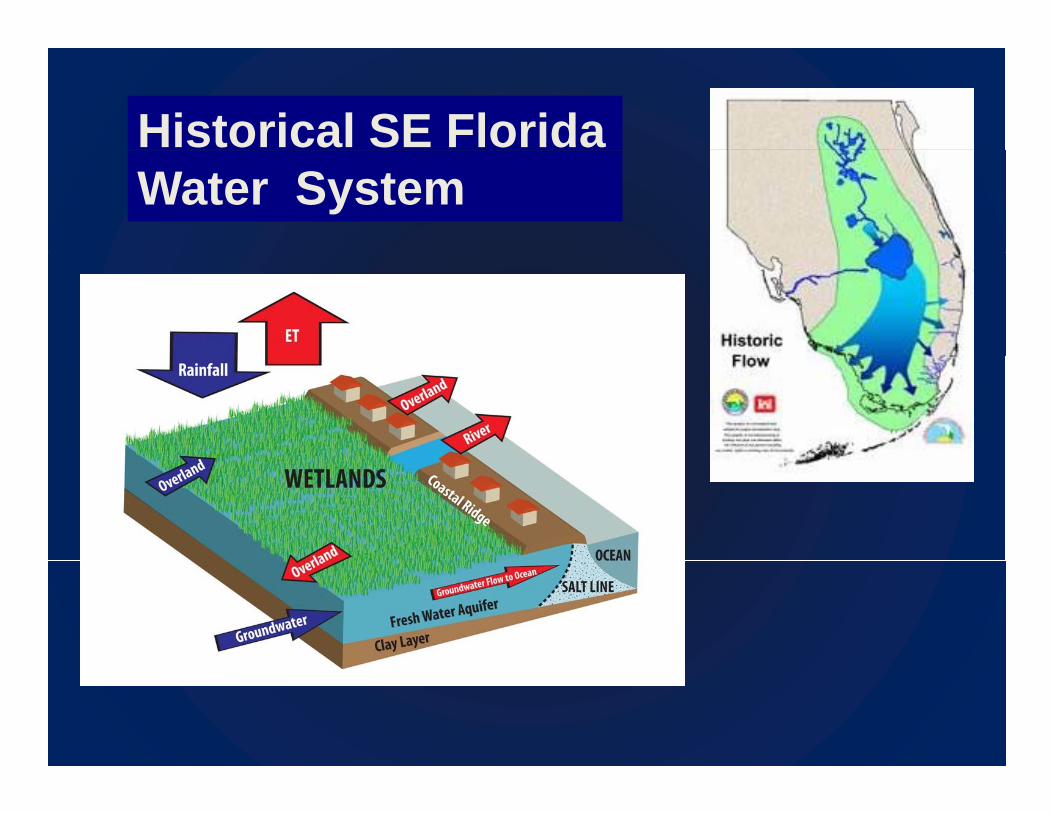
Historical SE Florida Water System

Florida Potential Climate Change Problem
There is no soil storage – So flooding t f dik t f I 95occurs east of dike, west of I-95

Consequences…• Saltwater Intrusion may be offset with GW rise
• Flooding during storms mostly because GW• Flooding during storms, mostly because GW rise = Loss of soil storage capacity
H i f t i b t 3 ft SLR i• Hurricane frequency uncertain, but 3 ft SLR is a problem
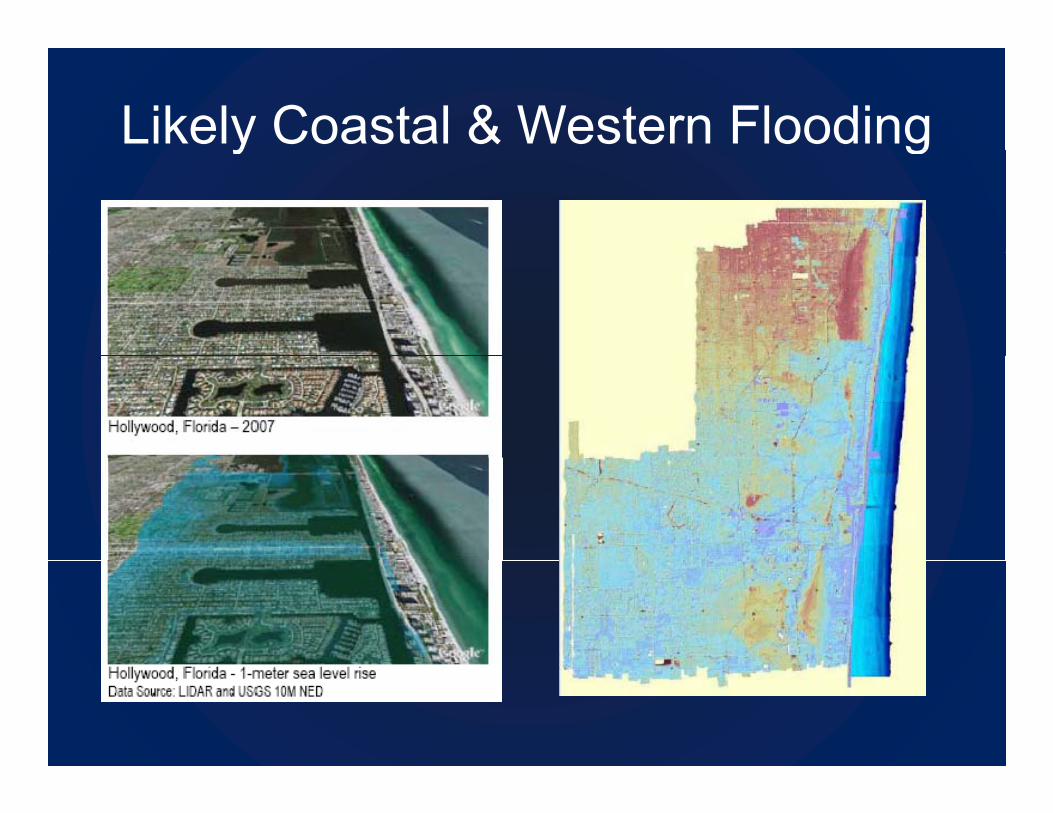
Likely Coastal & Western Floodingy g
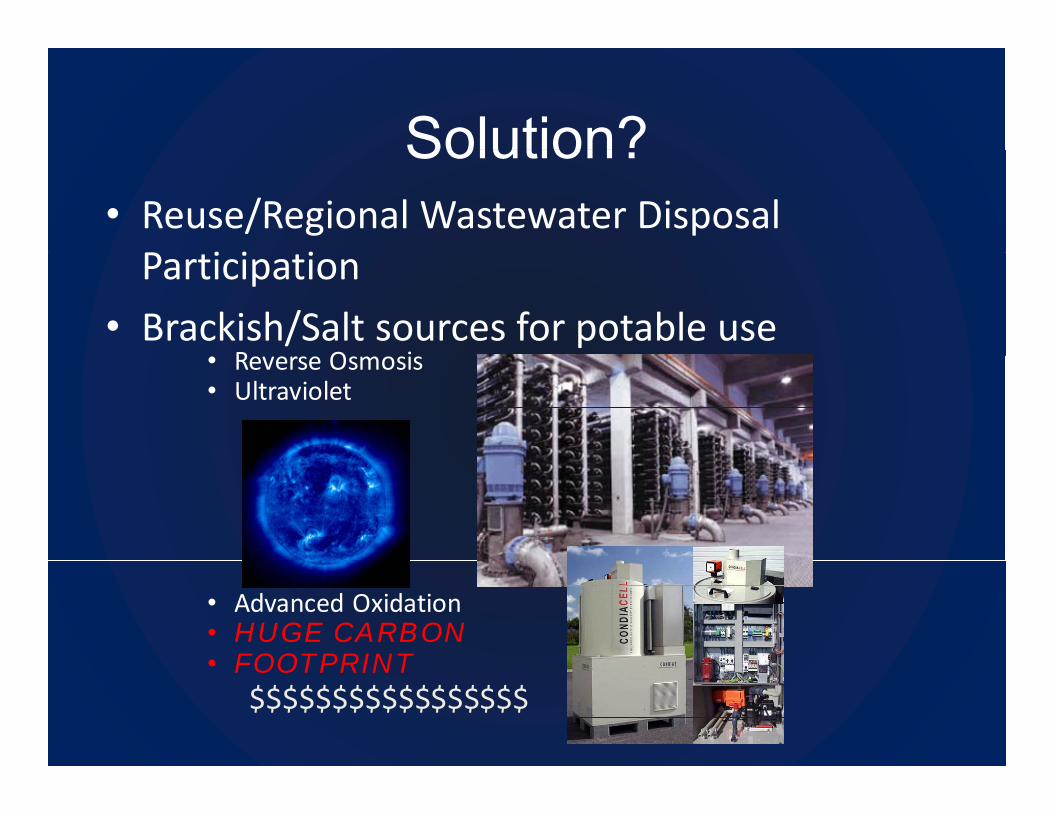
Solution?Solution?• Reuse/Regional Wastewater Disposal P i i iParticipation
• Brackish/Salt sources for potable useR O i• Reverse Osmosis
• Ultraviolet
• Advanced Oxidation• HUGE CARBON • FOOTPRINT• FOOTPRINT
$$$$$$$$$$$$$$$$$
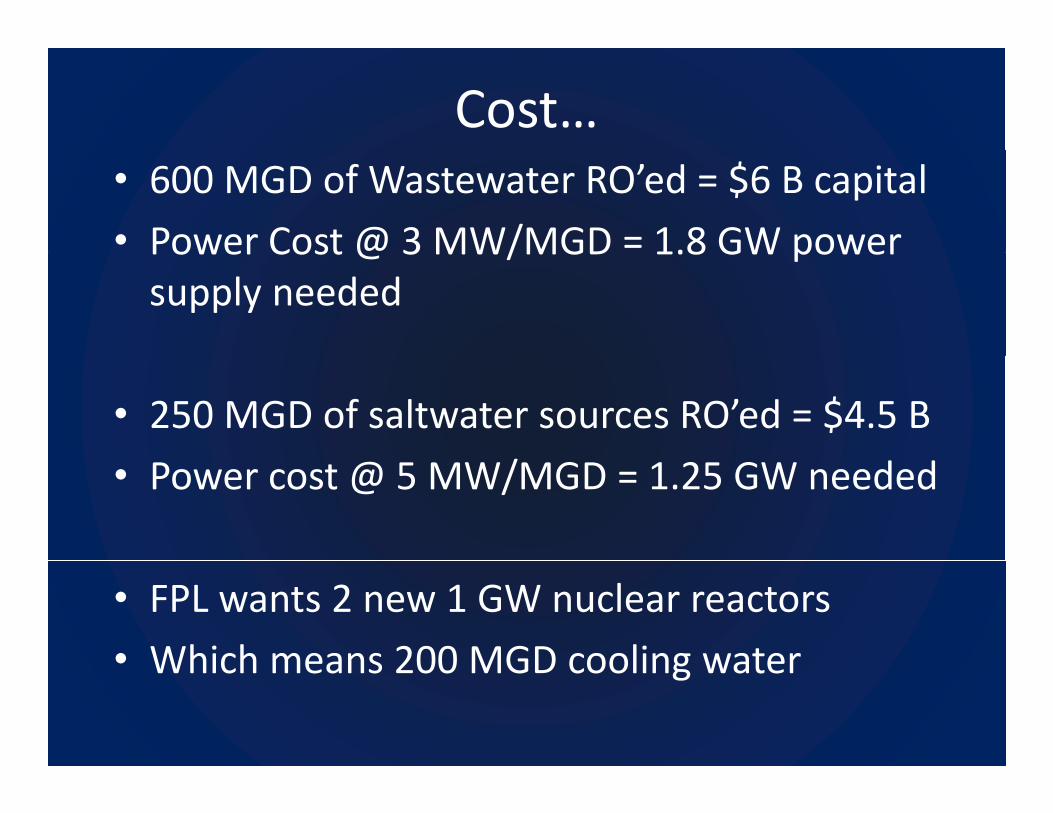
Cost…• 600 MGD of Wastewater RO’ed = $6 B capital
• Power Cost @ 3 MW/MGD = 1.8 GW powerPower Cost @ 3 MW/MGD 1.8 GW power supply needed
• 250 MGD of saltwater sources RO’ed = $4.5 B
• Power cost @ 5 MW/MGD = 1.25 GW needed
• FPL wants 2 new 1 GW nuclear reactors
• Which means 200 MGD cooling water• Which means 200 MGD cooling water
ConclusionsConclusions• Groundwater is decreasing in many areas – it is not sustainableis not sustainable
• Worst in the west – pumping GW artificially k l k l k l blmakes it look like water is available
• Water supply decisions affect not only the current and proposed water users, but may have far‐reaching economic and power effects
ConclusionsConclusions• The effects may not be immediate, but pose
h ll f ichallenges to future generations.
• Basin solutions needed:– The potential for the prioritization of a lesser use over the other uses may create permanent effects that would reduce the GNP of that sector.
– Sustainability issues from macro‐level should be l d h ll i id devaluated when new allocations are considered,
incl power and ecosystems
S l t ff t h li it d lt ti– Some long‐term effects have limited alternatives.
What you want to avoidWhat you want to avoid…..

Questions?Questions?
Threatened RM greenback cutthroat trout