THE IMPACT OF UNEMPLOYMENT, MINIMUM WAGE, AND REAL …
12
1088 © 2020 AESS Publications. All Rights Reserved. THE IMPACT OF UNEMPLOYMENT, MINIMUM WAGE, AND REAL GROSS REGIONAL DOMESTIC PRODUCT ON POVERTY REDUCTION IN PROVINCES OF INDONESIA Nur Feriyanto 1+ Dityawarman El Aiyubbi 2 Achmad Nurdany 3 1,2 Department of Economics, Faculty of Business and Economics, Universitas Islam Indonesia, Yogyakarta, Indonesia. 3 Department of Sharia Economics, Universitas Islam Negeri Sunan Kalijaga, Yogyakarta, Indonesia. (+ Corresponding author) ABSTRACT Article History Received: 28 July 2020 Revised: 2 September 2020 Accepted: 5 October 2020 Published: 13 October 2020 Keywords Unemployment Wage Real GRDP Poverty Indonesia Government policy. JEL Classification: E60; I32; J31; J64. Poverty often impedes economic development in numerous countries, Indonesia included. Poverty, as a result of the failure of economic development, must continue to be suppressed and a solution sought, so that poverty no longer causes adverse effects for the country. The purpose of this study is to examine the impact of unemployment, minimum wage, and real gross regional domestic product (GRDP) on poverty reduction in the provinces of Indonesia. Using periodic data from the Central Bureau of Statistics (Badan Pusat Statistik-BPS) over the period 2010-2019, the fixed effect model of the panel data analysis is estimated. The result showed that unemployment and wage had a significant positive effect on poverty in provinces of Indonesia. Meanwhile, the real GRDP had a significant negative effect on poverty in Indonesia. Thus, government policy must focus on reducing unemployment, maintaining price stability to preserve wage levels and purchasing power, and increasing the real GRDP to reduce poverty in Indonesia. Contribution/Originality: This study contributes to the existing literature in the field of human resource economics, particularly on the issue of poverty reduction. This study is one of the few studies that uses panel data and estimation using the fixed effect model on provinces in a country experiencing issues relating to poverty. 1. INTRODUCTION Poverty has become one of the most talked about issues in socio-economics. It must be faced by all governments in the world, including Indonesia. A large number of poor people in a country will result in a heavy macroeconomic burden. It reduces the quality of life among the population due to the limited ability of poor people to fulfill their basic daily needs. Therefore, almost all governments in the world endeavor to minimize the number of poor people in order to realize a better quality life for their people. Support from the World Bank has been given to all countries since 1990 by aiming to reduce extreme poverty across the globe (Konkel, 2014). Indonesia has 33 provinces with varying numbers of poor people in each province. Figure 1 shows the average number of poor people per year over the period 2010-2019. According to Figure 1, there are three provinces in Indonesia that have the highest poor population: East Java has 4,797,212 poor people, Central Java has 4,610,475 poor people, and West Java has 4,226,775 poor people. The three provinces with the lowest number of poor people Asian Economic and Financial Review ISSN(e): 2222-6737 ISSN(p): 2305-2147 DOI: 10.18488/journal.aefr.2020.1010.1088.1099 Vol. 10, No. 10, 1088-1099. © 2020 AESS Publications. All Rights Reserved. URL: www.aessweb.com
Transcript of THE IMPACT OF UNEMPLOYMENT, MINIMUM WAGE, AND REAL …

1088
© 2020 AESS Publications. All Rights Reserved.
THE IMPACT OF UNEMPLOYMENT, MINIMUM WAGE, AND REAL GROSS REGIONAL DOMESTIC PRODUCT ON POVERTY REDUCTION IN PROVINCES OF INDONESIA
Nur Feriyanto1+
Dityawarman El Aiyubbi2
Achmad Nurdany3
1,2Department of Economics, Faculty of Business and Economics, Universitas Islam Indonesia, Yogyakarta, Indonesia.
3Department of Sharia Economics, Universitas Islam Negeri Sunan Kalijaga, Yogyakarta, Indonesia.
(+ Corresponding author)
ABSTRACT Article History Received: 28 July 2020 Revised: 2 September 2020 Accepted: 5 October 2020 Published: 13 October 2020
Keywords Unemployment Wage Real GRDP Poverty Indonesia Government policy.
JEL Classification: E60; I32; J31; J64.
Poverty often impedes economic development in numerous countries, Indonesia included. Poverty, as a result of the failure of economic development, must continue to be suppressed and a solution sought, so that poverty no longer causes adverse effects for the country. The purpose of this study is to examine the impact of unemployment, minimum wage, and real gross regional domestic product (GRDP) on poverty reduction in the provinces of Indonesia. Using periodic data from the Central Bureau of Statistics (Badan Pusat Statistik-BPS) over the period 2010-2019, the fixed effect model of the panel data analysis is estimated. The result showed that unemployment and wage had a significant positive effect on poverty in provinces of Indonesia. Meanwhile, the real GRDP had a significant negative effect on poverty in Indonesia. Thus, government policy must focus on reducing unemployment, maintaining price stability to preserve wage levels and purchasing power, and increasing the real GRDP to reduce poverty in Indonesia.
Contribution/Originality: This study contributes to the existing literature in the field of human resource
economics, particularly on the issue of poverty reduction. This study is one of the few studies that uses panel data
and estimation using the fixed effect model on provinces in a country experiencing issues relating to poverty.
1. INTRODUCTION
Poverty has become one of the most talked about issues in socio-economics. It must be faced by all
governments in the world, including Indonesia. A large number of poor people in a country will result in a heavy
macroeconomic burden. It reduces the quality of life among the population due to the limited ability of poor people
to fulfill their basic daily needs. Therefore, almost all governments in the world endeavor to minimize the number
of poor people in order to realize a better quality life for their people. Support from the World Bank has been given
to all countries since 1990 by aiming to reduce extreme poverty across the globe (Konkel, 2014).
Indonesia has 33 provinces with varying numbers of poor people in each province. Figure 1 shows the average
number of poor people per year over the period 2010-2019. According to Figure 1, there are three provinces in
Indonesia that have the highest poor population: East Java has 4,797,212 poor people, Central Java has 4,610,475
poor people, and West Java has 4,226,775 poor people. The three provinces with the lowest number of poor people
Asian Economic and Financial Review ISSN(e): 2222-6737 ISSN(p): 2305-2147 DOI: 10.18488/journal.aefr.2020.1010.1088.1099 Vol. 10, No. 10, 1088-1099. © 2020 AESS Publications. All Rights Reserved. URL: www.aessweb.com

Asian Economic and Financial Review, 2020, 10(10): 1088-1099
1089
© 2020 AESS Publications. All Rights Reserved.
per year are:Bangka Belitung Islands with 71,027 poor people, North Maluku with 84,641 poor people, and the Riau
Islands with 126,620 poor people. The difference in the number of poor people in each province indicates the extent
of the problem and how much needs to be done to reduce the number of people in poverty.
Figure-1. Poverty in Provinces of Indonesia (shown in thousands), 2010-2019
Source: Central Bureau of Statistics of Indonesia.
The highest number of unemployed people in Indonesia is in Java, the most populous island. The largest
average number of unemployed per year over the period 2010-2019 is in the province of West Java with 1,859,909
unemployed, followed by Central Java with 936,983 unemployed, and East Java with 869,135 unemployed.
Whereas, the lowest average number of unemployment is in the province of West Sulawesi with 16,612
unemployed, the province of Gorontalo with 22,615 unemployed and the province of North Maluku with 24,994
unemployed.
Unemployment is a hinderance to economic development in all provinces because the unemployed do not
contribute to the economy, although they still need access to food, housing, healthcare, etc.. Unemployment is
related to the efforts of local goverments to reduce the number of people out of work in their respective areas (see
Figure 2). Research by Akinmulegun (2014) in Nigeria mentioned that unemployment is a major cause of poverty in
the country. The study recommended that the government carry out a structural transformation in macroeconomic
policies for employment.
Figure-2. Unemployment in Provinces of Indonesia (number of people), 2010-2019.
Source: Central Bureau of Statistics of Indonesia
The number of poor people and unemployment over the period 2010-2019 in provinces of Indonesia seems to
be declining. It is certainly the result of the goverment’s work to reduce unemployment and poverty in every
province of Indonesia. Therefore, it would be interesting to examine the areas that have had an impact in the
decrease in unemployment in Indonesia.
Figure 3 shows three provinces with the highest monthly minimum wage. The first is Jakarta with 2,422,292
IDR, then Papua with 2,114,132 IDR and West Papua with 1,988,166 IDR. The lower monthly minimum wages in

Asian Economic and Financial Review, 2020, 10(10): 1088-1099
1090
© 2020 AESS Publications. All Rights Reserved.
Indonesia are in East Java (957,905 IDR), Central Java (1,047,346 IDR) and West Java (1,097,921 IDR). The real
minimum wage tends to rise as the Indonesian government’s efforts increase the income of workers. It would be
interesting to further analyze it has an impact in decreasing the number of poor people across Indonesia.
Figure-3. Minimum Wages in Province of Indonesia (IDR), 2010-2019.
Source: Central Bureau of Statistics of Indonesia.
A consistent value of GRDP reflects economic productivity in an area. The higher the value of GRDP, the
more productive an area is. Every province in Indonesia over the period 2010-2019 shows an increase in GRDP. It
means each province has succeeded in increasing its performance by increasing production during this period.
Although the real GRDP of each province in Indonesia increased during this period, the efforts made by provincial
goverments towards this increase need to be assessed regarding their impact on the reduction in the number of poor
people in each province. Research by Zaman, Khilji, Awan, Ali, and Naseem (2014) in Pakistan explains that real
GDP (economic growth) is the most efficient way to alleviate poverty, especially in the dominant economic sectors
that play an important role in increasing their employees’ income. The Pakistani government significantly
decreased the number of poor people thorugh increased public income. The result of this research proves that
economic growth (real GDP) in Pakistan has a negative significant effect on poverty.
Figure 4 indicates that there are three provinces in Indonesia over the period 2010-2019 that had the highest
average real GRDP: Jakarta (1,432,054.75 billion IDR), East Java (1,305,797.38 billion IDR) and West Java
(1,188,058.55 billion IDR). Meanwhile, the lowest average real GRDP was found in North Maluku (20,230.79
billion IDR), Gorontalo (21,609.99 billion IDR) and Maluku (24,422.37 billion IDR).
Figure 4. Real GRDP in Provinces of Indonesia (billion IDR), 2010-2019.
Source: Central Bureau of Statistics of Indonesia.
The novelty of this study is that the research focuses on different variables that are not mentioned in previous
research. For example, research by Akinmulegun (2014) in Nigeria only discuss unemployment, while Zaman et al.

Asian Economic and Financial Review, 2020, 10(10): 1088-1099
1091
© 2020 AESS Publications. All Rights Reserved.
(2014) discuss real GDP and its effect on poverty, and Shitile and Abubakar (2019) only examined the effects of
foreign aid and grants on poverty in Nigeria. Additionally, this study uses a particular research methodology,
namely panel data regression analysis with a fixed effect model approach, which was not used in earlier literature.
Therefore, this study will focus on four variables (unemployment, wage, real GRDP and poverty) and use the
methodology previously mentioned to respond to the research gap in the earlier study.
2. LITERATURE REVIEW
Akinmulegun (2014) explains that unemployment is a major cause of poverty in Nigeria. This research then
suggests that the government carries out a structural transformation in macroeconomic policies on employment.
The study by Adejimi and Ogunode (2015) also concluded that poverty in Nigeria was largerly influenced by the
unemployment rate, although Nigeria was ranked 158th in the list of the most developed countries in the world.
The unemployment rate is influenced by a lack of infrastructure facilities, a significant population increase and a
school curriculum system with a limited number of educated teachers.
A study conducted by Berardi and Marzo (2015) proves the sector in Africa’s GDP, such as the agriculture, has
a lot of potential for the poor (pro-poor potential). African countries rely heavily on agricultural as the spearhead of
their revenue. Therefore, through its policies, governments strive to encourage increased economic activity in the
agricultural sector in order to increase labor demand. Through the use of a large workforce, public revenue is
expected to increase and, in turn, improve the welfare of people in the country, and ultimately reduce the number of
poor people across the continent.
Research regarding the effect of unemployment on poverty in European countries also has been studied
Kiaušienė (2015). This study focused on unemployed women in 28 European countries using scientific literature
analysis, comparison between countries, descriptive statistics and regression analysis. The study aimed to determine
whether there is a correlation between unemployment and poverty in these countries. The result shows that
unemployed women are positively correlated with the risk of experiencing poverty, meaning thatmore women out
of employment increased poverty rate in that category. Conversely, it can be concluded that if the unemployment
rate can be kept low then the number of poor people would decrease because people in employment generate
revenue. Kiaušienė’s study also found that fewer women than men were unemployed.
The same case is also examined by Kware (2015) in Nigeria. According to research, Nigeria is the strongest
economic country in Africa. Kware conducted research on unemployment, inequality and poverty. Even though
Nigeria has high economic growth, issues such as unemployment, inequality and poverty are still problems that are
yet to be solved. The high rate of unemployment causes great disparity regarding personal income,which leads to
severe inequality. This inequality between the different levels of income in urban communities and rural
communities is evident, and consequently, poverty continues to rise.
Sabia and Nielsen (2015) examined the minimum wage situation in the United States. The study used data from
the Survey of Income and Program Participation (SIPP) over the period 1996-2007. The results indicated an
increase in minimum wage by the US government between 1996 and 2007, which had a positive impact on the
poverty rate. It demonstrated that a minimum wage increase can reduce the poverty rate in the country. It is felt by
all members of society in the US. Researchers emphasized that increasing the minimum wage is important, but also
that the redistribution of income as a result of the increase is also important, especially for low-skilled workers.
Another study on minimum wage was carried out by Bolwell (2016). His study waas in relation to global
minimum wage setting in order to reduce the poverty rate based on the international poverty line. The study
explained how a global minimum wage could be introduced in all countries. According to the author, the basic
introduction of a global minimum wage would entail the following: the calculation of the international poverty line
by the World Bank, its application in developing countries, an invitation to broader stakeholders, and a rigorous

Asian Economic and Financial Review, 2020, 10(10): 1088-1099
1092
© 2020 AESS Publications. All Rights Reserved.
monitoring process. The results show there is a positive effect if the minimum wage is applied globally because it
helps to equalize wages between high-skilled and low-skilled jobs.
The next study, carried out by Kuada (2014) examined the effect of real GDP on poverty alleviation . This
study was conducted in order to identify the relationship between economic growth and poverty using literature
review methods that focused on economic development in Africa. Its purpose was to provide a complete description
of the dominant issues of economic growth and poverty alleviation efforts. The results show that economic growth
can positively influence social issues, especially for poor people, by reducing poverty. This demonstrates how
economic growth should work, not limited to economic growth alone, but should also be inclusive of income
distribution.
The other study on the effect of the increase in real GDP on poverty alleviation was conducted by Sasmal and
Sasmal (2016) in India. This study aimed to identify a relationship between public expenditure, increasing real GDP
(economic growth) and poverty alleviation. This study used panel data regression analysis with data from each state
in India. The results of the study show that there is a significant positive relationship between public expenditure,
economic growth and poverty alleviation. It can be seen from the states in India that high levels of public
expenditure (for development, such as infrastructure, building construction, irrigation, electric power centers and
communications), have proven to have an impact on high economic growth. Furthermore, the states that have high
average economic growth have low poverty rates. It means there is a positive relationship between economic
growth (the increasing real GDP measurement) and poverty levels.
Nyasha, Gwenhure, and Odhiambo (2017) stated in their study, that although analysis of economic growth and
poverty alleviation can be met through a trickle down effect, there are still many alternative ways to examine it.
The study gives an overview of economic growth and poverty using a dynamic causal linkage approach in Ethiopia
over the period 1970-2014. Its method is the autoregressive distributed lag (ARDL), bounding test and ECM based
on Granger Causality. The results of the study show that there is a short term negative causality between economic
growth as measured by real GDP and poverty alleviation. Conversely, in the long term, causality is only found from
economic growth to poverty alleviation, not vice versa. As a result, researchers recommended that the government
prepare pro-poverty reduction policies through increasing economic growth (real GDP increase), which could be
done in the short term.
Based on the literature review above, the hypotheses of this research relating to Indonesia are:
H1 : High unemployment has a significant negative effect on poverty.
H2 : Increasing the minimum wage has a significant positive effect on poverty.
H3 : Real GRDP growth has a significant positive effect on poverty.
3. RESEARCH METHODOLOGY
This study used secondary data on 33 provinces in Indonesia over the period 2010–2019. The analysis
technique used panel data regression analysis. This analysis combined cross section and times series data, which
proved advantageous in providing solutions that cannot be reached by examining the two individually (Feriyanto,
2019). The research data in this analysis includes unemployment, wages, real GRDP and poverty. The data is taken
from the Central Bureau of Statistics (Badan Pusat Statistik-BPS). The formulation of a specifications model in this
study is Poverty = f (unemployment, wage, real GRDP).
After examining the MWD (MacKinnon, White, and Davidson) test model, it was found that the best
functional form for estimating poverty in provinces of Indonesia was in the form of a logarithmic (log) equation, as
shown below:
log PVTit= β0+ β1 log UNEMit + β2 log Wit+ β3 log real GRDPit + eit (1)
Description:
PVT = Poverty (people).

Asian Economic and Financial Review, 2020, 10(10): 1088-1099
1093
© 2020 AESS Publications. All Rights Reserved.
UNEM = Unemployment (people).
W = Wage (IDR).
Real GRDP = Real Gross Regional Domestic Product (billion IDR).
β0 = constant.
t = the period 2010-2019.
e = error term.
4. ANALYSIS AND DISCUSSION
Poverty models to be estimated used data from 2010–2019 (10 years), so the total pool of observation data
includes up to 330 (330 = 10 years x 33 provinces data). The test results of empirical data using theFixed Effect
Model are as follows:
Based on Table 1, the value of F cross-section is 948.233090 and its probability value was 0.0000. At 5% (0.05)
of the alpha level, the probability value of F cross-section is less than the alpha level of 5%, meaning that H0 is
rejected. It means that the best panel data model used was the fixed effect model rather than the common effect
model.
Table 1. Result of redundant fixed effects tests.
Redundant Fixed Effects Tests Test cross-section fixed effects Effects Test
Statistic
d.f.
Prob.*
Cross-section F 948.233090 (32,294) 0.0000
Cross-section Chi-square 1533.311643 32 0.0000 Note: Ho: Common Model is true; Ha: Fixed Effect is true. *= Ho is rejected at 0.05 significance level, Fixed Effects is better than Common Model.
Based on Table 2, the value of cross section random Chi-Sq. The statistic was 95.109116 and its probability value
was 0.0000. At 5% (0.05) of the alpha level, the probability value of a random cross-section was less than alpha 5%,
meaning H0 is rejected. This shows again that the best panel data model used was the fixed effect model, not the
random effect model.
Table 2. Result of Hausman test: Fixed and Random effects.
Note: Ho: Random Effects is true; Ha: Fixed Effect is true. *= Ho is rejected at 0.05 significance level, Fixed Effect is better than Random Effect.
Correlated Random Effects - Hausman Test Test cross-section random effects Test Summary
Chi-Sq. Statistic
Chi-Sq. d.f.
Prob.* Cross-section random 95.109116 3 0.0000
The results of an empirical assesment data using Fixed Effect Model are shown in Table 3 below:
Table 3. Regression result-dependent variable: Log PVT.
Independent Variables Coefficient t-Statistic Prob.
Constant 7.674437 18.14430 0.0000
Log UNEM 0.044005 2.300698 0.0221 b)
Log W 0.014441 0.710433 0.4780
Log realGRDP -0.193201 -4.242774 0.0000 b) Note: a) =significant at 0.10 , and b) =significant at 0.05 level respectively.
R-squared 0.996990
Adjusted R-squared 0.996632
F-statistic 2782.319b
log PVTit= β0 + β1 log UNEMit +β2 log Wit +β3 log realGRDPit +eit
log PVTit= 7.674437 + 0.044005 log UNEMit + 0.014441 log Wit - 0.193201 log realGRDPit

Asian Economic and Financial Review, 2020, 10(10): 1088-1099
1094
© 2020 AESS Publications. All Rights Reserved.
R2 =0.996990 N= 330 F-stat= 2782.319
4.1. The coefficient of determination (Goodness Regression Testing)
From the results of the regression that has been conducted, it was found that the value of R2 is 0.996990 or
99.70%. This suggests that the fluctuation of the independent variables can explain the variation of the dependent
variable by as much as 99.70% and the remaining is explained by variables outside the model.
4.2. Test Statistic F (Feasibility Model)
From the results of the regression,, the obtained value of the F-count is equal to 2782.319 and the value of the
F-table obtained was 2.76 with a significance level of α = 0.05. If the result shows that F count is larger than F
table then the conclusion is to reject H0. This means that all the independent variables jointly and significantly
affect the dependent variable.
5. RESULT AND DISCUSSION
5.1. Unemployment (UNEM)
The result of the t-statistics UNEM showed a value of 2.300698 while the t-table is 1.316 (one-sided test) with
α = 5% and df = 330-4 = 326. The value of t-statistics UNEM is higher than t-table. It rejects H0. Moreover, the
coefficient value of UNEM showed a value of 0.044005 it means UNEM had a positive impact on poverty and when
unemployment rises by 1 %, poverty will increase by 0.044005%. These results are in line with those of the study by
Ayala, Cantó, and Rodríguez (2016); FitzRoy and Jin (2017) and Adelowokan, Maku, Babasanya, and Adesoye
(2019).
Ayala et al. (2016) conducted a study of the factors that impact poverty in Spain. The analysis used the
generalized method of moments (GMM) model, using panel data over the period 1987-2015. The results of the
study proved that unemployment has a positive impact on poverty, while inflation has a negative impact. This
finding supports the Spanish government's program in the form of unemployment protection which can reduce
poverty in the country.
The study by FitzRoy and Jin (2017) explained the importance of unemployment policies in reducing poverty.
The author found that the effective policies in place to eradicate poverty and inequality used two approaches. First,
establish a basic incomethat will increase workers' revenue and ultimately reduce poverty. This policy needs to be
followed by a second policy relating to the provision of jobs. Employment opportunities in the community will
reduce unemployment, which, in turn, reduces poverty and income inequality.
Furthermore, Adelowokan et al. (2019) have also investigated the relationship between unemployment,
economic growth and poverty. The study was conducted in Nigeria, using time series data over the period 1985-
2015. The analytical methods use Augmented Dick Fuller, Johansen cointegration, Granger causality and ECM.
The results show that the coefficient between unemployment and poverty was positive and significant at the first
level. The implication of this study states that although a country still has high poverty rates, economic growth will
continue to increase. Therefore, there must be a macroeconomic policy that can ensure equal distribution of income
for all levels of society, including the poor who make up the majority of the unemployed.
5.2. Wage (W)
The results in Table 3 showed the probability of wage is 0.4780 or 47.80 %, with alpha (α) = 10% (one-sided
test). Because the probability is higher than alpha, so H0 is accepted. It means that wage had no significant effect on
poverty in Indonesian provinces.
Minimum wages in Indonesia increase annually. The percentage increase is associated with economic growth
and inflation. The minimum wage is paid by the company or industry to its workers. A person whose expenditure is

Asian Economic and Financial Review, 2020, 10(10): 1088-1099
1095
© 2020 AESS Publications. All Rights Reserved.
below the poverty line is considered to be living in poverty. The poverty line is a line that shows the minimum
expenditure for food and other essential items. Poverty in Indonesia is common in people who work in the informal
sector whose jobs are relatively unskilled and labor-intensive, such as street vendors. Income from daily work is
used for living expenses. If a person does not work, they will not receive a daily income and will still be included in
the poor group. Therefore, even if wages rise, they will not reach the level of daily workers whose income depends
on paid employment. In other words, wages do not significantly influence poverty reduction.
The results of this study are in line with the results of a study by Campolieti, Gunderson, and Lee (2012) on
Canada. They found that the wage rate, usually measured by minimum wage, did not affect poverty rate. Minimum
wage is only used as a political rhetoric, which is designed to eliminate poverty. Poor people usually work under the
productivity target, so even if the minimum wage is set, due to low productivity their minimum wage will remain
low and therefore remain poor. Also, research by Sosnaud (2016) concluded that the minimum wage had no
relationship to poverty in Canada and in the US.
But the results of that study were not in accordance with the results of a study by Atkinson, Leventi, Nolan,
Sutherland, and Tasseva (2017) and Quinn and Cahill (2017). They proved that increasing minimum wage has an
impact in reducing the number of poor people.
Research by Atkinson et al. (2017) was conducted in the UK using the EUROMOD approach method, and
tested whether tax-benefit reforms and increasing minimum wage can reduce poverty rate and reduce the gap in
income inequality. The results proved that tax reform can have a positive effect on reducing inequality and poverty
rates in the UK. Tax reforms include a more significant progressive tax structure, other alternatives for social fund
transfers, including increasing minimum wage up to a suitable living wage, can reduce poverty in UK. The results
also showed that increasing minimum wage can enable people to a better life.
The study by Quinn and Cahill (2017) in the US measured how effective minimum wage and tax credits are in
the decline in poverty rates. The results of their study showed that the increase in tax credits and minimum wage
has been proven to reduce poverty significantly. The government, therefore, should employ these two policies in
order to ensure the fairer distribution of wealth. If there was a choice between tax credits or minimum wage,
researchers recommend that governments would be better off using tax credit instruments than minimum wage,
however, if both are used together then the increase in minimum wage and tax credits has a bigger impact in
reducing poverty.
Furthermore, Sabia, Burkhauser, and Mackay (2018) have conducted research regarding minimum wage,
restaurant tips and poverty. The study was conducted in the US using the March Current Population survey data
over the period 1988-2014. The results indicated that minimum wage can have a significant effect in reducing
poverty. The minimum wage in this case includes the policy of giving tips to restaurant employees. Therefore,
researchers provide recommendations to provide a fair wage policy for workers, especially by increasing their
minimum wage. By increasing the minimum wage, it is hoped that it will increase the workers' revenue and, in turn,
reduce poverty.
The same study was also backed up by Churchill and Sabia (2019). They studied the minimum wage of
immigrants with limited skills and its effect on poverty rates. The study is conducted in the US used data over the
period 1994–2016. The results showed that the minimum wage setting for immigrants from Hispanic backgrounds
helped to reduce poverty, meaning the higher the minimum wage, the lower the poverty rate. The researchers also
found that increases in minimum wage were inconsistent. Policy recommendations, especially for countries that
accept immigrants from abroad, including immigrants with limited skills, need to have a minimum wage setting
policy, because it is proven to reduce poverty among low-skilled workers.
Asian Economic and Financial Review, 2020, 10(10): 1088-1099
1096
© 2020 AESS Publications. All Rights Reserved.
5.3. Real Gross Regional Domestic Product (real GRDP)
The results calculated a probability value of the real GRDP of 0.0000, which indicated that H0 is rejected.
Moreover, the coefficient value of the real GRDP showed a value of -0.193201, meaning the real GRDP had a
negative impact on poverty, and when the real GRDP rises 1 %, poverty will decrease by 0.193201%.
This result is in line with the results of research conducted by Dauda and Makinde (2014); Sehrawat and Giri
(2018) and Michálek and Výbošťok (2019). The results of their study indicated that real GDP had a negative effect
on poverty rates in the countries studied.
Dauda and Makinde (2014) carried out research on poverty alleviation in Nigeria. The study was conducted
using data from 1980–2010. The study used an analysis of vector autoregressive models (VAR) with research
variables including economic growth, financial deepening (M2), and poverty rates. The results showed that
economic growth can reduce poverty in Nigeria. Meanwhile, the M2 variable in the study was found to be
negatively and significantly related to poverty. Sehrawat and Giri (2018) examined research on economic growth,
income inequality and poverty. It was conducted in India from 1970–2015 using the method of autoregressive
distributed lag (ARDL) bounds testing. The results showed that there is a long-term correlation between financial
development, economic growth, inequality and poverty. Moreover, economic growth (measured using real GDP)
had a positive effect on the poverty rate,. Therefore, the recommendation is that a policy that needs to be developed
based on the research to financial development and economic growth because it reduces inequality and poverty.
Meanwhile, Michálek and Výbošťok (2019) conducted research on economic growth, inequality and poverty in
European countries using the growth incidences curve (GIC) method. The results of their study showed that
economic growth (measured using GDP per capita) had a very strong impact on the reduction of poverty, but this
effect was different in each of the countries studied. The findings stated that, during the crisis period, the countries
with a strong economy were more capable of reducing poverty than countries with a weaker economy.
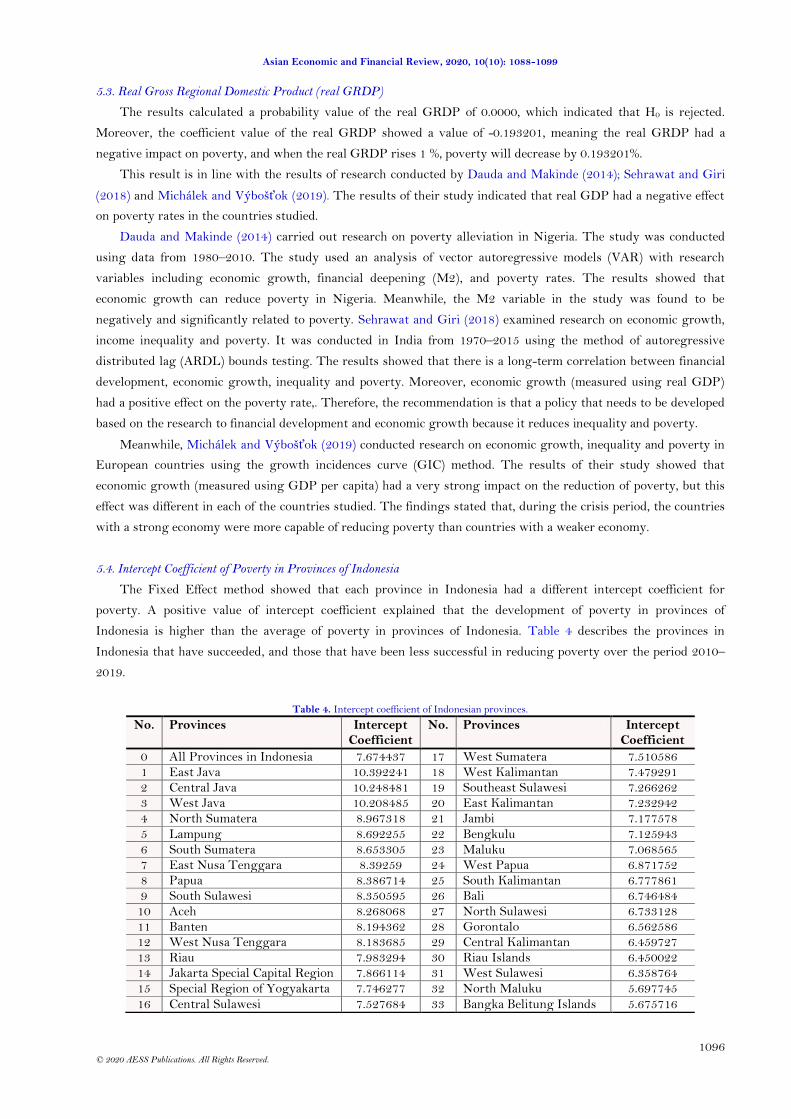
5.4. Intercept Coefficient of Poverty in Provinces of Indonesia
The Fixed Effect method showed that each province in Indonesia had a different intercept coefficient for
poverty. A positive value of intercept coefficient explained that the development of poverty in provinces of
Indonesia is higher than the average of poverty in provinces of Indonesia. Table 4 describes the provinces in
Indonesia that have succeeded, and those that have been less successful in reducing poverty over the period 2010–
2019.
Table 4. Intercept coefficient of Indonesian provinces.
No. Provinces Intercept Coefficient
No. Provinces Intercept Coefficient
0 All Provinces in Indonesia 7.674437 17 West Sumatera 7.510586 1 East Java 10.392241 18 West Kalimantan 7.479291 2 Central Java 10.248481 19 Southeast Sulawesi 7.266262 3 West Java 10.208485 20 East Kalimantan 7.232942 4 North Sumatera 8.967318 21 Jambi 7.177578
5 Lampung 8.692255 22 Bengkulu 7.125943 6 South Sumatera 8.653305 23 Maluku 7.068565 7 East Nusa Tenggara 8.39259 24 West Papua 6.871752 8 Papua 8.386714 25 South Kalimantan 6.777861 9 South Sulawesi 8.350595 26 Bali 6.746484
10 Aceh 8.268068 27 North Sulawesi 6.733128 11 Banten 8.194362 28 Gorontalo 6.562586 12 West Nusa Tenggara 8.183685 29 Central Kalimantan 6.459727 13 Riau 7.983294 30 Riau Islands 6.450022 14 Jakarta Special Capital Region 7.866114 31 West Sulawesi 6.358764 15 Special Region of Yogyakarta 7.746277 32 North Maluku 5.697745
16 Central Sulawesi 7.527684 33 Bangka Belitung Islands 5.675716

Asian Economic and Financial Review, 2020, 10(10): 1088-1099
1097
© 2020 AESS Publications. All Rights Reserved.
The provinces of East Java, Central Java and West Java are less successful in reducing poverty in Indonesia.
This is indicated by a large value of intercept coefficient. Whereas West Sulawesi, North Maluku and Bangka
Belitung Islands have succeeded in reducing poverty in their regions through reducing the number of programs
aimed at getting people out of poverty. The government work scheme was developed in accordance with the
Millennium Development Goals (MDG) program, which ended in 2015. Subsequently, the Sustainable
Development Goals (SDG) program began in 2015 and will continue until 2030.
6. CONCLUSION, IMPLICATIONS, AND RESEARCH LIMITATION
The results showed that, in particular, unemployment has a significant negative effect on poverty, while the
real GRDP had a significant positive effect on poverty in the provinces of Indonesia. Collaboratively, the variables
of unemployment, wages, and the real GRDP also had a significant effect on poverty in the provinces of Indonesia.
Seeing the result of this study, unemployment had a negative impact on poverty in provinces of Indonesia. It
indicated that the government needs to reduce unemployment. Implementing a policy on expanding employment
opportunities, followed by higher labor absorption, will have an impact in reducing unemployment.
The results of this study also prove that the minimum wage has no impact on poverty in the Indonesian
province. Wages will only affect workers in larger established companies or industries. Poor people in Indonesia
mostly depend on income from daily work, not earning a wage. This means that if workers' wages are raised, it will
not affect the income of the poor.
It is necessary for the government to provide wider employment opportunities for day-to-day workers so that
they earn sufficient income to get off the poverty line. The government must continue to evaluate and improve the
welfare of workers through increased wages for employees in companies or industries and therefore
increasingpeople’s discretionary income in order to improve the Indonesian economy. In setting an increased
minimum wage policy, in addition to the government calculating the cost of living for workers, it must also
consider a company's ability to pay workers' wages, as some companies may not be able to afford to increase wages.
If labor productivity is still low and demand for higher wages continues to increase, it will certainly become an issue
for employers.
Real GRDP is the dominant factor in reducing poverty in Indonesia. Therefore, it is necessary to increase the
real GRDP urgently so that poverty in Indonesia can be significantly reduced. Increasing worker productivity is
essential to increase the real GRDP in each province in Indonesia. If the real GRDP can be raised significantly it
will create a better investment climate, which will open up wider employment opportunities, increase welfare and
reduce poverty in Indonesia's provinces. Likewise, by increasing national income we create factors such as
consumption, export and investment.
The limitation of this study is that the research was only conducted on 33 provinces in Indonesia over 10 years.
The next study can be conducted on 34 provinces with a longer research time, so that a more complete study can be
completed. In addition, the research can add other independent variables that affect poverty, such as inflation and
climate change, so that it is more comprehensive.
Funding: Funding assistance is provided by Universitas Islam Indonesia to increase the productivity, and also supports the processing and publication fee of this scientific paper. Competing Interests: The authors declare that they have no competing interests. Acknowledgement: The authors would like to thank Universitas Islam Indonesia for providing financial and motivational support and assistance in the completion of this research.
REFERENCES
Adejimi, S., & Ogunode, P. (2015). Implications of poverty and youth unemployment on Nigeria economy. Journal of Asia
Entrepreneurship and Sustainability, 11(3), 1-27.

Asian Economic and Financial Review, 2020, 10(10): 1088-1099
1098
© 2020 AESS Publications. All Rights Reserved.
Adelowokan, O. A., Maku, O. E., Babasanya, A. O., & Adesoye, A. B. (2019). Unemployment, poverty and economic growth in
Nigeria. Journal of Economics & Management, 35, 5-17. Available at: https://doi.org/10.22367/jem.2019.35.01
Akinmulegun, S. (2014). Unemployment and poverty paradigm in Nigeria: Challenges and prospect. International Journal of
Management and Administrative Sciences (IJMAS), 2(3), 16-23.
Atkinson, A. B., Leventi, C., Nolan, B., Sutherland, H., & Tasseva, I. (2017). Reducing poverty and inequality through tax-benefit
reform and the minimum wage: the UK as a case-study. The Journal of Economic Inequality, 15(4), 303-323. Available at:
https://doi.org/10.1007/s10888-017-9365-7
Ayala, L., Cantó, O., & Rodríguez, J. G. (2016). Poverty and the business cycle: A regional panel data analysis for Spain using
alternative measures of unemployment. The Journal of Economic Inequality, 15(1), 47-73.
Berardi, N., & Marzo, F. (2015). The elasticity of poverty with respect to sectoral growth in Africa. The Review of Income and
Wealth, 63(1), 1-31. Available at: https://doi.org/10.1111/roiw.12203.
Bolwell, D. (2016). To the lighthouse towards a global minimum wage: Building on the international poverty line. Australian
Bulletin of Labour, 42(1), 1-37.
Campolieti, M., Gunderson, M., & Lee, B. (2012). The (non) impact of minimum wages on poverty: Regression and simulation
evidence for canada. Journal of Labor Research, 33(3), 287-302. Available at: https://doi.org/10.1007/s12122-012-9139-
8.
Churchill, B. F., & Sabia, J. J. (2019). The effects of minimum wages on low skilled immigrants’ Wages, employment, and
poverty. Industrial Relations: A Journal of Economy and Society, 58(2), 275-314. Available at:
https://doi.org/10.1111/irel.12232.
Dauda, R. O. S., & Makinde, K. O. (2014). Financial sector development and poverty reduction in nigeria: A vector
autoregressive analysis (1980-2010). Asian Economic and Financial Review, 4(8), 1040-1061.
Feriyanto, N. (2019). The effect of the quality of human development factors on the rate of economic growth in yogyakarta
special province. International Journal for Quality Reserach, 13(1), 157-176. Available at:
http://doi.org/10.24874/IJQR13.01-10.
FitzRoy, F., & Jin, J. (2017). Basic income and a public job offer: Complementary policies to reduce poverty and unemployment.
IZA Policy Paper No. 133, September. (1-28. Retrieved from: http://ftp.iza.org/pp133.pdf).
Kiaušienė, I. (2015). Comparative assessment of women unemployment and poverty in European Union. Intellectual Economy,
9(2), 91-101.
Konkel, R. (2014). The monetization of global poverty: The concept of poverty in World Bank history, 1944–90. Journal of
Global History, 9(2), 276-300. Available at: https://doi.org/10.1017/S1740022814000072.
Kuada, J. (2014). Economic growth and poverty alleviation in Africa – Linking hard and soft economics. African Journal of
Economic and Management Studie, 5(1), 2–8. Available at: https://doi.org/10.1108/AJEMS-03-2014-0016.
Kware, A. A. (2015). Unemployment, income inequality and poverty: The hallmarks of the Africas Largest and strongest
economy; Nigeria. Asian Economic and Financial Review, 5(11), 1239-1250.
Michálek, A., & Výbošťok, J. (2019). Economic growth, inequality and poverty in the EU. Social Indicators Research, 141(2), 611-
630. Available at: https://doi.org/10.1007/s11205-018-1858-7.
Nyasha, S., Gwenhure, Y., & Odhiambo, N. M. (2017). Poverty and economic growth in Ethiopia: A multivariate causal linkage.
The Journal of Developing Areas, 51(1), 343-359.
Quinn, J. F., & Cahill, K. E. (2017). The relative effectiveness of the minimum wage and the earned income tax credit as anti -
poverty tools. Religions, 8(4), 1-17. Available at: https://doi.org/10.3390/rel8040069.
Sabia, J. J., & Nielsen, R. B. (2015). Minimum wages, poverty, and material hardship: New evidence from the SIPP. Review of
Economics of the Household, 13(1), 95-134. Available at: https://doi.org/10.1007/s11150-012-9171-8
Sabia, J. J., Burkhauser, R. V., & Mackay, T. (2018). Minimum cash wages, tipped restaurant workers, and poverty. Industrial
Relations: A Journal of Economy and Society, 57(4), 637-670. Available at: https://doi.org/10.1111/irel.12215.

Asian Economic and Financial Review, 2020, 10(10): 1088-1099
1099
© 2020 AESS Publications. All Rights Reserved.
Sasmal, R., & Sasmal, J. (2016). Public expenditure, economic growth and poverty alleviation. International Journal of Social
Economics, 43(6), 604–618. Available at: https://doi.org/10.1108/IJSE-08-2014-0161.
Sehrawat, M., & Giri, A. (2018). The impact of financial development, economic growth, income inequality on poverty: Evidence
from India. Empirical Economics, 55(4), 1585-1602. Available at: https://doi.org/10.1007/s00181-017-1321-7
Shitile, T. S., & Abubakar, S. (2019). Reassessing the efficacy of foreign aid and grants in poverty reduction in Nigeria. Asian
Economic and Financial Review, 9(4), 450-960. Available at: http://www.aessweb.com/journals/April2019/5002/4547
Sosnaud, B. (2016). Living wage ordinances and wages, poverty, and unemployment in US cities. Social Service Review, 90(1), 3-
34. Available at: https://doi.org/10.1086/686581.
Zaman, K., Khilji, B. A., Awan, U., Ali, G., & Naseem, I. (2014). Measuring pro-poor sectoral analysis for Pakistan: Trickle
down? Economic Research, 27(1), 713-728. Available at: https://doi.org/10.1080/1331677X.2014.975519
Views and opinions expressed in this article are the views and opinions of the author(s), Asian Economic and Financial Review shall not be responsible or answerable for any loss, damage or liability etc. caused in relation to/arising out of the use of the content.