
Health and Environmental Risks of the Maquiladora in Mexicali

THE IMPACT OF THE MAQUILADORA INDUSTRY ON U.S. BORDER CITIES
JESÚS CAÑAS
ROBERTO A. CORONADO ROBERT W. GILMER EDUARDO SAUCEDO
RESEARCH DEPARTMENT
WORKING PAPER 1107
Federal Reserve Bank of Dallas

The Impact of the Maquiladora Industry on U.S. Border Cities∗
Jesús Cañas Roberto Coronado Federal Reserve Bank of Dallas Federal Reserve Bank of Dallas, El Paso 2200 N. Pearl St. 301 E. Main St. Dallas, TX 75201 El Paso, TX 79901 (214) 922-5221 (915) 521-5235 [email protected] [email protected] Robert W. Gilmer Eduardo Saucedo Federal Reserve Bank of Dallas, El Paso New Mexico State University 301 E. Main St. 1320 E. University Ave. El Paso, TX 79901 Las Cruces, NM 88003-8001 (915) 521-5288 (575) 621-5949 [email protected] [email protected]
May 17, 2011 Abstract: For decades, the maquiladora industry has been a major economic engine along the U.S.-Mexico border. Since the 1970s, researchers have analyzed how the maquiladora industry affects cities along both sides of the border. Gordon Hanson (2001) produced the first comprehensive study on the impact of the maquiladoras on U.S. border cities, considering the impact of these in-bond plants on both employment and wages. His estimates became useful rules of thumb for the entire U.S.-Mexico border. These estimates have become dated, as Hanson’s study covered the period from 1975 to 1997. The purpose of this paper is to update Hanson’s results using data from 1990 to 2006, and to extend the estimates to specific border cities. For the border region as a whole, we find that the impact of a 10 percent increase in maquiladora production leads to a 0.5 to 0.9 percent change in employment. However, we also find that the border average is quite misleading, with large differences among individual border cities. Cities along the Texas-Mexico border benefit the most from growing maquiladora production. We also estimate the cross-border maquiladora impacts before and after 2001 when border security begins to rise, the maquiladora industry entered a severe recession and extensive restructuring and global low-wage competition intensified as China joined the World Trade Organization. Empirical results indicate that U.S. border cities are less responsive to growth in maquiladora production from 2001-2006 than in the earlier period; however, when looking into specific-sectors we find that U.S. border city-employment in service-sectors are far more responsive post-2001. JEL Classification: F15, F16, O54, R11. Keywords: maquiladoras, off-shoring, U.S.-Mexico integration, cross-border impacts.
∗ We thank participants at the 2010 Federal Reserve System Committee on Regional Economic Analysis meetings for comments and suggestions, in particular Stephan Whitaker. We are also grateful to participants at the 2010 Association for Borderlands Studies Annual Meetings and seminar participants at the University of Texas at Pan American for comments and suggestions. Coronado is the contact author. The views expressed here are those of the authors and do not necessarily reflect those of the Federal Reserve Bank of Dallas or the Federal Reserve System.

2
1. Introduction
Cross-border trade is a major economic engine along the U.S.-Mexico border region. The
two big industries that drive cross-border trade between the U.S. and Mexico are the Mexican
maquiladora industry and retailing. In this sense, the maquiladora industry has been the primary
driver of cross-border trade along the U.S.-Mexico border region for decades. Even though
recessions and low-wage competition have changed the behavior of the industry in recent years,
maquiladoras continue to shape regional trade along the U.S.-Mexico border.
There are two key dates that mark recent economic history on the U.S.-Mexico border. First
was the 1993 passage of the North America Free Trade Agreement (NAFTA), an event that
brought great optimism about the future of all the borderlands. Border cities moved from a
peripheral role at edge of the U.S. economy to a central location in a new and larger North
American market. Then came 2001 and the terror attacks in New York, followed by sustained
increases in border security requirements. Increased inspection and documentation, even
physical barriers, slowed the movement of goods and people across the border, and slowly wore
down the prior optimism about economic integration with our Mexican and Canadian neighbors.
In addition, global low-wage competition intensified around 2001 when China jointed the World
Trade Organization (WTO). Together these events resulted in a significant restructuring of the
maquiladora industry early last decade.
NAFTA worked in North America much like other trade and customs areas that brought
widespread regional benefit; it forced efficiencies that take advantage of intra-industry trade and
scale economies; and overall GDP and employment of each member country has grown slightly
faster as a result of the agreement.1 It remains a powerful force promoting increased efficiency
and integration in North America.
As a result of the increased economic integration experienced along the U.S.-Mexico border
region, there has been a growing body of research that explores the effect of growth in a Mexican
border city on its U.S. counterpart. Hanson (2001) produced the first comprehensive study of
how maquiladora growth affects U.S. border cities. He estimated that a 10 percent increase in
maquiladora production in Mexican border cities leads to a 1.1 to 2.0 percent increase in
employment in the neighboring cities on the U.S. side of the border. He also provided estimates
of the resulting U.S. employment growth by sector: 2.1 to 2.7 percent in wholesale trade, 1.7 to 1 For more details see Hufbaur and Schott (2003) and Rosson, Runge, and Moulton.

3
2.7 percent in transportation, 1.2 to 2.1 percent in manufacturing, and 1.0 to 1.8 percent in retail
trade. His estimates were not specific to any city but provided estimates for the entire U.S.-
Mexico border. Further, these estimates have become dated, as Hanson’s study covered the
period from 1975 to 1997.
The purpose of this paper is to reproduce Hanson’s seminal empirical work using quarterly
data from 1990 to 2006. Additionally, we provide estimates for individual border cities, which
turn out to be quite heterogeneous. Thus, we look at progress in economic integration over time
and across border-city pairs. Furthermore, since our dataset covers a significant period after
2001, we are able to estimate differential impacts from increased border security, China’s
entrance to WTO, and new tax regulations for the maquiladora industry.2
For the border region as a whole and for the 1990-2006 period, we find that a 10 percent
increase in maquiladora production is associated with a 0.5 to 0.9 percent rise in U.S. jobs, a
smaller increase than Hanson’s original estimate of 1.1 to 2.0 percent. However, we also find
that the border average is quite misleading, with big differences emerging as we move along the
border. In particular, the benefit to California and Arizona cities is small or negative, while the
Texas border cities often exceed the average by a wide margin. In addition, we find that post-
2001 the U.S. border cities are less responsive to growth in maquiladora production; however,
when looking into specific-sectors we find that U.S. border city-employment in service-sectors
are far more responsive post-2001.
This paper is organized as follows. Section 2 summarizes previous research, while section 3
describes the dataset employed. Section 4 provides methodology, and empirical results are
reported in Section 5. Section 6 provides some concluding remarks.
2. Previous studies
The Border Industrialization Program, enacted in 1965 by the Mexican government, gave
birth to the maquiladora industry. Its principal objective was to reduce high unemployment rates
in communities along the border following the abolition of the Bracero farm labor program by
the U.S. (Ayer and Layton, 1974). Manufacturers were encouraged to locate through duty-free
import of machinery or raw and semi-finished materials. Low Mexican wages and low
transportation costs added to the attractiveness of Mexico. As conceived, a maquiladora is an
2 Canas, Coronado, and Gilmer (2004) find empirical evidence that these events resulted in a structural break for the Mexican maquiladora industry.

4
industrial plant that assembles imported components into products for export, mostly to the U.S.
Duty is paid only on the value-added in the assembly process on the re-entry to the U.S. It may
be owned by foreign or domestic entities and the concept has evolved to cover activities as
diverse as coupon processing, engineering and testing, and auto assembly. Maquiladoras have
not only become an increasingly significant component of the Mexican economy, they are also
an important part of U.S. corporate strategy in producing competitively priced goods and
services in the world marketplace.
Studying border metropolitan areas presents challenges because they are influenced by
regional, national, and international business cycles (Fullerton, 1998). Since the 1970s,
researchers have analyzed how maquiladora industry growth affects cities along both sides of the
border. In addition, most of the papers estimate the cross-border maquiladora impacts at a
specific point in time or for a single pair of border cities. The maquiladora industry has played a
key role in the economic development throughout the U.S.-Mexico border region during the past
two decades (Cañas and Gilmer, 2009; Cañas, Coronado and Gilmer, 2007; Cañas, Coronado
and Gilmer, 2005b; Gilmer and Cañas, 2005).
Recent in-bond industry research efforts have covered numerous topics, including regional
integration (Hanson, 2001) and industrial development (Mendoza Cota, 2002). Results in those
studies point to a variety of channels for regional growth associated with regional agglomeration
effects. Gruben and Kiser (2001) conclude that international wage ratios and the growth rate of
U.S. industrial production remain the most important causal factors behind maquiladora
expansion.
Several studies have addressed the maquiladora industry’s impact on retail trade activity in
U.S. border cities. Holden (1984) estimates that a 10 percent increase in maquiladora
employment translates into a 23 percent increase in retail sales in Brownsville, a 13 percent
increase in Laredo, an 11 percent increase in El Paso and a 7 percent increase in McAllen.
Ladman and Poulsen (1972) found that in Agua Prieta, Sonora, maquiladora workers spent 40
percent of their wages in Arizona. Phillips and Coronado (2007) find that half of the retail trade
in Laredo can be attributable to Mexican shoppers while for McAllen it is one-third, for
Brownsville one-fourth, and for El Paso 11 percent.
Aggregate employment effects have also been examined in cross-border contexts for
maquiladoras (Fullerton, 2001; Gruben, 1990; Silvers and Pavlakovich, 1994). In an early effort,
5
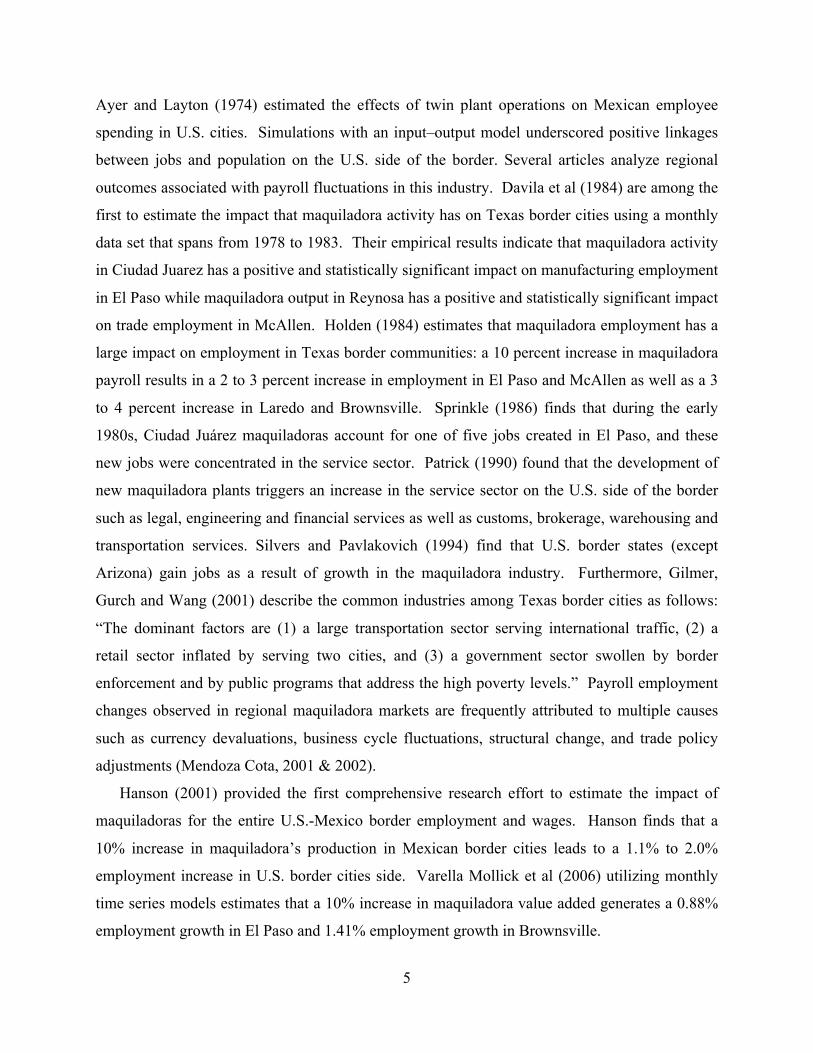
Ayer and Layton (1974) estimated the effects of twin plant operations on Mexican employee
spending in U.S. cities. Simulations with an input–output model underscored positive linkages
between jobs and population on the U.S. side of the border. Several articles analyze regional
outcomes associated with payroll fluctuations in this industry. Davila et al (1984) are among the
first to estimate the impact that maquiladora activity has on Texas border cities using a monthly
data set that spans from 1978 to 1983. Their empirical results indicate that maquiladora activity
in Ciudad Juarez has a positive and statistically significant impact on manufacturing employment
in El Paso while maquiladora output in Reynosa has a positive and statistically significant impact
on trade employment in McAllen. Holden (1984) estimates that maquiladora employment has a
large impact on employment in Texas border communities: a 10 percent increase in maquiladora
payroll results in a 2 to 3 percent increase in employment in El Paso and McAllen as well as a 3
to 4 percent increase in Laredo and Brownsville. Sprinkle (1986) finds that during the early
1980s, Ciudad Juárez maquiladoras account for one of five jobs created in El Paso, and these
new jobs were concentrated in the service sector. Patrick (1990) found that the development of
new maquiladora plants triggers an increase in the service sector on the U.S. side of the border
such as legal, engineering and financial services as well as customs, brokerage, warehousing and
transportation services. Silvers and Pavlakovich (1994) find that U.S. border states (except
Arizona) gain jobs as a result of growth in the maquiladora industry. Furthermore, Gilmer,
Gurch and Wang (2001) describe the common industries among Texas border cities as follows:
“The dominant factors are (1) a large transportation sector serving international traffic, (2) a
retail sector inflated by serving two cities, and (3) a government sector swollen by border
enforcement and by public programs that address the high poverty levels.” Payroll employment
changes observed in regional maquiladora markets are frequently attributed to multiple causes
such as currency devaluations, business cycle fluctuations, structural change, and trade policy
adjustments (Mendoza Cota, 2001 & 2002).
Hanson (2001) provided the first comprehensive research effort to estimate the impact of
maquiladoras for the entire U.S.-Mexico border employment and wages. Hanson finds that a
10% increase in maquiladora’s production in Mexican border cities leads to a 1.1% to 2.0%
employment increase in U.S. border cities side. Varella Mollick et al (2006) utilizing monthly
time series models estimates that a 10% increase in maquiladora value added generates a 0.88%
employment growth in El Paso and 1.41% employment growth in Brownsville.

6
3. Data
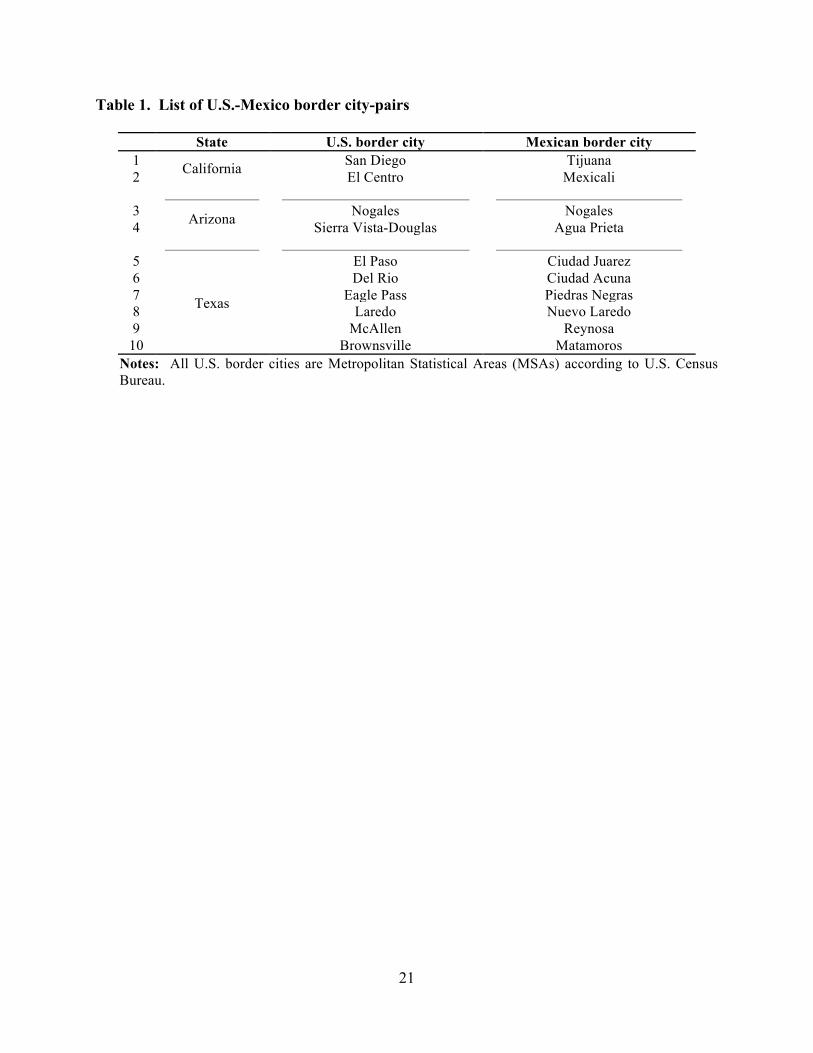
Table 1 shows the ten border city-pairs we include in the analysis.3 There are two border
city-pairs in both California and Arizona and six in Texas. We employ a quarterly dataset that
spans from 1990:Q1 to 2006:Q4. All variables were calculated following Hanson’s original
methodology as closely as possible. However, there are small deviations forced by using a
quarterly (rather than annual) dataset.4 For instance, employment data is available monthly, so it
was necessary to transform into quarterly data. In the case of city-industry wages and alternative
wages, it was necessary to work first with data that is available quarterly and then divided it by
13 in order to get weekly wage data. For both wage definitions, we excluded the city wage on
which the observation was taken in order to avoid simultaneity.
State personal income captures local demand for goods and services. Similar to the treatment
of city level wages, we excluded the local personal income from the state personal income to
avoid simultaneity. National employment by sector was included in the model because it is an
indicator of the national industry labor demand shocks. Furthermore, to avoid simultaneity
issues, we exclude industry employment for the state where the observation is taken. The
maquiladora value added in Mexican neighboring cities measures the foreign demand for city
industry output. The export activity is measured as the value added in maquiladoras converted
into dollars and deflated by the U.S. PPI.
We include eight sectors: construction, manufacturing, wholesale trade, retail trade,
transportation and warehousing, FIRE, and services5. We incorporate one sector not found in
Hanson’s original paper: the construction sector. We included this sector because it is one of the
fastest growing sectors along both sides of the border during the period analyzed.
Table 2 provides summary statistics for average growth rates for the dependent and
independent variables we use in the analysis presented here. For comparison purposes, we
include summary statistics reported by Hanson (2001) in his original paper. While employment
growth along U.S. border cities remained unchanged over the two sample periods, wage growth 3 We use the same ten border city‐pairs as in Hanson (2001). 4 More details on the data are provided in the appendix. 5 In order to calculate FIRE sector the following sectors were included finance and insurance plus real state and rental and leasing. Similarly, the service sector includes: information, professional-scientific-technological services, management of companies and enterprises, administrative and support and waste management and remediation services, educational services, health care and social assistance, arts entertainment and recreation, accommodation and food services and other services except public administration. We calculate weighted averages for FIRE and services sectors.

7
increased at a steady pace during our sample period while they declined during Hanson’s original
sample span. Aligned to border city wages, alternative wage growth became stronger. Growth
in state personal income continues to be moderate at around 4 percent under both time frames.
Growth in national employment shows a contraction in our sample period, likely the result of the
2001 U.S. recession. Even though maquiladora output growth continues to be strong in our
sample period, it decelerated from Hanson’s time frame. Overall, Table 2 shows that growth
rates in the variables we use do not change significantly from Hanson’s seminal work.
Table 3 shows employment growth rates by sector for the period 1990-2006 for the U.S.,
border states, and border cities. There are some interesting highlights that deserve attention.
First, Texas border cities often exhibit higher employment growth rates across sectors compared
to border cities in other states. Second, transportation and services sectors are typically the
fastest growing sectors. Third, manufacturing is the only sector that shows contraction in
payrolls across most states and border cities. The monotonic decline in manufacturing
employment in the U.S. is not something new. According to Strauss (2010), this trend has been
in place over the past 60 years, with U.S. manufacturing employment declining at an average of -
0.1 per year. Over the years, many manufacturing operations have shifted from the Midwest to
the U.S./Mexico border. However, as tougher global low-wage competition was faced by
Mexico and other developing countries, mostly from Asia, many of these manufacturing plants
have left the U.S. border. This is corroborated by the negative growth rates in manufacturing
employment shown in Table 3. This is not a surprise, as Blazquez-Lidoy et al (2006), for
example, find that among Latin American exports, Mexican exports are mostly manufacturing
products that compete directly with Chinese manufacturing exports. Dussel Peters (2005)
corroborates this by showing that the top 10 Mexican exports to the U.S. represent 84% of its
total exports while Chinese manufacturing exports to the U.S. account for 53% of China’s total
exports.
Table 4 shows average annual growth rates both in employment and output for Mexican
maquiladoras during the period 1990-2006. On average, in-bond manufacturing employment
grew by 5 percent while output expanded at a much faster 16 percent. The highest growth rate in
employment and value added is in the Mexican border city of Reynosa followed by northwest
Mexican cities of Tijuana and Mexicali which both share the border with California. It is
worthwhile to note that while these Mexican border cities showed significant expansion in both

8
employment and output, some of the U.S. border cities experienced significant contraction in
manufacturing employment as shown in Table 3.
The maquiladora industry is a dominant force in shaping the number and quality of jobs in
formal employment all along the Mexican side of the border. For U.S. border cities, however, the
resilience and growth of production is unequivocal good news. The ability of the Mexican
maquiladora industry to drive U.S. growth depends largely on physical output – the number of
boxes packed, transported, inspected at the bridges, recorded with customs, and stored in
warehouses. Low-wage competition has had the effect of forcing Mexican factory production up
the ladder in terms of productivity and skills, and the maquiladora remains a formidable engine
for goods production (Cañas et al 2011).
4. Methodology
The methodology used in this paper reproduces Hanson’s labor demand equations for both
wages and employment as closely as possible, with a variety of similar statistical specifications.
Following Hanson (2001), we estimate reduced-form regression equations derived from the
equilibrium between labor demand and labor supply in a U.S. border city i, for sector or industry
j, at time t as follows:
ln 𝐿!"# = 𝛾 ln𝑊!"#! + 𝑋!"#𝛼 + 𝛽! lnEXP!" + 𝛽! lnOEXP!" + 𝜂!"# (1)
ln𝑊!"# = 𝜆 ln𝑊!"#! + 𝑋!"#𝜙 + 𝛳! lnEXP!" + 𝛳! lnOEXP!" + 𝜇!"# (2)
In equations (1) and (2), we estimate regressions that have as the dependent variable U.S.
border city-sector employment, 𝐿!"#, or U.S. border city-sector wage, 𝑊!"#. The regressors
include the alternative wage, 𝑊!"#! ; state personal income and national employment comprised in
the matrix 𝑋!"#; and the maquiladora value added or export production in the neighboring
Mexican city across the border, EXP!"#. In some specifications, we also include Mexican export
production in all other border cities, OEXP!"#. Furthermore, α and ϕ are vectors of parameters
and γ, 𝛽!, 𝛽!, 𝛳!, 𝛳! are scalar parameters. The error terms 𝜂!"#, and 𝜇!"# are assumed to take the
following form:
𝜂!"# = 𝜏! + 𝜔!" + 𝜉!"# (3)

9
𝜇!"# = 𝜅! + 𝜄!" + 𝜓!"# (4)
Furthermore, the error terms are composed of three components. The first term is a year
fixed effect which is constant along border cities, but varies through time, 𝜏! and 𝜅!. The second
term is a city-industry fixed effect, 𝜔!" and 𝜄!". The last component varies by city, industry and
time, but is assumed to be i.i.d. distributed with zero mean and constant variance, 𝜉!"# and 𝜓!"#.
As Hanson (2001) indicates, these error terms are weighted sums of the error terms that come
from the original supply and labor demand.
The method of estimation for equations (1) and (2) depends on the source of the error
terms, 𝜂!"# and 𝜇!"#. Hanson (2001) argues that there are three main sources of error in the
estimation of equations (1) and (2).6 The first source of error is unobserved city-industry or
time-specific factors that affect labor demand and supply. Specifically, there might be observed
or unobserved fixed effects that should be eliminated in order to get unbiased estimators in
equations (1) and (2). The presence of observed fixed effects, for example, through regional
factors could be shifting the labor demand in a specific city but not creating any effect in the
labor demand of other border cities. For instance, the existence of a major highway that passes
through one border city may cause labor demand in that border city to be relatively high in all
time periods. Additionally, there are unobserved fixed effects which could also be affecting the
parameters estimation. To control for such idiosyncratic factors, a fixed-effects approach is
taken when estimating equations (1) and (2). The solution to fixed effects is to time difference
the data or include dummy variables for the year and city-industry in the estimation. The latter is
the approach we take in here.
The second estimation issue, perhaps the most severe econometric problem to tackle
when estimating equations (1) and (2), is the potential presence of endogeneity. In particular,
6 In the paper, we only report estimation results taking into consideration the two main sources of error: idiosyncratic factors and endogeneity. The third source of error is that maquiladora export output, EXP!"#, may be an imperfect measure for the foreign demand for output produced or provided by the U.S. border city. Hanson (2001) argues that maquiladora plants place input orders to companies in the neighboring U.S. border cities for a given year based on expected output, which might be imperfectly correlated to actual output. In other words, EXP!"# is likely to exhibit classical measurement error, resulting in a downward bias coefficient estimates. Hanson (2001) uses a five-year time differences of the data to reduce the effects of measurement error. We follow Hanson’s approach and also estimate regressions using five-year differenced data. Empirical results under the five-year difference regressions are very similar to the ones shown in this paper. For brevity, we do not report these estimates but are available upon request.

10
Hanson (2001) argues that maquiladora export output, EXP!"#, might be an endogenous function
of the other regressors which will result in this explanatory variable, EXP!"#, being correlated
with the error terms 𝜂!"# and 𝜇!"#, which in turn will introduce bias into the parameter estimates.
It might be the case that export plants locate in a particular Mexican border city because of the
characteristics offered by the neighboring U.S. border city. This, in turn, will result in labor
demand and labor supply shocks in the U.S. border city that may affect export production in the
neighboring Mexican border city. For example, the availability of input suppliers located in El
Paso may translate into Juarez being a more attractive city to establish a maquiladora plant.
Given this potential endogeneity in equations (1) and (2), we employ instrumental variables
estimation techniques as a way to alleviate this econometric issue. A desired instrument should
be correlated with maquiladora export output, EXP!"#, and uncorrelated with the error terms, 𝜂!"#
and 𝜇!"#. Following Hanson (2001), the instruments we use are the exogenous independent
variables, lagged values of EXP!"#, and U.S. offshore assembly imports from countries other than
Mexico.
5. Empricial Results
Before reporting our empirical findings, we begin to explore how closely maquiladora export
output growth is related to employment growth on the U.S. side of the border. Figure 1 shows a
simple correlation for the all the ten border-city pairs we study here. This simple graphical
exercise corroborates the strong economic integration that exists between neighboring U.S. and
Mexican border cities. Also, Figure 1 shows that the degree of economic integration is quite
heterogonous along the U.S.-Mexico border region. Phillips and Cañas (2008) show that after
NAFTA the business cycles of Texas, Mexico, the U.S., and the four Texas border cities became
more synchronized. Some border city-pairs such as San Diego-Tijuana, El Paso-Ciudad Juarez,
Laredo-Nuevo Laredo, and McAllen-Reynosa exhibit, at least by simple visual inspection in
Figure 1, an intensification in economic integration after the mid-1990s when NAFTA was
enacted.
Following Hanson’s (2001) footsteps, we estimate equations (1) and (2), for U.S. border
cities following different econometric methodologies including ordinary least squares (OLS) and
instrumental variable (IV). We pooled quarterly observations for employment and wages over
city-industries for the period 1990:Q1-2006:Q4. Regressions include dummy variables to

11
account for time and city-industry fixed effects. Standard errors reported are White-corrected
standard errors to account for the possibility of heteroskedasticity. To account for the possibility
that maquiladora production along Mexican border cities and employment in U.S. border cities
are determined by a common casual factor such as a potential relocation of manufacturing
activity from the Rust Belt in the U.S. into the U.S.-Mexico border area, we include the
maquiladora export production in all other border cities.
Table 5 shows regression results for industry employment in U.S. border cities for the 1990-
2006 period. Our main empirical result suggests that a 10 percent increase in maquiladora export
production in Mexican border cities leads to a 0.5 to 0.9 percent increase in employment in U.S.
neighboring border cities.7 For the most part the other explanatory variables exhibit good
statistical traits: the desired sign and significance level. For instance, coefficient estimates for
alternative wages (wages for workers in the same industry outside the border city but in the same
state) are negative across specifications and statistically significant, consistent with the idea that
wages rising elsewhere will reduce local employment. National employment (national industry-
employment excluding the state in which the city is located) parameter estimates are positive and
highly significant in all cases suggesting that local labor markets along the border are responsive
to U.S. labor market conditions. Coefficient estimates for state personal income (personal
income in the state excluding the personal income for the U.S. border city) have the opposite
sign but are not statistically significant. Furthermore, we estimate regressions under each
methodology including maquiladora output in other Mexican border cities to account for the
possibility that overall maquiladora activity along the border is influenced by a common cause.
Regression results in columns (2) and (4) in Table 5 suggest that overall maquiladora activity
along the border, not just in the adjacent city, influences economic activity in U.S. border cities.
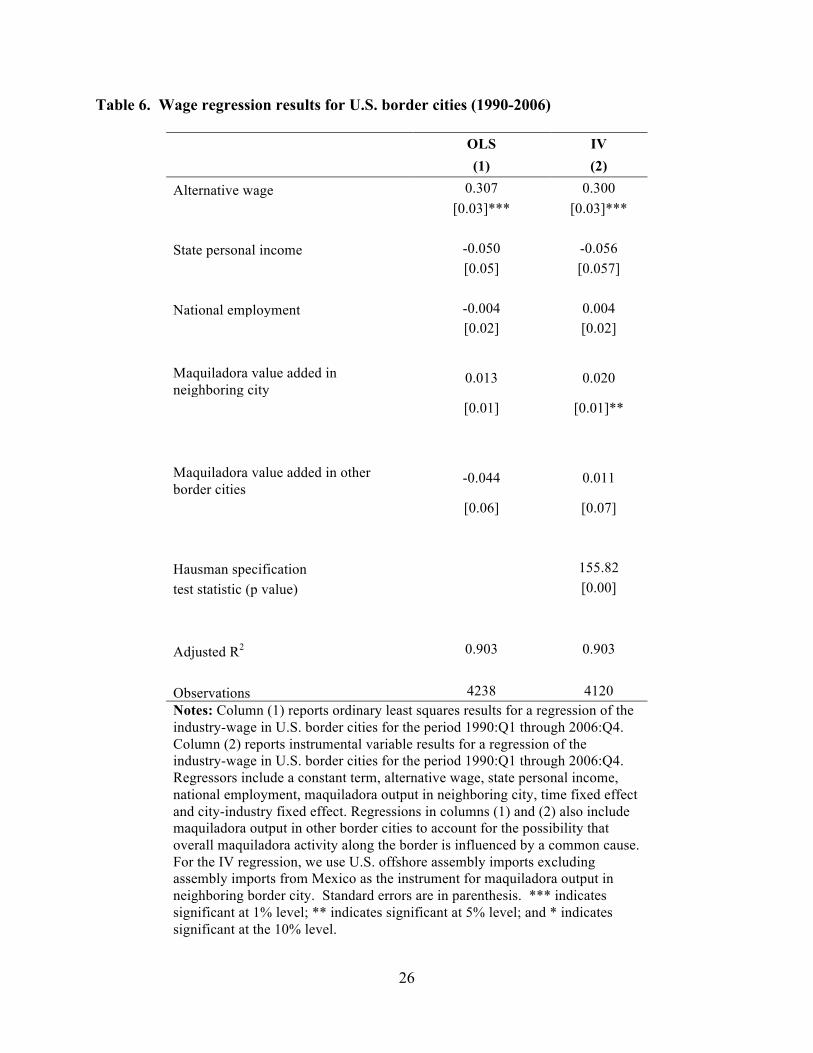
Tables 6 shows estimation results for U.S. border city-industry wages. The methodology
here is quite similar to the one in Table 5. Our empirical results, in Table 6, indicate that a 10
percent increase in maquiladora export production in Mexican border cities lead to an increase
from 0.13 percent to 0.2 percent in wages in neighboring U.S. border cities, although the OLS
estimate is not statistically significant.8 The estimated impact from the maquiladora industry on
7 Hanson estimated that during the period 1975-1997 the elasticities were somewhat stronger: a 10 percent increase in maquiladora production in Mexican border cities leads to a 1.1 to 2.0 percent increase in total employment on neighboring cities on the U.S. side of the border. 8 Hanson original estimates are bigger (from 0.15 percent to 0.3 percent) and statistically significant.

12
wages is smaller than the impact on employment. These results are in line with the accepted
hypothesis that labor supply in border-city labor markets is quite elastic. Thus, as export-
oriented production expands on the Mexican side of the border (raising demand for goods and
services on the neighboring U.S. border city), workers from surrounding areas are drawn into the
region, resulting in minimal impact on local wages. Estimates for the alternative wage are
positive and statistically significant under both estimation techniques. Coefficient estimates for
national employment are negative under the OLS estimation and positive under the IV estimation
but are not statistically significant in either case. Surprisingly, parameters for state personal
income are negative but not significant.
So far we have only looked into the overall impact that maquiladora activity has on
employment and wages in U.S. border cities. Table 7 reports estimation results for U.S. border
city-industry employment disaggregating the maquiladora activity impact by sectors.9 Once we
look into the maquiladora impact on industry-specific employment, we provide evidence that the
maquiladora export output in Mexican border cities has a positive and significant impact on
industry-level employment in the neighboring U.S. border cities. In particular, the sectors that
benefit the most are transportation and warehousing, services, manufacturing, FIRE, and
wholesale trace (coefficients are positive and highly significant across estimation techniques).10
Surprisingly, there is no apparent significant impact of maquiladora production activity on the
construction and retail trade sectors. 11
Given that the empirical results for the entire U.S. border region can be quite misleading if
applied to any specific city, with big differences found as we moved along the border, we further
narrow our analysis at the city level. Our dataset, compared to Hanson, is far more extensive and
therefore allows us to engage in detail city-level regression analysis. Table 8 reports estimated
elasticity coefficients (aggregate impact and by-industry) for individual sectors for the ten U.S.
border cities included in this analysis. These elasticity coefficients corroborate that the impact
9 Similar to Hanson, we also conducted regression analysis for the five largest border cities. These results continue to suggest, similar to those reported in Table 7, that the transportation and warehousing, FIRE, and services sectors continue to be biggest beneficiaries from maquiladora export activity. For brevity such regression results are not included in this paper but are available upon request. 10 We find a significant increase in the impact of the maquiladora activity on the FIRE sector compared to the results as estimated by Hanson. This suggests that this particular sector has become more dependent on maquiladora activity resulting in higher integration along the U.S. and Mexican border region. 11 This last result contradicts previous research that finds that cross-border shopping activity is important for U.S. border cities (see Phillips and Coronado (2007) and Canas, Coronado and Phillips (2006)). However, most of the existing literature concentrates on the impact on retail sales (dollars) rather than the impact on retail employment.

13
that the maquiladora industry has on U.S. border cities varies significantly across border cities
and across sectors. For instance, San Diego, California is negatively impacted, at the aggregate
level and in all sectors, by the maquiladora activity in Mexico. China’s entry into WTO is
probably responsible for this result. A number of Asian companies, many producing consumer
or business related electronics such as copiers, used Tijuana as a production location to avoid
NAFTA content rules. China’s membership in WTO, however, gave it access to the NAFTA
market at much lower tariff rates, low enough to justify shifting component production or
assembly to China.
Certainly, the use of Asian inputs has grown, as documented by Cañas, Coronado, and
Gilmer (2005). In 2000, U.S. inputs represented more than 90 percent of imported maquiladora
inputs, and that share has now contracted to near 50 percent. Most of the loss in share has been
to the benefit of Asian suppliers, with China now providing about ten percent of inputs. Tijuana
is the city most susceptible to Asian substitution, and San Diego suppliers the most likely losers.
Contrast this, for example, to Texas border cities, where nearby maquila production is dominated
by NAFTA-related auto parts and assembly.
U.S border cities along the Arizona border benefit from the maquiladora activity but not to
the same degree than the Texas border cities. Table 8 illustrates that Texas border cities benefit
the most from their economic relationship with Mexico, via the maquiladora industry. For
instance, McAllen is the city that benefits the most from the maquiladora activity across the
border with an overall elasticity of close to 6.6 percent. That is, a 10 percent increase in export
production in Reynosa, Mexico leads to a nearly 7 percent increase in overall nonfarm
employment in McAllen. Eagle Pass with 3.9 percent comes at second place and El Paso with
2.8 percent occupies the third spot. In general, Texas border cities have turned into gate-keepers
on a grand scale, providing legal, customs, logistical, and other services that support maquiladora
activity across the border. The empirical results reported in Table 8 are reasonable in light of
prior expectations and they have good statistical properties.
Looking at specific sectors across each U.S. border city in Table 8, we find that the
manufacturing sector does not respond significantly (most elasticities are either negative or not
statistically significant), perhaps a response to modern supply chains that mandate significant on-
site or just-in-time inventory. These requirements, combined with the uncertainties in crossing
times and new security requirements, have moved many manufacturing product suppliers to

14
Mexico that were once on the U.S. side of the border. The transportation and warehousing sector
carries the largest elasticities followed by wholesale trade and services. Retail trade and FIRE
sectors exhibit mixed results with some elasticities being positive and significant for some border
cities, especially along the Texas border while the other border cities show unresponsiveness to
maquiladora activity.
Is there a structural break after 2000-2001?
The maquiladora industry has encountered booms and busts in recent years, and
competition from low-wage countries around the world has slowly reshaped the maquiladora’s
role in the U.S.-Mexico production sharing scheme. Cañas, Coronado, and Gilmer (2004 &
2007) document that during the 2000-2001 period the maquiladora industry faced some
significant challenges that resulted in the permanent contraction of low value-added industries
such as apparel, footwear, leather, toys while high value-added industries such as electronics and
transportation enjoyed a significant expansion. In addition, Gallagher et al (2008) find that
Mexico’s main non-oil exports have been losing dynamism and over 70% of Mexico’s exports
could be under some sort of “threat” since China’s entry into the WTO.
After 2001, whether we seek to evaluate the continued effects of NAFTA or the new
security standards on the border, we find rapid change driven by a combination of U.S. recession
and increased globalization of manufacturing after China’s entry into WTO. Recession in the
U.S. hurts the industrial base of both the U.S. and Mexico, but the rise of low-wage competition
from China, the Caribbean, Central America, and elsewhere greatly complicated industrial
recovery from the 2001 recession. Mexico, in particular, found its low-wage advantage in North
America under siege by global competitors offering even lower wages. As a result, the Mexican
maquiladora sector saw employment shrink as it lost its lowest-wage, lowest-skill jobs.
Did this structural shift in maquiladora industry mix affect how maquiladora export
production feeds into employment in U.S. border cities? In order to formally test whether there
is a difference in the maquiladora cross-border impacts on U.S. border cities after 2001, we split
the dataset into two periods. The first period corresponds to 1990-2000:Q3 and the second
period corresponds to 2000:Q4-2006.12 We report regression results in Table 9 for all U.S.
12 2000:Q3 marks the beginning of a new era in the maquiladora industry in Mexico. Several factors/events occurred around this date: (1) the U.S. experienced a long-lived contraction in the industrial sector; (2) China joined WTO; (3) the 9/11 terrorists attacks increased border security resulting in new rules/regulations to move goods

15
border city employment under both time periods while in Table 10 we show regression results
with industry-varying parameters for all U.S. border cities again under both time frames.
Estimation results in Table 9 shed some light on our question. For instance, looking at
the first period (pre-2000:Q3) we find that a 10 percent increase in maquiladora output leads to a
1.1 percent to 1.4 percent increase in employment in neighboring U.S. border cities. After
2000:Q4, the maquiladora impact declines to about half of that before 2001. Specifically, we
find that a 10 percent increase in maquiladora export production leads to an increase of 0.3
percent to 0.9 percent in employment in U.S. border cities. Surprisingly, post-2000 estimates are
not statistically significant. In order to formally test whether the change in the estimated
elasticities are significant before- and after-2000, we included a dummy variable taking the value
of zero before 2000:Q3 and one after 2000:Q4. Further, we generate an interaction term by
multiplying such dummy variable times maquiladora export production (EXP!"#). We then look
into the estimated parameters for the interaction term and all coefficients resulted negative and
statistically significant under OLS levels and IV levels regressions. This, in turn, implies that
there is a significant reduction in the cross-border maquiladora impact on employment in U.S.
border cities after 2000:Q3. Several other researchers have also found a structural break in the
U.S.-Mexico trading relationship after China joined WTO (Dussel Peters 2005; Blazquez-Lidoy
et al 2006; Gallagher and Zarsky 2007; and Gallagher et al 2008).
In order to further explore the possible decline after 2000 in cross-border maquiladora
activity impact on specific sectors within U.S. border cities, we incorporate industry-varying
coefficients into the analysis. Table 10 provides regression results for U.S. border city industry-
employment before- and after-2000. Table 10 analyzes the influence on employment in U.S.
border cities by allowing the coefficient on maquiladora value added to vary across industries.
By simple visual inspection the maquiladora cross-border elasticities become larger after 2001
for some industries, especially in transportation and warehousing, wholesale trade and services
sectors. Most coefficients in these particular sectors are larger for the period after 2000 than the
previous period (positive and statistically significant in both sub-samples). On the other hand,
the maquiladora industry impact on manufacturing employment in U.S. border cities contracted
significantly after 2000, and they impact switch from positive and statistically significant (in the
across the U.S.-Mexico border; and (4) the maquiladora industry faced new rules and regulations with respect to income taxes and custom taxes, due to NAFTA Articles 301 and 303.

16
range of 0.6 percent to 0.8 percent) before 2000 to become negative and statistically significant
(in the range of -1.1 percent to -1.6 percent) after 2000. This suggests that over the years
manufacturing activity on the U.S.-Mexico border moved from being complements to
substitutes.
Empirical results shown in Table 10 validate the idea that the maquiladora industry is
now more important for employment growth in services-related sectors in U.S. border cities. We
also conducted formal statistical tests to verify whether there is a significant change in estimated
elasticities from one sample period to the next.13 Furthermore, our empirical results suggest that
today the bulk of the maquiladora impact feeds into U.S. border city employment via
transportation and warehousing, wholesale trade and services sectors.
6. Concluding remarks
In this paper, we examine whether the growth of export manufacturing in Mexican border
cities affects the demand for goods and services produced in U.S. border cities. For the first
time, we are able to compute cross-border elasticities to assess the impact that maquiladora
activity has on U.S. border-city employment not only for the entire U.S.-Mexico border, as well
as consistent estimates for individual border cities and specific industries within each border city.
We find that a 10 percent increase in maquiladora production on the Mexican border city leads to
a 0.5 to 0.9 percent increase in employment on the U.S. side. However, the results are not
homogenous along the U.S.-Mexico border. For instance, employment growth in San Diego,
California is negatively impacted by the nearby Mexican maquiladora activity, while Texas
border cities enjoy large benefits. Furthermore, the employment effects are strongest for
transportation and warehousing, wholesale trade, FIRE and services while effects on
manufacturing are not statistically significant. This last finding is likely due to a transition to
modern supply chains that often require significant on-site or just-in-time inventory. These
requirements, combined with the uncertainties in crossing times and new security requirements
(after 9/11), have moved many suppliers to Mexico that were once on the U.S. side of the border.
13 These formal statistical tests are similar to those in Table 9. We incorporated a dummy variable that takes the value of zero before 2000:Q3 and takes the value of one after 2000:Q3. We then created and interaction term with such dummy variable and maquiladora output (EXPijt). We then look into the estimated parameters for the interaction term and all coefficients for services related sectors resulted positive and statistically significant under OLS levels and IV levels regressions. On the other hand, the estimated parameter for the interaction term for the manufacturing sector resulted negative and statistically significant.
17
We find significant differences before and after 2001, when border security begins to rise and
the maquiladora industry entered a severe recession and extensive restructuring. In order to test
whether there is a difference in the maquiladora cross-border impacts on U.S. border cities after
2001, we split the sample into two periods. We find a significant reduction in the overall cross-
border maquiladora impact into employment in U.S. border cities after 2001. However, when
looking at the effects by border city and by sector, cross-border maquiladora elasticities become
larger after 2001, especially in transportation and warehousing, wholesale trade, and services
sectors. Such findings validate the idea that the maquiladora industry is now more important for
employment growth in services-related sectors in U.S. border cities.

18
References
Ayer, H., and R. Layton (1974). “The Border Industry Program and the Impact of Expenditures on a U.S. Border Community”, Annals of Regional Science, Vol. 8, pp. 105–17. Blazquez-Lidoy Rodriguez, J., and Santiso, J. (2006). “Angel or Devil? China’s trade impact on Lati American Emergin Markets”. Paris: OECD Development Center. Cañas, Jesus, Roberto Coronado, and Robert W. Gilmer (2004). “Maquiladora Downturn: Structural Change or Cyclical Factors?”, International Business and Economics Research Journal, August 2004. Cañas, Jesus, Roberto Coronado, and Robert W. Gilmer (2005a). “Trade, manufacturing put Mexico back on track in 2004”, Houston Business, Federal Reserve Bank of Dallas, March Issue. Cañas, Jesus, Roberto Coronado, and Robert W. Gilmer (2005b). “Texas Border Employment and Maquiladora Growth,” The Face Texas: Jobs, People, Business and Change, Federal Reserve Bank of Dallas, November 2005 Cañas, Jesus, Roberto Coronado, and Robert W. Gilmer (2007). “Maquiladora Recovery: Lessons for the Future”, Southwest Economy, Federal Reserve Bank of Dallas, Issue 2, pp. 3-7. Cañas, Jesus, Roberto Coronado, and Robert W. Gilmer (2011). “Trade Conference Explores U.S.—Mexico ‘Common Bonds’”, Southwest Economy, Federal Reserve Bank of Dallas, Issue 1, pp. 16-19. Cañas, Jesus, Roberto Coronado, and Keith R. Phillips (2006). “Border Benefits from Mexican Shoppers," Southwest Economy, Federal Reserve Bank of Dallas, May/June 2006 Cañas, Jesus, and Robert W. Gilmer (2005). “Industrial Structure and Economic Complementarities in City Pairs on the Texas-Mexico Border, Research Department Working Paper 0503, Federal Reserve Bank of Dallas. Cañas, Jesus, and Robert W. Gilmer (2009). “The Maquiladora’s Changing Geography”, Southwest Economy, Federal Reserve Bank of Dallas, Second Quarter, pp. 10-14. Davila, Alberto E., Ronald H. Schmidt, and Gary M. Ziegler (1984). “Industrial diversification, exchange rate shocks, and the Texas-Mexico border,” Economic Review, Federal Reserve Bank of Dallas. Dussel Peters, E (2005). “Economic opportunities and challenges posed by China for Mexico and Central America” Studies No. 8, DIE: German Development Institute. Fullerton, Thomas M., Jr. (1998). “Cross-Border Business Cycle Impacts on Commercial Electricity Consumption”, Frontera Norte, Vol. 10, pp. 53-66. Fullerton, Thomas M., Jr. (2001). “Currency Movements and International Border Crossings”,

19
International Journal of Public Administration, Vol. 23, pp. 1113-1123. Gallagher, K. P. and Zarsky, L. (2007). “The enclave economy: Foreign investment and sustainable development in Mexico’s Silicon Valley. Cambridge: The MIT Press. Gallagher, Kevin P, Juan Carlos Moreno-Brid, and Roberto Porzecanski (2008). “The Dynamism of Mexican Exports: Lost in (Chinese) Translation?”, World Development, Vol. 36, No.8, pp. 1365-1380. Gilmer, Robert W., Matthew Gurch, and Thomas Wang (2001). “Texas Border Cities: An Income Growth Perspective”, The Border Economy, Federal Reserve Bank of Dallas, pp. 2-5. Gruben, William (1990). “Do Maquiladoras Take American Jobs”, Journal of Borderland Studies, Vol. 5, pp. 31-46. Gruben, William, and Sherry L. Kinser (2001). “NAFTA and Maquiladoras: Is the Growth Connected?”, The Border Economy, Federal Reserve Bank of Dallas, pp. 22-24. Hanson, Gordon (2001). “US-Mexico integration and regional economics: Evidence from border-city pair”, Journal of Urban Economics, Vol. 50, pp. 259-287. Holden, R. J. (1984). “Maquiladoras Along the Texas–Mexico Border: An Econometric Evaluation of Employment and Retail Sales Effect on Four Texas Border SMSAs”, Texas Department of Community Affairs, Regional Economic Development Division. Hufbaur, Gary Clyde and Jeffrey J. Schott (2003). “NAFTA: An Assessment”, Revised Edition (Institute of International Economics: Washington, D.C., 1993), Congressional Budget Office, “The Effects of NAFTA on U.S.-Mexico Trade and GDP.” Ladman, J. R., and M. O. Poulsen (1972). “Economic Impact of the Mexican Border Industrialization Program: Agua Prieta, Sonora”, Arizona State University, Center for Latin American Studies. Mendoza Cota, J.E. (2001). “Determinantes Regionales de la Industria Maquiladora de Exportación en los Estados de la Frontera Norte”, Comercio Exterior, 51, 196-202. Mendoza Cota, J.E. (2002). “Agglomeration Economies and Urban Manufacturing Growth in Northern Border Cities of Mexico”, Economía Mexicana, 11, 163-190. Patrick, J. M. (1990). “The Employment Impact of Maquiladoras Along the U.S. Border, in The Maquiladora Industry: Economic Solution or Problem?”, ed. Khosrow Fatemi, New York: Praeger Publishers, pp. 31–35. Phillips, Keith R., and Jesus Cañas (2008). "Regional business cycle integration along the US-Mexico border," Annals of Regional Science, Vol. 42, Number 1, pp. 153-168.

20
Phillips, Keith R., and Roberto Coronado (2007). “Exported Retail Sales along the Texas-Mexico Border”, Journal of Borderland Studies. Rosson, C. Parr, C. Ford Runge, and Kirby S. Moulton, “Preferential Trade Agreements: Gainers and Losers from Regional Trade Blocs”, Southern Agriculture in a World Economy, North Carolina State University, www.ces.ncsu.edu/depts/agecon/trade. Silvers, A. L., and V. K. Pavlakovich (1994). “Maquila Industry Impacts on the Spatial Redistribution of Employment”, Journal of Borderlands Studies, 9, pp. 47–64. Sprinkle R. (1986). Project Link: An Investigation of Employment Linkages Between Cd. Juárez and El Paso, University of Texas at El Paso. STATA user’s reference manual version 10. (2007). A Stata Press Publication, StataCorp LP, College Station, TX. Strauss, William (2010). “Is U.S. Manufacturing Disappearing?”, Midwest Economy, Federal Reserve Bank of Chicago. Varella Mollick, Andre, Abigail Cortez-Rayas, and Rosa A. Olivas-Moncisvais (2006). “Local labor markets in U.S.-Mexican border cities and the impact of maquiladora production”, Annals of Regional Science, Vol 40, pp. 95-116.
21
Table 1. List of U.S.-Mexico border city-pairs
State U.S. border city Mexican border city 1 California San Diego Tijuana 2 El Centro Mexicali
3 Arizona Nogales Nogales 4 Sierra Vista-Douglas Agua Prieta
5
Texas
El Paso Ciudad Juarez 6 Del Rio Ciudad Acuna 7 Eagle Pass Piedras Negras 8 Laredo Nuevo Laredo 9 McAllen Reynosa
10 Brownsville Matamoros Notes: All U.S. border cities are Metropolitan Statistical Areas (MSAs) according to U.S. Census Bureau.

22
Table 2. Summary statistics, average annual growth rates
1975-1997* 1990-2006
Variable
U.S. Border Cities
U.S. Border Cities
City Employment Mean 2.90 2.97
Std Error 7.88 4.12 # Observations 1320 4254
City Wage Mean -0.23 1.82
Std Error 5.54 5.35 # Observations 1320 4254
Alternative Wage Mean 0.56 2.06
Std Error 3.24 4.32 # Observations 1320 4249
State Personal Income Mean 4.1 3.54
Std Error 2.45 2.22 # Observations 1320 4760
National Employment Mean 2.03 0.44
Std Error 2.19 2.00 # Observations 1320 4760
Maquiladora value added in neighboring cities
Mean 9.87 6.81 Std Error 20.33 14.33
# Observations 220 4760 Notes: For more details on data, see Table in appendix. * as reported in Hanson (2001). Sources: U.S. Bureau of Labor Statistics, U.S. Bureau of Economic Analysis, Instituto Nacional de Estadistica Geografia e Informatica.

23
Table 3. Average annual employment growth in U.S. border cities by one-digit industry, 1990-2006
Region Construction Manufacturing Wholesale Trade Retail Trade Transport Fire Services United States 2.40 -1.45 0.80 0.86 1.79 1.15 2.49
California 1.85 -2.03 0.70 0.64 1.28 0.39 2.12 San Diego 2.43 -1.28 1.84 1.37 1.52 1.35 2.69 El Centro 1.08 2.69 -0.76 2.45 3.26 1.34 3.01
Arizona 6.45 0.27 3.17 3.00 3.72 3.74 4.42 Nogales 3.37 -3.93 1.57 -1.15 -0.30 -0.97 1.82 Douglas (Yuma) 7.30 2.02 0.45 2.81 3.88 1.78 4.08
Texas 3.39 -0.24 1.84 1.42 2.88 2.09 3.39 El Paso 2.35 -3.97 0.11 1.18 5.77 1.36 3.33 Del Rio 2.43 11.49 -0.38 2.03 6.62 3.79 5.43 Eagle Pass 4.12 -6.70 0.59 1.76 5.97 3.69 4.58 Laredo 4.34 0.05 2.12 1.65 5.49 5.61 5.25 McAllen 4.11 -3.05 2.66 2.44 8.04 3.80 7.49 Brownsville 3.92 -2.30 0.45 1.88 5.26 1.17 4.80 Notes: Data for the management of companies and enterprises services sector as part of the service sector was not available for McAllen, Laredo, El Centro, Yuma, Nogales, Del Rio and Eagle Pass. Data for the health care and social assistance services and educational services sectors were not available for El Centro and Eagle Pass. Data for professional, scientific, and technical services sector was not available for Yuma. Data for wholesale trade sector for Eagle Pass was available for only 4 years. Source: U.S. Bureau of Labor Statistics.

24
Table 4. Annual average growth in maquiladora activity in Mexican border cities, 1990-2006
Mexican border city U.S. border city
Average Annual growth in maquiladoras in Mexican neighboring border cities
Employment Value Added Tijuana San Diego, CA 8.03 16.41 Mexicali El Centro, Imperial County, CA 7.49 17.57 Agua Prieta Sierra Vista-Douglas, AZ 3.95 16.25 Nogales Nogales, AZ 4.29 16.34 Ciudad Juarez El Paso, TX 4.72 12.11 Piedras Negras Eagle Pass, TX 2.67 17.28 Ciudad Acuña Del Rio, TX 6.02 16.48 Nuevo Laredo Laredo, TX 2.35 12.85 Reynosa McAllen, TX 10.14 24.09 Matamoros Brownsville, TX 2.83 13.34 Source: Instituto Nacional de Estadistica Geografia e Informatica

25
Table 5. Employment estimation results for U.S. border cities (1990-2006)
OLS IV
(1) (2) (3) (4) Alternative wage -0.316 -0.314 -0.314 -0.312 [.005]*** [.050]*** [0.050]*** [0.050]*** State personal income -0.028 -0.030 -0.062 -0.061 [.01] [.01] [0.10] [0.10] National employment 1.258 1.263 1.248 1.253 [.06]*** [0.06]*** [0.065]*** [0.06]*** Maquiladora value added in neighboring city 0.046 0.075 0.056 0.084 [.01]*** [0.01]*** [0.01]*** [0.01]*** Maquiladora value added in other border cities 0.487 0.477 [0.12]*** [0.13]*** Hausman specification 224.40 245.65 test statistic (p-value) [0.00] [0.00] Adjusted R2 0.991 0.991 0.991 0.991
Observations 4,248 4,238 4,130 4,120 Notes: Columns (1) and (2) report ordinary least squares results for a regression of the industry-employment in U.S. border cities for the period 1990:Q1 through 2006:Q4. Columns (3) and (4) report instrumental variable results for a regression of the industry-employment in U.S. border cities for the period 1990:Q1 through 2006:Q4. Regressors include a constant term, alternative wage, state personal income, national employment, maquiladora output in neighboring city, time fixed effect and city-industry fixed effect. Regressions in columns (2) and (4) also include maquiladora output in other border cities to account for the possibility that overall maquiladora activity along the border is influenced by a common cause. For the IV regressions, we use U.S. offshore assembly imports excluding assembly imports from Mexico as the instrument for maquiladora output in neighboring border city. Standard errors are in parenthesis. *** indicates significant at 1% level; ** indicates significant at 5% level; and * indicates significant at the 10% level.
26
Table 6. Wage regression results for U.S. border cities (1990-2006)
OLS IV
(1) (2) Alternative wage 0.307 0.300 [0.03]*** [0.03]***
State personal income -0.050 -0.056 [0.05] [0.057]
National employment -0.004 0.004 [0.02] [0.02]
Maquiladora value added in neighboring city
0.013 0.020
[0.01] [0.01]**
Maquiladora value added in other border cities
-0.044 0.011
[0.06] [0.07]
Hausman specification
155.82
test statistic (p value)
[0.00]
Adjusted R2 0.903 0.903 Observations 4238 4120 Notes: Column (1) reports ordinary least squares results for a regression of the industry-wage in U.S. border cities for the period 1990:Q1 through 2006:Q4. Column (2) reports instrumental variable results for a regression of the industry-wage in U.S. border cities for the period 1990:Q1 through 2006:Q4. Regressors include a constant term, alternative wage, state personal income, national employment, maquiladora output in neighboring city, time fixed effect and city-industry fixed effect. Regressions in columns (1) and (2) also include maquiladora output in other border cities to account for the possibility that overall maquiladora activity along the border is influenced by a common cause. For the IV regression, we use U.S. offshore assembly imports excluding assembly imports from Mexico as the instrument for maquiladora output in neighboring border city. Standard errors are in parenthesis. *** indicates significant at 1% level; ** indicates significant at 5% level; and * indicates significant at the 10% level.

27
Table 7. Employment regressions for U.S. border cities with industry-varying coefficients, 1990-2006
OLS IV
(1) (2) Alternative wage
-0.087 -0.063 [0.06] [0.06]
State personal income
0.012 -0.017 [0.1] [0.10]
National employment
1.280 1.257 [0.1]*** [0.09]***
Maquiladora value added in other border cities 0.482 0.477 [0.1]*** [0.13]***
Maquiladora value added construction dummy -0.002 0.020 [0.02] [0.02]
Maquiladora value added manufacturing dummy 0.078 0.079 [0.03]** [0.03]**
Maquiladora value added transport dummy 0.349 0.362 [0.02]*** [0.02]***
Maquiladora value added wholesale trade dummy 0.033 0.046 [0.01]** [0.02]**
Maquiladora value added retail trade dummy -0.007 0.003 [0.02] [.020]
Maquiladora value added FIRE dummy 0.063 0.060 [0.02]** [0.02]**
Maquiladora value added services dummy 0.085 0.104 [0.02]*** [0.02]***
F-Statistics on Ho Maquiladora coefficients equal 64.01 48.380 (pvalue) [0.00] [0.00] Adjusted R2 0.992 0.992 Observations 4,238 4,120 Notes: Column (1) reports ordinary least squares results for a regression of the industry-wage in U.S. border cities for the period 1990:Q1 through 2006:Q4. Column (2) reports instrumental variable results for a regression of the industry-wage in U.S. border cities for the period 1990:Q1 through 2006:Q4. Regressors include a constant term, alternative wage, state personal income, national employment, maquiladora output in neighboring city, time fixed effect and city-industry fixed effect. Regressions in columns (1) and (2) also include maquiladora output in other border cities to account for the possibility that overall maquiladora activity along the border is influenced by a common cause. For the IV regression, we use U.S. offshore assembly imports excluding assembly imports from Mexico as the instrument for maquiladora output in neighboring border city. We include industry-specific explanatory variables to disaggregate the impact by industry. These industry-specific variables are generated by an interaction term of the industry-specific dummy variable times the maquiladora value-added in the neighboring border city. Standard errors are in parenthesis. *** indicates significant at 1% level; ** indicates significant at 5% level; and * indicates significant at the 10% level.

28
TABLE 8. Employment regressions for U.S. border cities by sector, 1990-2006
Estimation method:
IV LEVELS San Diego El Centro Nogales
Sierra Vista-
Douglas El Paso Del Rio Eagle Pass Laredo McAllen Brownsville
(1) (2) (3) (4) (5) (6) (7) (8) (9) (10) City Level -3.07*** -1.44* 7.14** -0.08 2.77*** -1.23 3.90* 4.62 6.58*** 2.21
Construction -2.86*** -2.90 10.04*** 3.92*** 0.20 -1.47 0.99 3.19 4.04*** 1.29***
Manufacturing -2.51*** -2.63 7.13*** -2.38*** -1.28 -6.85 1.63 1.02 1.64 0.66
Transportation -4.17*** -1.73 4.62 4.87*** 5.30*** 2.16 11.4*** 7.21*** 6.63*** 4.6***
Wholesale -2.86*** -4.32 10.07*** -1.76*** 0.43 33.92 30.88 1.96 4.01*** 0.84
Retail -3.46*** -3.37 5.17*** -1.44*** 1.31 -6.46 4.06*** 0.66 3.21*** 1.34***
FIRE -3.56*** -3.27 5.02*** -2.02*** 2.12*** -4.34 3.99*** 8.23*** 4.63*** 0.64
Services -3.86*** 148.72 n.a. -2.70*** 1.84*** n.a. n.a. 5.93*** 7.38*** 3.89*** Notes: This table shows elasticity estimates. That is the table shows the percentage increase in local employment from a 10 percent increase in maquiladora production for each U.S. Border Cities. *** indicates significant at 1% level; ** indicates significant at 5% level; and * indicates significant at the 10% level.

29
TABLE 9. Employment estimation results for U.S. border cities under a 2001 structural break
OLS IV Before China in
WTO After China in
WTO Before China in
WTO After China in
WTO (1) (2) (3) (4) Alternative wage -0.257 -0.154 -0.249 -0.152 [0.07]*** [0.08]*** [0.06]*** [0.08]*** State personal income 0.529 -0.388 0.514 -0.401 [0.12]*** [0.17]** [0.13]*** [0.08]*** National employment 1.313 0.832 1.290 0.831 [0.07]*** [0.17]*** [0.07]*** [0.18]*** Maquiladora value added in neighboring city
0.110 0.031 0.144 0.085
[0.02]*** [0.04] [0.03]*** [0.17] Maquiladora value added in other border cities
0.757 -0.493 0.856 -0.177
[0.14]*** [0.3] [0.17]*** [0.49] Hausman specification 144.56 12.95 test statistic (p value) [0.00] [0.02] Adjusted R2 0.995 0.996 0.995 0.996 Observations 2607 1631 2489 1631 Notes: Columns (1) and (2) report ordinary least squares results for a regression of the industry-employment in U.S. border cities. Columns (3) and (4) report instrumental variable results for a regression of the industry-employment in U.S. border cities. Regressors include a constant term, alternative wage, state personal income, national employment, maquiladora output in neighboring city, time fixed effect and city-industry fixed effect. All regressions include maquiladora output in other border cities to account for the possibility that overall maquiladora activity along the border is influenced by a common cause. For the IV regressions, we use U.S. offshore assembly imports excluding assembly imports from Mexico as the instrument for maquiladora output in neighboring border city. Columns (1) and (3) report regression results with data from 1990:Q1 through 2000:Q3 while columns (2) and (4) report regression results with data from 2000:Q4 through 2006:Q4. Standard errors are in parenthesis. *** indicates significant at 1% level; ** indicates significant at 5% level; and * indicates significant at the 10% level.

30
TABLE 10. Employment regressions for U.S. border cities with industry-varying coefficients and a 2001 structural break
Estimation method
OLS LEVELS IV LEVELS
Before China in WTO
After China in WTO
Before China in WTO
After China in WTO
(1) (2) (3) (4)
Alternative wage 0.01 -0.155 0.075 -0.184
[0.07] [0.08]*** [0.07] [0.09]**
State personal income 0.5 -0.392 0.469 -0.399
[0.11]*** [0.17]*** [0.12]*** [0.18]**
National employment 1.002 0.847 0.920 0.847
[0.09]*** [0.17]*** [0.1]*** [0.17]*** Maquiladora value added in other border cities
0.68 -0.449 0.778 -0.103 [0.14]*** [0.28] [0.17]*** [0.47]**
Maquiladora value added construction dummy
0.089 -0.145 0.158 -0.101 [0.03]** [0.05]*** [0.04]*** [0.09]
Maquiladora value added manufacturing dummy
0.063 -0.111 0.076 -0.162 [0.03]** [0.14]*** [0.04***] [0.22]***
Maquiladora value added transport dummy
0.433 0.366 0.489 0.605 [0.03]*** [0.06]*** [0.04]*** [0.1]***
Maquiladora value added wholesale trade dummy
0.039 0.110 0.076 0.235 [0.03] [0.07]*** [0.03]** [0.12]**
Maquiladora value added retail trade dummy
-0.037 0.017 -0.017 0.041 [0.02] [0.04]*** [0.03] [0.06]
Maquiladora value added FIRE dummy
0.073 -0.043 0.084 -0.124 [0.02]** [0.07] [0.03]** [0.11]
Maquiladora value added services dummy
0.092 0.093 0.124 0.230 [0.02]*** [0.06] [0.03]*** [0.1]**
F-Statistic (p value)
41.840 9.890 33.140 9.25 [0.00] [0.00] [0.00] [0.00]
Adjusted R2 0.995 0.996 0.995 0.996 Observations 2607 1631 2489 1631 Notes: Columns (1) and (2) report ordinary least squares results for a regression of the industry-employment in U.S. border cities. Columns (3) and (4) report instrumental variable results for a regression of the industry-employment in U.S. border cities. Regressors include a constant term, alternative wage, state personal income, national employment, maquiladora output in neighboring city, time fixed effect and city-industry fixed effect. All regressions include maquiladora output in other border cities to account for the possibility that overall maquiladora activity along the border is influenced by a common cause. For the IV regressions, we use U.S. offshore assembly imports excluding assembly imports from Mexico as the instrument for maquiladora output in neighboring border city. We include industry-specific explanatory variables to disaggregate the impact by industry. These industry-specific variables are generated by an interaction term of the industry-specific dummy variable times the maquiladora value-added in the neighboring border city. Columns (1) and (3) report regression results with data from 1990:Q1 through 2000:Q3 while columns (2) and (4) report regression results with data from 2000:Q4 through 2006:Q4. Standard errors are in parenthesis. *** indicates significant at 1% level; ** indicates significant at 5% level; and * indicates significant at the 10% level.

31
Figure 1. Growth rates in U.S. border city employment and maquiladora export output
San Diego Tijuana
Calexico-Mexicali
Nogales-Nogales
Douglas-Agua Prieta
El Paso-Ciudad Juarez
Del Rio-Ciudad Acuna
‐0.04‐0.03‐0.02‐0.0100.010.020.030.040.050.060.07
‐0.3
‐0.2
‐0.1
0
0.1
0.2
0.3
0.4
1991
1992
1993
1994
1995
1996
1997
1998
1999
2000
2001
2002
2003
2004
2005
2006
Maquilado
ra Value
Add
ed
U.S. borde
r City Em
ploymen
t
San Diego‐Tijuana
Maquiladora Value Added U.S. Border City Employment
‐0.04
‐0.02
0
0.02
0.04
0.06
0.08
‐0.2
‐0.1
0
0.1
0.2
0.3
0.4
0.5
1991
1992
1993
1994
1995
1996
1997
1998
1999
2000
2001
2002
2003
2004
2005
2006
Maquilado
ra Value
Add
ed
U.S. borde
r City Em
ploymen
t
Calexico‐Mexicali
Maquiladora Value Added U.S. Border City Employment
‐0.06‐0.04‐0.0200.020.040.060.080.10.120.14
‐0.15
‐0.1
‐0.05
0
0.05
0.1
0.15
0.2
0.25
1991
1992
1993
1994
1995
1996
1997
1998
1999
2000
2001
2002
2003
2004
2005
2006
Maquilado
ra Value
Add
ed
U.S. borde
r City Em
ploymen
t
Nogales‐Nogales
Maquiladora Value Added U.S. Border City Employment
‐0.06
‐0.04
‐0.02
0
0.02
0.04
0.06
0.08
‐0.4
‐0.3
‐0.2
‐0.1
0
0.1
0.2
0.3
0.4
1991
1992
1993
1994
1995
1996
1997
1998
1999
2000
2001
2002
2003
2004
2005
2006
Maquilado
ra Value
Add
ed
U.S. borde
r City
Employmen
tDouglas‐Agua Prieta
Maquiladora Value Added U.S. Border City Employment
‐0.03
‐0.02
‐0.01
0
0.01
0.02
0.03
0.04
‐0.3
‐0.2
‐0.1
0
0.1
0.2
0.3
0.4
1991
1992
1993
1994
1995
1996
1997
1998
1999
2000
2001
2002
2003
2004
2005
2006
Maquilado
ra Value
Add
ed
U.S. borde
r City Em
ploymen
t
El Paso‐Ciudad Juarez
Maquiladora Value Added U.S. Border City Employment
0
0.02
0.04
0.06
0.08
0.1
0.12
0.14
0.16
0.18
‐0.4
‐0.3
‐0.2
‐0.1
0
0.1
0.2
0.3
0.4
1991
1992
1993
1994
1995
1996
1997
1998
1999
2000
2001
2002
2003
2004
2005
2006
Maquilado
ra Value
Add
ed
U.S. borde
r City
Employmen
t
Del Rio‐Ciudad Acuna
Maquiladora Value Added U.S. Border City Employment

32
Eagle Pass-Piedras Negras
Laredo-Nuevo Laredo
McAllen-Reynosa
Brownsville-Matamoros
Notes: Charts show nonfarm employment annual growth rates (left-axis) for U.S. border cities and maquiladora value-added annual growth rates (right-axis) for Mexican border cities, for the period 2000-2006. Sources: U.S. Bureau of Labor Statistics and Instituto Nacional de Estadistica Geografia e Informatica.
‐0.1
‐0.05
0
0.05
0.1
0.15
0.2
0.25
‐0.5
‐0.4
‐0.3
‐0.2
‐0.1
0
0.1
0.2
0.3
0.419
91
1992
1993
1994
1995
1996
1997
1998
1999
2000
2001
2002
2003
2004
2005
2006
Maquilado
ra Value
Add
ed
U.S. borde
r City Em
ploymen
t
Eagle Pass‐Piedras Negras
Maquiladora Value Added U.S. Border City Employment
‐0.1
‐0.05
0
0.05
0.1
0.15
‐0.4
‐0.3
‐0.2
‐0.1
0
0.1
0.2
0.3
1991
1992
1993
1994
1995
1996
1997
1998
1999
2000
2001
2002
2003
2004
2005
2006
Maquilado
ra Value
Add
ed
U.S. borde
r City Em
ploymen
t
Laredo‐Nuevo Laredo
Maquiladora Value Added U.S. Border City Employment
0
0.01
0.02
0.03
0.04
0.05
0.06
0.07
0.08
‐0.3
‐0.2
‐0.1
0
0.1
0.2
0.3
0.4
1991
1992
1993
1994
1995
1996
1997
1998
1999
2000
2001
2002
2003
2004
2005
2006
Maquilado
ra Value
Add
ed
U.S. borde
r City Em
ploymen
t
Mc Allen‐Reynosa
Maquiladora Value Added U.S. Border City Employment
‐0.01
0
0.01
0.02
0.03
0.04
0.05
0.06
0.07
‐0.5
‐0.4
‐0.3
‐0.2
‐0.1
0
0.1
0.2
0.3
0.4
1991
1992
1993
1994
1995
1996
1997
1998
1999
2000
2001
2002
2003
2004
2005
2006
Maquilado
ra Value
Add
ed
U.S. borde
r City Em
ploymen
t
Brownsville‐Matamoros
Maquiladora Value Added U.S. Border City Employment

33
Appendix Table. Data description and sources Variable Original Frequency Variable Description Source
City industry employment Monthly Converted to quarterly frequency by averaging the monthly city
industry employment. Bureau of Labor Statistics
City industry wage Annual Ratio of the inflation adjusted annual industry wages divided by the average quarterly industry employment. Then, the ratio is divided by 13 to obtain weekly average industry wage.
Bureau of Economic Analysis
Alternative industry wage Annual
Ratio of the difference in the annual industry wages in the state and the annual industry wage in the border city divided by the same difference using employment. Then, the ratio is divided by 13 to obtain weekly average alternative wage.
Bureau of Economic Analysis
State personal income Quarterly Inflation adjusted total personal income in state, excluding border city. Bureau of Economic Analysis
National employment Monthly National industry employment excluding the state where the border city is located Converted to quarterly frequency by averaging the monthly national industry employment.
Bureau of Labor Statistics
Maquiladora value added in neighboring cities
Monthly Inflation adjusted maquiladora value added in neighboring Mexican border city. Converted to quarterly frequency by averaging the monthly maquiladora output.
Instituto Nacional de Estadistica Geografia e Informatica
Maquiladora value added in other neighboring cities
Monthly
Inflation adjusted maquiladora value added in all Mexican border cities, excluding border cities in the neighboring Mexican border state. Converted to quarterly frequency by averaging the monthly maquiladora output.
Instituto Nacional de Estadistica Geografia e Informatica
U.S. offshore assembly imports Quarterly Inflation adjusted U.S. offshore assembly imports, excluding
assembly imports from Mexico. HTS Code 980200. U.S. International Trade Commission
Sectors included in the analysis are: construction, manufacturing, wholesale trade, retail trade, transportation and warehousing, finance and insurance plus real estate and rental and leasing, and services. Services include information, professional scientific technical services, management of companies and enterprises, administrative and support and waste management, educational services, health care and social assistance, arts entertainment and recreation, accommodation food services, and other services.